
Abstract
We examined to what extent subgroups of students identified with learning disabilities (LDs; N = 630) in the Early Childhood Longitudinal Study, Kindergarten Class of 1998 to 1999 (ECLS-K): 1998 national longitudinal study displayed heterogeneity in longitudinal profiles of reading and mathematics achievement from first to eighth grades. Multivariate growth mixture modeling yielded four classes of combined reading and mathematics trajectories for students with LD. The largest class of students with LD (Class 2, 54.3%) showed mean T-scores for both achievement domains that averaged about 1 SD below the mean, with modest decline over time. Almost a quarter of the sample (Class 1, 22.3%) displayed mean T-scores in both achievement areas near the peer-normed average; these students were mostly White, from higher socioeconomic status (SES) backgrounds, and had experienced earlier identification as having an LD as well as shorter duration of LD service. Classifying heterogeneity in longitudinal trajectories of both achievement areas shows promise to better understand the educational needs of students identified with an LD.
Students with learning disabilities (LDs) are more likely to experience poorer long-term achievement relative to students without disabilities. Longitudinal studies of students with LD report persistent achievement gaps into adolescence and adulthood (e.g., Maughan, 1995), including in recent national longitudinal studies with large samples and improved growth curve modeling over longer time periods for reading and mathematics achievement. For example, Wei et al. (2011, 2012) analyzed the nationally representative Special Education Elementary Longitudinal Study (SEELS; SRI International, 2002), which included reading and math achievement growth data from ages 7 to 17 years among students in all 11 U.S. federal special education categories. Hierarchical linear modeling (HLM) analyses indicated that the growth of students with LD paralleled the growth of students not receiving special education services. However, students with LD continued to show lower achievement, supporting an explanation for the presence of underlying deficits rather than simply developmental lags. In addition, the investigators identified targets for future analyses. Specifically, passage comprehension grew more slowly than letter-word identification within reading skills, calculation grew slower than for applied problems within math skills, and math skills in applied problems may be affected by language and reading skills.
Morgan et al. (2011) found similar results using data for special education students from the national sample of the Early Childhood Longitudinal Study, Kindergarten Class of 1998 to 1999 (ECLS-K: 1998; Tourangeau et al., 2009). Longitudinal growth over four time points from kindergarten to fifth grade in reading and mathematics achievement was modeled among students including those identified with LD in kindergarten using teacher reports. The growth trajectories for students having LD lagged significantly behind in reading and even more so in mathematics across time compared to students not receiving special education services. The investigators found that compared to the kindergarten students without disabilities, students with LD were more likely to be older, male, White, and from families with higher socioeconomic status (SES). More recent studies have used the ECLS-K: 1998 data through eighth grade and have separately investgated reading and mathematics achievement in students identified as LDs at any time point by teacher report of student classification (Kohli et al., 2015; Sullivan et al., 2017). Significant gaps in growth for both achievement domains were observed over time between students with LD relative to students without disabilities. The results from studies analyzing the ECLS-K data further support a conclusion that underachievement in students with LD is better explained by deficits rather by developmental lags.
Subsequent to these studies using growth modeling of broad achievement in reading and in math, researchers are now asking if different trajectory classes may exist for reading and mathematics growth within the achievement trajectories of students with disabilities that could further inform intervention efforts (e.g., DuPaul et al., 2016). Such knowledge could assist efforts to identify students having LD who are especially likely to struggle over time as well as inform basic questions regarding domain-general achievement growth. For example, do changes in reading and mathematics achievement show positive, negative, or no growth over time, in one or both areas of achievement? Such knowledge coupled with history of specific LD services would help educators to understand what programming is and is not working, and for which students with LD early intervention may be most needed. Knowledge of different characteristics between classes could enhance initial evaluation and treatment planning.
To date, however, few studies have examined heterogeneity within the achievement trajectories of students with disabilities. DuPaul et al. (2016) used multivariate growth mixture modeling (GMM) to identify different longitudinal trajectories over four time points from kindergarten to fifth grade in reading and mathematics achievement separately among 590 students with attention-deficit/hyperactivity disorder (ADHD) participating in the ECLS-K:1998. Trajectory classes (4 for reading and 8 for math) were identified that ranged from 1 SD above the mean to 2 SD below the mean in both achievement domains. Thus, in the longitudinal sample of students with ADHD, different trajectory classes were observed for each area of achievement. This suggests the need for different remediation interventions, including combined treatment when multiple impairments in domain-general achievement are occurring.
Researchers have also become interested in the possibility that some students have comorbid LDs. Moll et al. (2019) recently reviewed that the prevalence of comorbid LDs is noteworthy. These prevalence estimates ranged from 30% to 70% depending on how LD is defined. Neuropsychological deficits also appear to significantly differ among students with combined reading and mathematics LD compared to students with reading LD only or mathematics LD only. In a large twin study that compared children with reading LD only, mathematics LD only, and combined reading and mathematics LD, Willcutt et al. (2013) found that students with only reading LD are characterized by deficits in phoneme awareness and naming speed, students with only mathematics LD by a deficit in set shifting, and students with both reading and mathematics LDs by shared weaknesses in working memory, processing speed, and verbal comprehension. Such findings imply that children with different presentations of LDs may require different interventions (Fuchs et al., 2012; Willcutt et al., 2013). Thus, Moll et al. (2019) have stressed the subsequent need for research beyond single LD categories, for example, for differing profiles of domain-general (e.g., processing speed) and domain-specific (phoneme awareness) deficits that may be associated with different combinations of LDs.
Thus, much like the need noted above for research into different trajectory classes that may exist for reading or mathematics growth in students with LD, research is also required into potential different trajectory classes for combined reading and mathematics growth. Analyses by DuPaul et al. (2016) indicated that (a) 78% of students with ADHD experiencing the lowest level of reading also experienced the lowest levels of mathematics functioning and (b) 100% of students with ADHD experiencing the lowest level of mathematics functioning also experienced the lowest reading functioning. The majority of students with ADHD experienced medium functioning in each subject (65%) were also members of the same level of functioning in the other subject. Students who experienced the highest level of functioning in either reading or mathematics were almost always experiencing the highest level of functioning in the other subject (90%). The Spearman rho rank-order correlations between reading and mathematics conditional on the other were .80 and .82. Thus, comorbidity at similar levels of achievement appeared common. DuPaul and his colleagues suggested that children with ADHD who were the most seriously impaired (i.e., at the lowest level of functioning) in reading and mathematics early in school would likely benefit from interventions targeting both academic domains.
Currently, however, to what extent students having LD also display heterogeneity in combined or comorbid reading and math achievement is unknown. Therefore, the purpose of the current study was to extend past research with ECLS-K: 1998 data on longitudinal achievement trajectories by examining heterogeneity in latent joint trajectories of reading and mathematics achievement from first through eighth grades in students classified LD. We conducted GMM of reading and mathematics achievement to estimate combined latent trajectory classes of students with LD to determine the extent to which comorbidity and accompanying levels of underachievement may be present over time. Like prior research (e.g., DuPaul et al., 2016; Morgan et al., 2011), we also investigated the kindergarten characteristics that were available in the ECLS-K: 1998 database (i.e., sociodemographic characteristics and variables related to behavioral functioning and LD services) which might begin to differentiate among the students with LD in each of the combined trajectory classes. By identifying longitudinal comorbid presentations and any associated factors, our study should help inform school-based screening and interventions for students with LD who are especially likely to struggle academically in school.
Method
Sample
We analyzed data from students having LD who were participating in the ECLS-K: 1998, a nationally representative, longitudinal study of U.S. children, parents, teachers, and school administrators. Data were collected in both fall (1998) and spring of kindergarten (1999), the spring of first grade (2000), spring of third grade (2002), spring of fifth grade (2004), and spring of eighth grade (2007). During each grade, special education teachers completed questionnaires on students who had Individualized Education Programs (IEP) on file with their school. We defined our LD sample as those students who had been primarily classified as LD (according to criteria used by their school district as indicated by their special education teacher) at any time beginning in first grade (n = 630). About half of these students were identified as LD at only one time point (50.2%), 34.8% at two time points, 13.0% at three time points, and 2.0% at four time points. Almost two-thirds of the LD sample was initially identified as LD after third grade (8.4% were first identified with LD in first grade, 25.7% in third grade, 40.9% in fifth grade, and 25.0% in eighth grade). Table 1 displays descriptive characteristics of this sample, including socioeconomics, behavior, and achievement, compared with a sample of students who had never received an IEP at any time point (Never IEP; n = 3,630). We obtained approval for this study from a university institutional review board.
Descriptive Information for the Analytic Sample of Students Who Ever Received LD Services (n = 630) Relative to Their Peers Who Never Received Special Education (n = 3,630).
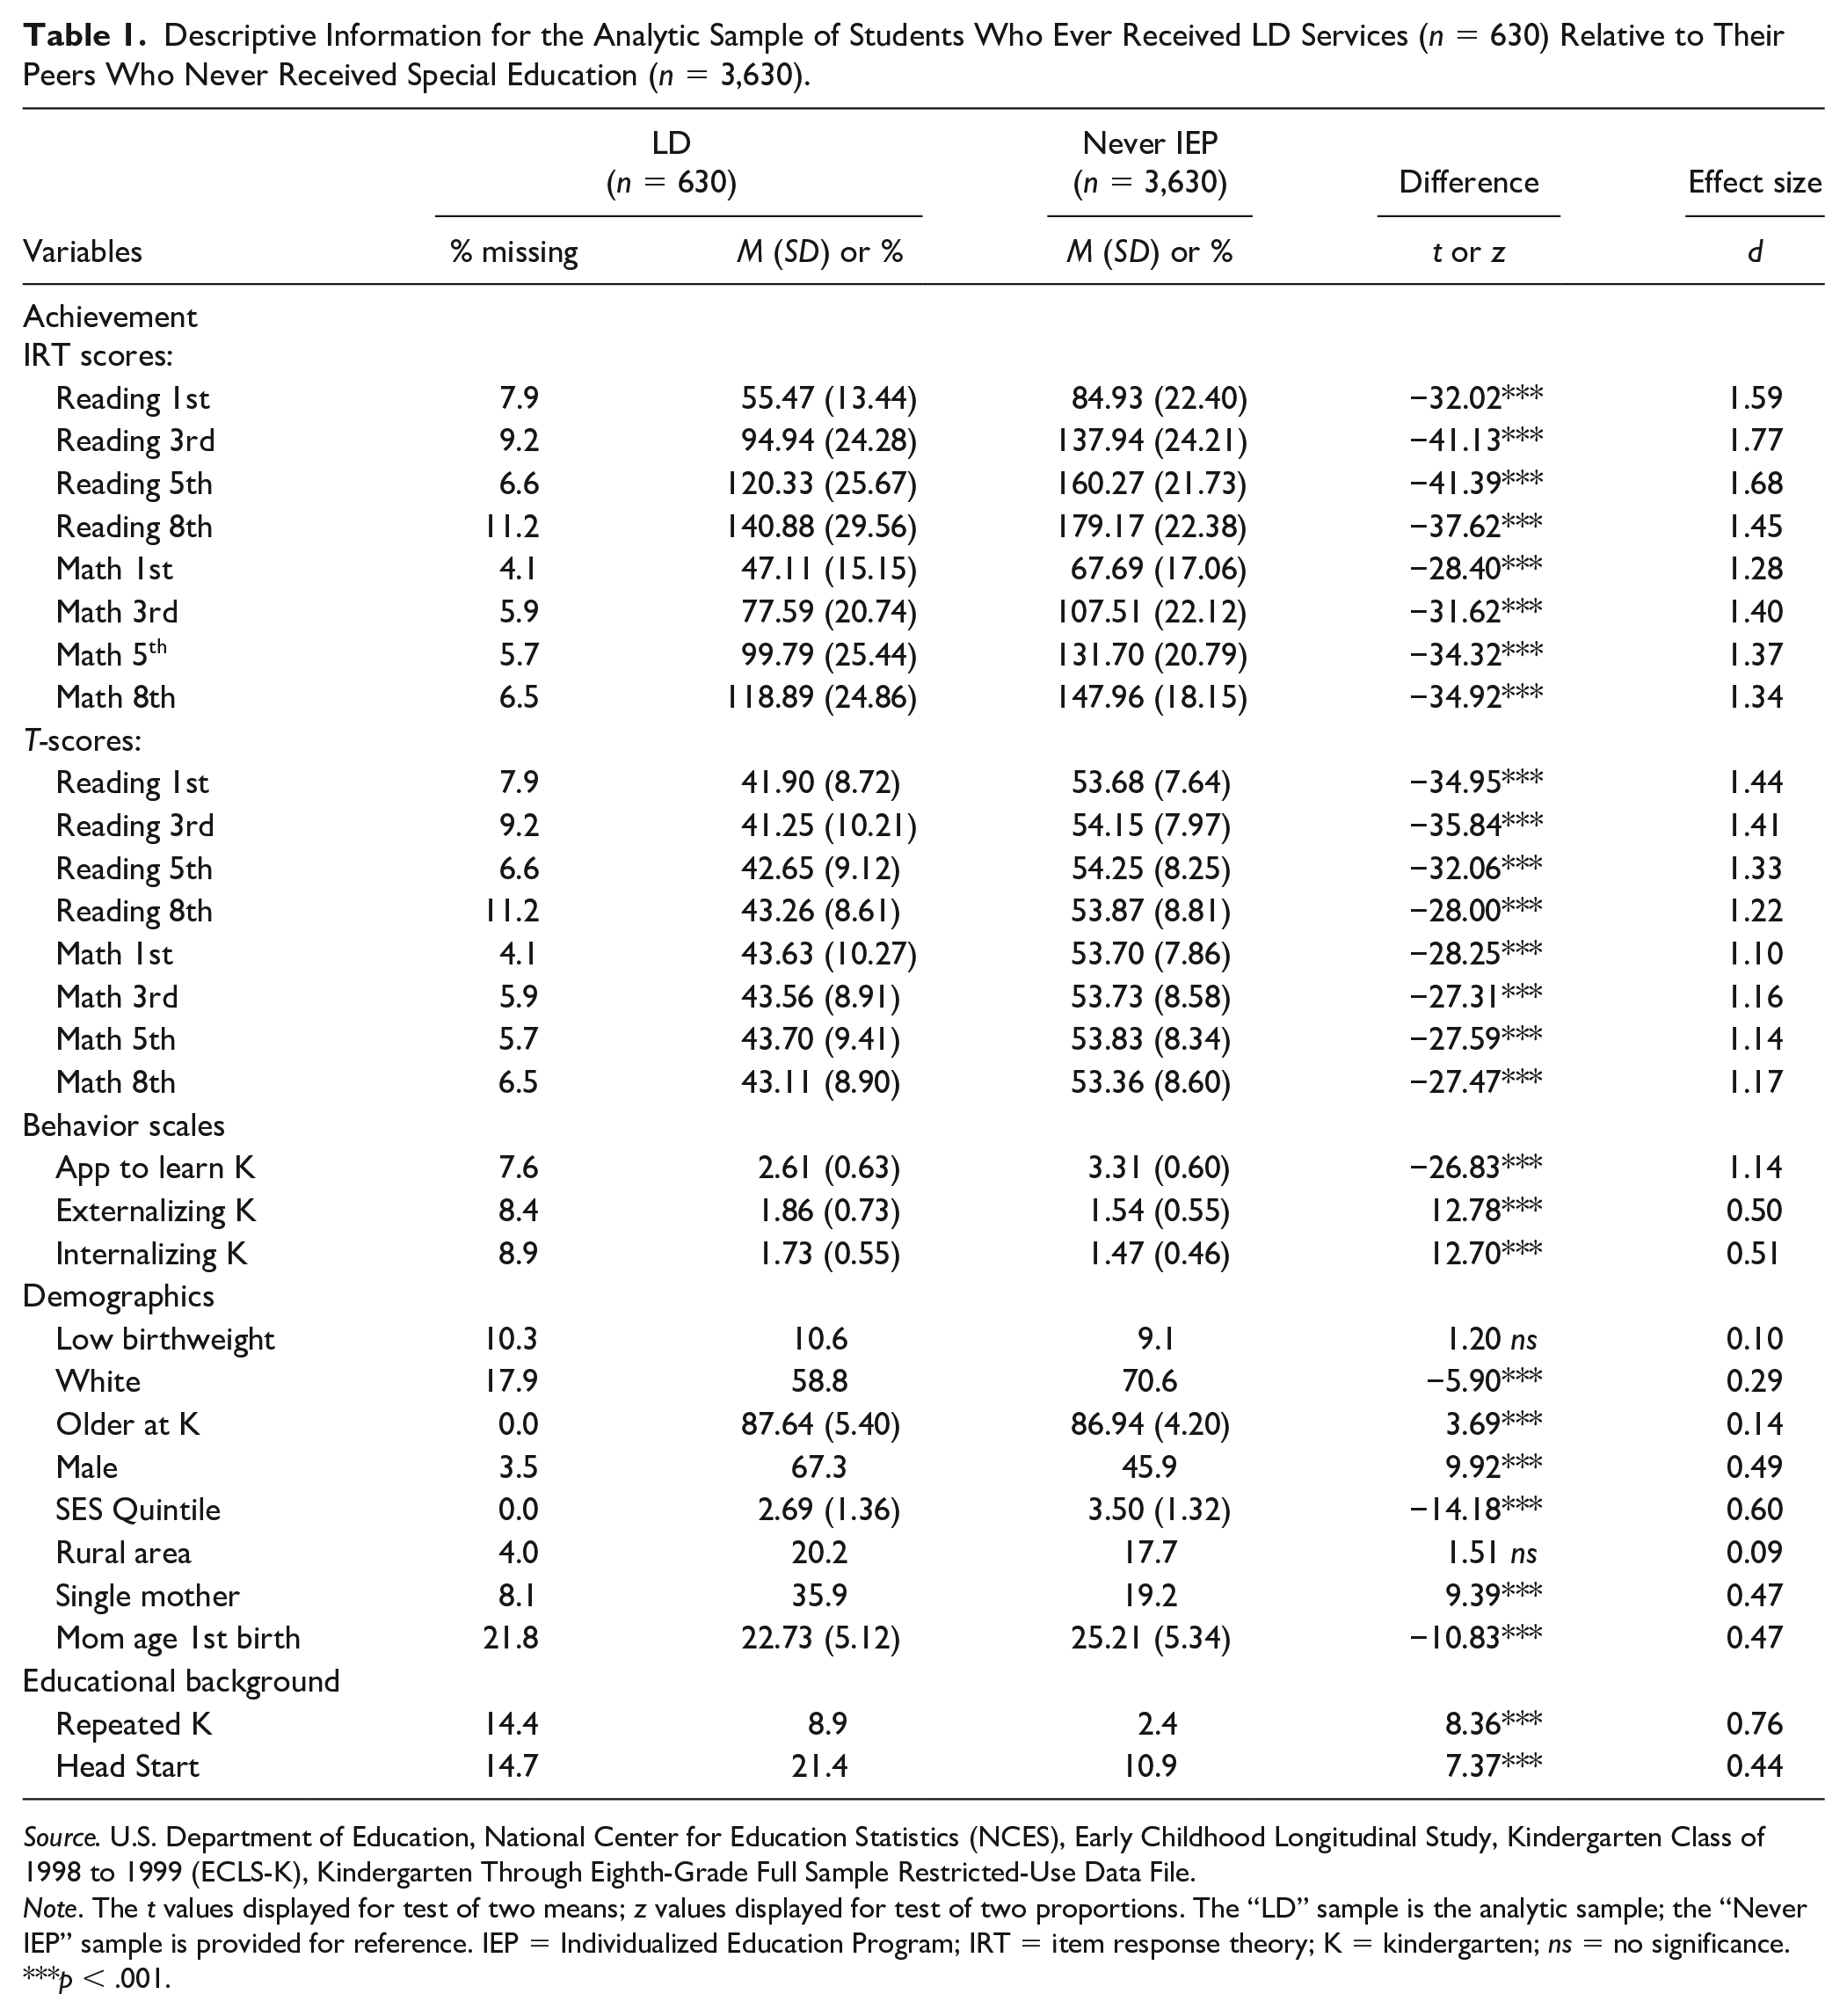
Source. U.S. Department of Education, National Center for Education Statistics (NCES), Early Childhood Longitudinal Study, Kindergarten Class of 1998 to 1999 (ECLS-K), Kindergarten Through Eighth-Grade Full Sample Restricted-Use Data File.
Note. The t values displayed for test of two means; z values displayed for test of two proportions. The “LD” sample is the analytic sample; the “Never IEP” sample is provided for reference. IEP = Individualized Education Program; IRT = item response theory; K = kindergarten; ns = no significance.
p < .001.
Measures
Sociodemographic characteristics
Sociodemographic data were collected during kindergarten. This information included age, sex, race/ethnicity, rural location, maternal age at first birth, whether the child weighed less than 6 lbs. at birth, participation in Head Start, maternal education, single parent status, and quintile of family SES distribution. Family SES was measured using a multi-item survey of the education and occupation of the student’s mother and/or father (or guardian) and the household income. Due to small sample sizes for race/ethnicity within the LD subgroup, we used a single dummy variable that was coded 1 for non-Hispanic White and 0 for all other race/ethnic groups. Information about whether or not students repeated kindergarten was collected during the first grade.
Reading and mathematics achievement
At each time point, students were individually tested in an untimed format by trained field staff using reading and mathematics assessments developed by the National Center for Educational Statistics (NCES) specifically for the ECLS-K: 1998 (U.S. Department of Education, National Center for Education Statistics, 2002) to estimate their growth over time in reading and mathematics achievement. Item response theory (IRT) and routing procedures were used to achieve maximal coverage of academic content and comparability of scale scores across different grades.
The reading score was a composite measure of basic skills (such as print familiarity, letter recognition, decoding, and sight word recognition), receptive vocabulary, and comprehension (such as using personal background knowledge and making interpretations). The reading test was developed through a multistage expert panel review. Some items were used from published tests, and some items were contributed by educators. Test–retest reliabilities from kindergarten to fifth grade ranged from .91 to .96. Construct validity was shown by high correlations at third (.83) and fifth (.78) grades with an established achievement test. (For more extended description of both the reading and mathematics tests, see Morgan et al., 2011, and Tourangeau et al., 2009.)
The mathematics score was a composite measure of basic operations (such as shape and number recognition, sequencing, adding/subtracting/multiplying/dividing, using rates and measurement, using fractions, and calculating volume and area). The mathematics test was developed similarly to the reading test, including the multistage expert review panel. Associated psychometric testing showed good test–retest reliabilities (.89–.94), and high correlations with an established achievement test (.80 and .84) demonstrated construct validity.
For both reading and mathematics achievement, the ECLS-K: 1998 dataset included IRT estimates appropriate for measuring longitudinal growth as well as standardized T-scores appropriate for comparison to peers. The T-scores were derived by ECLS-K: 1998 study personnel as transformations of the IRT estimates, rescaled to a mean of 50 and standard deviation of 10 (1 SD) using cross-sectional sample weights for each wave of data. We used T-scores in our GMM analysis because the T-scores allow a norm-referenced perspective and facilitate comparisons across groups.
Behavioral functioning
Teachers completed the Social Rating Scale (SRS), which was adapted for the ECLS-K study from the social skills rating system (Gresham & Elliott, 1990). We used the subscales approaches to learning, externalizing problems, and internalizing problems. All items were rated on a 4-point Likert-type scale (1 = never, 2 = sometimes, 3 = often, and 4 = very often). The approaches to learning subscale captured self-regulated behavioral functioning through six items that assessed attentiveness, task persistence, eagerness to learn, learning independence, flexibility, and organization (i.e., items that are important to learning). The externalizing problems subscale consisted of six items assessing the frequency of acting out behaviors, such as arguing, fighting, getting angry, acting impulsively, and disturbing others. The internalizing problems subscale consisted of four items assessing the frequency of the following feelings: anxiety, loneliness, sadness, and self-esteem. Higher scores for approaches to learning indicated greater behavioral self-regulation, and lower scores on the problems subscales indicated fewer externalizing or internalizing problem behaviors. Cronbach’s alphas across all scales ranged from .73 to .89. Although the SRS was gathered through fifth grade, we only focused on kindergarten data for our predictive analyses.
Data Analysis
We first conducted descriptive analyses to compare students in the LD and never IEP groups. We evaluated for group differences using t tests for continuous data or chi squares for dichotomous data (using an alpha of p < .05 with a Scheffé adjustment for post hoc comparisons across LD subgroups). Effect sizes (ESs) are presented as Cohen’s d. We then estimated multivariate GMMs for the joint development of reading and mathematics T-scores using MPlus v. 7.4 (Hix-Small et al., 2004; Liu & Perera, 2020). Figure 1 displays our modeling approach. (Figure S1 in the online supplemental materials displays individual growth curves for reading and mathematics.) We used T-scores in GMM analysis to form reading and mathematics profiles of students with LD from first to eighth grades relative to peers without disabilities. Model fit was determined using Bayesian information criteria (BIC and sample-size adjusted BIC), entropy, and likelihood ratio tests (Vuong–Lo–Mendell–Rubin [VLMR] and Lo–Mendell–Rubin [LMR]), as well as considering the conceptual and clinical utility of obtained solutions (Nagin, 2005). The minimum requirement for a class was that it comprised > 5% of the sample.
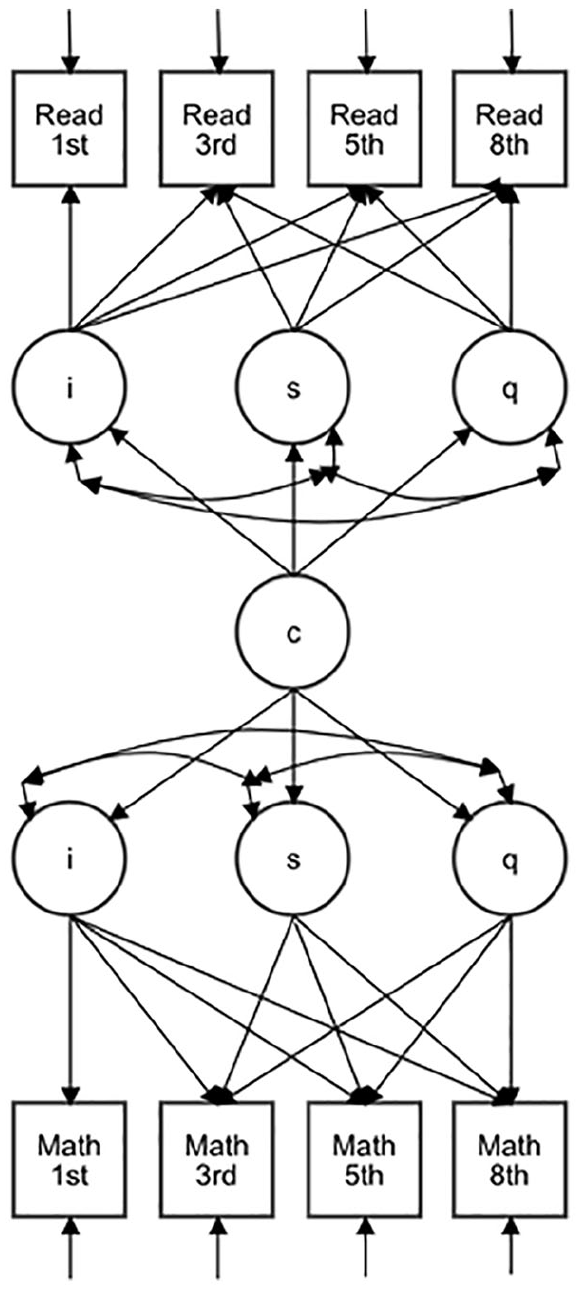
Structural equation model of the multivariate growth mixture model for reading and mathematics achievement from first to eighth grades.
Missing Data
Academic achievement variables were missing between 8% and 11% of observations for reading, and 4% and 7% of observations for math between first and eighth grades (Table 1). Full information maximum likelihood (FIML) was used to account for these missing data. Including covariates that may be related to the mechanism of missingness as auxiliary predictors in FIML procedures can be reasonably assumed to adjust for data that are missing at random (Enders, 2013). Attrition in the ECLS-K: 1998 occurred more often for students who were non-White or who experienced socioeconomic disadvantage. We included as covariates the student’s sex, race/ethnicity, family SES, low birthweight, age, rural locale, grade retention, Head Start participation, maternal age at first birth, marital status, timing of initial special education services, duration of special education services, and kindergarten approaches to learning, externalizing behaviors, and internalizing behaviors scores in both the FIML procedure and in multinomial logistic regression to predict class membership.
Following class assignment in the multivariate GMM, we conducted a multinomial logistic regression to predict class membership using the aforementioned covariates. The FIML procedure in Mplus is unable to adjust for missing data on exogenous covariates used to predict class membership. We therefore multiply imputed 40 datasets in Mplus to address covariate missingness and to allow for the covariates to act as exogenous predictors of achievement classes in the three-step method (Asparouhov & Muthen, 2014). Race or ethnicity, low birthweight, sex, rural locale, grade retention, Head Start participation, and marital status were imputed as categorical variables. Covariates were missing an average of 8% of observations, with a high of 21.8% of observations missing for maternal age at first child’s birth. Variables for race, sex, and timing of first LD services and duration of receiving LD services were missing zero observations. Kindergarten behavioral self-regulation was missing 7.6%, externalizing behavior was missing 8.4%, and internalizing behavior was missing 8.9% of observations. (All analytic code is available in the online supplemental material.)
Results
Descriptive Comparison of LD and Non-Disabled Samples
Comparisons of descriptive characteristics and achievement T-scores showed significant differences between the LD and never IEP groups (Table 1). Parents in the LD sample were significantly less likely to be White, were of lower SES, had a greater share of single mothers, and had mothers who were younger at first birth. Students with LD were significantly more likely to be male, to be older, to have repeated kindergarten, and to have participated in Head Start. They also had lower approaches to learning and higher externalizing and internalizing behavior problems scores in kindergarten.
Table 1 displays achievement growth for both samples of participants from first through eighth grades using both IRT scores and norm-referenced T-scores. The IRT scores showed steadily increasing growth over time for both samples in reading and mathematics. The most accelerated growth appeared to occur between first and third grades in both the LD and never IEP samples and in both achievement domains. The never IEP sample had significantly higher scores at all time points with an effect size (ES) range of 1.28 to 1.77 (Table 1).
In Table 1’s achievement T-score comparisons, the LD sample consistently averaged around 1 SD below the mean of 50 in both reading and mathematics. The never IEP sample averaged slightly above the mean at all time periods. Longitudinally, mean T-scores for the two samples varied little. The LD sample fluctuated between T = 41 and 43 in reading over time and persisted at T = 43 in mathematics. The never IEP sample showed a consistent T = 53 to 54 in both subjects. While the IRT scores showed favorable growth in both samples, the T-scores indicated that both samples were also simultaneously maintaining their initial relative first-grade skill levels when norm-referenced.
To summarize comparison findings between the LD and never IEP samples, the LD sample averaged lower SES and a higher percentage of males, non-White, and single mothers. The LD sample also exhibited fewer learning skills and greater externalizing and internalizing behavior problems. Both groups made progress over time in reading and mathematics, but the LD sample averaged 1 SD below the never IEP sample at all time periods.
Trajectory Classes of Achievement for Students With LD
Growth mixture modeling
We first determined the functional form of the GMM via a baseline growth model (Ram & Grimm, 2009). Because there were four time points available, we evaluated for both linear and quadratic trajectories. A quadratic growth curve model was the best-fitting baseline growth model for both reading and mathematics, with the variance of the slope (s) constrained to zero to avoid a non-positive definite error arising due to a negative variance in the slope (i.e., the variability in the rate of reading and mathematics growth over time was constrained to be homogeneous across children). (Table S1 displays baseline growth curves. Table S2 displays correlations among study variables. Table S3 displays sample sizes for the non-White racial and ethnic groups. We combined these groups into one non-White referent group to preserve predictive power. All three tables are in the online supplemental materials.)
We then determined the optimal number of trajectory classes. As more classes were added to the models, BIC goodness of fit values became smaller and entropy increased, indicating improvement in model fit (Table 2). The VLMR and LMR-adjusted p-values indicated whether each model was significantly improved over a similar model with one fewer class. A four-class quadratic model was the best solution of well-fitting models with reasonable clinical interpretations and with more than 5% of the sample in each class (BIC = 30,812, adjusted-BIC = 30,669, entropy = .69, VLMR p = .047, LMR-adjusted p = .049). The five-, six-, and seven-class solutions had a larger entropy value, but poorer BIC and sample size-adjusted BIC, at least one class size containing less than 5% of the sample (and in some cases, less than 1% of the sample), as well as VLMR and LMR p-values > .05 indicating no statistically significant improvement in model fit over models with one fewer class.
Model Fit Statistics for Parallel Growth Mixture Model Among Students Ever Receiving LD Services.
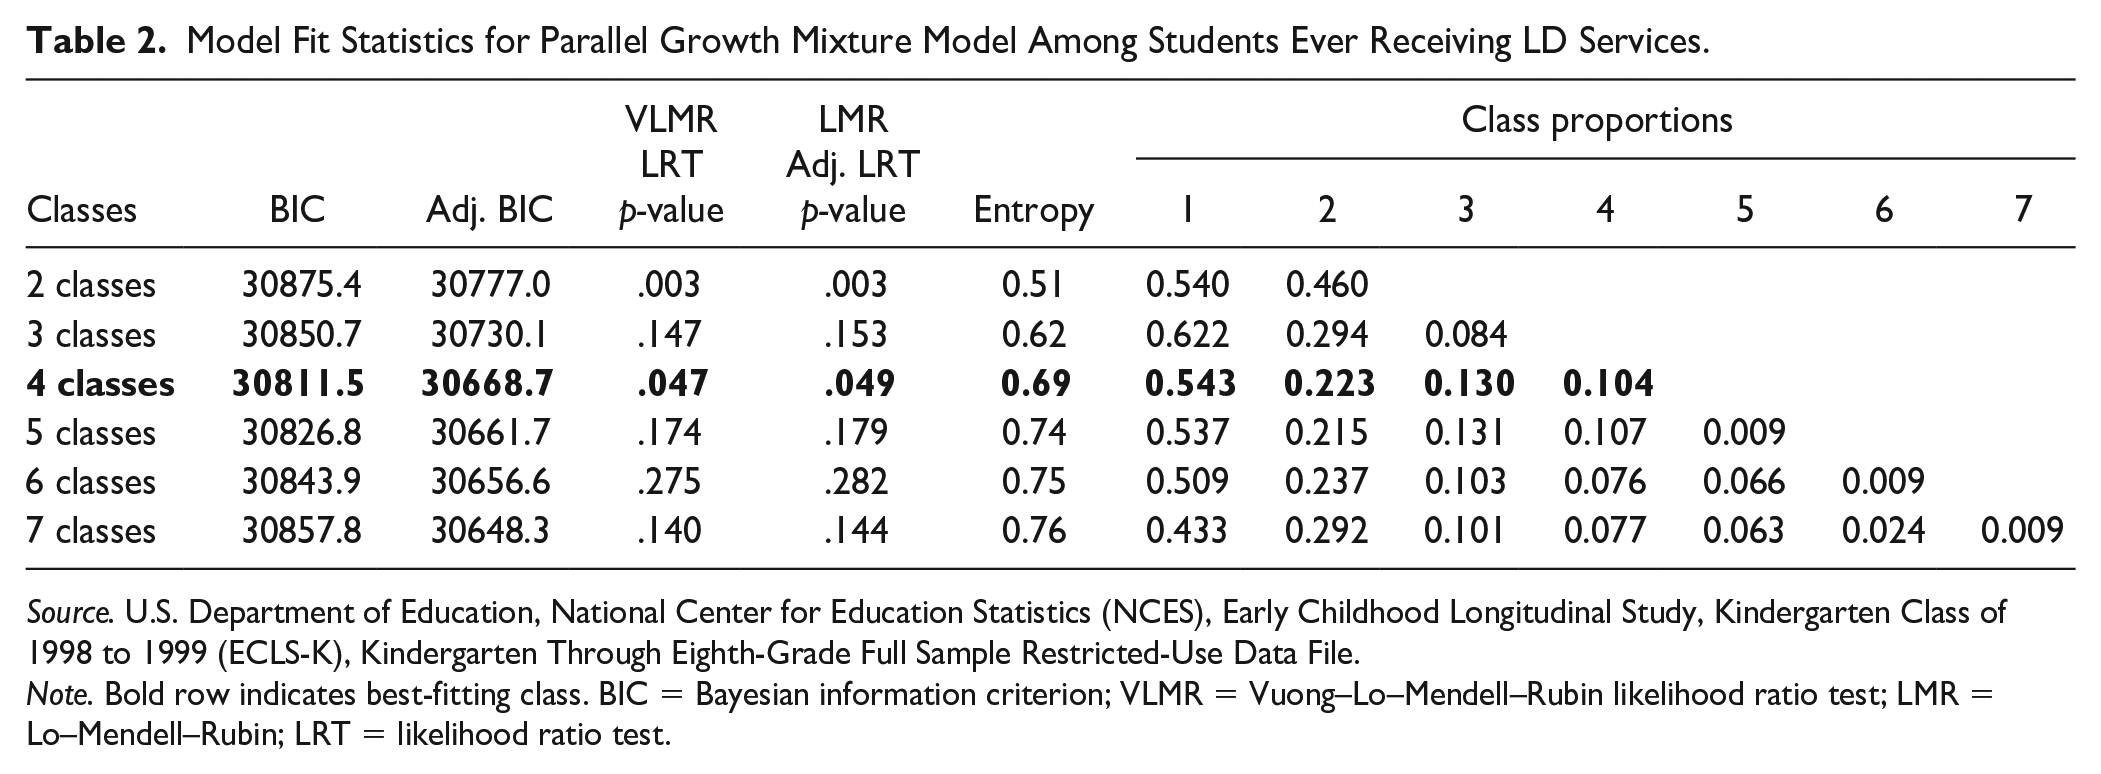
Source. U.S. Department of Education, National Center for Education Statistics (NCES), Early Childhood Longitudinal Study, Kindergarten Class of 1998 to 1999 (ECLS-K), Kindergarten Through Eighth-Grade Full Sample Restricted-Use Data File.
Note. Bold row indicates best-fitting class. BIC = Bayesian information criterion; VLMR = Vuong–Lo–Mendell–Rubin likelihood ratio test; LMR = Lo–Mendell–Rubin; LRT = likelihood ratio test.
Figure 2 displays the four trajectory classes and the longitudinal growth curves for reading and math: Classes 1 (n = 150 or 22.3%), 2 (n = 330 or 54.3%), 3 (n = 70 or 10.4%), and 4 (n = 90 or 13.0%). Thus, the large majority of the classes (77.7%, or all but Class 1) appear to have comorbid reading and mathematics disorders at least 1 SD below the mean.
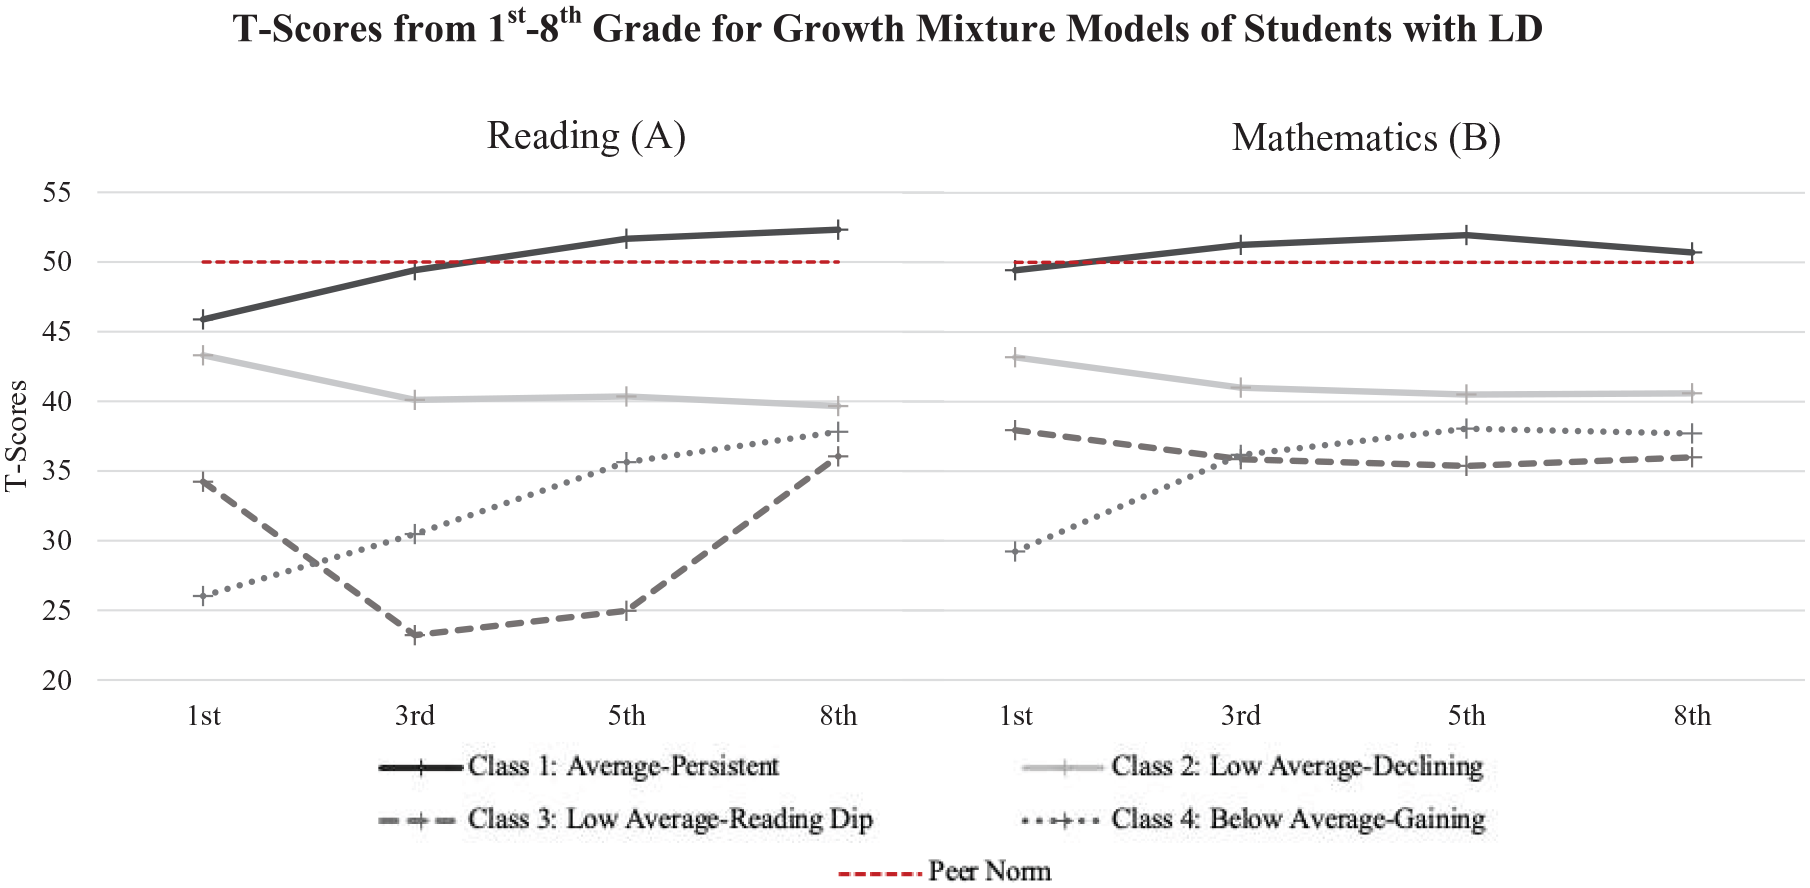
(A) Reading and (B) mathematics parallel growth mixture model results for students ever receiving LD services.
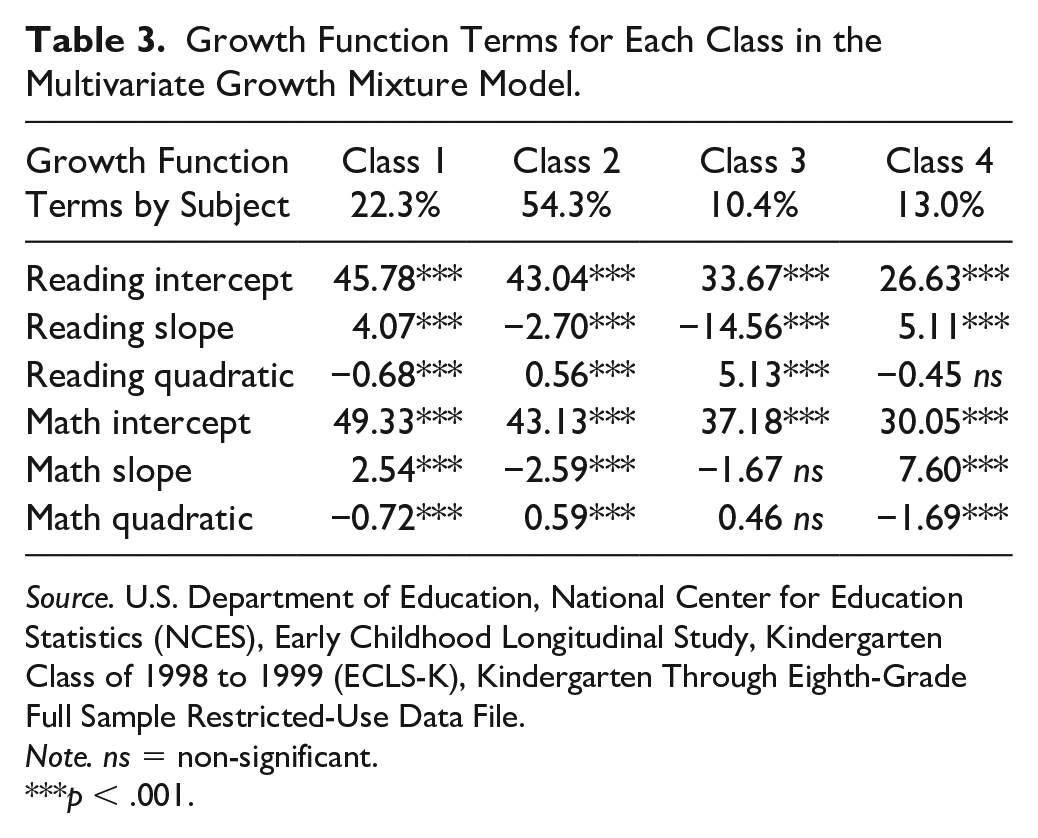
Table 3 presents linear and quadratic growth factors for each class. Table 4 displays mean achievement T-scores. The interclass mean scores are significantly different from each other at all time points. The exception was Classes 3 and 4 in mathematics in third and eighth grades. The average ES across grades for the inter-class comparisons were 1.41 to 3.51 for reading, and 0.37 to 2.06 for mathematics (Table S4 presents their ES).
Growth Function Terms for Each Class in the Multivariate Growth Mixture Model.
Source. U.S. Department of Education, National Center for Education Statistics (NCES), Early Childhood Longitudinal Study, Kindergarten Class of 1998 to 1999 (ECLS-K), Kindergarten Through Eighth-Grade Full Sample Restricted-Use Data File.
Note. ns = non-significant.
p < .001.
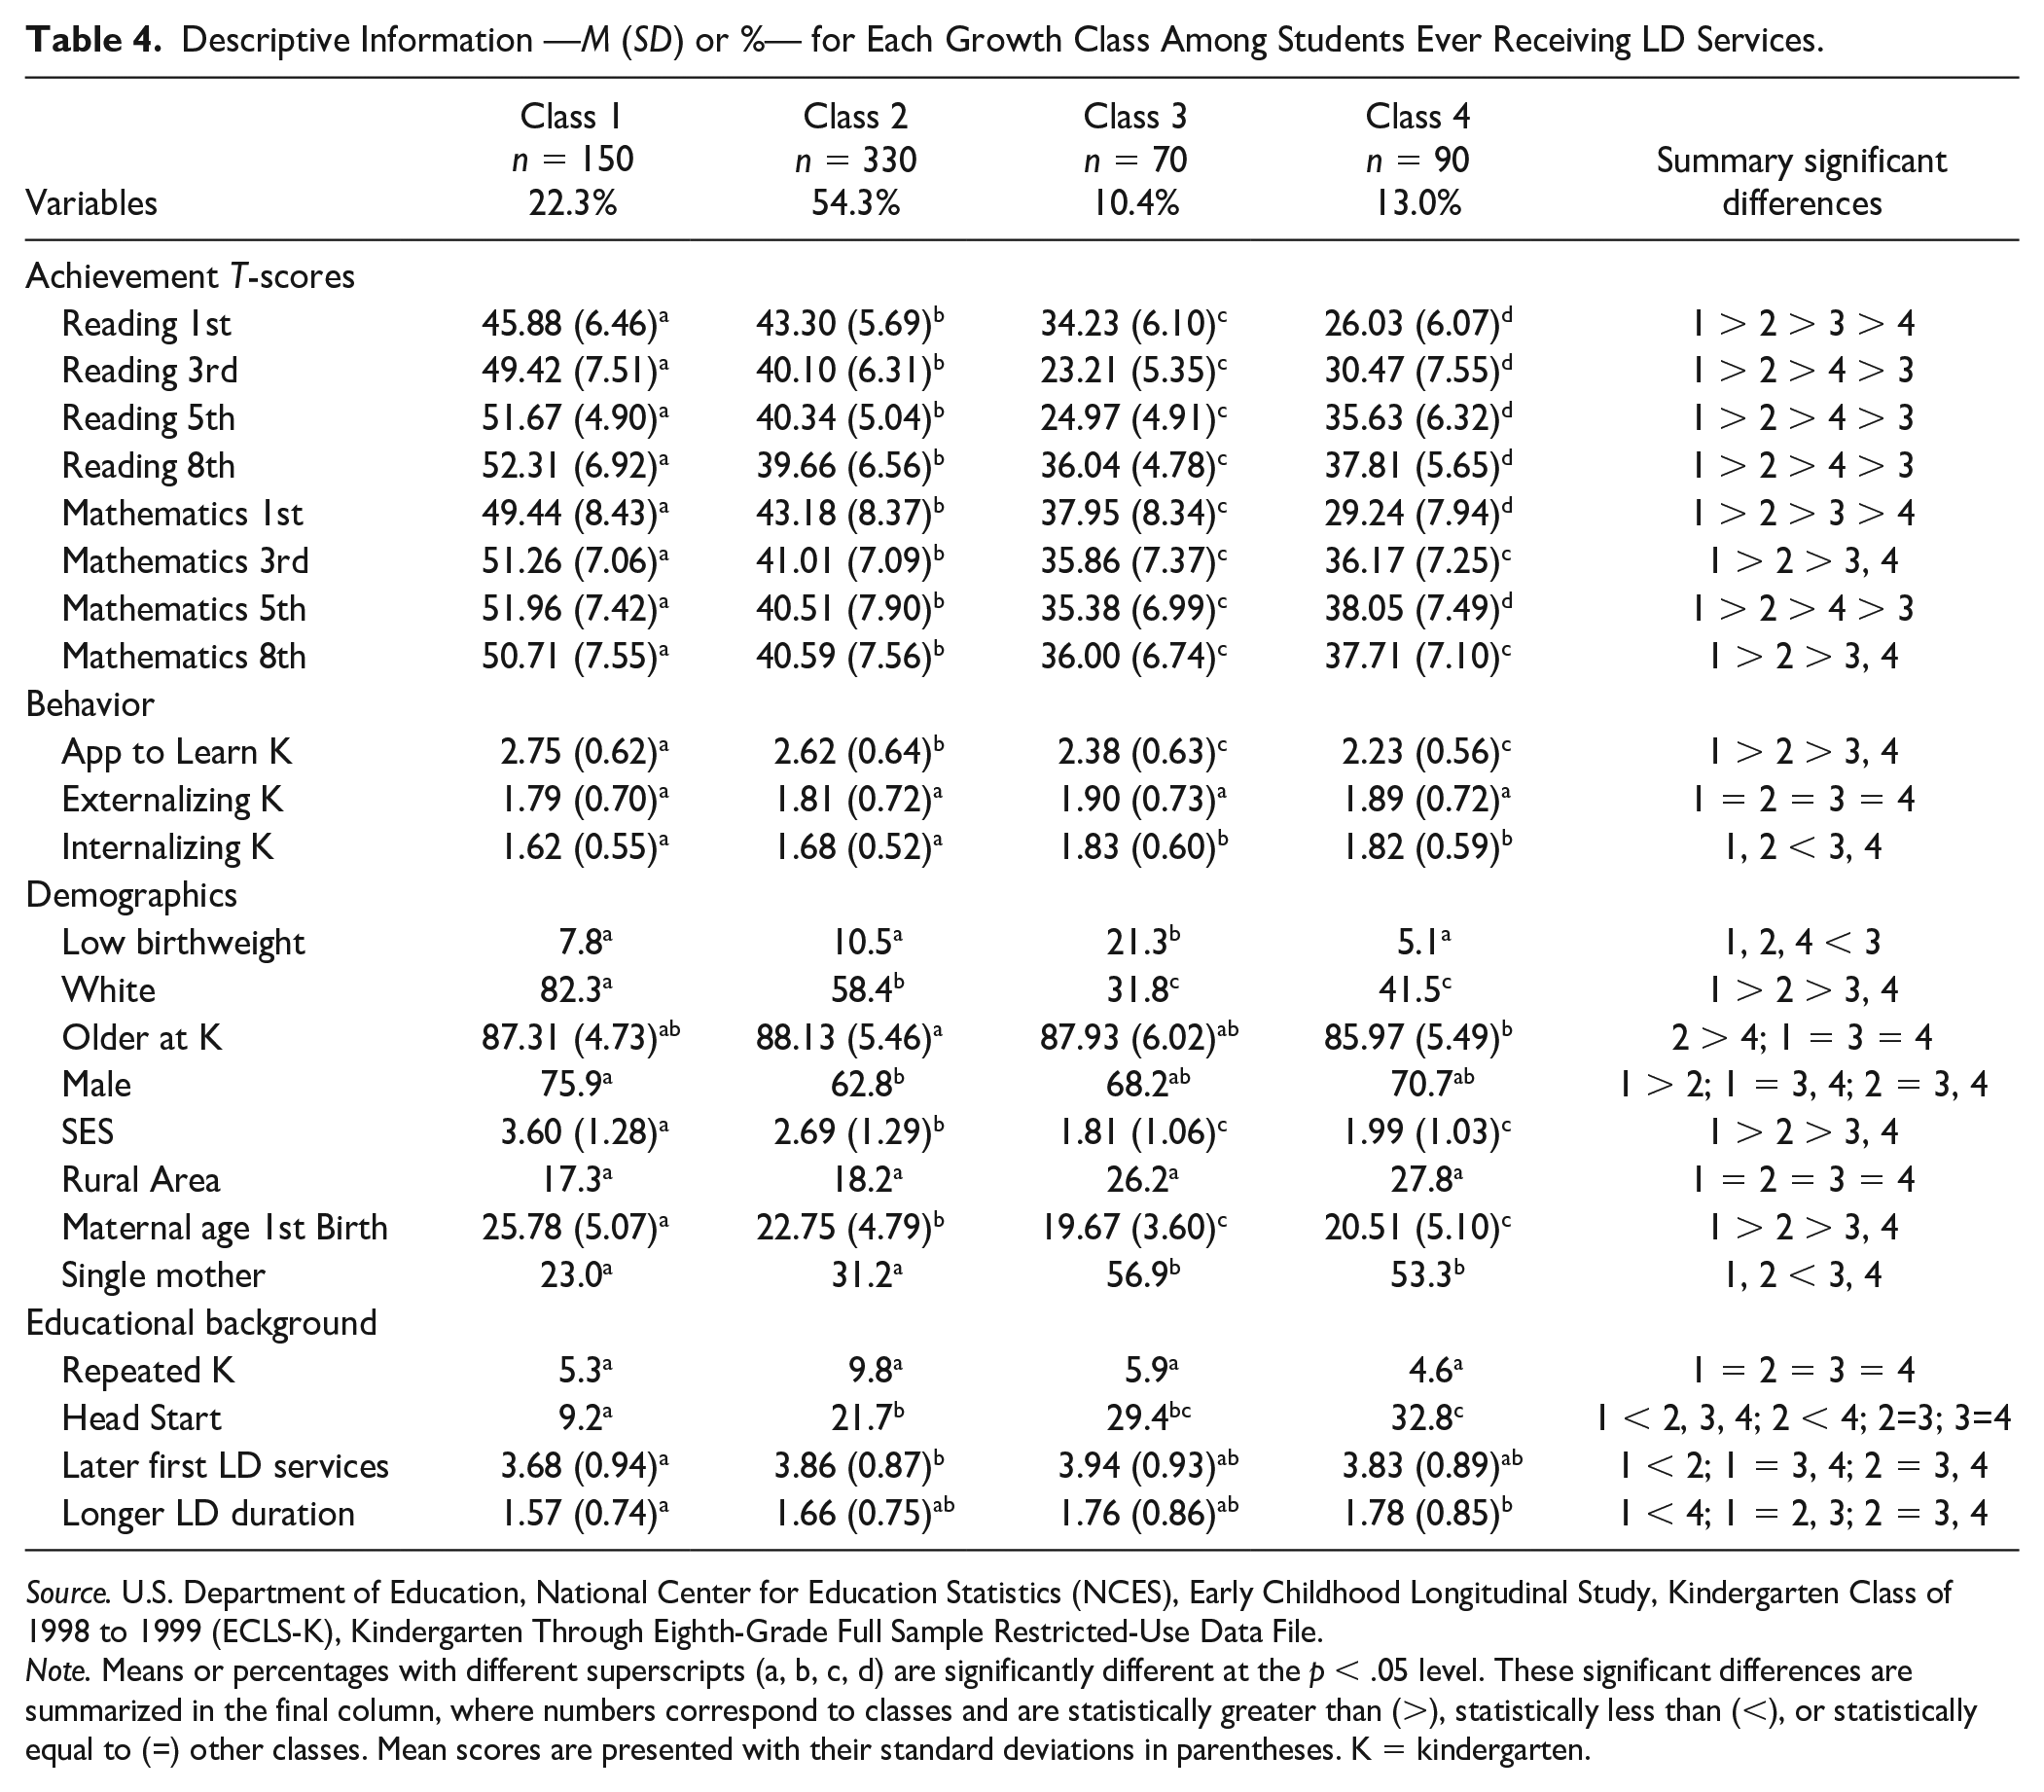
Descriptive Information —M (SD) or %— for Each Growth Class Among Students Ever Receiving LD Services.
Source. U.S. Department of Education, National Center for Education Statistics (NCES), Early Childhood Longitudinal Study, Kindergarten Class of 1998 to 1999 (ECLS-K), Kindergarten Through Eighth-Grade Full Sample Restricted-Use Data File.
Note. Means or percentages with different superscripts (a, b, c, d) are significantly different at the p < .05 level. These significant differences are summarized in the final column, where numbers correspond to classes and are statistically greater than (>), statistically less than (<), or statistically equal to (=) other classes. Mean scores are presented with their standard deviations in parentheses. K = kindergarten.
Class 1 was the second most common group (termed average–persistent). For all grades in mathematics and from third grade on in reading, this class averaged near the peer norm. This group was behind approximately 0.5 SD in reading in first grade, but appeared to catch up by third grade and then maintained near the peer normal level.
More than half of the LD samples were members of Class 2 (low average–declining). In both reading and mathematics, these students began about 0.5 SD below the peer norm and showed a modest downward trajectory, ending about 1 SD below the peer norm.
Class 3 (low average–reading dip) began about 1.5 SD below their peers and experienced the most dramatic decline in reading before recovering by eighth grade. In contrast, their mathematics performance was relatively stable over time at just under 1 SD below the peer norm.
Across first to eighth grades, Class 4 (below average–gaining) showed the most substantial gains of at least 1 SD. Although Class 4 began at the lowest achievement levels of all LD subgroups, they experienced the most improvement in both subjects from first to eighth grades.
Table 4 shows the descriptive differences across classes using the ECLS-K 1998’s available kindergarten variables measuring behavior, sociodemographics, and educational background (ES for inter-class comparisons are available in) Table S4 in the online supplemental materials. In general, the ESs for the non-achievement kindergarten variables were not as strong as for the reading and mathematics scores. Class 1 had significantly higher average SES, higher percentage White, and lower maternal age at birth than the other classes. Class 2 showed similar findings in comparison to Classes 3 and 4, which did not differ between themselves on the same characteristics.
There were few significant behavioral differences from first to eighth grades that distinguished the classes. Students in Class 1 displayed significantly better approaches to learning in kindergarten than other students with LD. In contrast, relative to students in Classes 1 and 2, students in Classes 3 and 4 displayed significantly more internalizing problems. (d = 0.25–0.36). Students in Class 1 also had earlier first special education services and received special education services for a shorter amount of time.
Kindergarten predictors of class membership
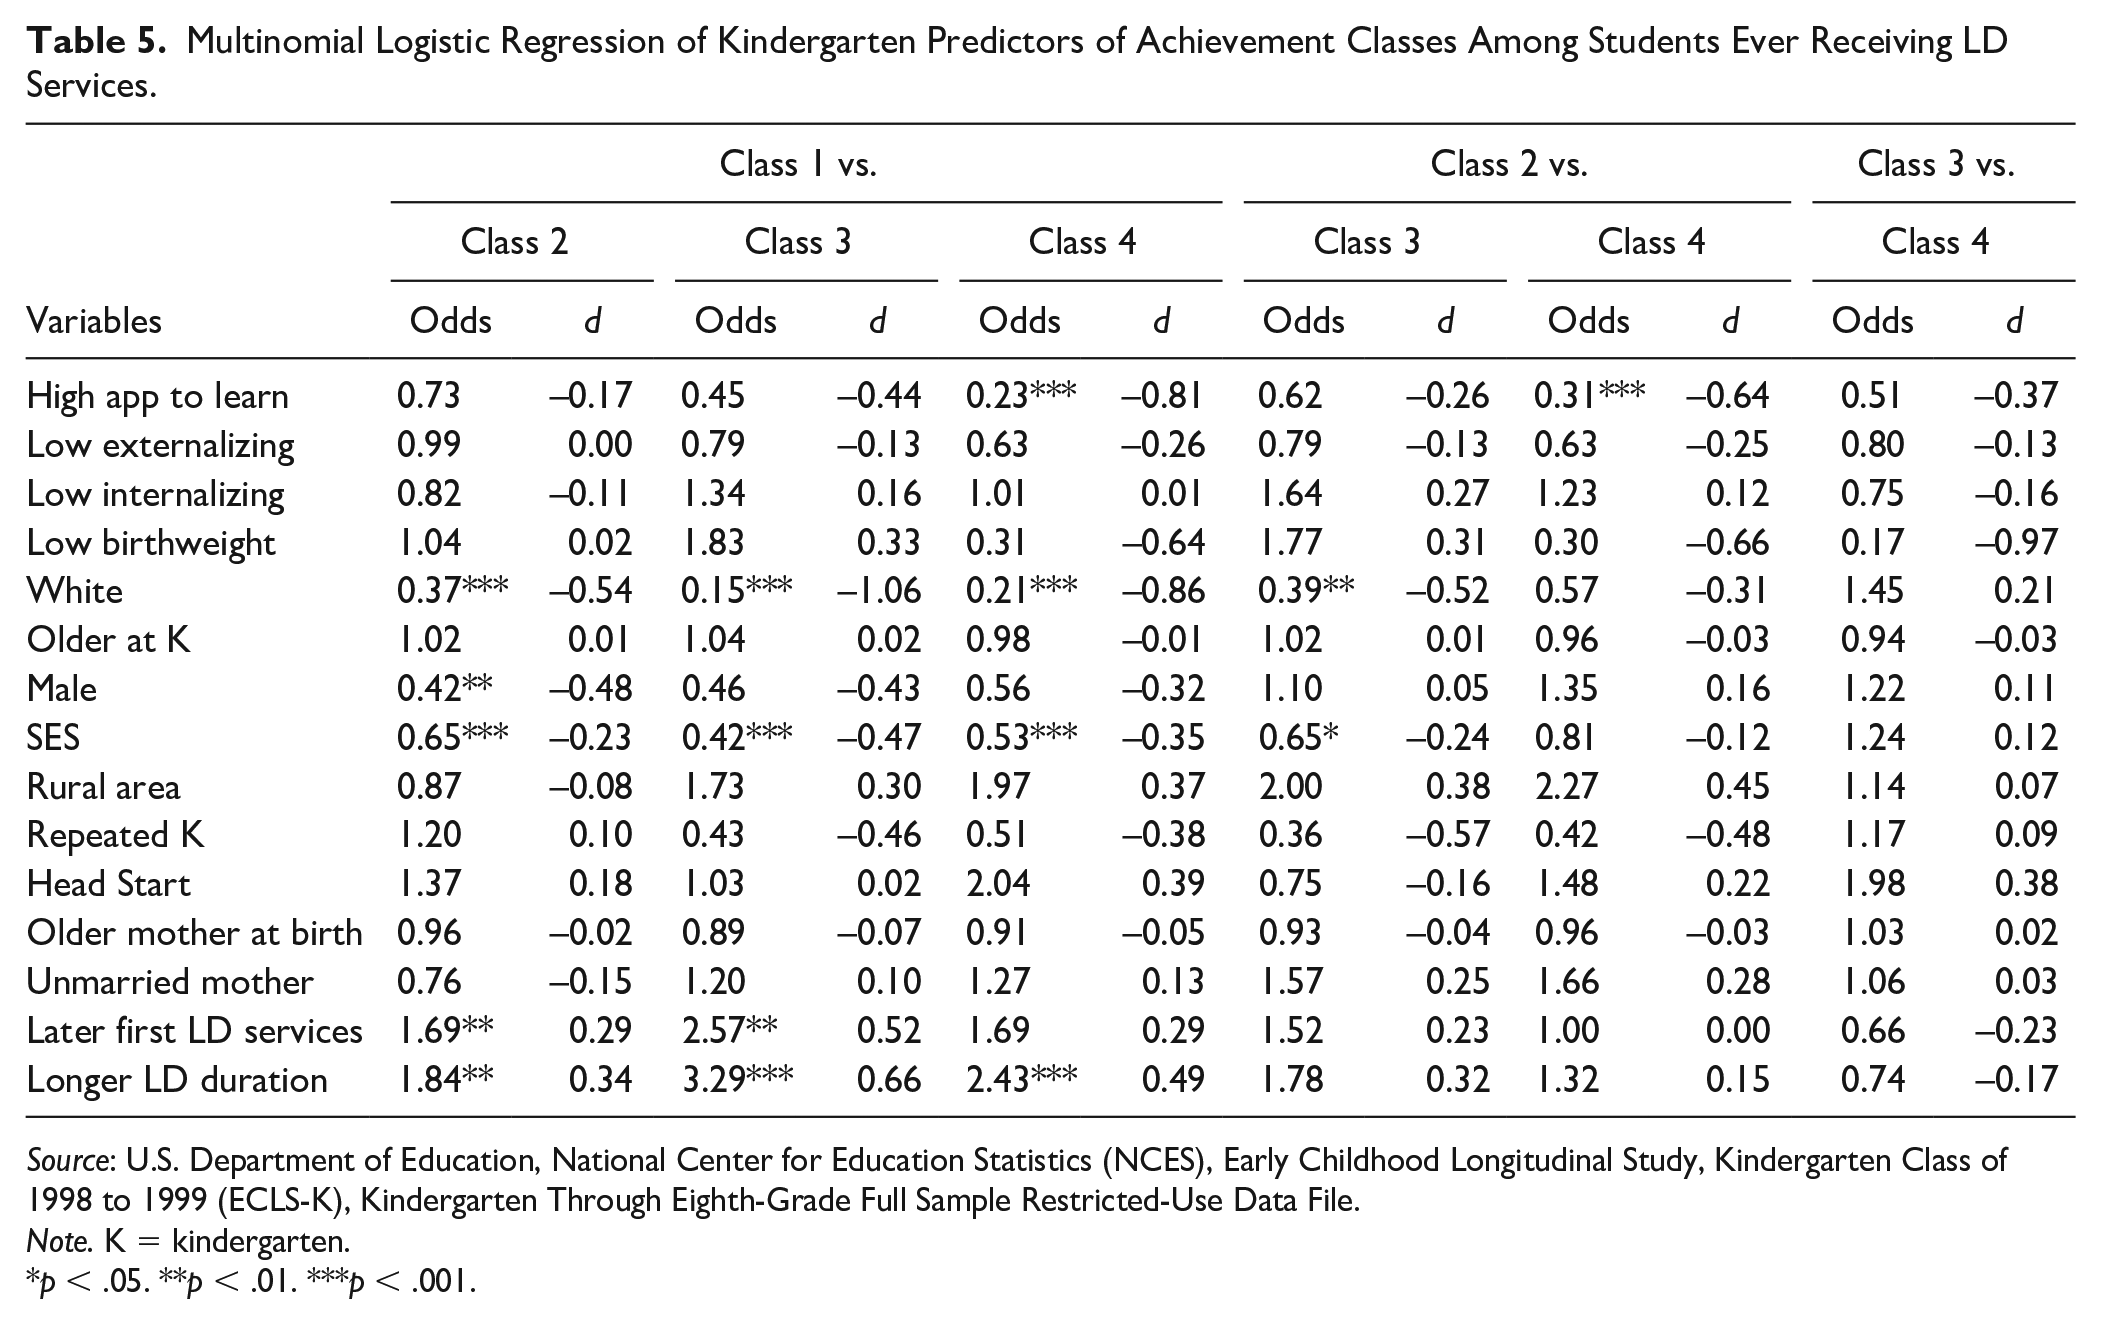
To investigate whether longitudinal profiles of academic performance among students with LD could be predicted in kindergarten, we conducted a multinomial logistic regression with each class as the base and adjusted p values for multiple post hoc comparisons (Table 5). The primary significant differences were found between Class 1 and the other three classes: sociodemographic factors of race and SES appeared to be the strongest kindergarten predictors of class membership, along with timing and duration of LD services. Relative to students with LD in Class 1, students in Classes 2, 3, and 4 were significantly less likely to be White (ES = −0.54 to −1.06) or from higher socioeconomic strata (ES = −0.23 to −0.47). Students in Classes 2 and 3 were significantly more likely than students in Class 1 to have started receiving services for LD later in kindergarten through eighth grades (dClass 2 = 0.29 and dClass 3 = 0.52, respectively), plus students in Classes 2, 3, and 4 were significantly more likely to have received LD services for a longer duration of time (0.34–0.66) relative to students in Class 1. Few other significant differences were found among Classes 2, 3, and 4.
Multinomial Logistic Regression of Kindergarten Predictors of Achievement Classes Among Students Ever Receiving LD Services.
Source: U.S. Department of Education, National Center for Education Statistics (NCES), Early Childhood Longitudinal Study, Kindergarten Class of 1998 to 1999 (ECLS-K), Kindergarten Through Eighth-Grade Full Sample Restricted-Use Data File.
Note. K = kindergarten.
p < .05. **p < .01. ***p < .001.
Discussion
Our study extends prior work on the academic course of students with LDs in several important ways. First, we use a national sample of students with LD to plot growth curves for both reading and mathematics achievement from first to eighth grades, or from childhood into adolescence. We do so for both separate reading and mathematics trajectories as well as for combined academic trajectories. We found that students with LD acquire increasing achievement skills in reading and mathematics (i.e., had greater IRT scores) as they progress through school, although students who never had an IEP displayed significantly higher achievement at each time point. This finding is in agreement with previous longitudinal studies of LD that used this same national sample to investigate reading and mathematics achievement separately (Kohli et al., 2015; Sullivan et al., 2017).
Second, unlike most past longitudinal work on students with LD, we also used standardized T-scores in addition to IRT scores to allow for comparisons with peers without disabilities across grades. Using this norm-based of scoring, we showed that the significant gap in reading and mathematics achievement between students with LD and students who never had an IEP varied little over time. Thus, while students both with and without LD were growing in parallel in their reading and mathematics skills over time according to IRT scores, they also maintained their initial relative levels of norm-referenced achievement that were identified in first grade.
Third, we are the first to investigate for combined longitudinal trajectories for reading and mathematics achievement in students with LD, using parallel GMM to classify subgroups of students with LD based on heterogeneity in their academic trajectories. Prior longitudinal studies of students with LD have examined reading and mathematics trajectories separately or have not examined for heterogeneity within samples of students with LD. Our analyses yielded four classes (which each captured 10%–54% of the LD sample). Three of the classes (over three fourths of the students) showed ongoing mean T-scores at least 1 SD below the peer norm for both reading and mathematics, likely indicating comorbid LDs. The lags for these three classes were apparent in first grade, but most students were not classified as having LD until after third grade. The range of mean T-scores for the three lowest achieving classes was widest in first grade, ranging from 26.0 to 43.3 in reading and from 29.2 to 43.2 in mathematics. However, the range had sharply narrowed by eighth grade from 37.8 to 39.7 in reading and from 37.7 to 40.6 in math.
Synergy With Existing Research
Little literature exists for comparison with our general findings. In the only similar study examining heterogeneity of achievement trajectories within a sample of students with disabilities in the ECLS-K: 1998, DuPaul et al. (2016) investigated 590 children who had ADHD. Their analyses indicated four reading trajectory classes from first to fifth grades for reading, including two classes below the peer-normed mean of 50 (one persisting at approximately 1 SD below the mean and another class with T-scores falling from 37 to 32 over time). They also found eight classes for mathematics, four of which remained below the mean over time and with T-scores ranging from 30 to 45. DuPaul and his colleagues noted that the ADHD classes with the lowest trajectories also contained the most children receiving services for LD.
Our trajectory results also appear generally similar to standardized achievement results found for LD students in the SEELS, a national study that investigated the various federal categories of special education students from elementary school into middle school (Wagner et al., 2005). In the SEELS, students classified as having LD by their school districts were assessed using standardized reading and achievement tests from fourth to seventh grades (Schiller et al., 2008). Two thirds (66%) maintained scores at or below the 20th percentile for reading comprehension and 50% maintained scores at or below the 20th percentile for mathematics calculation. Our findings indicate that approximately 76.5% of students with LD averaged at least 1 SD below the mean (i.e., at the 17th percentile) in both reading and mathematics. Thus, in both the SEELS and the current study, most students with LD showed achievement at least 1 SD lower than typically developing peers.
Finally, large percentages of the three lower-achieving classes would appear to continue to meet the LD classification in both areas of achievement throughout the duration of study despite displaying heterogeneity in their growth trajectories. This finding appears consistent with some studies of reading disorders over time, such that readers generally remain in their respective categories of “typically developing readers” or “readers with a reading disability” over time, either from first to fourth grades (Compton et al., 2008) or from second to eighth grades (Torppa et al., 2015). Torppa and colleagues (2015) also classified their 182 participants scoring at or below the 10th percentile in 2 of 3 reading tasks into four categories of dyslexia, which demonstrated that reading disorders can present with different timing: no dyslexia in either second or eighth grade (69.8%), no dyslexia in second grade but dyslexia in eighth grade (9.9%), dyslexia in second grade but not in eighth grade (8.2%), and dyslexia in both grades (12.1%).
Hypotheses for Novel Findings
Although our classes of combined trajectories for reading and mathematics are novel with limited comparisons in the literature, we offer some observations based on our data in Tables 3 and 4. In addition to their more privileged sociodemographic status, Class 1 (average—persistent) appeared to capture one group of students with LD (almost one-fourth of the participants) who in reading began about 0.5 SD below the peer-normed mean in first grade and rose above the peer norm mean by eighth grade, maintained mathematics scores near the mean throughout, and appeared to benefit from earlier LD identification and subsequent less LD services. Thus, this class could represent a group of students having borderline LD in reading (0.5 SD below the mean) with no comorbid LD in mathematics who respond to early reading services. Their sociodemographic differences could reflect that the schools and families of these students may be more able to advocate for special education services and to remediate a mild learning issue among these children, which could help explain why Class 1 received services earlier and for a briefer duration of time relative to the other classes.
Class 2 (low average–declining) defined the largest class of students (54.3%) whose achievement levels in both reading and mathematics achievement showed some decline over time to approximately one SD below the peer-normed mean. Torppa and colleagues (2015) have termed similar children with reading disorders as “persisters,” and found that they show widespread language and cognitive impairments over time compared to other longitudinal reading subgroups. If such difficulties are present and not addressed through LD services (e.g., with language interventions), this might partly explain why Class 2 did not improve over time. Their academic performance may be adequate early in elementary school but become more compromised over time as more demanding academic skills are expected, such that progress may be hindered even with the addition of LD services (Roberts et al., 2008; Wanzek et al., 2013).
Class 3 (low average–reading dip) showed a sharp drop in reading achievement of over 1 SD from first to third grades, followed by a gradual return to the baseline T-score of approximately 35 by eighth grade, with mathematics persisting near 1.5 SD below the mean throughout. This profile has been termed late-emerging reading disability (Torppa et al, 2015). Catts et al. (2012) have suggested that this type of reading disability does not emerge until fourth grade or after, possibly due to the increasing importance of reading comprehension as well as ongoing language and/or nonverbal cognitive deficits. Such deficits could result in lower achievement as we also found in mathematics, though a causal design would be needed to evaluate this hypothesis. Positively, if LD services that focused on reading were instituted after third grade, the rapid improvement in reading performance suggests that these services may have helped students to improve their reading performance.
Finally, Class 4 (below average–gaining) represented the class with the most achievement gains in both reading and mathematics from first to eighth grades with over 1 SD improvement in both subjects, each beginning in first grade 2 to 2.5 SD below the mean and ending less than 1.5 SD below the mean. Given their gains from their poor achievement beginnings, the nature of their school services over time (LD and otherwise) would be very important to determine. That is, descriptive statistics in the current data only tells us that within this class 4.6% repeated kindergarten, most did not receive LD services until after 3rd grade, and their kindergarten Approaches to Learning Skills were poor. Importantly, this class did not significantly differ from Class 3 on any kindergarten descriptive characteristics. Further research is needed to determine the characteristics that could be used to differentiate these trajectories early in schooling to better target services and supports for these students.
Limitations
This original study will now require replication of our classes of combined trajectories for reading and mathematics achievement in students classified as having LD. Suggestions for future studies will be important to consider. For example, the available baseline variables were limited. The inclusion of other variables measuring underlying cognitive and specific achievement skills to further distinguish the classes (Moll et al., 2016; Willcutt et al., 2013) should prove helpful. Indeed, some longitudinal work in both students with LD and without disabilities has begun to suggest potential contributions of cognitive skills to achievement according to their own differing longitudinal trajectories (Parrila et al., 2005; Wei et al., 2011). Furthermore, an achievement area of growing importance to include that was not examined in the ECLS-K:1998 study is written expression. Disorders in written expression potentially share cognitive deficits with reading disorders, and thereby could help to further target LD interventions.
Our attempts at characterizing LD services were also limited to approximate grade of first identification and number of time points classified LD. Thus, we did not know the specific duration or level of LD services, criteria that were used to define LD, the nature of services that may have preceded classification as LD, the main area(s) of achievement concern, or the specific types of LD programming that were used (National Reading Panel, 2000). Such information might especially help us understand achievement improvement or loss in relation to the LD services that students did or did not receive in their schools.
The ECLS-K: 1998 investigated behavioral functioning with teacher ratings as opposed to less subjective measures like direct observation. While behavioral dysfunction may be secondary to LD, behavioral problems may also be associated with the presence of an accompanying psychiatric disorder that also requires intervention (Willcutt et al., 2013). This would especially be true for neurodevelopmental disorders, such as ADHD, autism spectrum disorder, or language disorder, in which LD is part of the clinical presentation (Butterworth & Kovas, 2013). Using the ECLS-K: 1998, Woods (2020) found that teachers reported more kindergarten behavioral problems among students who would eventually receive special education services later in schooling than among students who were already receiving services in kindergarten. Students in our Class 4, who exhibited the most serious academic disparities in first grade, were also significantly more likely to be rated as having behavioral self-regulation problems by their kindergarten teachers relative to Classes 1 and 2. This suggests that early behavioral evaluations by teachers could be a useful tool to aid clinical diagnoses and special education referral. Teacher checklists that use Diagnostic and Statistical Manual of Mental Disorders (DSM) criteria to identify DSM neurodevelopmental and other diagnoses have been developed (Gadow & Sprafkin, 2002) and could be used in future large studies of LD to screen for such child psychiatric disorders plus information about accompanying mental health services.
Implications
In this longitudinal study of a nationally representative dataset, students classified as having LD lagged significantly behind academically by at least 1 SD on average from first through eighth grades relative to students without disabilities. The initial levels of achievement skills using T-scores changed little over time for students with LD, as was true for students without disabilities. Thus, students with and without LD were generally growing academically from first to eighth grades, but largely maintaining their reading and mathematics achievement levels relative to peers without disabilities over time. Educators should keep these norm-referenced findings in mind to more fully understand and address the varying capabilities of students with LD. For example, to supplement judgments of the effectiveness over time of special education services for a student classified LD, teachers might question whether changes in these students’ raw curriculum-based scores are being positively reflected by steady or improving achievement relative to their peers (i.e., T-scores).
Our results for combined longitudinal trajectory classes for both reading and mathematics show that long-term achievement outcomes for students with LD are more complicated than the general findings for single areas of achievement for samples of students with LD relative to students without disabilities. These findings should contribute to further study of trajectory heterogeneity to attempt to differentiate among these students with LD, for example, specific cognitive deficits (e.g., working memory), deficits in specific academic skills (e.g., phonemic decoding vs. reading comprehension), differing intervention programs, and accompanying emotional or behavioral disorders that may be contributing to heterogeneity in their achievement trajectories. In turn, this may define characteristics that could more effectively inform educational programming for students with LD, including those who are especially likely to struggle academically over time.
Conclusion
This longitudinal study of a nationally representative sample followed from first to eighth grades provided additional empirical evidence that the academic difficulties of students with LD persist despite their growth in skill acquisition. We then identified four classes of combined trajectories for reading and mathematics. These findings should help inform early screening and intervention planning for students with LD who are especially likely to struggle academically over time. However, future research is needed to examine a broader range of factors that could be modified, such as underlying specific cognitive and achievement skills, more refined characteristics of LD services that are effective, and the relationship with accompanying emotional or behavioral disorders.
Supplemental Material
sj-docx-1-ldx-10.1177_00222194221085668 – Supplemental material for Longitudinal Trajectories of Reading and Mathematics Achievement for Students With Learning Disabilities
Supplemental material, sj-docx-1-ldx-10.1177_00222194221085668 for Longitudinal Trajectories of Reading and Mathematics Achievement for Students With Learning Disabilities by Richard E. Mattison, Adrienne D. Woods, Paul L. Morgan, George Farkas and Marianne M. Hillemeier in Journal of Learning Disabilities
Footnotes
Authors’ Note
The authors are grateful to participants in the Early Childhood Longitudinal Study, Kindergarten Class of 1998 to 1999.
Declaration of Conflicting Interests
The author(s) declared no potential conflicts of interest with respect to the research, authorship, and/or publication of this article.
Funding
Funding for this study was provided by a grant from the National Science Foundation (no. 1644355) and the Institute of Education Sciences (no. R324A150126). Infrastructure support was provided by the Penn State Population Research Institute through funding from the National Institute of Child Health and Human Development, National Institutes of Health (R24HD041025-11). No official endorsement should be inferred.
Supplemental Material
Supplementary material for this article is available on the Journal of Learning Disabilities website with the online version of this article.
References
Supplementary Material
Please find the following supplemental material available below.
For Open Access articles published under a Creative Commons License, all supplemental material carries the same license as the article it is associated with.
For non-Open Access articles published, all supplemental material carries a non-exclusive license, and permission requests for re-use of supplemental material or any part of supplemental material shall be sent directly to the copyright owner as specified in the copyright notice associated with the article.