
Abstract
Trade union density increased for three consecutive years in the United Kingdom between 2017 and 2020. This contrasts with a general decline in union membership since 1979. Since union density continued to fall amongst male employees in 2017–2020, the overall increase was entirely attributable to females. This paper explores the factors which explain why there was an increase in overall union density after a period of decline (for males and females) and why union density evolved so differently for males and females. Using decomposition methodologies, we find that the increase in union density in 2017–2020 was not due to a higher propensity to unionise within particular groups or across all employees. Instead, the principal driver of the overall rise in 2017–2020 was an increase in the proportion of employment in certain public sector organisations. The largest contributor to the difference across males and females was increases in the share of employment in more unionised occupations amongst female employees and decreases amongst male employees.
Introduction
Trade union membership amongst employees in the United Kingdom (UK) increased from 6.2 million in 2016 to 6.6 million in 2020 (Figure 1(a)) (Department for Business, Energy and Industrial Strategy, 2021). This contrasts with the general decline in union membership from a peak of 13.2 million in 1979. Trade union density, measured as the share of employees belonging to trade unions, increased in every year between 2017 and 2020 (Figure 1(b)). This represents the most sustained period of growth in union density since the official series began in 1995. The general secretary of the Trades Union Congress explained the overall rise in membership by saying that ‘thousands have turned to unions during the [COVID-19] crisis, to protect jobs, defend their rights and keep their workplaces safe’ (Elliott, 2021). The modest overall increase of 0.4 percentage points conceals large differences between males and females: trade union density increased by 1.6 percentage points for females but fell by 0.8 percentage points amongst males in 2017–2020. This further increased the unionisation gap in favour of females, which first appeared in 2002, such that union density was 7 percentage points higher for females than males and females accounted for 57% of union membership in the UK in 2020.
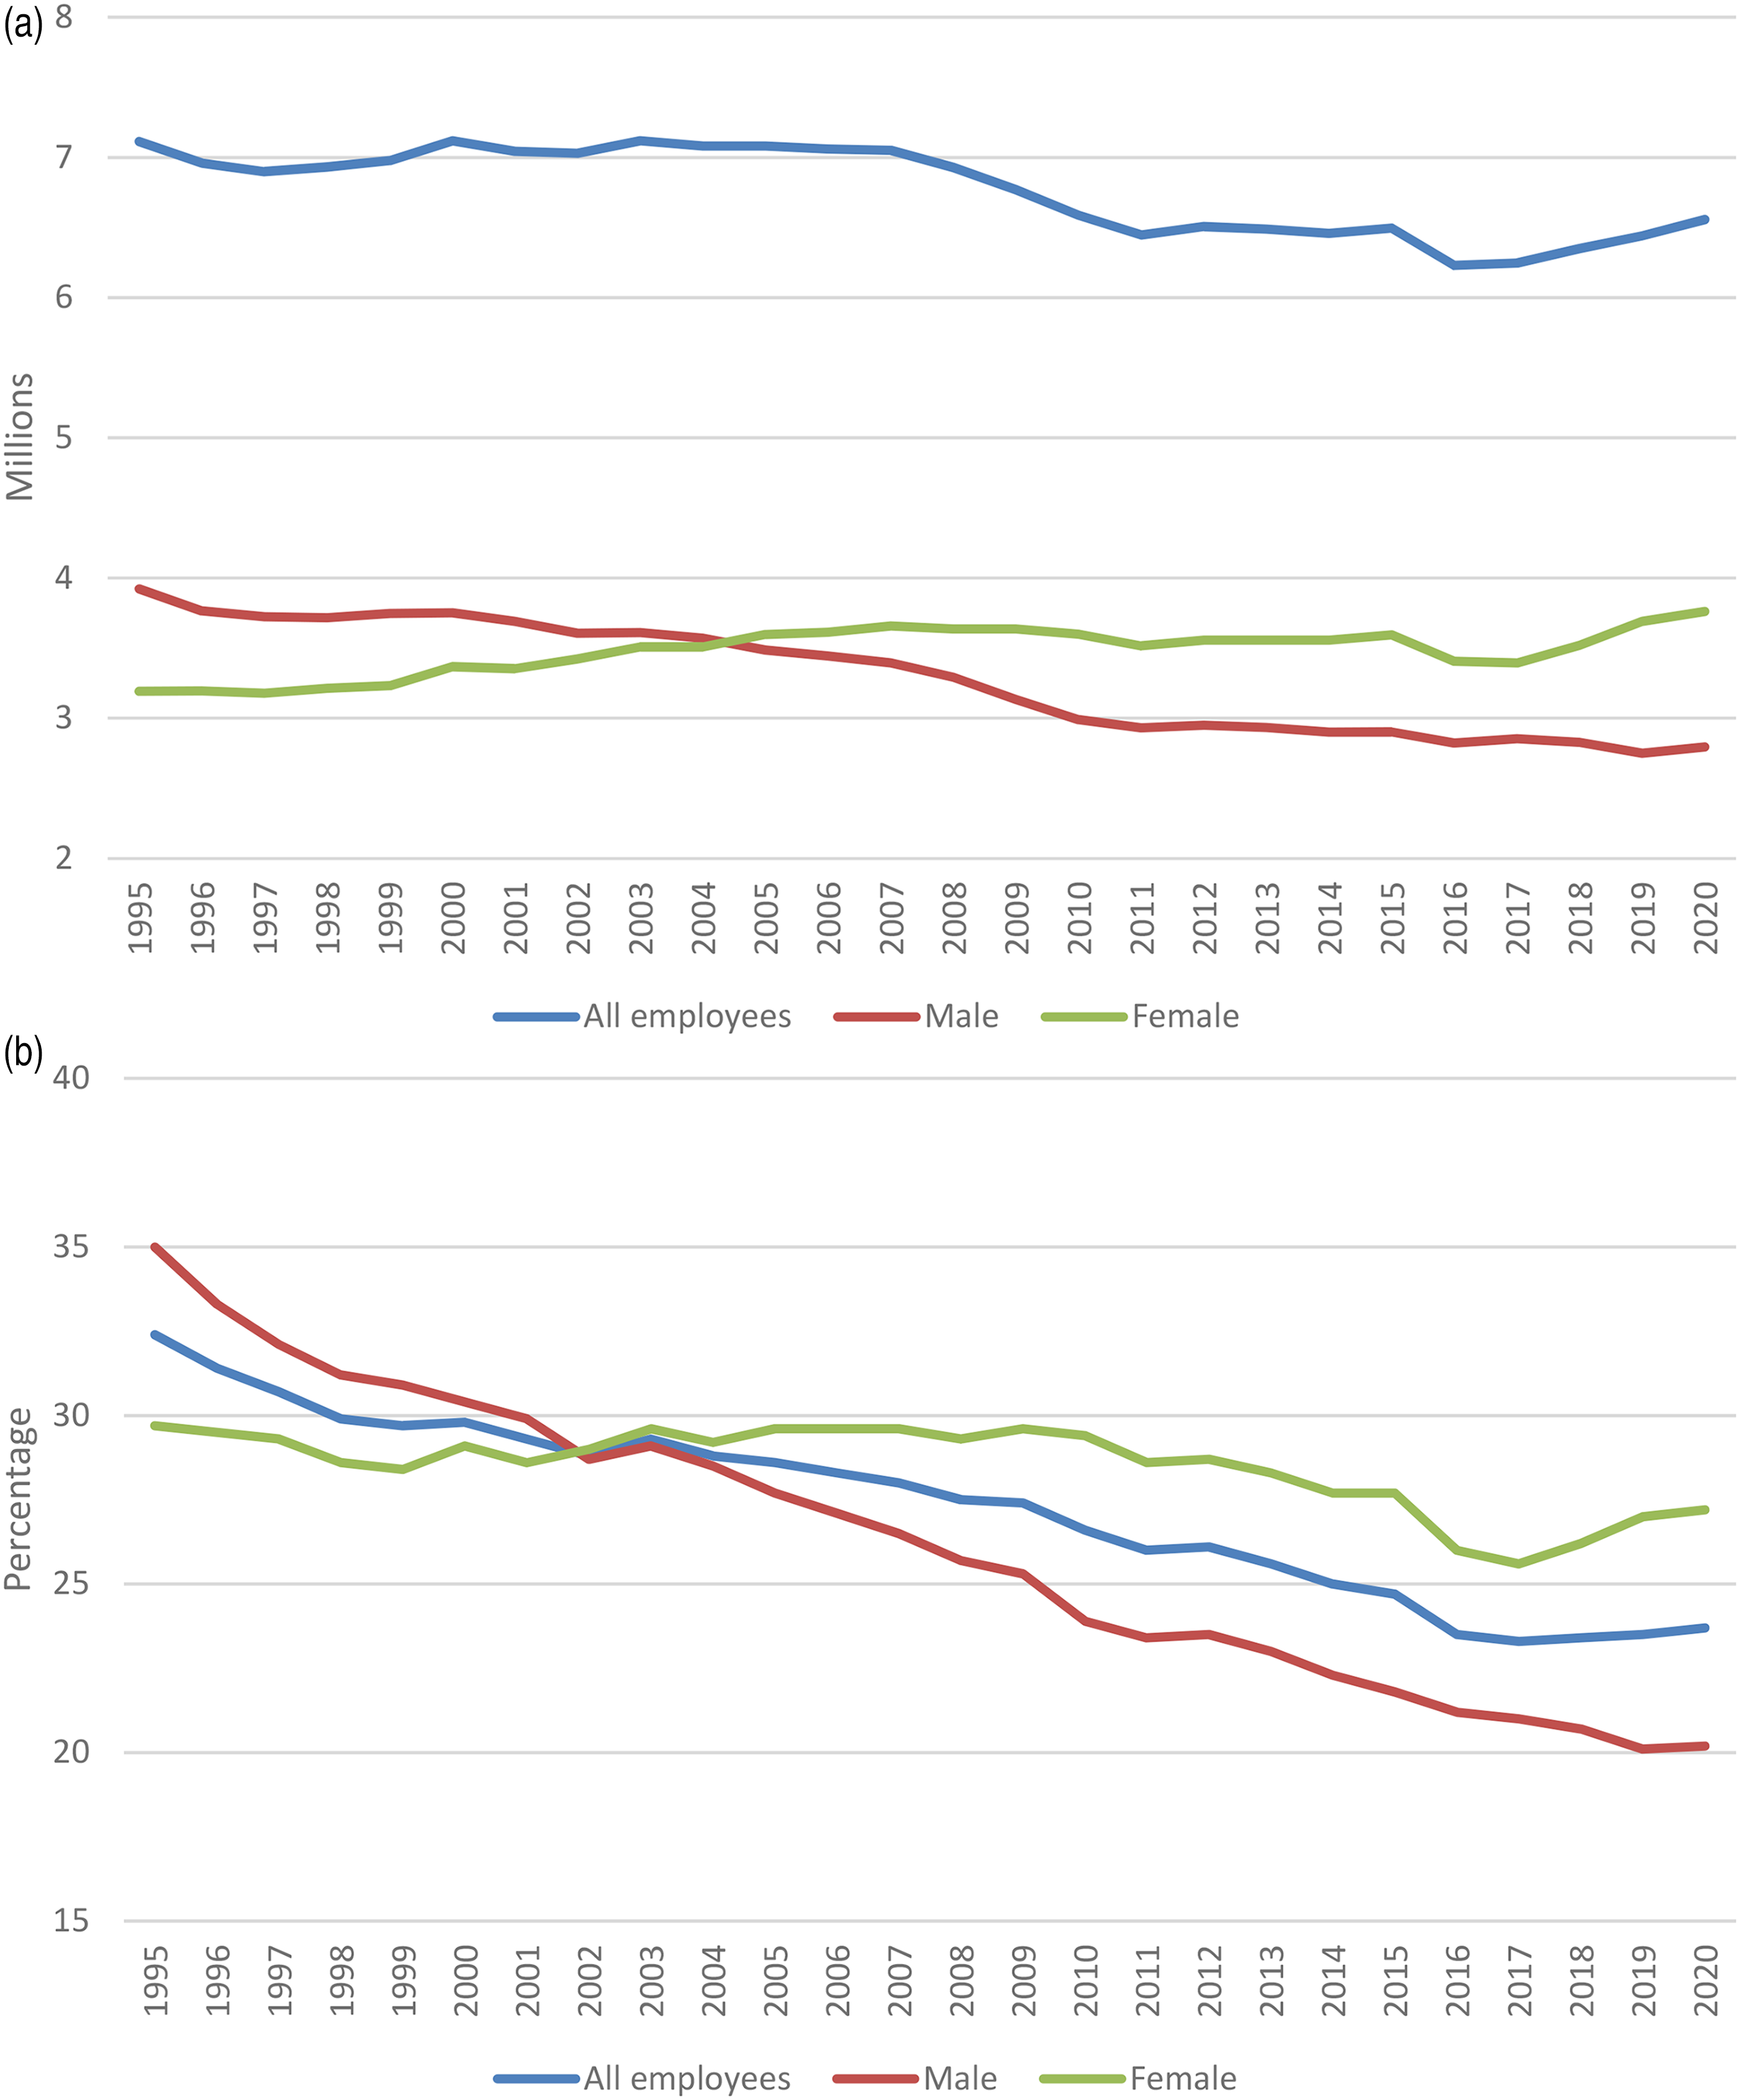
(a) UK trade union membership, 1995–2020. (b) UK trade union density, 1995–2020. Source: Department for Business, Energy and Industrial Strategy (2021).
The UK is not alone in having experienced recent rises following long periods of decline in union density (see Figure 2). Data from the Organisation for Economic Co-operation and Development (OECD) and Amsterdam Institute for Advanced Labour Studies (AIAS) show that trade union density in Canada increased from 25.9% to 27.2% between 2018 and 2020, wholly offsetting the decline since 2010. A more dramatic reversal occurred in the Republic of Ireland, where union density increased from 23.4% in 2016 to 26.2% in 2020, having fallen from 31.6% in 2011. In the United States, union density fell steadily from 11.9% in 2008 to 10.3% in 2016 but remained at that level in 2020. In each of these countries, female union density increased faster than male union density in recent years (OECD and AIAS, 2021). In contrast, there is little evidence of a change in the direction of union density in the European Union: in Austria, Germany, Italy, the Netherlands and Spain, trade union density fell in every year since 2014 which represents a continuation of long-term declines. Austria, Germany and the Netherlands have seen increases in female union density and declines in male union density since 2010 (time-series data on union density is not available for males and females separately for Italy and Spain), indicating that females are becoming increasingly important to trade unions across a broad range of advanced economies.
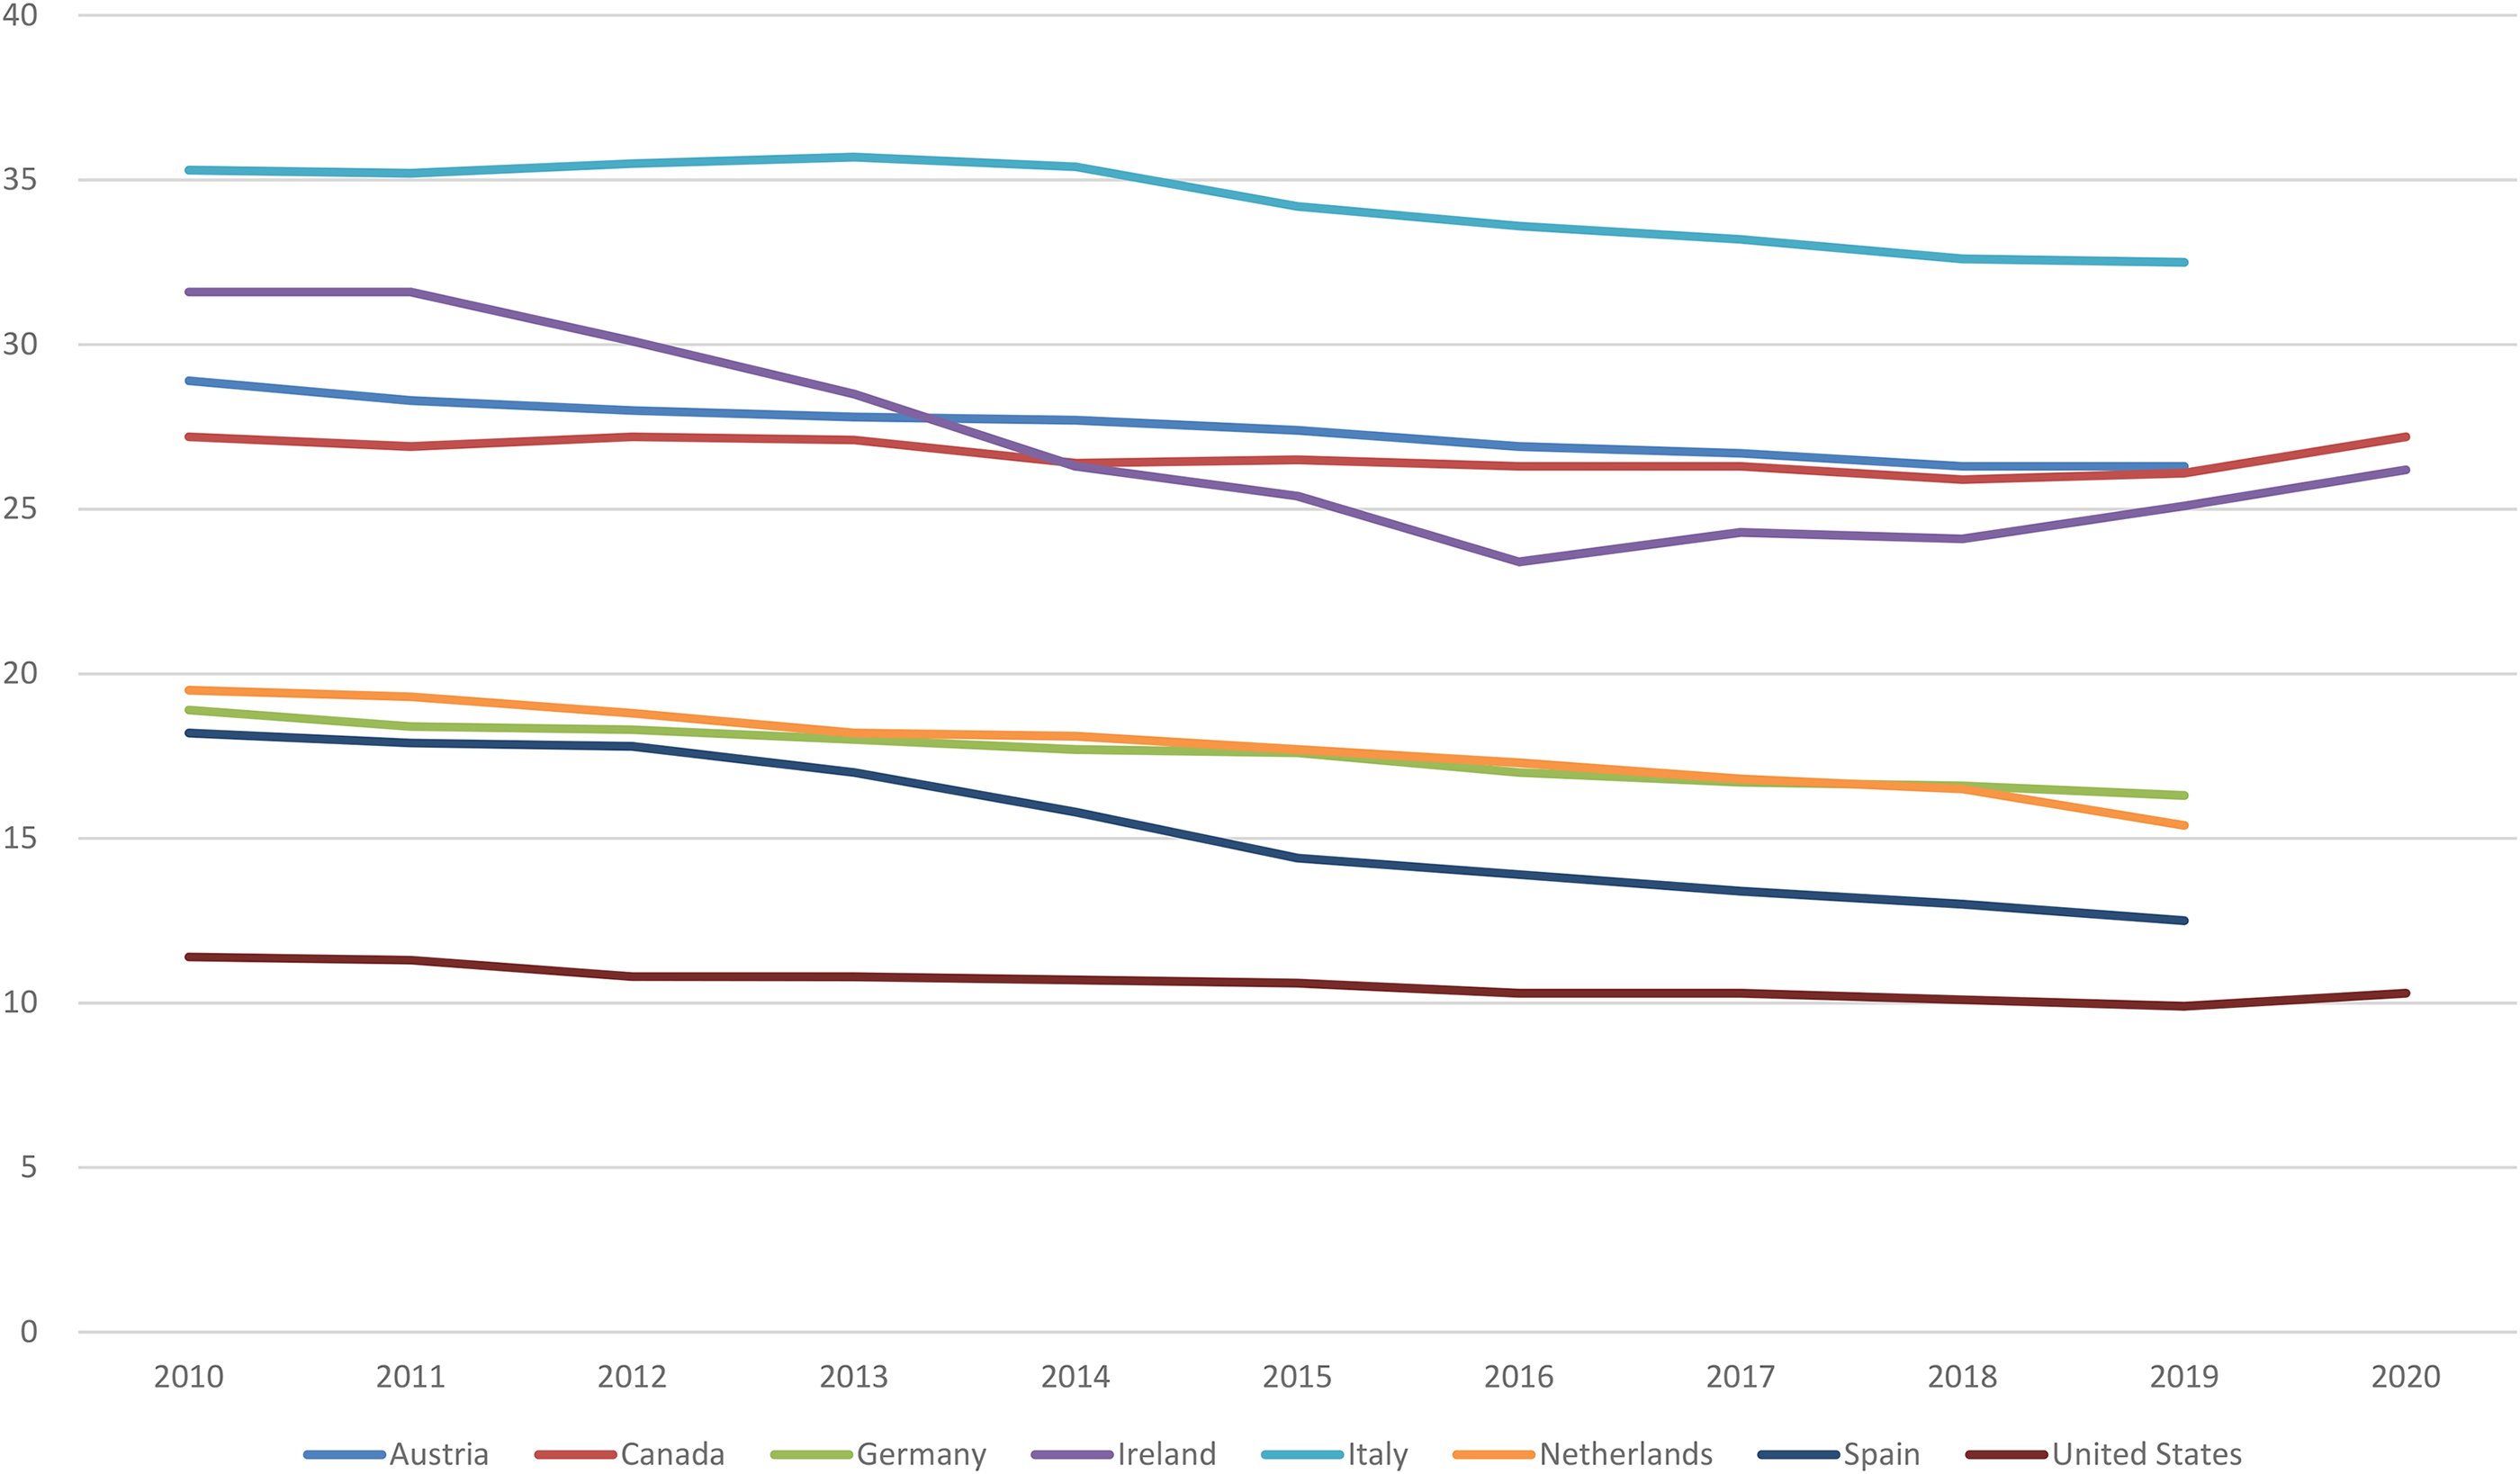
Trade union density in selected countries, 2010–2020. Source: OECD and AIAS (2021).
The rise in trade union density in 2017–2020, particularly amongst women, appears at odds with the gloomy prognosis for trade unions in the UK provided by Metcalf (2005). He argued that growth in membership would require higher employment growth in unionised sectors or for unions to invest more in the services they provide to current members and in recruiting new members. The former was considered unlikely, as structural change in the economy would continue to favour non-unionised sectors of the economy. This echoes the earlier analysis of the decline in union density in the UK of Towers (1989) who referred to the ‘inexorable and accelerating influence’ (p. 179) of compositional and structural changes during the 1980s. With respect to recruitment, Metcalf (2005) argued that trade unions were unlikely to be able to recruit at the rate required to offset the loss of members, many of whom were no longer covered by collective bargaining agreements and therefore lacking incentives to maintain their membership. He therefore concluded that ‘perdition’, particularly in the private sector, was a more likely outcome than ‘resurgence’. Writing in the same volume, but from different disciplinary perspectives, Gospel (2005) and Willman (2005) reached similar conclusions. More recently, Gomez et al. (2010) and Bryson et al. (2019) have shown that employee voice in the UK is increasingly being provided by employers through formal mechanisms such as regular meetings with management rather than through trade unions. Visser (2019) concludes that this substitution of trade unions with other forms of representation is likely to continue in British workplaces. These pessimistic forecasts seemed to be borne out by the decline in union density for most of the last 20 years. 1 A period of rising union density is therefore somewhat surprising and of interest to those concerned about the current weakness of trade unions in the UK.
The main purpose of this paper is therefore to examine why there was an increase in union density between 2017 and 2020 after a prolonged period of decline and why there were such marked differences in the evolution of union density between male and female employees. To explain the former, we apply decomposition methodologies to the change in union density in 2014–2017 (a period of decline for both males and females) and 2017–2020 to show whether it is the result of different changes in employee or job characteristics or of different changes in the propensity to unionise, either for particular groups or throughout the workforce. The same methodologies are applied to the change in union density for male and female employees in order to explain why union density increased for the latter but continued to fall for the former in 2017–2020. By revealing the drivers of recent changes in union density, the results will be informative as to whether the overall increase in union density is likely to be sustained or is merely a temporary deviation from a downwards trend and whether the female share of trade union members will continue to increase in the future.
The increase in union density has occurred against the backdrop of political and economic instability in the UK. This can be dated from 2015, when the Conservative party was elected on a manifesto promise to hold a referendum on the UK's membership of the European Union and was increased by the victory of the Vote Leave campaign in June 2016. The onset of the COVID-19 pandemic in March 2020 created further economic turbulence. One effect of this instability has been on consumer expectations of unemployment, which have tended to increase for both males and females since 2014, but with sharp increases in 2015 and especially at the time of the first ‘lockdown’ (Figure 3). Since job insecurity has been found to increase the probability of union membership (e.g. Jansen and Lehr, 2022), macroeconomic instability may explain part of the increase in union membership observed since 2017. If females have a greater dislike of income variability (i.e. are more risk averse), macroeconomic instability may also partly account for their larger increase in union density. This is because greater risk aversion would imply a greater desire to insure against income variations (Goerke and Pannenburg, 2012; Haile, 2016). To the extent that trade unions are perceived to provide such insurance by providing employment protection, this would lead to a stronger tendency amongst females to unionise during periods of increased instability.
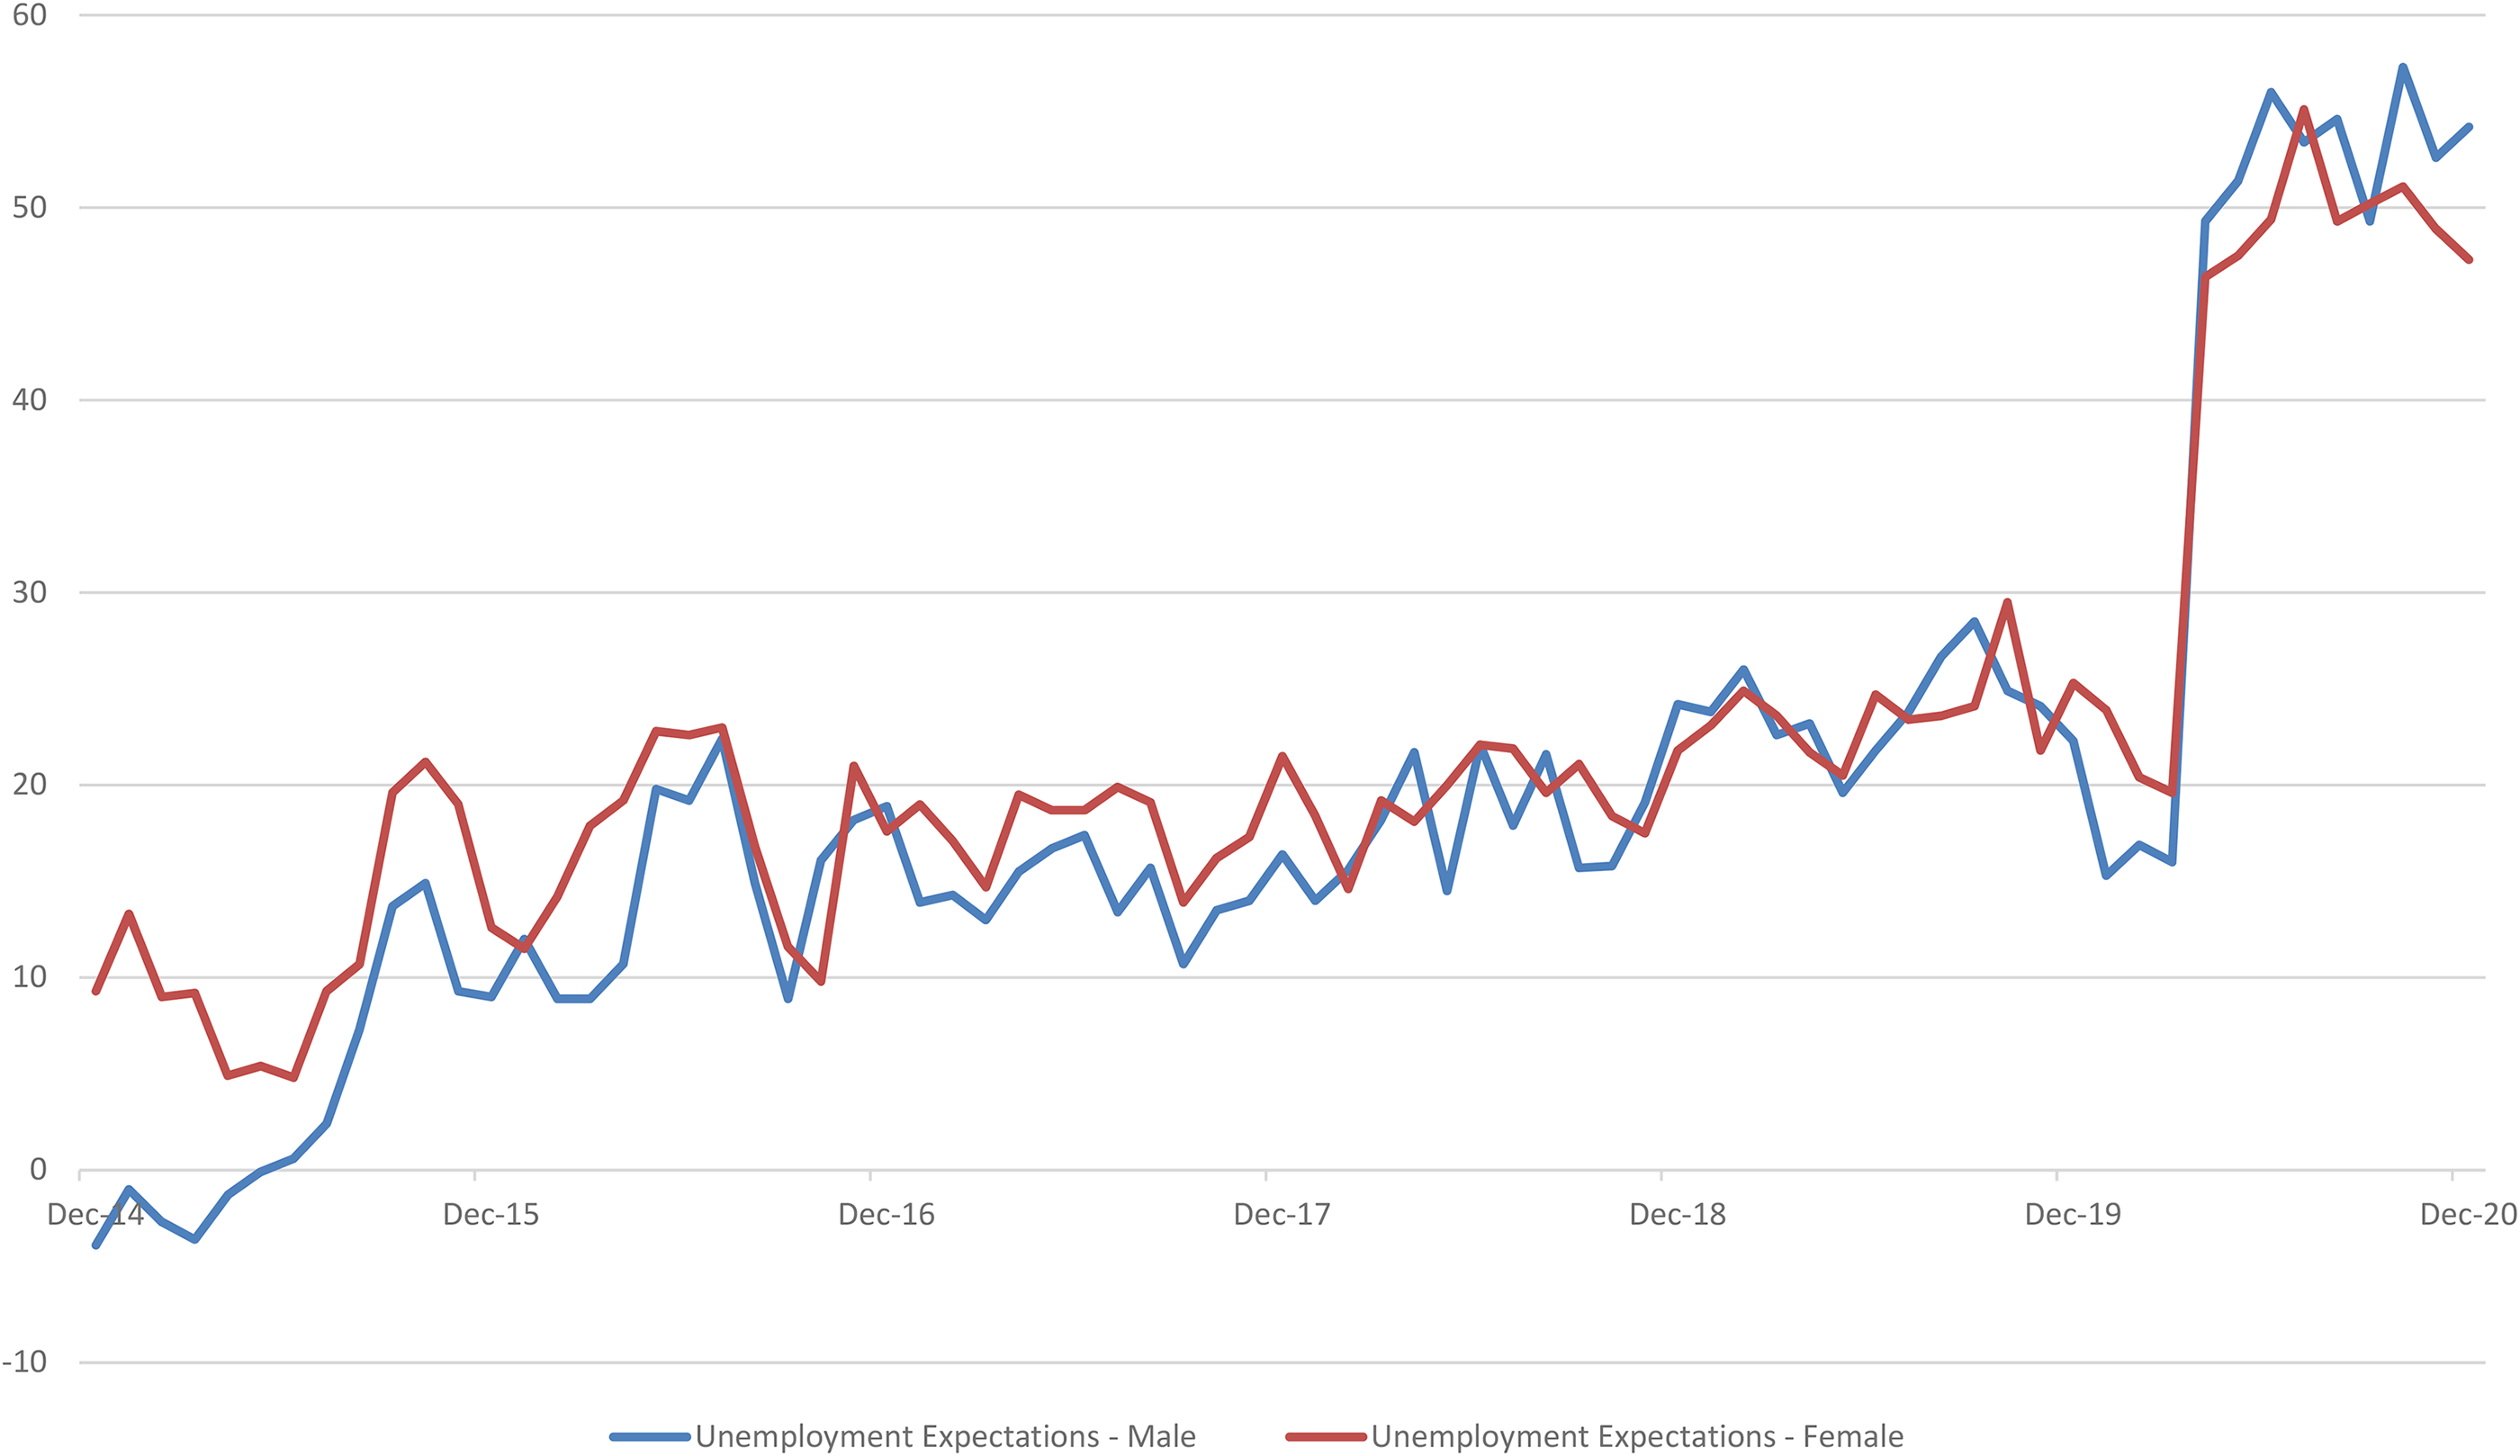
Expectations of unemployment over the next 12 months, UK, 2014–2020. Source: European Commission, 2021.
The next section provides a brief review of the literature on the determinants of trade union density. In the third section, the data and methodologies used to decompose changes in trade union density are set out. The fourth section presents the results. Finally, the conclusion summarises the results and discusses some of the consequences of the main findings.
Determinants of trade union density
The literature on union density often distinguishes between business cycle, compositional and institutional factors. 2 Our focus is on the business cycle and compositional factors in the absence of major changes in the institutional framework in which unions operated in the UK since 2014. Following Bain and Elsheik (1976), the literature on the effect of the business cycle has tended to focus on price and wage inflation and unemployment as determinants of trade union density. Price inflation is considered to lead to higher density as employees join unions to prevent the erosion of their living standards (the ‘threat effect’) whilst high wage inflation increases membership as employees attribute wage increases to trade unions and join in the hope that larger increases will be secured in the future (the ‘credit’ effect) (Bain and Elsheik, 1976; Schnabel, 1989). The ‘credit’ effect is less likely in sectors with collective bargaining where unionised and non-unionised employees benefit from union-negotiated wage increases (Checchi and Visser, 2005). However, a positive effect of wage inflation on union membership can also be explained if the type of services provided by trade unions makes membership a ‘normal good’ (Pencavel, 1971; Schnabel, 2003). Higher rates of unemployment (or merely the prospect of higher rates of unemployment) would be negatively associated with union density if they lead to a decline in union bargaining power and workers becoming less willing to risk employer retaliation. Conversely, actual or expected increases in unemployment may lead to a greater sense of job insecurity and demand for employment protection from unions. This effect is likely to be stronger for risk-averse individuals (Goerke and Pannenburg, 2012). Whether it differs across males and females depends upon the existence of differences in risk preferences. Whilst some papers conclude that females are more risk averse than males (Croson and Gneezy, 2009; Charness and Gneezy, 2012), others have questioned the magnitude and robustness of this finding (Filippin and Crosetto, 2016; Nelson, 2015).
The empirical literature, based on aggregated data, has tended to find positive effects of price and wage inflation and negative effects of unemployment although few papers adequately distinguish between the short-run effects of the business cycle and long-run unionisation trends (Checchi and Visser, 2005; Schnabel, 2003, 2020). One paper that seeks to make this distinction is Carruth and Disney (1988). Using UK data covering 1896–1984, they find that the political climate has some effect on union membership: a binary variable indicating periods when the Conservative Party was not in power has the expected positive effect. This is consistent with evidence that employees whose political orientation is to the left of the ideological spectrum are more likely to be union members (Kirmanoğlu and Başlevent, 2012; Schnabel and Wagner, 2007). More recent literature has used individual-level data to consider the job security-union membership nexus. 3 Nätti et al. (2005), using data on Finnish employees, find that perceived job insecurity increases unionisation rates and Jansen and Lehr (2022), in a study of individuals in the Netherlands, also find that greater job insecurity is positively associated with union membership. A similar association is obtained by Guest and Dewe (1988) for workers in the UK electronics industry. By contrast, De Cuyper et al. (2014) find a positive but not statistically significant effect of job security on union membership for employees on a temporary contract but a negative and statistically significant effect for employees on a permanent contract. Goslinga and Sverke (2003) using data on union members in Belgium, Italy, the Netherlands and Sweden, find that those with higher job insecurity are more likely to consider exiting the trade union. The evidence on the effect of job security on trade union membership is therefore mixed. The only study of which we are aware that considers whether differences in risk preferences across males and females lead to differences in unionisation rates is Karlsson and Stanfors (2018). Using Swedish data from the late nineteenth century, they find that females were less likely than males to join a trade union when the potential for conflict and employer retaliation is higher and attribute this to higher levels of risk aversion. However, as the authors acknowledge, the diminished prospect of employer retaliation in the present day makes it likely that greater risk-aversion would increase rather than diminish the prospect of union membership (evidence in support of this is provided by Goerke and Pannenburg, 2012).
Changes in the composition of the workforce have the potential to drive changes in trade union density since certain groups of employees, defined in terms of employee or job characteristics, have higher propensities to unionise. In relation to employee characteristics, native workers are more likely to be union members (Kranendonk and de Beer, 2016; Visser, 2019) whilst Blanchflower (2007) finds that all ethnicities, with the exception of black workers, had lower probabilities of union membership than the baseline white group in the US and UK. Marital status has generally been found to be statistically insignificant determinant of union membership (Riley, 1997). The literature has tended to find that education has a significant and non-linear effect on the probability of union membership. For example, Ebbinghaus et al. (2011), using data on 19 European countries, finds that the probability of union membership rises until 15 years of education (which generally equates to the level of a university degree) and declines thereafter. Previous studies have found that the relationship between age and union membership is also non-linear (Ebbinghaus et al., 2011; Kirmanoğlu and Başlevent, 2012). Although younger employees tend to have lower probabilities of unionisation (Vandaele, 2019), Blanchflower and Bryson (2022) show that the probability of being unionised increases until an individual is in their late 40s or early 50s and then declines. This pattern holds even when controlling for birth cohort dummies. The region in which the employee resides is another potential determinant of union membership. A recent analysis of the UK found that living in an area once dominated by mining has explanatory power for union membership (Beynon et al., 2021).
The characteristics of those in employment (discussed in the previous paragraph) will evolve as groups with a particular set of characteristics leave and groups with different characteristics enter the employed workforce. For example, the greater increase in the rate of participation in higher education for females than males in recent years may in part explain the faster increase in female union density (Department for Education, 2019). However, there is unlikely to be much change over time in these characteristics for a given employee. By contrast, an employee may change their job several times throughout their career. As such, changes in job characteristics may represent a more promising way of explaining changes in trade union density, particularly over the relatively short periods considered here. They are also likely to explain a substantial part of the difference in the change in union density across males and females in 2017–2020 due to the greater extent of ‘occupational upgrading’ achieved by females in recent years (Cominetti et al., 2022). With respect to contract type, Visser (2019) shows that part-time and temporary workers are around half as likely to be union members as full-time and permanent workers, respectively, and Fitzenberger et al. (2011) find a positive association between tenure and union membership in Germany. Previous studies have also shown that certain occupations are more likely to be unionised. For example, Kirmanoğlu and Başlevent (2012) obtain the following hierarchy in terms of the probability of unionisation based on cross-country European data (from high to low): machine operators; craft and related trades; technicians; agriculture and fishery; professionals; clerks; service workers; managers and elementary occupations. Certain sectors (in particular, mining and manufacturing) also have higher unionisation rates (Kirmanoğlu and Başlevent, 2012; Visser, 2019). Employment in the public sector is also associated with a higher probability of union membership (Blanchflower, 2007; Kirmanoğlu and Başlevent, 2012) whilst larger workplaces tend to have higher unionisation rates (Ebbinghaus et al., 2011; Kirmanoğlu and Başlevent, 2012; Visser, 2019).
Having identified a set of determinants of union membership, changes in union density over time can be decomposed to show the contribution from different employee and job characteristics using the method of Oaxaca (1973) and Blinder (1973) or variants thereof. Green (1992) finds that changes in the composition of the workforce accounted for 30% of the decline in union density in the UK between 1983 and 1989. This is in line with the result of Blanchflower and Bryson (2009) who find that compositional changes accounts for 32% of the fall in union density between 1980 and 2004. 4 More recently, OECD (2019) decompose the change in union density into the contributions of changes in demographics (sex, age, educational attainment), job characteristics (industry, occupation, public/private sector and firm size), atypical employment (temporary/permanent contract, part-time/full-time job and job tenure) and other factors (migration status and earnings). Using data from 15 OECD countries, they find that changes in the composition of the workforce generally explain only a small part of the fall in union density. For the UK, they find that only 0.1 percentage points of the total decline in union density of 4.8 percentage points between 2007 and 2017 is attributable to changes in workforce composition. Changes in job characteristics contributed −0.7 percentage points but this was counterbalanced by the (positive) contributions of 0.2 and 0.5 from changes in demographics and ‘atypical employment’, respectively. We are not aware of previous work that has applied decomposition techniques to changes in union density for males and females separately.
Data and methodology
The data used here is the Quarterly Labour Force Survey (QLFS) (Office for National Statistics, Social Survey Division and the Northern Ireland Statistics and Research Agency, Central Survey Unit, 2019a, 2019b, 2021). In the fourth quarter of each year, they collect information on trade union from individuals in employment. 5 It also provides consistent information across time on a rich set of employee characteristics (sex, nationality, ethnicity, age, cohabitation status, education, region) and job characteristics (contract type, job tenure, occupation, industry, organisation type, workplace size). This makes it well suited to modelling the determinants of trade union membership. Given the small numbers of self-employed that belong to trade unions, we follow previous studies (e.g. Green, 1992; OECD, 2019) in limiting the sample to employees. We also exclude employees who work for households as the small numbers of union members in this category causes difficulties for estimation. Finally, for consistency with the approach taken to construct the government figures, we exclude members of the armed forces. The resulting estimation sample is 31,607 in 2014, falling to 29,077 in 2017 and 25,274 in 2020. This reflects falls in the total sample collected by the QLFS. To ensure that the results are representative of the underlying population, the data is weighted in the empirical analysis.
The emphasis here is on explaining the change in trade union density in 2014–2017
6
and 2017–2020 and the different changes across male and female employees over the latter period. To do this, we apply decomposition techniques to the change in union density for all employees, male employees and female employees across 2014–2017 and 2017–2020 to show the contribution from changes in employee and job characteristics over time and the contribution from changes in the probability of belonging to a union for particular groups or across all employees. The change in union density can be represented as follows:


Results
Although not the focus of the analysis, it is useful to consider some of the results from the linear probability models that underpin the Oaxaca–Blinder decomposition. 9 The key results are provided in Table 1 (the full results are in Table S.1 of the Supplementary Material). The relationship between age and union membership has an inverted U-shape, with the probability of membership increasing until around the age of 43–45. This implies lower probabilities of union membership amongst employees at the outset of their careers than at 66, the current age at which the state pension can be claimed. Higher levels of education are, ceteris paribus, positively related to union membership, particularly for females, although the difference in unionisation probabilities for NQF level 4 (the baseline) and NQF level 3 and Trade Apprenticeships is generally not statistically significant. Full-time workers are around 4 percentage points more likely than part-time workers to belong to a union. Job tenure has a positive but diminishing association with union membership (the maximum probabilities of union membership, shown at the bottom of Table S.1, are at levels of job tenure above those generally observed in the data). Relative to managers (the baseline group), all occupational groups have a higher probability of belonging to a union. The strongest associations are for the following: Skilled Trade Occupations; Sales and Customer Service Occupations; Process, Plant and Machine Operatives; and Elementary Occupations. Employment in the public sector is positively associated with union membership, particularly if the individual works for a nationalised industry or state corporation, central or local government, or a health authority or NHS trust. Employees in workplaces with 25–499 and 500 or more employees have a higher probability of union membership than the baseline group (employees in workplaces with 0–24 employees), ceteris paribus.
Selected estimated coefficients from weighted linear probability model for all employees, males and females, 2014, 2017.
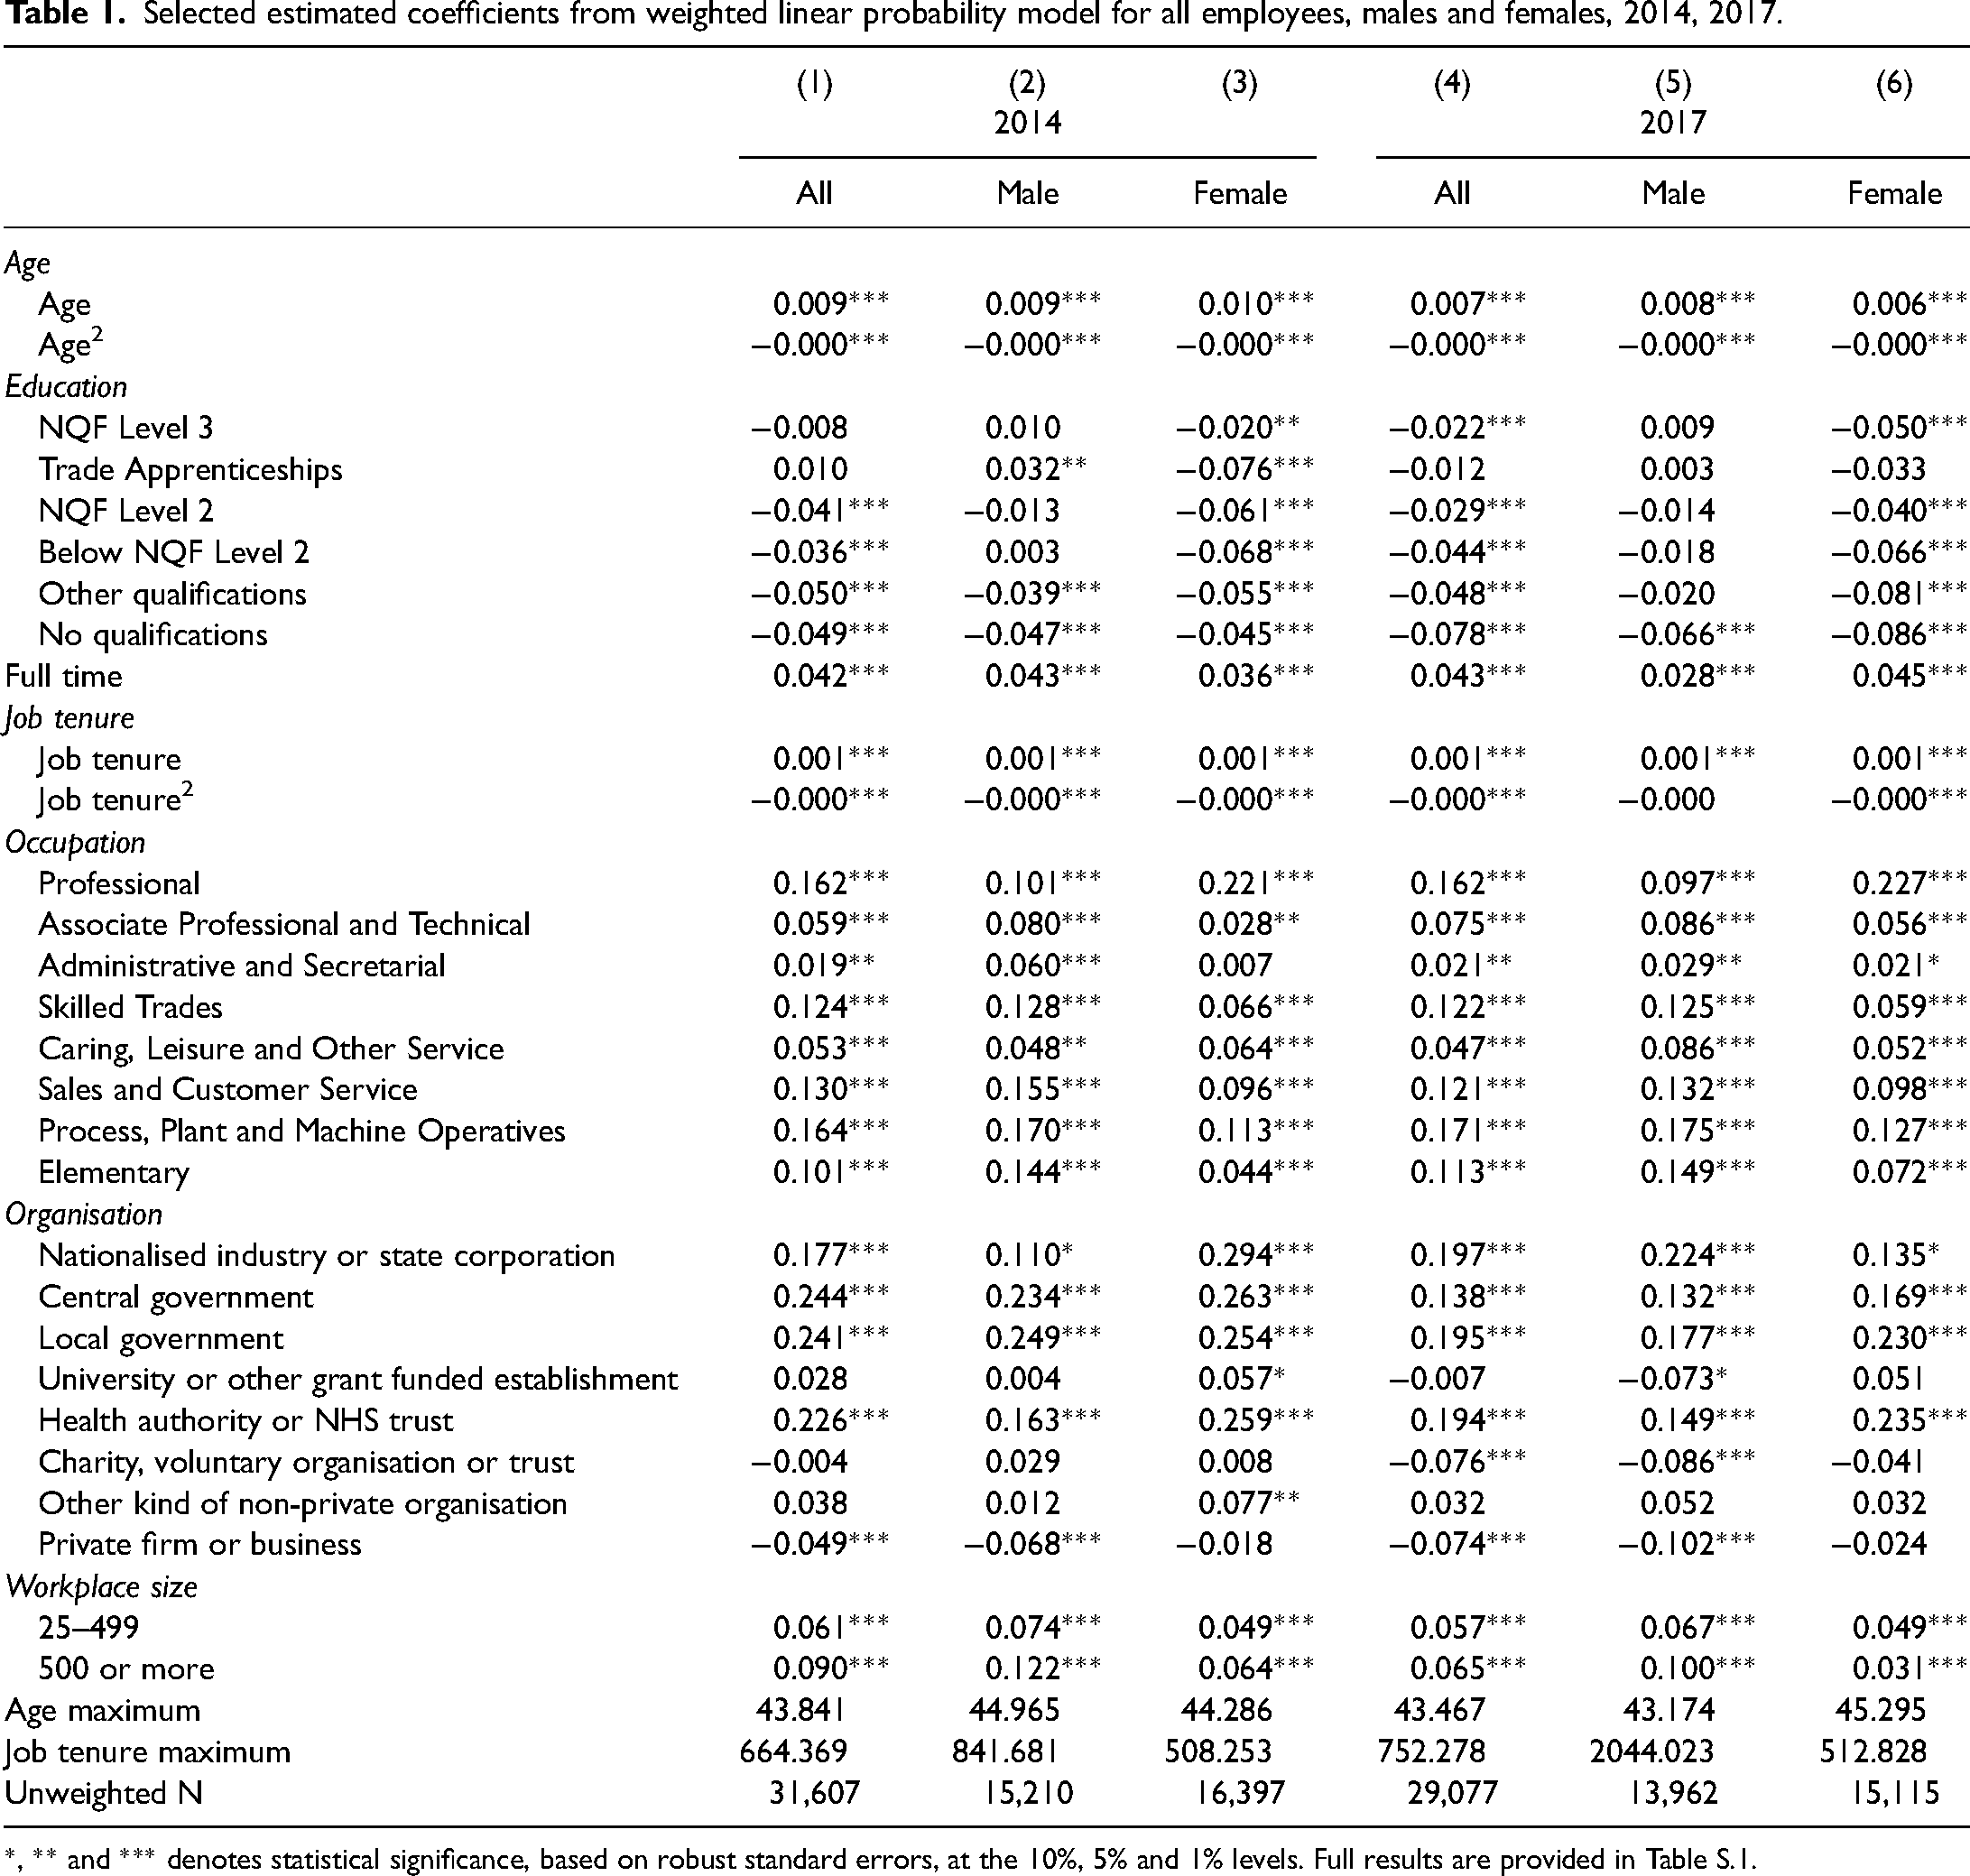
*, ** and *** denotes statistical significance, based on robust standard errors, at the 10%, 5% and 1% levels. Full results are provided in Table S.1.
Table 2 presents the decomposition results for all employees as well as for males and females, separately, for 2014–2017 and 2017–2020. As shown in Figure 1, 2014–2017 was a period of decline in union density for males and females. Overall, it fell by 1.82 percentage points in this period. 10 This was the result of statistically significant falls of 1.35 percentage points for males and 2.3 percentage points for females. Around two-thirds of the decline for males is explained by changes in employee and job characteristics (i.e. ‘endowment’ effects) but, for females, 80% was due to the ‘unexplained’ component.
Weighted Oaxaca–Blinder decomposition of change in trade union density for all employees, males and females, 2014–2017, 2017–2020, UK.
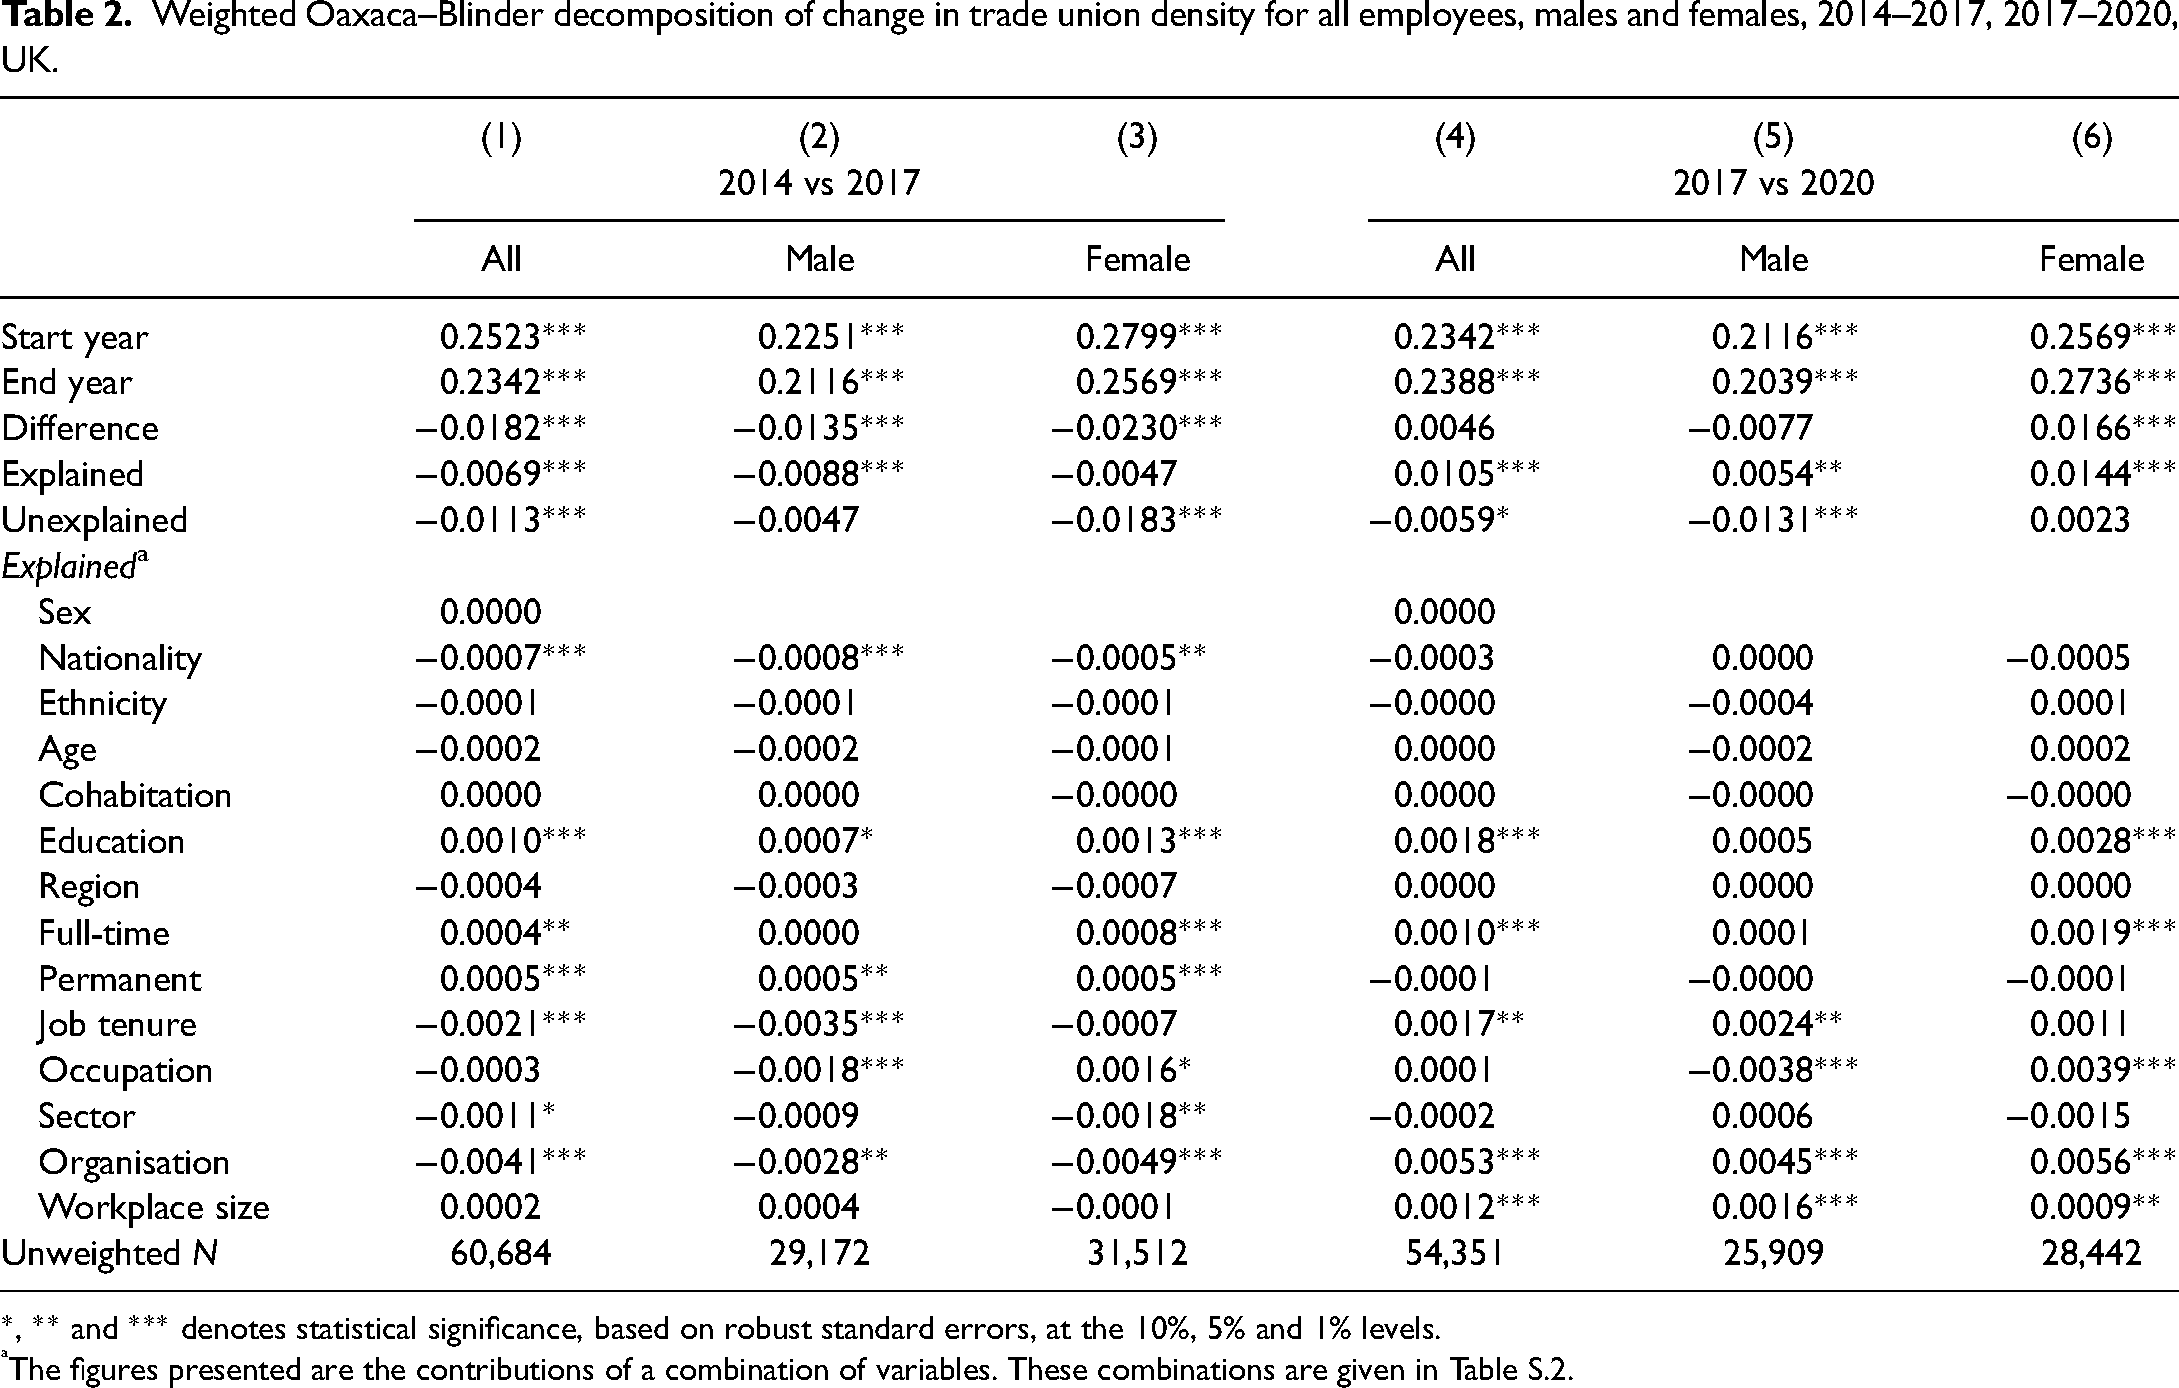
*, ** and *** denotes statistical significance, based on robust standard errors, at the 10%, 5% and 1% levels.
The figures presented are the contributions of a combination of variables. These combinations are given in Table S.2.
For 2017–2020, trade union density increased for all employees by 0.46 percentage points (which is not statistically significant) and by 1.66 percentage points for females. However, it fell for males by a statistically insignificant 0.77 percentage points. The increase for all employees is entirely attributable to changes in employee and job characteristics whilst 87% of the increase for females is explained by these factors. For male employees, the ‘explained’ component is also positive and statistically significant, offsetting the larger negative contribution from the ‘unexplained’ component.
Comparing 2014–2017 and 2017–2020, the difference in the change in union density for all employees of 2.28 percentage points (i.e.
Comparing male and female employees in 2017–2020, the difference in the ‘explained’ component of 0.9 percentage points (i.e.
Since workforce composition is the major determinant of changes in 2017–2020, and because of the difficulties inherent in interpreting the ‘unexplained’ component (Jones, 1983; Fortin et al., 2011), we present only the detailed decomposition of the explained component. To assist with the explanation of the decomposition results in Table 2, Table 3 presents the mean values for the most relevant variables (the complete set of means is given in Table S.2). The main source of the positive ‘explained’ component in 2017–2020 for all workers, males and females was changes in the type of organisation for which employees worked. In 2014–2017, this was the largest (negative) contributor to the explained component (−0.41 percentage points for all employees – column 1 in Table 2) but became the largest (positive) contributor in 2017–2020 (0.53 percentage points for all employees). This reflects increases (declines) in the share of employment in more unionised organisations in 2017–2020 (2014–2017). Specifically, the share of employees reporting that they worked for central and local government increased by 0.7 and 0.6 percentage points, respectively, between 2017 and 2020 (Table 3, columns 2 and 3) whilst the share working for health authorities or NHS trusts increased by 0.5 percentage points. In 2014–2017, when ‘austerity’ was still dominating fiscal policy in the UK, the employment share of these organisations was either stagnant (central government and ‘Health authorities or NHS trust’) or declined substantially (local government), thus leading to a fall in union density. A similar pattern is evident across males and females so changes in the type of organisation was the largest contributor for both males (−0.28 percentage points, Table 2, column 2) and females (−0.49 percentage points). An attempt by the government to improve the state of the UK's public finances in the wake of the COVID-19 pandemic by cutting employment in the public sector would therefore cause declines in union density.
Selected weighted means of variables used in decomposition for all employees, males and females, 2014, 2017, 2020.
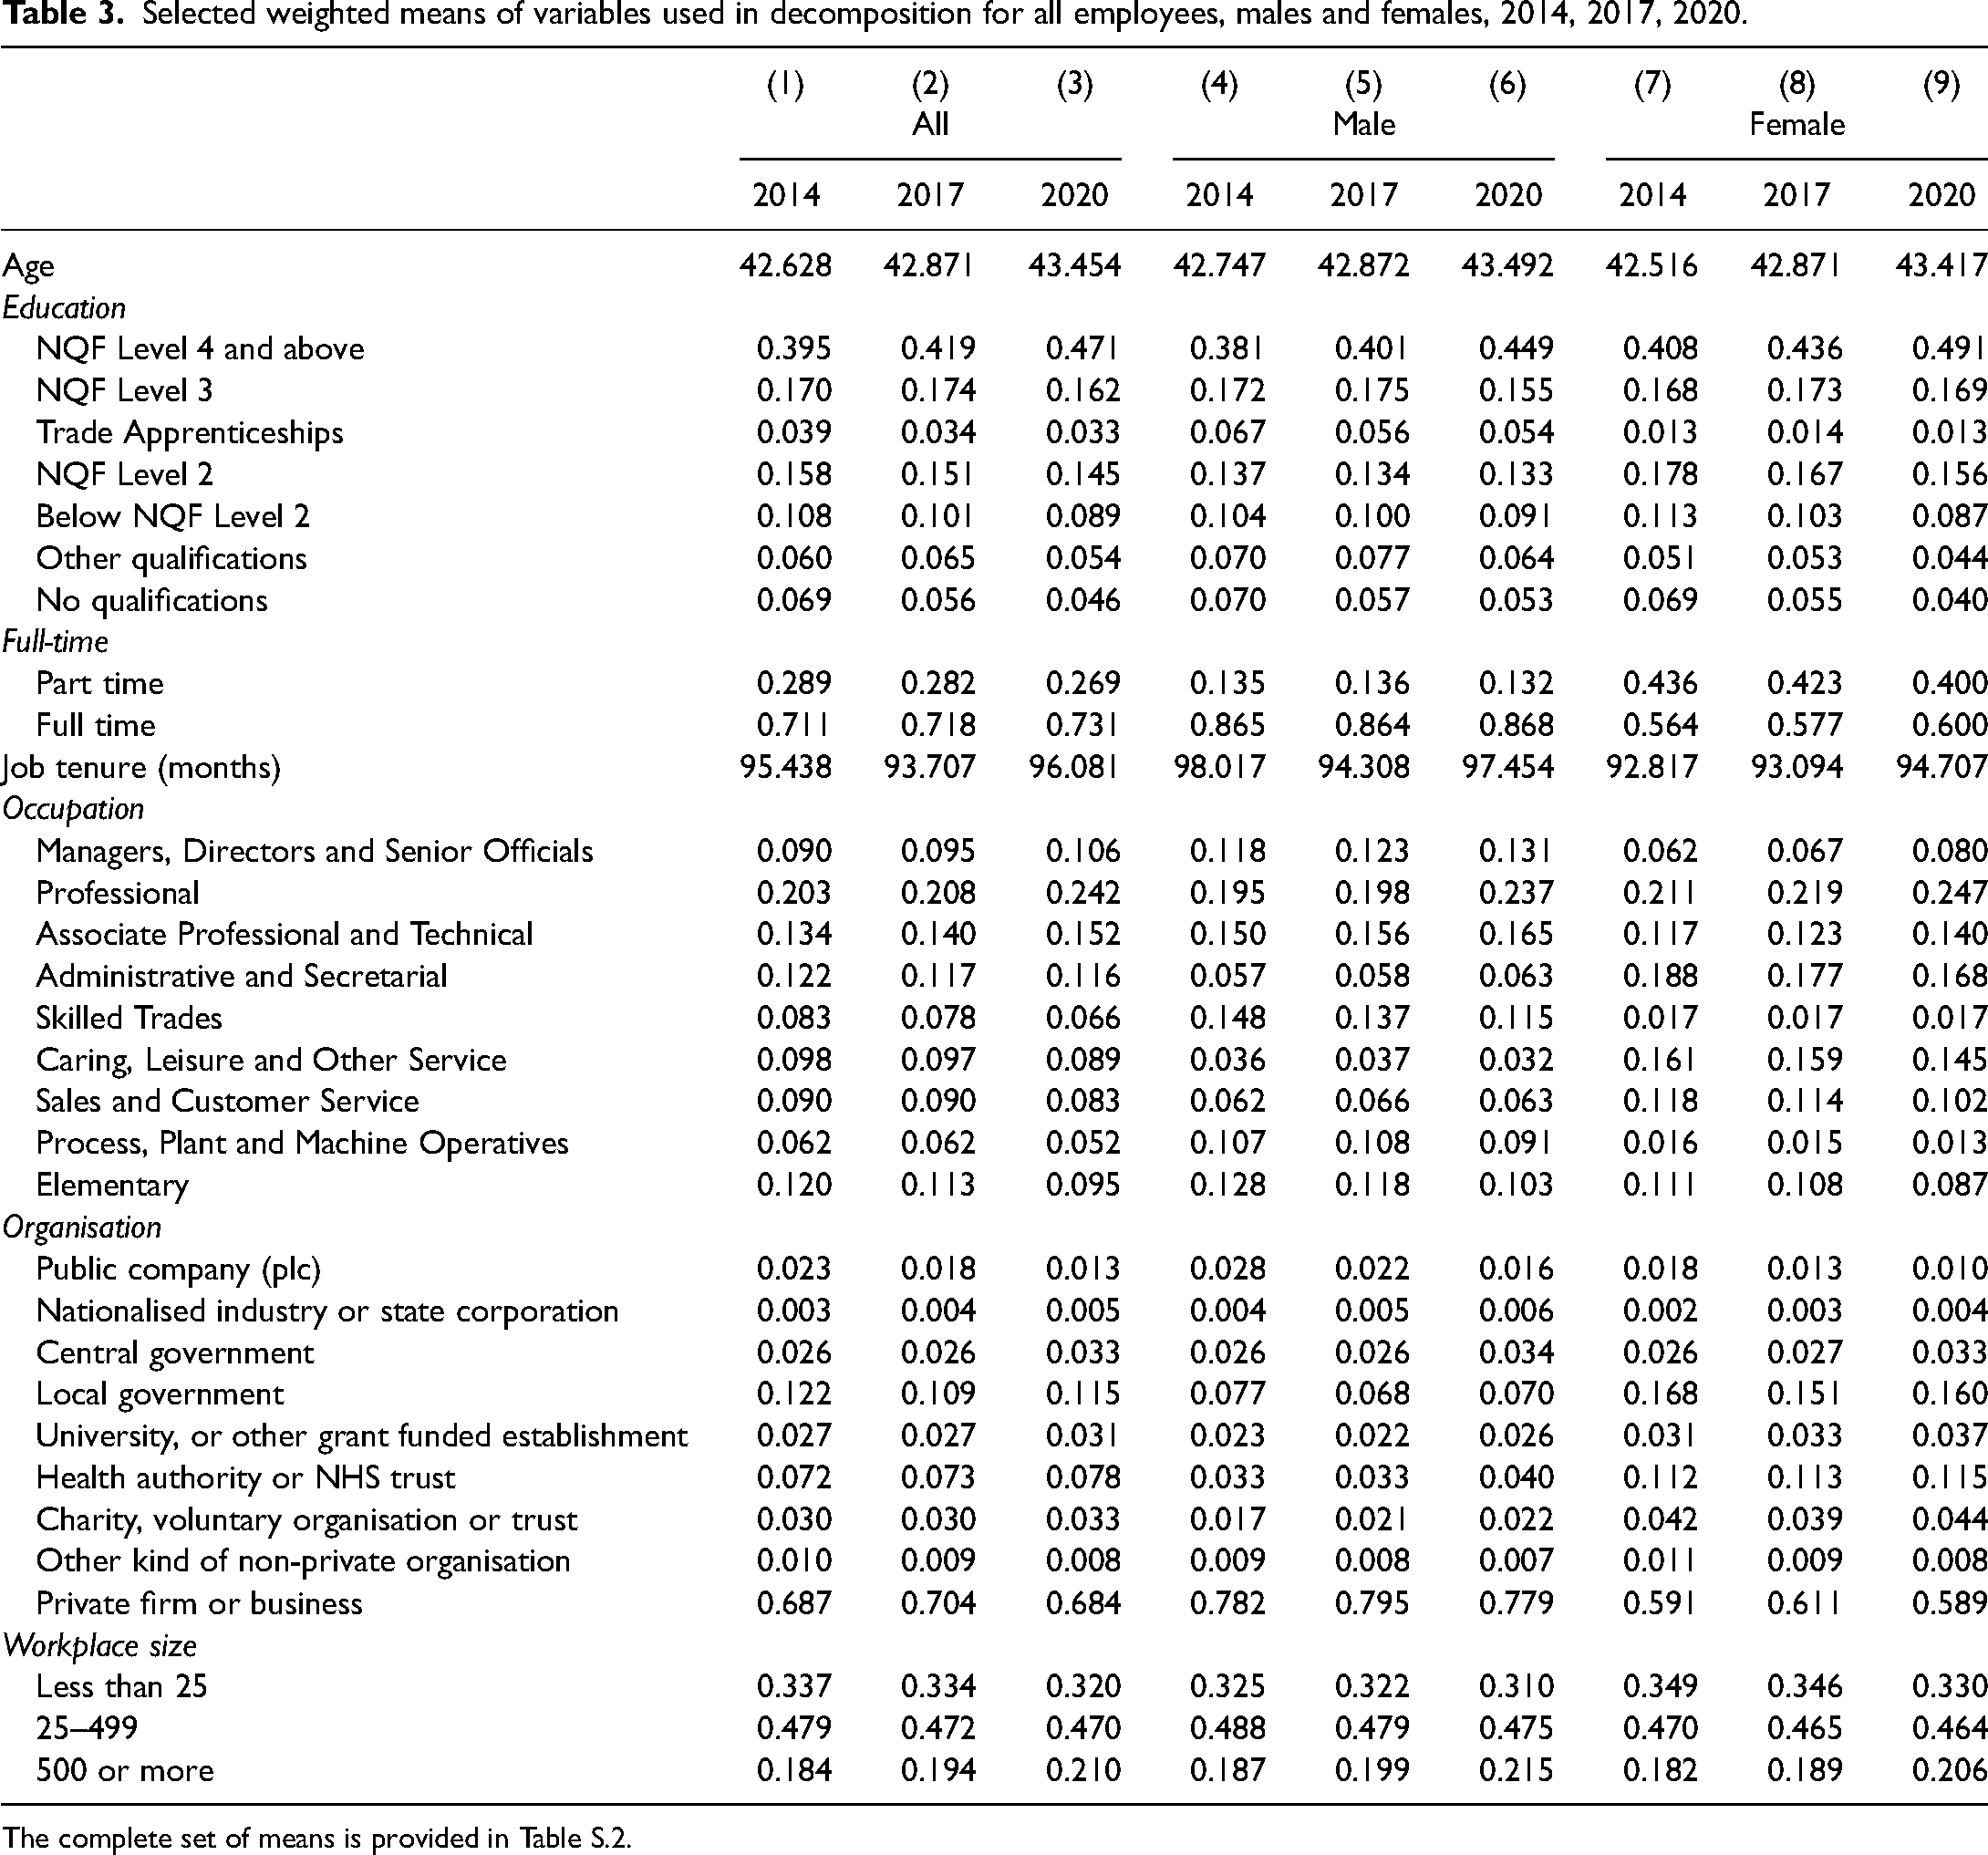
The complete set of means is provided in Table S.2.
Weighted Yun and Fairlie decomposition methods for all employees, males and females, 2014–2017, 2017–2020, UK.
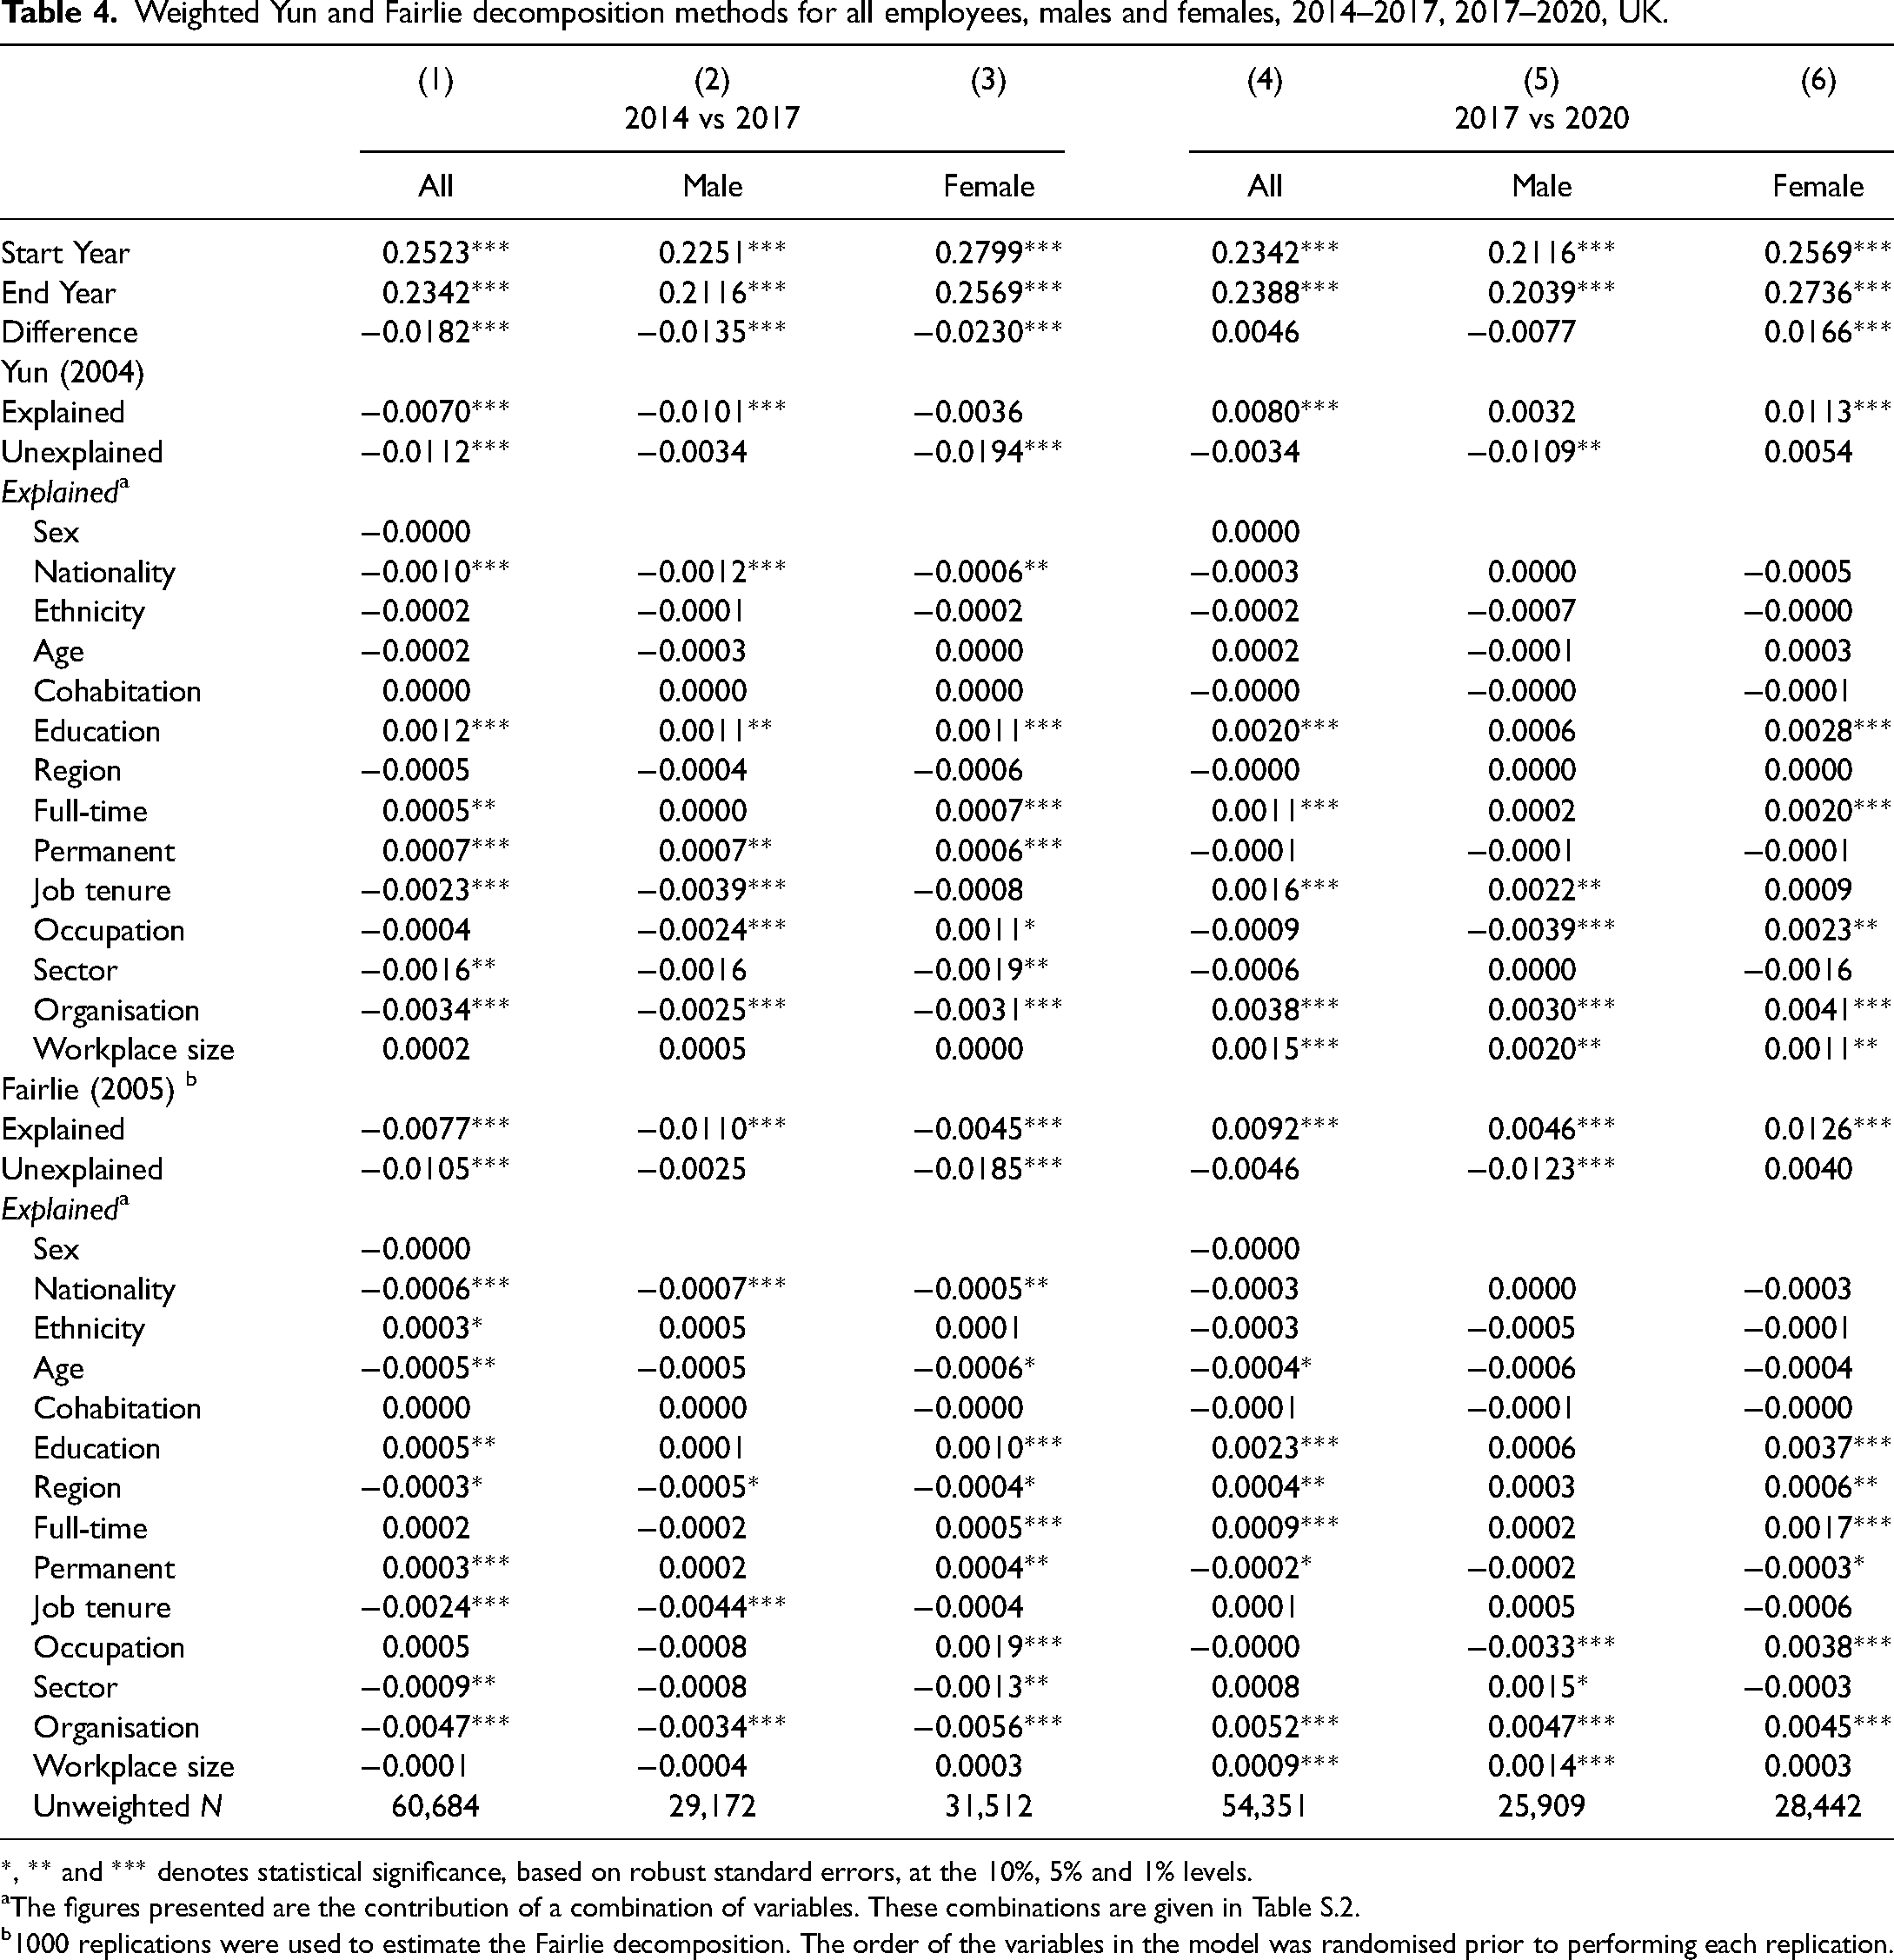
*, ** and *** denotes statistical significance, based on robust standard errors, at the 10%, 5% and 1% levels.
The figures presented are the contribution of a combination of variables. These combinations are given in Table S.2.
1000 replications were used to estimate the Fairlie decomposition. The order of the variables in the model was randomised prior to performing each replication.
Job tenure also helps to explain the change in the development of union density across the two periods. For all employees, job tenure decreased by 1.73 months in 2014–2017 but increased by 2.37 months in 2017–2020 (Table 3, columns 1–3). This may reflect reduced hiring and voluntary quits in the latter period because of the greater uncertainty shown in Figure 3. Since job tenure is positively associated with union membership in the range of observed values, it contributed −0.21 and 0.17 percentage points to the change in union density in 2014–2017 and 2017–2020, respectively (columns 1 and 4 in Table 2), with the overall result mostly due to changes in job tenure for males. A shift in the share of employees towards larger workplaces also led to higher union density in 2017–2020. The share of male and female employees in workplaces with less than 25 employees decreased by 1.2 and 1.6 percentage points, respectively, in 2017–2020. The equivalent figure for 2014–2017 was −0.3 percentage points for both groups. Since employment in larger workplaces is positively associated with union membership (Table 1), this reallocation of employees from small to larger workplaces contributed 0.16 percentage points for males and 0.09 percentage points for females to the change in union density in 2017–2020 (but by a statistically insignificant amount in 2014–2017).
Across all employees (column 4 in Table 2), the second largest contributor to the increase in union density in 2017–2020 was higher levels of educational attainment in the workforce (at 0.18 percentage points). The share of employees with NQF Level 4 and above (tertiary education) rose by 5.2 percentage points over this period with corresponding reductions at lower levels of education. The equivalent figure for 2014–2017 was 2.4 percentage points. As such, higher educational attainment also contributed positively, albeit to a lesser extent (0.1 vs 0.18 percentage points), and hence prevented even larger declines in union density in this period. Whilst the education levels of both males and females substantially increased in 2017–2020, the association between higher levels of education and union membership is stronger for females, and thus the contribution of higher education to changes in union density is particularly large for females: in 2017–2020, it contributed 0.28 percentage points (compared to only 0.05 percentage points for males). Since the educational attainment of the workforce is likely to continue to rise in the future, as more educated (younger) cohorts replace less educated (older) cohorts, these trends will continue to increase union density.
The major source of the disparity in the growth of union density between males and females in 2017–2020 was differences in the effects of occupational changes. Over this period, male employees tended to shift towards less unionised occupations, leading to a decline of −0.38 percentage points in their unionisation rate, whilst the share of female employees in more unionised occupations increased, raising their unionisation rate by 0.39 percentage points. There were increases of 3.9 and 2.8 percentage points in the share of males and females, respectively, working as professionals (Table 3, columns 5–6 and 8–9). However, the (positive) association between this occupational group and unionisation is far stronger for female than male employees (columns 5 and 6 in Table 1). Moreover, for males, the share of employment fell in Skilled Trades (by −2.2 percentage points), Process, Plant and Machine Operatives (by −1.7 percentage points) and Elementary occupations (by −1.5 percentage points), sectors that are associated with a higher probability of being a union member (column 5 in Table 1). By contrast, females decreased their share of employment in occupations with low unionisation rates such as Administrative and Secretarial occupations (by 0.9 percentage points) and Caring, Leisure and Other Service occupations (by 1.4 percentage points). These shifts towards more unionised occupations for females and away from unionised occupations for males were also evident in 2014–2017 but were less pronounced: their effect was to contribute −0.18 percentage points for males and 0.16 percentage points for females to the change in union density in the earlier period. In 2020, there were still substantial differences in the distribution of occupations across males and females. For example, 11.5% of males compared to only 1.7% of females were employed in Skilled Trades whilst 14.5% of females but only 3.2% of males were employed in Caring, Leisure and Other Service occupations. There is therefore substantial scope for further convergence in the distribution of occupations and hence increases in the share of female union members.
Another significant contributor to the difference in the development of union density across male and female employees in 2017–2020 was full-time employment. Full-time employment increased by 2.3 percentage points amongst females but by only 0.4 percentage points amongst males. Since full-time employment is positively associated with union membership, the contribution to union density was 0.19 and 0.01 percentage points for females and males, respectively. This factor also contributed to higher union density amongst female employees in 2014–2017 but by a smaller amount. Since the rate of full-time employment amongst females remained 26.8 percentage points lower than that of males in 2020, there is potential for further convergence in these rates, which would be expected to increase union density for females.
The absence of a significant role for most employee characteristics (nationality, ethnicity, age, cohabitation and region) in explaining the evolution of union density for both males and females is generally the consequence of small changes in the means of these variable (see Table S.2) rather than a lack of association with union membership (Table S.1). Given the short time periods considered, this is unsurprising. Of particular interest is the age variable in light of concerns about youth attitudes towards trade unions (Aleks et al., 2021). The mean of age increased slightly for both males and females in 2014–2017 and 2017–2020 and is currently close to the point at which the probability of union membership is maximised so the effect on union density was small. However, large increases in the youth or elderly share of employees in the workforce would act to reduce union density.
The results obtained using non-linear decomposition methods are shown in Table 4. These are broadly similar to the results from the linear Oaxaca–Blinder decomposition. Focusing on 2017–2020, the Yun (2004) decomposition gives a slightly lower ‘explained’ component at 0.8 percentage points (rather than 1.05 percentage points from the Oaxaca–Blinder decomposition). This is mostly the result of a smaller contribution from changes in organisation type (0.38 rather than 0.53 percentage points). Nevertheless, this remains by far the largest contributor to the explained component. The Fairlie (2005) decomposition also provides a somewhat smaller ‘explained’ component than the Oaxaca–Blinder decomposition of 0.92 percentage points. The difference is largely attributable to a contribution from job tenure of −0.01 percentage points rather than a contribution of 0.17 percentage points. The other contributions are similar across both methods, providing assurance that the findings are robust to the use of different decomposition methodologies.
Further robustness checks are presented in the Supplementary Material. In Table S.3, the results from estimation of the Oaxaca–Blinder decomposition using the estimated coefficients from the end year, rather than the start year, to calculate the endowments component are presented (see footnote 4). The ‘explained’ components are within 0.1 percentage points of those shown in Table 2 for 2014–2017 and around 0.15 percentage points higher for all employees, males and females for 2017–2020. There is the result of larger contributions across a range rather than a particular set of variables. Nevertheless, the differences are small and do not change the key results, indicating that the choice of coefficients has little effect. Table S.4 of the Supplementary Material presents results from an Oaxaca–Blinder decomposition of the change in trade union density across 2011–2017 (using the estimated coefficients from 2011). The drivers of the decline in 2011–2017 are consistent with those for 2014–2017. Specifically, the explained component accounts for less than half of the decline in trade union density for all employees of 2.9 percentage points. For male employees, 62% of the fall of 2.6 percentage points is accounted for by changes in employees and job characteristics whilst, for female employees, only 22% of the decline of 3.2 percentage points is attributable to the explained component. Occupational changes represent the major source of the explained component for all groups. These results are therefore in line with the results presented above for 2014–2017 and suggest that the conclusions are not just an artefact of the choice of the period of decline in union density.
Summary and conclusions
Union density increased in the UK for three consecutive years between 2017 and 2020. This increase was entirely attributable to higher unionisation rates amongst females. This paper has examined why union density declined in 2014–2017 before increasing in 2017–2020 and why the growth rate of union density differed across males and females. This was done using decomposition methodologies, which show whether changes in union density are due to changes in the composition of the workforce or an increase in the propensity to unionise, either for particular groups or across all employees. The results show that the change in overall trade union density in 2017–2020 was largely the result of the former. Specifically, the main source of the change across 2014–2017 and 2017–2020 was changes in the organisations for which employees work. In particular, increases in the share of employment in more unionised public sector organisations (specifically, central and local government and health authorities) increased union density. The single largest contributor to the growth in union density amongst female employees relative to decline amongst males in 2017–2020 was the movement of females (males) into more (less) unionised occupations. Higher contributions of education and full-time working, both of which are positively associated with union membership, also contributed to larger increases in union density amongst females. The contribution from factors unrelated to the composition of the workforce (i.e. the ‘unexplained’ component) was negative for males and positive (but not statistically significant) for females in 2017–2020. This is consistent with increased macroeconomic instability leading to a stronger desire for employment protection amongst females due to their higher levels of risk aversion, although other factors may also explain this result.
In terms of the prospects for the trade union movement, our results offer reasons for both hope and concern. The finding that the increase in density was not primarily the result of higher unionisation rates amongst specific groups, or more generally, suggests that it is not simply a cyclical phenomenon that will be reversed when macroeconomic conditions improve. However, it also suggests that it cannot be attributed to a longer-term underlying trend (perhaps relating to the political climate or changing attitudes towards trade unions) that has increased the attractiveness of unions and which might continue in future years. Instead, the results suggest that whether union density continues to rise after 2020 will be dependent on further favourable changes in employee and job characteristics. For some characteristics, this seems probable; in particular, the trend towards a more highly educated workforce is likely to continue as more educated, younger cohorts replace less educated, older cohorts. Since union density is higher amongst the more educated, this will support further increases in union density. By contrast, the current state of the public finances in the UK suggests that shifts towards the more unionised public sector are likely to be a transitory phenomenon, which may be reversed if the government seeks to reduce the budget deficit in the near future. A continuation of the trend towards an older workforce would also lead to declines in union density.
The results also suggest that there will be further increases in the share of female trade union members. Two of the principal drivers of the different evolution of union density across males and females in 2017–2020 were increases in the share of employment in more unionised occupations amongst female employees (and decreases amongst male employees) and increases in the rate of full-time employment amongst female employees. Since there remain substantial differences in the occupational distribution and rates of full-time employment across males and female employees, there is ample scope for both processes to drive further rises in female union density.
Supplemental Material
sj-docx-1-jir-10.1177_00221856231157107 - Supplemental material for What explains the increase in trade union density and female share of union members in the United Kingdom in 2017–2020?
Supplemental material, sj-docx-1-jir-10.1177_00221856231157107 for What explains the increase in trade union density and female share of union members in the United Kingdom in 2017–2020? by Richard Harris and John Moffat in Journal of Industrial Relations
Footnotes
Declaration of conflicting interests
The author(s) declared no potential conflicts of interest with respect to the research, authorship and/or publication of this article.
Funding
The author(s) received no financial support for the research, authorship and/or publication of this article.
Supplemental material
Supplemental material for this article is available online.
Notes
Biographical notes
References
Supplementary Material
Please find the following supplemental material available below.
For Open Access articles published under a Creative Commons License, all supplemental material carries the same license as the article it is associated with.
For non-Open Access articles published, all supplemental material carries a non-exclusive license, and permission requests for re-use of supplemental material or any part of supplemental material shall be sent directly to the copyright owner as specified in the copyright notice associated with the article.