
Abstract
The mammary gland (MG) develops new vasculature and is colonized by lymphocytes, primarily T-cells, during pregnancy. In contrast, during lactation it is colonized primarily by IgA-containing B-cells (c-IgA cells). To explain this difference, we analyzed the spatiotemporal relationships between lymphocytes that expressed peripheral or mucosal homing receptors (HR) and the location of their vascular counterreceptors using quantitative immunohistochemical techniques. We observed that the density of β7+/CD3+ T-cells varied with the amount of the mucosal addressin cell adhesion molecule-1 (MAdCAM-1)-stained area. Both increased during pregnancy to peak at delivery, decreased rapidly in early lactation to a steady level in mid- and late lactation, and returned to resting values after weaning. Although 60% of these β7 +/CD3+ T-cells scattered in the epithelium co-expressed αEβ7, whereas the remaining 40% in association with blood vessels were α4β7, these results are consistent with a role of MAdCAM-1 in the localization of α4β7 + T-cells. In contrast to T-cells, β7 +/c-IgA+ B plasmablasts (∼ 30% of total c-IgA cells) were located at the alveolar confluence, and their numbers increased in mid- and late lactation when MAdCAM-1 density plateaued. However, both T-and B-cells decreased after weaning. These results show an association between MAdCAM-1 expression level and recruitment of T-cells that does not hold for c-IgA B cells. Furthermore, the recruitment and accumulation of α4β7 + c-IgA cells are reminiscent of locally produced chemoattractants.
Keywords
The role of these T-cells has not yet been defined. They may be involved in epithelial cell growth during pregnancy, or they may be involved in protection against infections (Chabaudie et al. 1993) and in the regulation of local immune responses in both pregnancy and lactation (Lefrançois and Puddington 1999). The source of IgA plasma cells homing into the MG has been well documented in the mouse (WeiszCarrington et al. 1977). Most of the IgA plasma cells originate from gut-associated lymphoid tissue (McDermott and Bienenstock 1979) and home as IgA-containing (c-IgA, surface and/or cytoplasmic IgA) Iymphoblasts into the MG in late pregnancy and during lactation (Parrott 1979; Roux et al. 1977), a process contingent on the hormonal state (Weisz-Carrington et al. 1978). In contrast, the T-lymphoblasts of both mucosal and peripheral origin may migrate into the MG during lactation (Rose et al. 1978).
The recruitment of activated (blast)/memory lymphocytes into mucosal (i.e., gut) and peripheral (i.e., skin) tissues is believed to occur in the same manner as in lymphoid organs. This process involves the spatial and temporal interactions of homing receptors (HR) with corresponding tissue-specific vascular addressins (Salmi and Jalkanen 1997). In addition, other factors, including cytokines, chemoattractants, and hormones, may combine their activities with adhesion molecules to determine the traffic pattern of lymphocytes towards any given tissue in any organ (Salmi and Jalkanen 1997). Therefore, the major mucosal addressin, MAdCAM-1 (Nakache et al. 1989), is selectively expressed on blood vessels of mucosal tissues such as the flat endothelium of the gut lamina propria and the lactating mammary gland (Streeter et al. 1988a). The proposition that MAdCAM-1 plays a role in α4β7 + cell localization (Berlin et al. 1993) is sustained by the observation that in vivo inhibition of MAdCAM-1 function reduces immunoblast homing into the gut lamina propria and lymphocyte trafficking into Peyer's patches (Streeter et al. 1988a; Picker and Butcher 1992; Hamann et al. 1994). This is further supported by the observation that an increase in MAdCAM-1 expression in colon inflammatory disease is followed by α4β7 CD45RB T-cell recruitment (Picarella et al. 1997) and by B-cell recruitment in the pancreata of IL-4 transgenic mice (Mueller et al. 1997). On the other hand, a dominant role of β7 integrin has recently been documented for intestinal lymphocyte extravasation in knock-out mice deficient in this subfamily of integrin (Wagner et al. 1996).
Given the cutaneous origin of the MG (Linzell 1959), some adhesion receptor-ligand interactions observed in the skin, such as the interaction of α4β1 with vascular cell adhesion molecule-1 (VCAM-1) or cutaneous lymphocyte-associated antigen with E-selectin (Postigo et al. 1993b; Rott et al. 1996), may also occur in the MG.
To understand the homing programs for T- and B-lymphocytes trafficking into the MG during its development, we followed the localization and kinetics of lymphocyte subsets in relation to their HR and corresponding vascular addressins, using quantitative immunohistochemistry. We found that differences in the extent of trafficking of α4β7 lymphocytes in the MG are related to the level of MAdCAM-1 expression for T-cells but not for c-IgA cells.
Materials and Methods
Mice
Nulliparous, specific pathogen-free female Balb/c mice obtained from our breeding colony were fed a breeding diet (UAR Factory; Epinay sur Orge, France). They were used at 6–8 weeks of age at Days 4, 12, or 19 of pregnancy (P4, P12, and P19, respectively; Day 1 of pregnancy determined by vaginal plaque detection), at Days 1, 4, 12, or 18 of lactation (L1, L4, L12, and L18 respectively), and at Day 4 after weaning (25 days postpartum). For the lactating mice, the newborns were left with the mother and allowed to suckle until sacrifice and tissue recovery.
Tissue Samples and Sections
Mice were anesthetized and injected
The first abdomino-inguinal MG (fourth pair) with their attached lymph node (superficial inguinal LN), as well as small intestine with Peyer's patches and mesenteric lymph node, was removed and snap-frozen in liquid nitrogen. Serial sections of MG were cut at 7 μm. These cryostat sections were dried, fixed in cold acetone for 20 min (San Gabriel-Masson 1992), wrapped in aluminum foil, and kept at −70C until use.
Antibodies
Except where indicated, all Abs used were purified rat monoclonal antibody (MAbs). Mature T-cells were detected with anti-mouse CD3 (KT3, IgG2a; Serotec; Pantin, France), c-IgA cells using R5-140, IgG1 (Pharmingen; Le Pont de Claix, France) or goat anti-mouse IgA-conjugated alkaline phosphatase (Caltag; Le Perray-Yvelines, France), cells expressing β7 integrin using hybridoma culture supernatant (SN) M293, IgG2a (generously given by P.J. Kilshaw), cells expressing α4 integrin using PS/2, IgG2a (Serotec), cells expressing αE (αM290) integrin using M290, IgG2a (Pharmingen), cells expressing L-selectin using MEL-14, IgG2a (Cedarlane; Le Perray-Yvelines, France), pro-B through the mature B-cells using anti-mouse CD19 (1D3, IgG2a; Pharmingen), pro-B through mature and activated T- and B-cells using anti-mouse CD45R/B220 (RA3-6B2, IgG2a; Caltag).
The presence of MAdCAM-1 was detected using mouse endothelial cell antigen 367 (MECA 367), IgG2a (Pharmingen), panendothelial cell antigen using MECA 32, IgG2a (Pharmingen), PNAd using hybridoma culture SN MECA 79, IgM (generously supplied by C. Kieda), VCAM-1 using M/K-2, IgG1 (Caltag), and E-selectin using 10E9.6, IgG2a (Pharmingen).
Anti-mouse MHC I (ER-HR 52, IgG2a, Bale Biochimie Bachem; Voisins-le-Bretonneux, France) was used as a positive control. Purified IgG2a,κ (R35-95, isotype standard; Pharmingen), purified IgM (IR202, myeloma; UCR Bruxelles), and a goat anti-rat IgG2a-conjugated alkaline phosphatase (Bethyl; Montpugon, France) were used as isotype-matched negative control Abs.
Immunohistochemical Staining
Frozen sections were thawed, encircled using a pap pen (Immunotech; Marseille, France), and were first covered with PBS-1% BSA for 30 min to remove the nonspecific background and then with avidin in excess for 10 min to block endogenous biotin activity (avidin-biotin kit; Dako, Glostrup, Denmark). After washing in PBS, sections were incubated in 0.03% hydrogen peroxide for 5 min at room temperature (RT) to remove nonspecific peroxidase activity (Peroxidase Blocking Reagent; Dako) and then stained using a three-stage biotin-streptavidin-peroxidase technique.
After incubation with the primary MAb at optimal concentrations for 1 hr at RT, sections were washed three times and incubated for 1 hr with secondary antibody, biotin-conjugated rabbit anti-rat IgG/IgM (Dako). After further washes, the sections were incubated for 45 min with preformed peroxidase-labeled streptavidin complex (Dako). The horseradish peroxidase bound to the sections was revealed with amino-9-ethylcarbazol substrate-chromogen (Dako) and sections were counterstained with hematoxylin solution (Gill No.1; Sigma, St Louis, MO) and mounted in aqueous medium (Faramount; Dako). In the case of c-IgA/β7 double immuno-staining, c-IgA was first detected using goat anti-IgA-conjugated alkaline phosphatase (0.5 μg/ml). The phosphatase reaction was developed with naphthol AMSX-P (Sigma) and Fast Blue BB Salt (Sigma) in the presence of levamisole (Sigma) as previously described (Vazeux et al. 1987). Thereafter, sections were treated with anti-β7 as above.
Quantitative Evaluation of Data
Counts were made on stained cells present in adjacent fields in each section using a × 25 objective and a × 10 eyepiece. The cells counted were those that showed clearly defined membrane and/or cytoplasmic staining (c-IgA). Distinction between plasmablasts (or B-blasts) and plasma cells was made using criteria of size, nucleus location, and nucleus/ cytoplasm ratio. The c-IgA cells with greater quantities of cytoplasm than nucleus size (cytoplasm/nucleus ratio >1) were categorized as mature plasma cells and large cells with cytoplasm/nucleus ratio ≤ 1 as plasmablasts.
All lymphocytes and plasma cells were counted at × 250 magnification (field diameter 0.576 mm) in counts of at least 100 cells in 30–140 microscopic fields, representing the whole area of three randomly selected sections (Munford 1963), including fields composed entirely of fatty tissue but avoiding fields composed of large blood vessels or portions of inguinal LN. Cells were enumerated as cells within the alveolar epithelium (intraepithelial cells per field), as cells in the connective tissue between the alveoli (subepithelial cells per field), and as total positive cells per field. The number of labeled cells per microscopic field (0.26 mm2) was calculated from three randomly selected sections per mouse and the mean ± SEM determined.
Analysis of the stained area per tissue area unit covered by stained endothelial cells was quantified by a computerassisted image analyzer (VISILOG; NOESIS, Velizy, France). A stable light source and a fixed threshold to elimate background (assessed by isotypic control stained slides) and light intensity were used throughout the measurements. To compare the extent of MECA 32 staining in relation to that of MECA 367, two adjacent sections were mounted per slide and three slides per MG were selected at random. Evaluation of the amount of stained area was made on adjacent fields in each section as above. Briefly, the red-stained area of light microscopic images was captured through a green filter and results in pixels were converted into μm2. The stained areas were determined in 30–140 microscopic fields (covering the entire histological section) from three randomly selected sections at × 200 magnification (field surface 0.13 mm2). Because the SEM of stained areas for each section was less than 10%, the stained areas were calculated from two to three mice as the means ± SEM of MECA 367-or MECA 32-stained area (μm2) per mm2 of MG tissue, to improve the accuracy of the results.
All the results were obtained from microscopists blind to groups and to Abs during analysis.
Photomicrographs
Photomicrographs of representative fields were taken on Kodak Ektrachrome tungsten film (64 T).
Statistical Analysis
Assumptions for the Gaussian distribution of values were made by the Kolmogorov-Smirnov test. In cases of non-Gaussian distribution, non-parametric tests were used instead. Paired Student's t-test was used to compare the number of labeled cells within the same time period and results were considered significantly different at p<0.05. The mean number of positive cells per area unit between time periods was compared by variance analysis and statistical differences were checked by the Bonferroni test. The x2 test was used to compare the proportion of β7 +/IgA+ -labeled cells between the lactation stages. Variation in the number of labeled cells or in stained area at a given developmental stage was analyzed by linear regression using GraphPad Prism 2.01 software (GraphPad Software; San Diego, CA). The rates of variation between HR and vascular addressins were compared by F-test on the slopes of regression lines. Correlation between two HR was performed by Spearman test, whatever the stage.
Results
General Architecture of the Developing MG
The MG of virgin mice is mainly composed of fatty tissue and a highly organized system of ducts with terminal end buds that are the major sites of growth and lateral buds (Figure 1A). Vascularization is mainly located in the fatty tissue, with some capillary vessels around the epithelial cells.
Development and differentiation of the gland take place during pregnancy and lactation. The lateral buds differentiate and subdivide progressively during pregnancy, giving rise to small alveolar buds (P4, Figure 1B). The mammary alveoli start to form larger alveolar lobules (P12, Figure 1C). A rapid increase in the number and size of alveoli and a decrease in fatty tissue occur during the second half of pregnancy, resulting in the development of fully differentiated secretory lobules (P19, Figure 1D). The lobule, the secretory unit of the MG, consists of a cluster of alveoli around the single small duct. The alveolar wall is a single layer of epithelial cells (Figure 1D and 1E). The morphological changes are minimal during lactation, and the glandular epithelium alveoli continue to predominate over fat cells (Figure 1E). The MG reduces after weaning owing to loss of alveolar tissue, and the fatty tissue content correspondingly increases (Figure 1F).
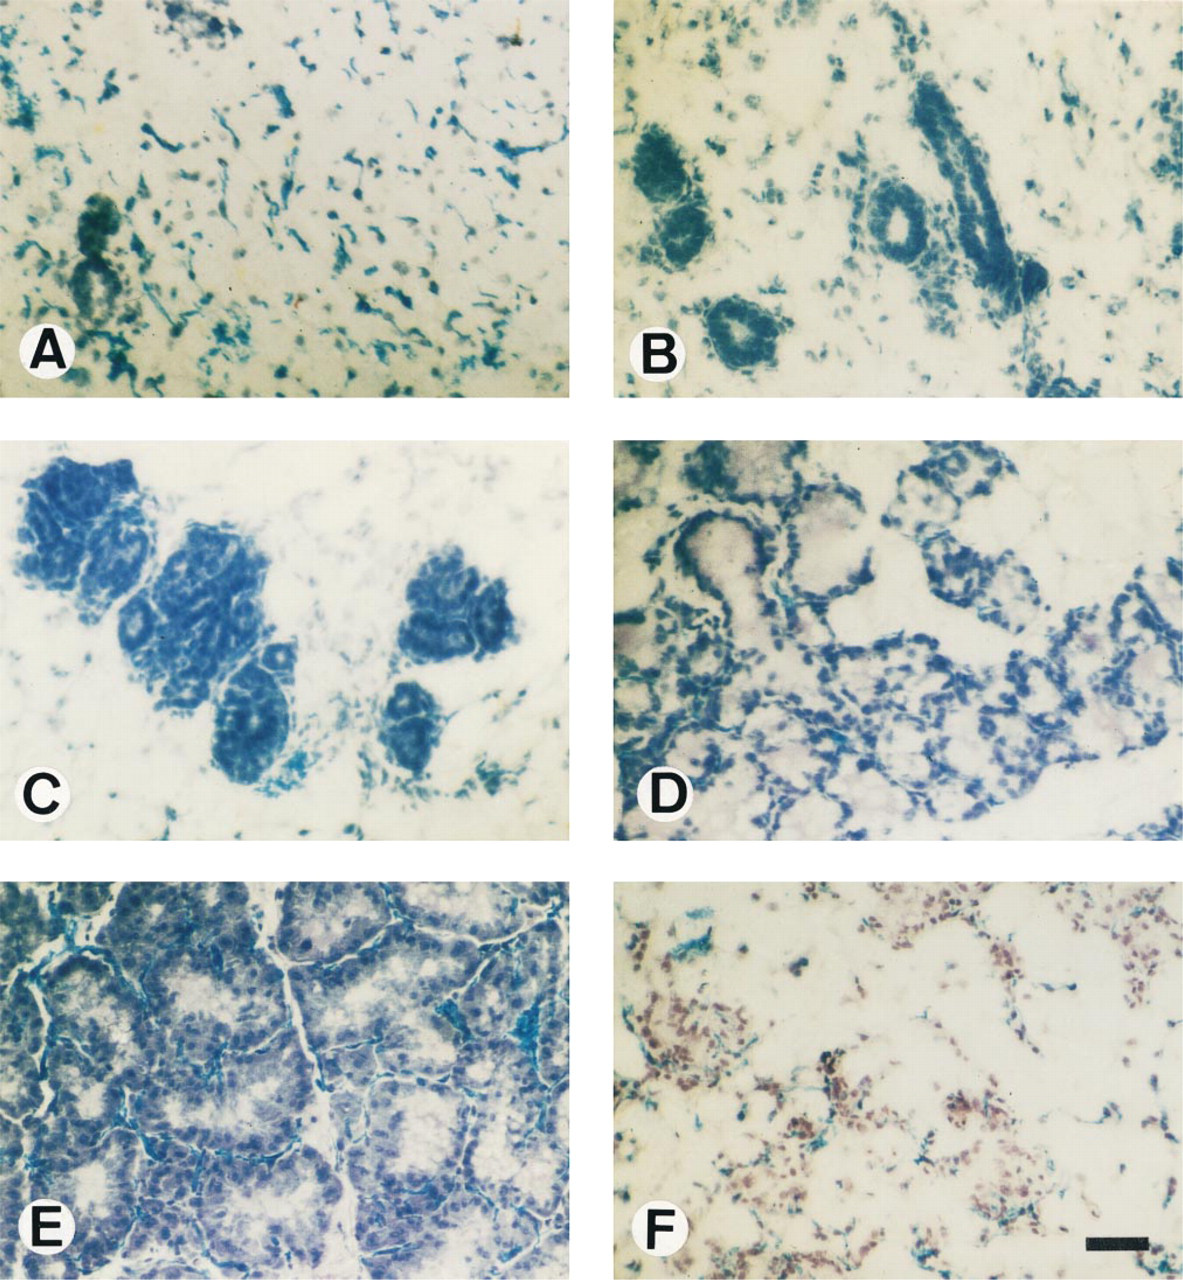
Lobuloalveolar and extensive growth of alveolar epithelial cells during the stages of development of MG: the picture is representative of the area of one single microscopic field as observed at × 25 objective and X10 eyepiece. Cryosections were made from MG that had been removed from virgin mice (A), pregnant mice at Day 4 (P4, B), P12 (C) and P19 (D), lactating mice at Day 4 (L4, E), and mice 4 days after weaning (F). (A) A field showing mainly vascularized fatty tissue with ductal and terminal end buds. (B,C) Fields show development of alveolar bud. (D,E) Differentiated alveoli with a single layer of secretory epithelial cells and spherical fat globules in the alveolar lumina. (F) After weaning, fatty tissue increases and alveolar tissue decreases. Cryosections counterstained with hematoxylin, representative of three mice. Bar = 62.5 μm.
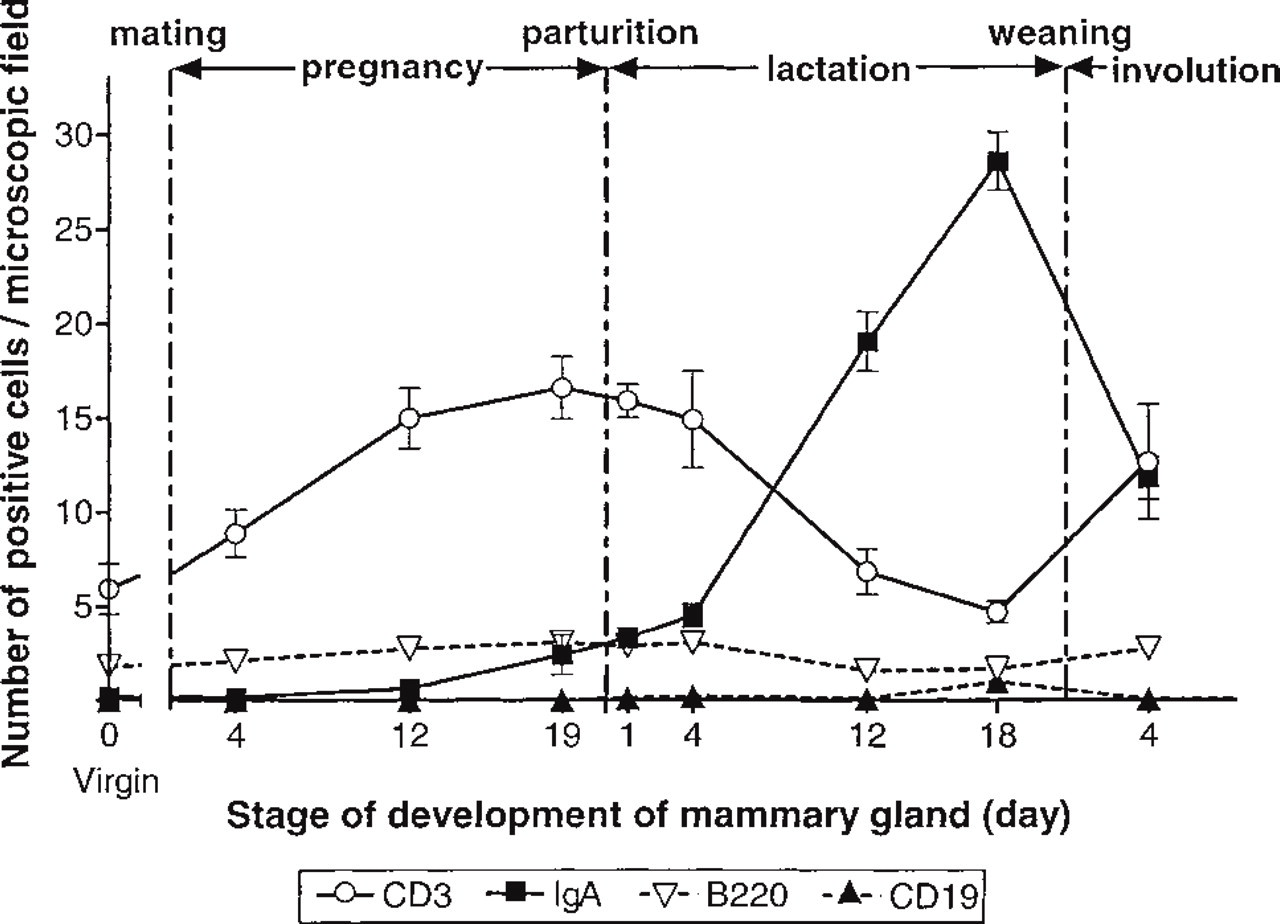
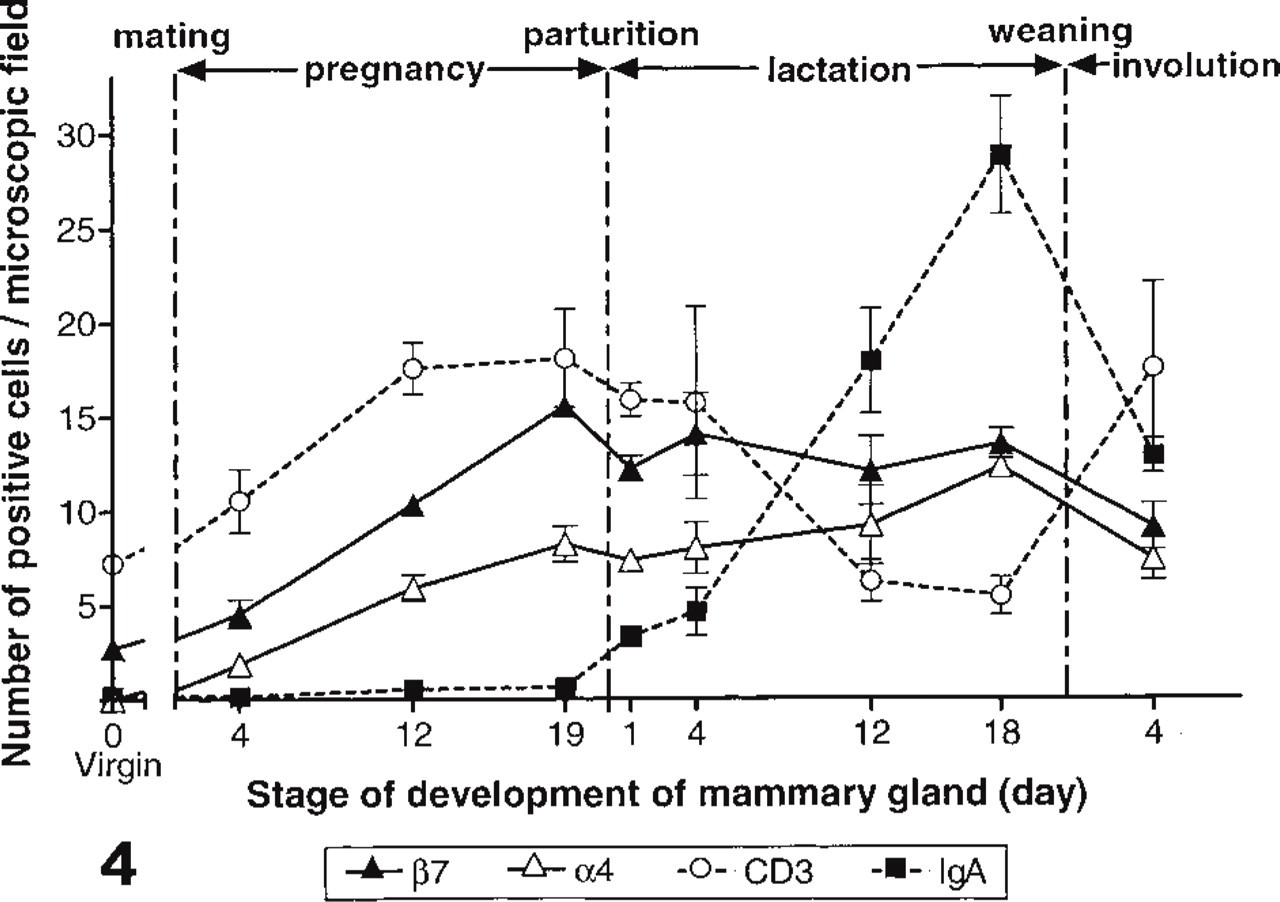
Kinetics of T- and B-lymphocyte colonization in the MG (fourth pair) from the virgin stage through pregnancy, lactation, and involution. The results represent the mean number of positive cells ± SEM per field (0.26 mm2) (CD3 and c-IgA, n = 6; CD19 and CD45R/B220, n = 3).
Natural Recruitment of Lymphocytes in Mouse MG from the Virgin Stage and During Pregnancy, Lactation, and Involution
Kinetics and Localization of T- and B-Lymphocytes. Immunohistochemical analysis of MG for various cell surface antigens showed inverse patterns of T- and c-IgA+ B-lymphocytes during pregnancy and lactation, respectively (Figure 2). The number of CD3+ T-cells per microscopic field increased linearly during pregnancy, from six in virgin mice to a peak value of 17 CD3+ cells at Day 19 of pregnancy (P19) (p<0.01). It then decreased rapidly during lactation to a value not significantly different (p>0.05) from that of virgin mice at Day 12 of lactation (L12), and increased again significantly (p<0.05) in involuting MG.
The numbers of CD19+ and B220+ B-cells did not vary during pregnancy and lactation, amounting to 0.2 and 2.5 cells per field, respectively (Figure 2). As expected, in control tissues there were high numbers of these cells in the B-follicles of Peyer's patches, mesenteric and MG lymph nodes, but a low number in the gut lamina propria (not shown).
The number of c-IgA+ cells increased slightly in late pregnancy and early lactation, i.e., from 0.6 at P12 to 4 at L4 (slope significant, p<0.01), then increased abruptly during lactation to a peak value of 29 cells at L18 (p<0.001). In mid (L12) and late (L18) lactation, c-IgA+ cells were approximately three and six times more abundant than T-cells, respectively. Four days after removal of the suckling pups, the number of c-IgA+ cells decreased abruptly, from 29 to 12 (p<0.001).
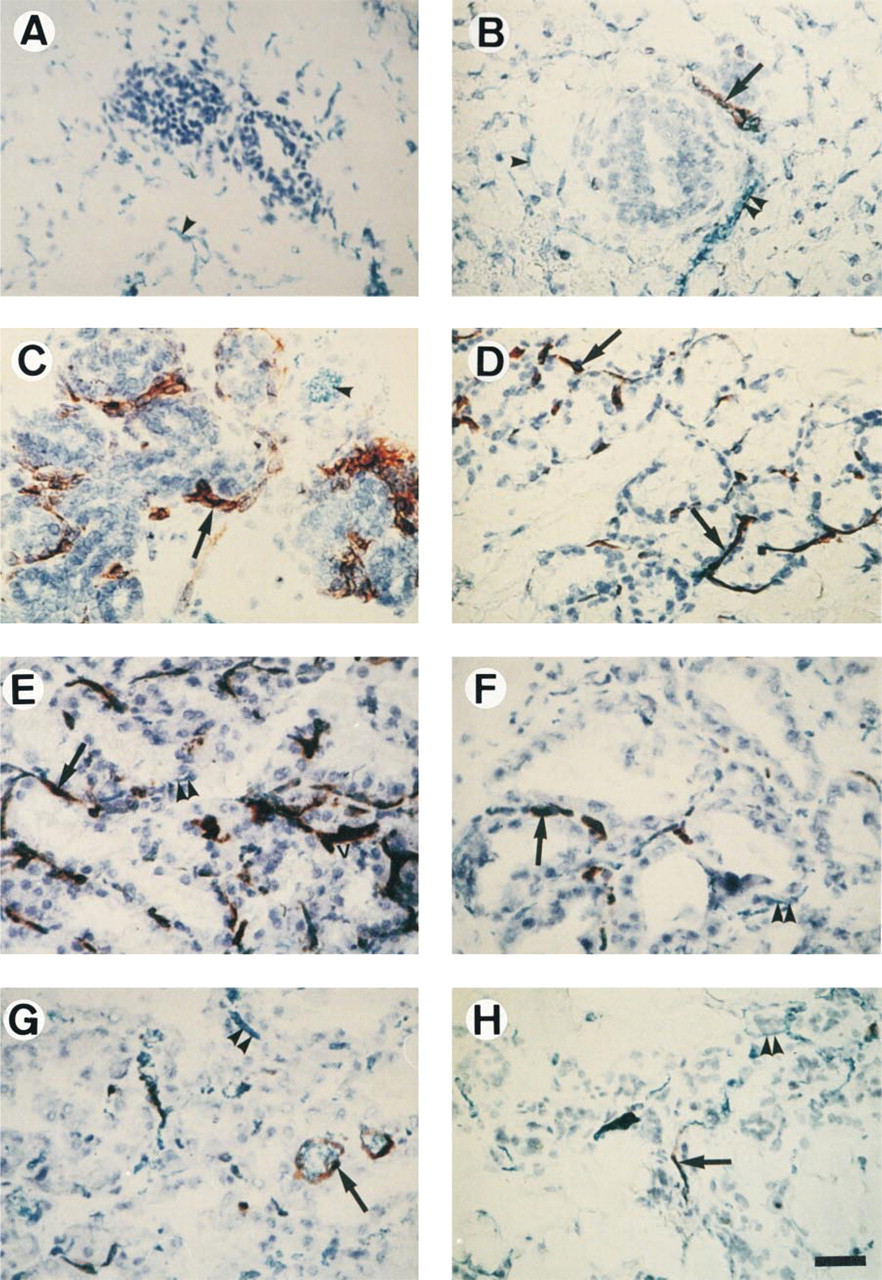
Studies of tissue localization (Figure 3A) showed that the majority of CD3+ T-cells were scattered in the epithelium of ducts (virgin), buds (pregnancy), and alveoli (lactation), with some in the connective tissue between the epithelium and the walls of underlying blood vessels but never in fatty connective tissue. The c-IgA+ plasmablasts were observed crossing blood vessel walls at the confluence of several alveoli and were never found in the epithelial layer, in contrast to CD3 + cells. The plasma cells were located in perialveolar connective tissue (Figure 3D) near the confluence of several alveoli. They were dispersed in early lactation, then arranged in single file along capillaries in mid- and late lactation, but never in clusters at any stage. Using morphological criteria (Figure 3E), the c-IgA+ B-cells comprised ∼30% plasmablasts and ∼70% mature plasma cells.
Even in perialveolar connective tissue, the CD3+ and c-IgA+ cells were not found in close association when observed by c-IgA/CD3 double immunostaining (not shown).
It therefore appears that the MG tissue is mainly colonized at specific locations by T-cells during pregnancy and by mature B-cells, B220−/CD19−/c-IgA+ plasmablasts/plasma cells, during mid- and late lactation.
Expression of Homing Receptors of T- and B-Lymphocytes. Colonization of MG may result from differential expression of peripheral or mucosal HR on T- and B-lymphocytes. Among the peripheral HRs, no L-selectin+ lymphocytes were detected in the MG at any stage of its development, whereas they were present in secondary lymphoid tissues (not shown). In contrast, the α4 and β7 integrin subunits of the mucosal HR were expressed on a variable fraction of MG lymphocytes, depending on the developmental stage of the MG (Figure 4), a feature that was confirmed by morphological analysis.
During pregnancy, the number of β7
+ cells and CD3+ cells per field increased at the same rate (slopes not significantly different; p>0.05) and had a similar tissue localization (Figure 3A and 3B), suggesting a co-expression of β7 and CD3. However, the number of β7
+ cells was lower than that of CD3+ cells. Because very few B-cells were present during pregnancy (Figure 2), the constant difference (CD3+ - β7
+) of ∼5 cells per field corresponds to CD3+/β7
− cells, which probably represent the same cells as those already present in MG before pregnancy. During lactation, the number of β7
+ cells remained fairly constant (slope not significant), in contrast to the number of CD3+ and c-IgA+ cells. It could be seen (Figure 4) that during mid- (L12) and late (L18) lactation, the numbers of β7
+ cells were intermediate between those of CD3+ and c-IgA+ cells, i.e., ∼13 cells per field. Because β7
+ cells outnumbered CD3+ cells during this period, β7 integrin could be present on cells other than CD3+ cells, such as c-IgA+ cells. To confirm this hypothesis, we performed double β7 and IgA immunostaining. We observed proportions of β7
+/c-IgA+ labeled cells at L4, L12, and L18 which were not significantly different (x2; p>0.05), averaging 30 ± 3% (n = 3) (Table 1). Moreover, morphological examination showed that most of the β7
+/c-IgA+ -labeled cells (Figure 3G compared to 3F) appeared to be plasmablasts. We can therefore conclude that the β7 integrin is co-distributed on CD3+ and on c-IgA+ cell plasmablasts during lactation. During pregnancy, the numbers of α
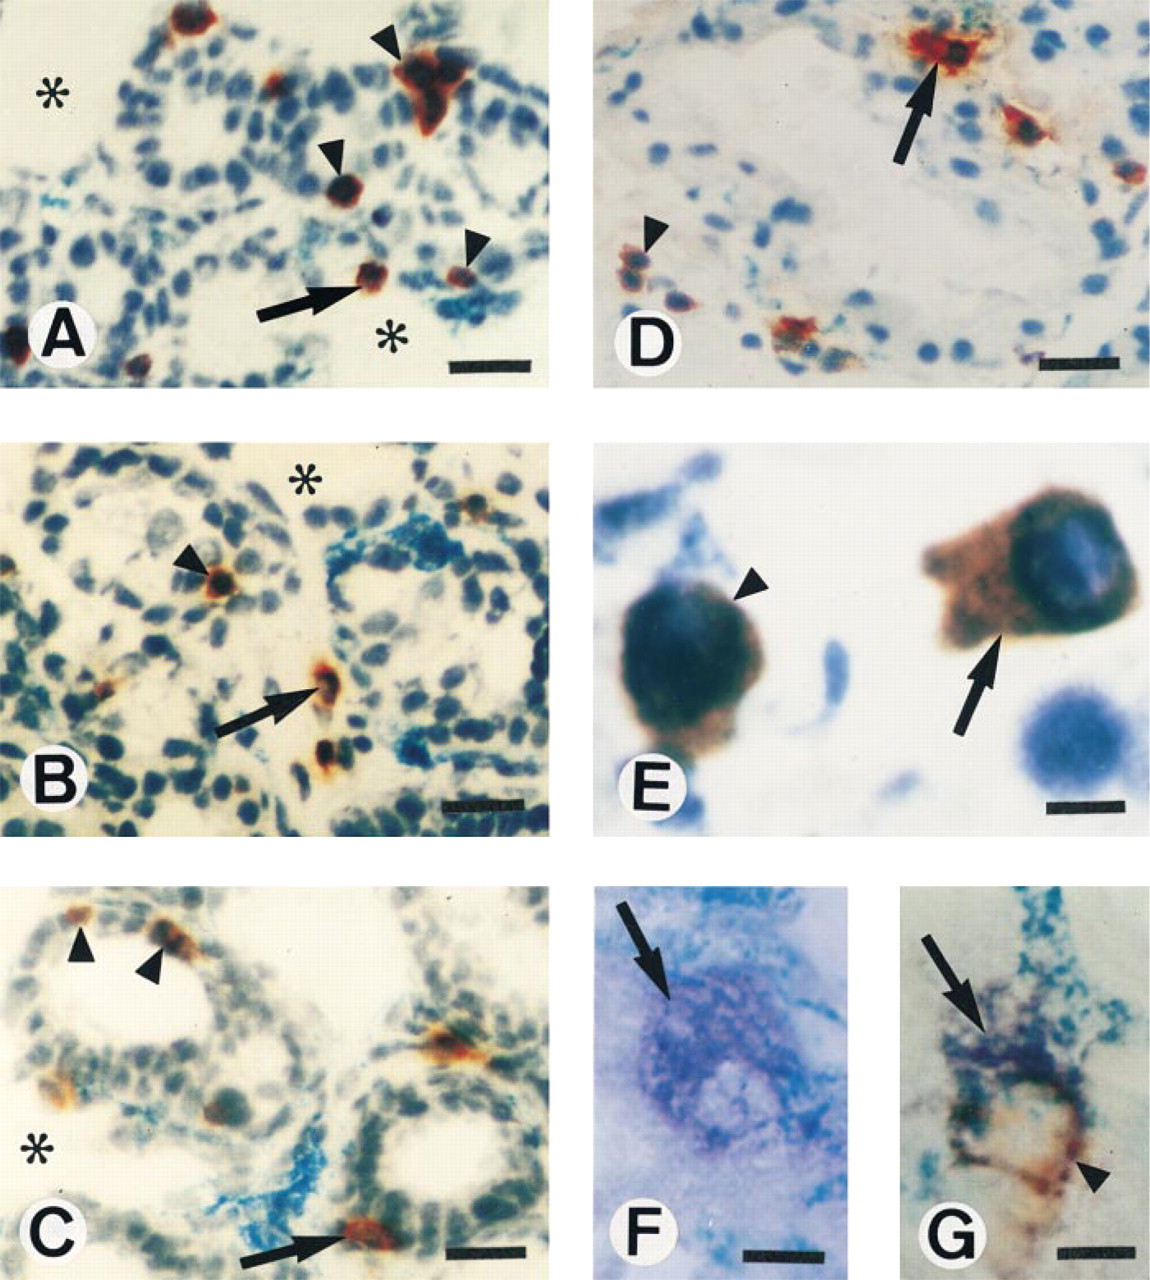
Tissue oca ization of CD3+ (A), β7 + (B), αE + (C), c-IgA+ (D-F), and morphology of double β7 +/c-IgA+ cells (G) in developing MG at P12 (A-C) and L18 (D-G). CD3+, β7 +, and αE + cells were localized in the epithelial layer (arrowheads) or in the subepithelial tissue (arrow); note their absence in the fatty connective tissue (asterisks). (D) c-IgA+ plasma cells were localized in close association with epithelium of alveoli (arrow) in contrast to c-IgA+ plasmablasts (arrowhead). (E) Two morphologies for c-IgA+ cells, plasma cell (arrow), and plasmablast (arrowhead). Note in F a plasma cell expressing c-IgA (arrow, blue cytoplasmic staining), whereas in G a c-IgA+ plasmablast co-expressing the β7 integrin (arrow, blue cytoplasmic staining for IgA; arrowhead, red surface staining for β7) is located within the wall of Lukonyl blue-stained blood vessels. Immunoperoxidase (A-E) and alkaline phosphatase (F,G) cryosections counterstained with hematoxylin, except in E and F. Bars: A-D = 25 μm; E-G = 6 μm.
In contrast with the situation seen during lactation, Figure 4 shows that the number of β7 + cells significantly decreased (p<0.05) in involuting MG compared to the number of CD3+ cells.
We next researched which α-chain type (α4 or αE) was associated with β7 in the HR αβ heterodimer.
Evaluation of the expression of β7 +, c-IgA+ and double β7 +/c-IgA+ cells in MG at various days of lactation
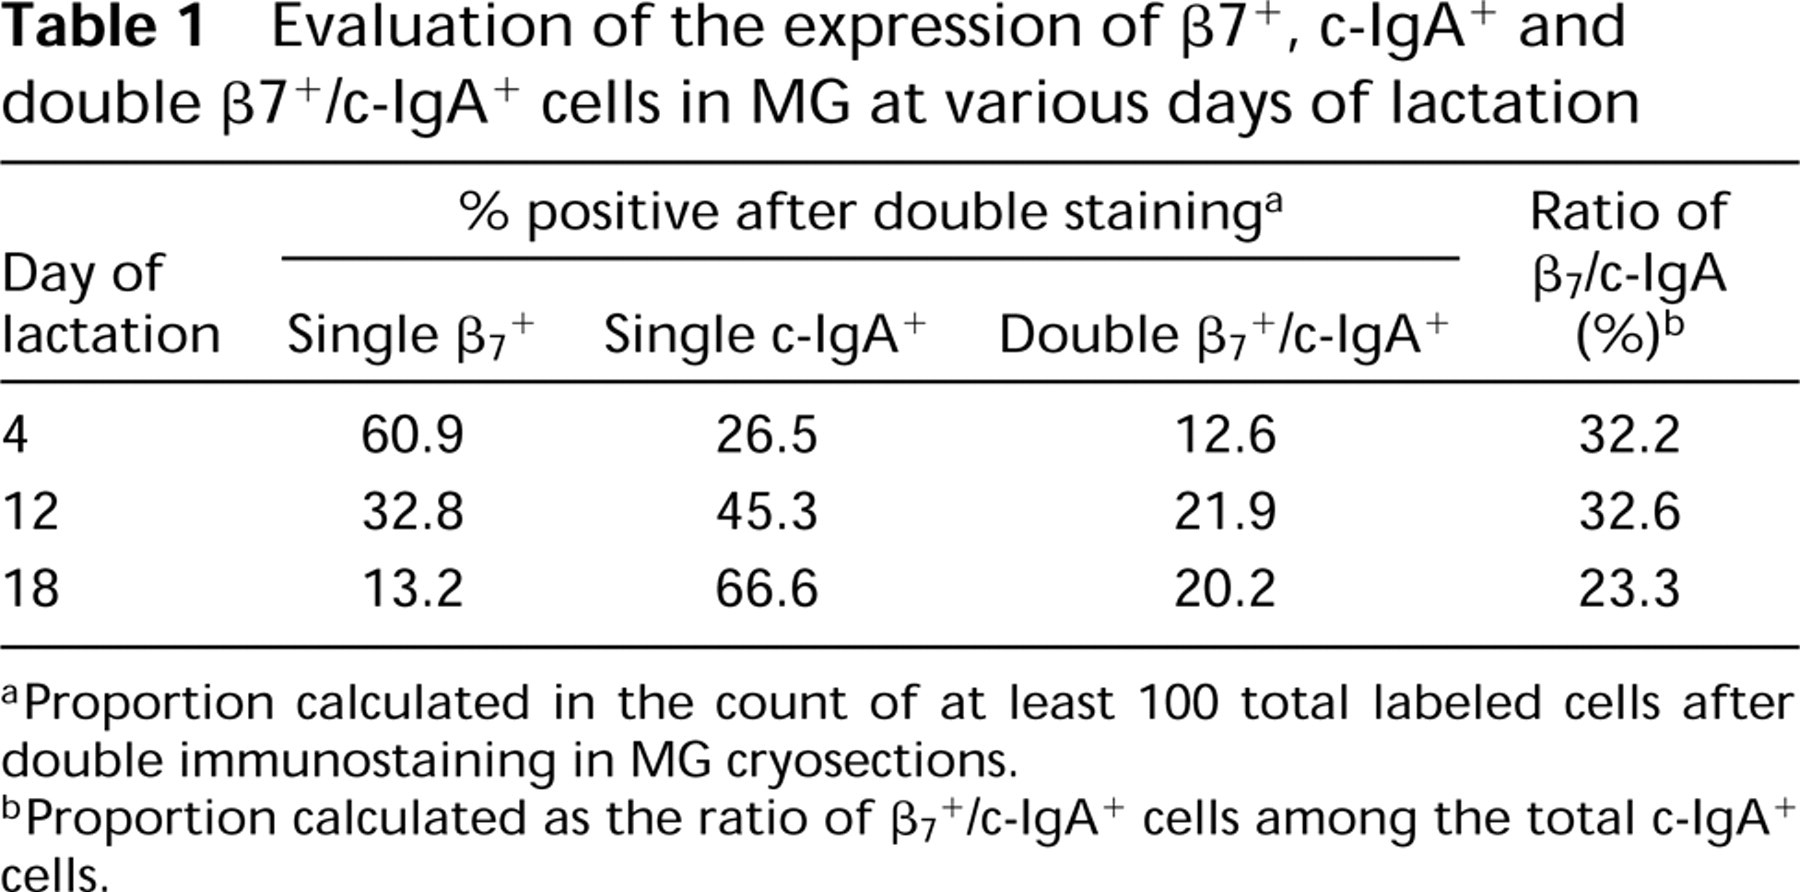
aProportion calculated in the count of at least 100 total labeled cells after double immunostaining in MG cryosections.
bProportion calculated as the ratio of β7+/c-IgA+ cells among the total c-IgA+ cells.
Kinetics of lymphocytes bearing β7 or α4 integrins in the MG from the virgin stage through pregnancy, lactation, and involution. Results represent the mean number of positive cells ± SEM (n = 3) per field (0.26 mm2). Dashed lines show the evolution of CD3+ and c-IgA+ lymphocytes in the MG of the same mice.
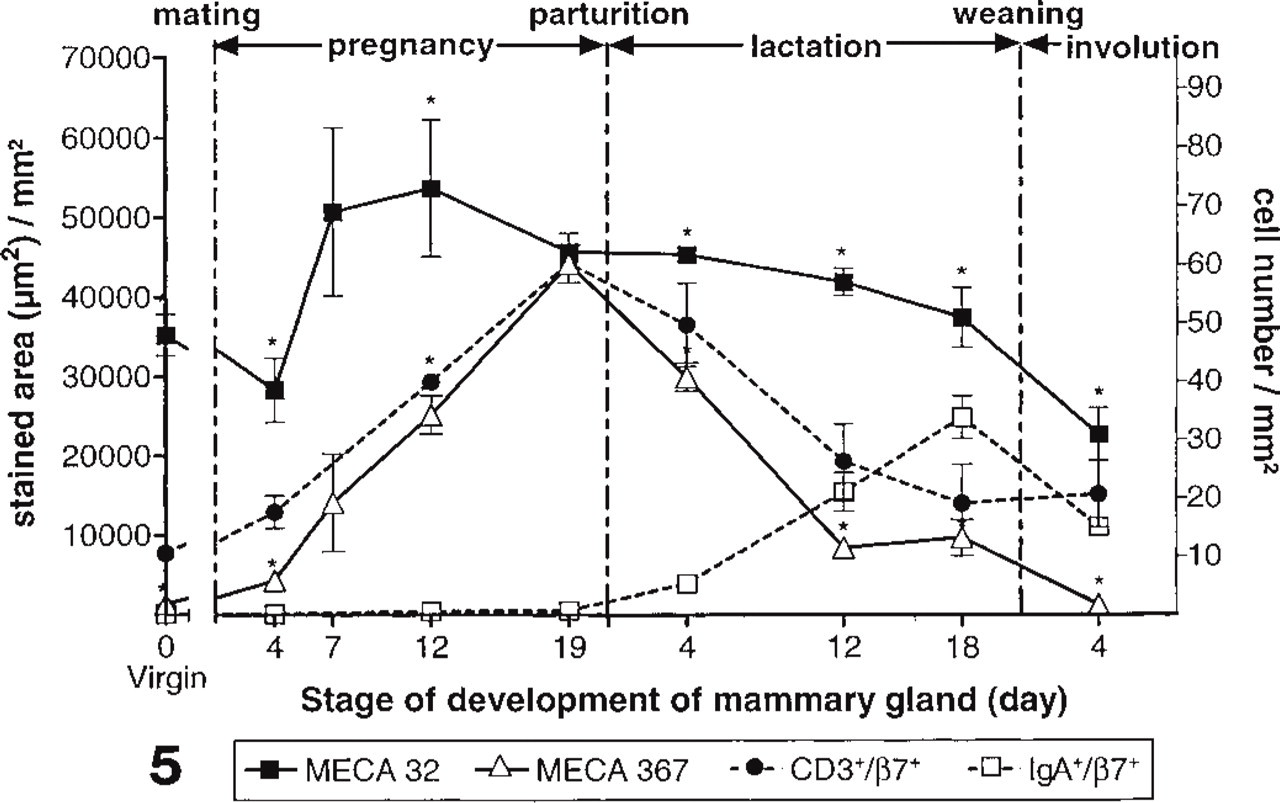
Kinetics of MECA 367 (anti-MAdCAM-1)- and MECA 32-stained area at stages of development of MG. Results represent the means of MECA 367- and MECA 32-stained vascular endothelium cell area (μm2) ± SEM per mm2 of MG (parenchyma and fat pad), evaluated on two adjacent histological sections (n = 2–3). The kinetics of β7 +/c-IgA+ cells and β7 +/CD3+ cells per mm2 of tissue sections are superimposed (scale on right), calculated as follows: by double immunostaining, number of β7 +/c-IgA+ cells were found to represent 30% of number of c-IgA+ cells (see text) and number of β7+/CD3+ cells was calculated as the difference between β7 + cells and the preceding number of β7 +/ c-IgA+ cells. ∗ Significant differences between MECA 367 and MECA 32 (p<0.05) by paired Student's t-test at the same time point.
Vascular Addressins in MG and Lymphoid Organs from the Virgin Stage and During Pregnancy, Lactation, and Involution
Because the transendothelial migration of cells from the blood to the tissues is critically influenced by the presence of vascular addressins, we examined MG sections to look for the presence of peripheral lymph node addressin (PNAd), MAdCAM-1, and VCAM-1, the counterreceptors of L-selectin, α4β7, and α4β1, respectively.
Morphometric analysis of areas stained with mouse endothelial cell antigen 32 (MECA 32), an MAb that recognizes an antigen expressed by most endothelial cells (Hallmann et al. 1995), revealed (Figure 5) an increase in vascular area density from P4 to P19 (p<0.05), then a slow but significant decrease (17%) during lactation (slope = −396 ± 139; p<0.05) and a further decrease during involution to return to a value not significantly different from the virgin basal level (p>0.05). These results are in agreement with the reports on developing vascularization in the rat MG (Yasugi et al. 1989).
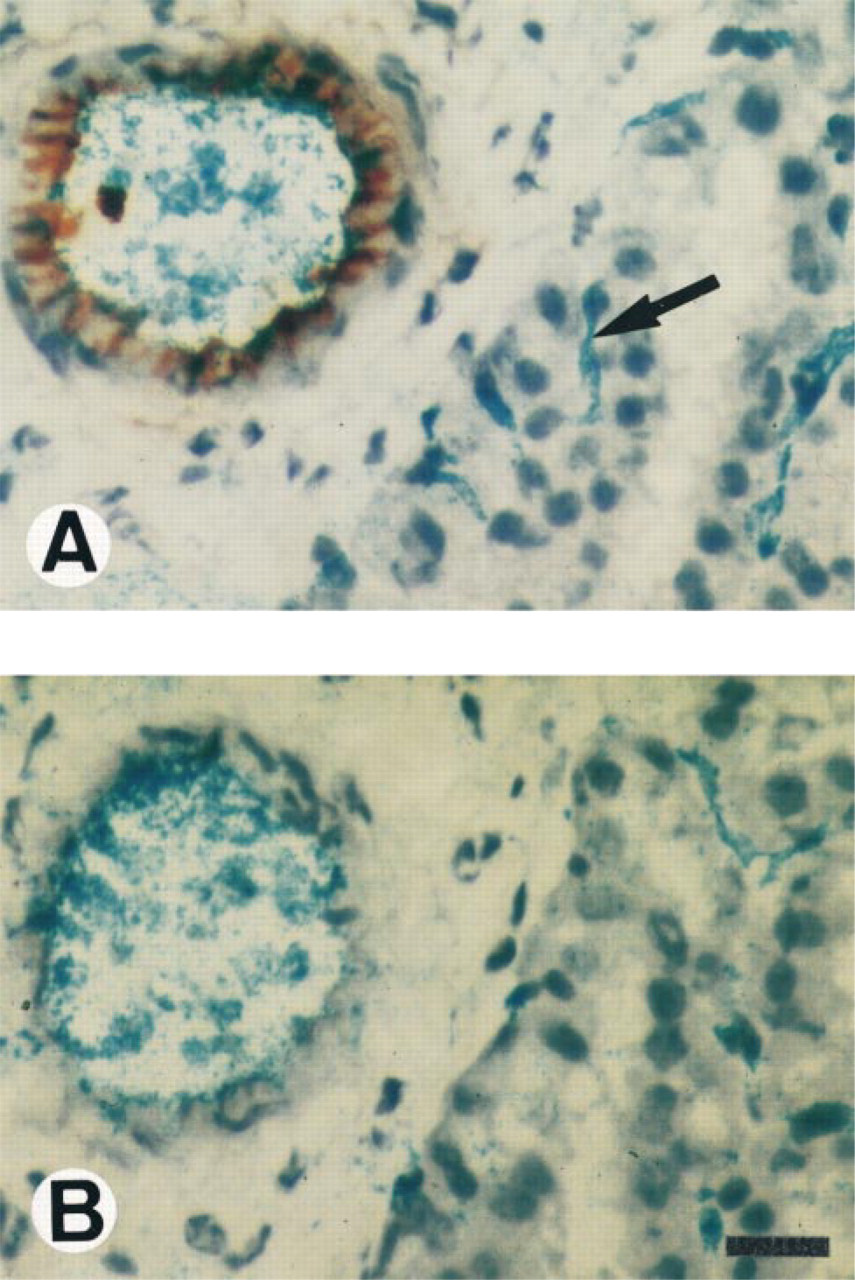
Approximately 4% of the endothelium area stained by MECA 32 was also stained by MECA 367, an anti-MAdCAM-1 MAb, in virgin mice (Figure 5). This basal level of MAdCAM-1 expression was occasionally present (one microscopic field of four) on endothelial cells of venules adjacent to epithelial ducts but was never found on fat pad blood vessels (Figure 6A).
During pregnancy there was a linear increase in the MAdCAM-1-stained area (slope = 2612 ± 214) with a maximum at P19, reaching the same value as MECA 32 (p>0.05) (Figure 5). This increase in stained area included not only a higher proportion of MAdCAM-1+ endothelial cells in close contact with epithelial cells, from ∼50% at P4 (Figure 6B) to almost every cell at P12, but also an increase in extent of endothelial cell staining, both luminal and cytoplasmic (Figure 6C). A decrease in stained area (Figure 6D) could be expected at P19 due to the stretching of the blood capillaries. However, it was compensated for by the decrease of fatty tissue whose vessels never expressed MAdCAM-1. Therefore, at the end of pregnancy all blood vessels were associated with alveoli, so that almost all endothelial cells in the whole MG section expressed MAdCAM-1. In conclusion, the increase in MAdCAM-1 staining during pregnancy resulted mainly from an increased proportion of positive cells on increased vascularization.
MAdCAM-1 expression on endothelial cells of blood vessels in the developing MG. Cryosections were made from MG that had been removed from virgin mice (A), pregnant mice at Day 4 (P4, B), P12 (C), and P19 (D) and lactating mice at Day 4 (L4, E), L12 (F), and L18 (G), and from mice 4 days after weaning (H). (A-C) Epithelial buds surrounded by a fat pad whose blood vessels are devoid of MAdCAM-1 (single arrowhead). In pregnancy (B-D), the increase in MAdCAM-1 expression was observed on capillaries in contact with epithelial cells (arrows); note in B about half of the Lukonyl blue-stained blood vessels around a bud negative for MAdCAM-1 staining (double arrowheads). (E) A field showing, in addition to capillaries, the presence of MAdCAM-1 on venules (v). In lactation, MAdCAM-1 expression decreases in length around alveoli (E-F, arrows) with correlative reappearance of Lukonyl blue in the vessels (E-H, double arrowheads) but remains on a few medium-sized blood vessels (G, arrow). In involution, a low expression of MAdCAM-1 could be observed around some disrupted alveoli (H, arrow). Immunoperoxidase cryosections counterstained with hematoxylin, representative of three mice. Bar = 38.5 μm.
In early lactation (Figure 5), there was a decrease of 80% in the MAdCAM-1-stained area, which was sharper than that of MECA 32 (8%) (respective slopes −2547 ± 197 and −268 ± 186; p<0.0001). In mid(L12) and late lactation (L18), we observed a steady level (p>0.05) of 20% of maximal MAdCAM-1 expression that was still six times higher than the virgin value (p<0.01). Concomitantly with MECA 32, MAdCAM-1 expression further decreased in involuting MG to return to the virgin basal level (p>0.05). Figures 6E-6H show that the decrease in the extent of MAdCAM-1 staining during lactation is a result of a lower number of positive vessels, the loss of staining occurring from capillaries around the alveoli (Figure 6E and 6F) to the medium-sized blood vessels (Figure 6G) to persist slightly on some capillaries near the remnants of some alveoli (one microscopic field of five) for 4 days after weaning (Figure 6H).
Interestingly, blood vessels of MG as well as those of the gut lamina propria were consistently free of MECA 79 staining, an anti-PNAd MAb (not shown). Furthermore, in inguinal lymph node (LN) contained in MG, no MAdCAM-1 + endothelial cells were observed in spite of the increase in PNAd concomitant with the increase in LN high endothelial venule (HEV) size. It has been recognized that α4β7 binds to VCAM-1 (Yang et al. 1998). However, staining for VCAM-1 was not observed on capillaries, irrespective of the developmental stage of the MG, but it was observed on some large blood vessels (Figure 7) which were, however, not surrounded by any lymphocytes (not shown). On the other hand, and in spite of the cutaneous origin of MG (Linzell 1959), no E-selectin was detected on endothelial cells.
In conclusion, among the vascular adhesion molecules studied, only the mucosal addressin MAdCAM-1 was present in MG, with maximal expression in late pregnancy, followed by a rapid decrease during early lactation to a steady level in mid- and late lactation, and the involution was characterized by a decrease both in the length of MAdCAM-1-positive blood vessels and in the number of blood vessels.
Comparative Evolution of the Lymphocytes Bearing HR and MAdCAM-1 Expression in MG during Developmental Stages
Extravasation of lymphocytes from the blood into tissues occurs as a process involving the spatial and temporal interactions of HR with vascular addressins. We compared the kinetics of the amount of MAdCAM-1-stained area with those of the numbers of β7 +/CD3+ and β7 +/c-IgA+ cells, whose values were adjusted to the same unit area (Figure 5).
The rate of increase in numbers of β7
+/CD3+ cells during pregnancy was similar to that of MAdCAM-1 expression (respective slopes of 2082
Conversely, the number of β7 +/c-IgA+ cells increased (slope = 1248 ± 129) during lactation, in contrast to MAdCAM-1 expression, which decreased (slope = −1893 ± 244) during the same period. We thus observed a ratio of β7 +/c-IgA+ cells per 1000 μm2 of MAdCAM-1 staining, which increased from 0.2 at L4 to a maximum of 3 at L18. After weaning, both β7 +/c-IgA+ cells and MAdCAM-1 density decreased at the same rate (common slope of −1942).
Discussion
Our results extend the inverse pattern of CD3+ T- and c-IgA+ B-lymphocytes seen in the rat (Parmely and Manning 1983) to the mouse, and confirm the large increase in number of c-IgA+ cells during lactation in the mouse (Weisz-Carrington et al. 1977). We also confirmed the presence of MAdCAM-1 in lactating MG (Streeter et al. 1988a; San Gabriel-Masson 1992) and added the new finding of its greater expression during pregnancy. The observed correlation of its expression with developmental stages of the MG suggests hormonal regulation. Indeed, the increased expression of MAdCAM-1 that we observed during pregnancy, when estrogen was predominant (Jacquet et al. 1977), and the presence of an estrogen response element in the MAdCAM-1 gene (Sampaio et al. 1995), are both consistent with estrogen control of MAdCAM-1 expression. Moreover, the absence of MAdCAM-1 in fatty tissue blood vessels and its presence in close association with epithelial cells suggest regulation by factors derived from epithelial cells.
We extend to pregnancy the report on the absence of MECA 79 staining on lactating MG blood vessels (Streeter et al. 1988b), indicating that the MAdCAM-1 molecule does not present the sulfate-modified carbohydrate required to interact with L-selectin. This is consistent with the absence of L-selectin+ lymphocytes in the MG in our study. This absence indicates that the MG recruits either activated/memory lymphocytes or naive lymphocytes which should be activated in situ, leading to downregulation of L-selectin. However, there is no a priori reason to suspect an antigenic stimulation in situ because the MG develops in pregnancy in a sterile environment. On the other hand, the conclusion concerning the absence of naive cells in MG agrees with the observation that naive lymphocytes never cross flat endothelium (Mackay 1991; Butcher 1999). The MG thus recruits activated/memory T-cells (Chao et al. 1997), and this fits well with the proposal that naive T-lymphocytes recirculate from the blood to lymph, whereas activated/memory T-lymphocytes recirculate through the tissues (Mackay et al. 1992).
Morphological criteria, the absence of L-selectin, and the low proportion of CD19 and B220 markers on B-cells indicate that the MG recruits plasmablasts/ plasma cells (Krop et al. 1996; Smith et al. 1996), which have been shown here to express c-IgA. Our observation of plasmablasts crossing the endothelium is consistent with the fact that the ability of lymphocytes to migrate from the mesenteric LN to the MG is restricted to dividing cells, i.e., lymphoblasts (Roux et al. 1977). Our results show that the majority of mature plasma cells are devoid of α4β
Our findings of similar spatial and temporal relationships between the amount of MAdCAM-1-stained area (i.e., the number of stained endothelial cells per unit area) and the number of β7
+/CD3+ cells are consistent with the proposal that MAdCAM-1 is responsible for T-cell recruitment in the MG. This is substantiated by the decrease in number of α4β7
VCAM-1 expression on endothelial cells of large blood vessels in the developing MG at L-12. Note in A VCAM-1 expression on arteriole and its absence on capillaries of MG (arrow). Note in B the absence of MG staining treated with isotype-matched negative control MAb. Immunoperoxidase cryosections counterstained with hematoxylin, representative of any stage. Bar = 25 μm.
There are several hypotheses to explain the increased recruitment of c-IgA+ cells specifically during lactation. At first sight, the inverse pattern of T- and c-IgA+ blast kinetics suggests competition to homing in the MG. However this explanation is unlikely, first because our results showed that T- and c-IgA+ -cells had different locations in the MG, and second because other authors found that no competition could be demonstrated between [125 I]-iododeoxyuridine-labeled T- and B-cell homing in the gut (McDermott et al. 1986). Moreover, because we did not find clusters of plasma cells or cells in mitosis, we can also exclude increased B-cell proliferation, in agreement with results obtained in the rat MG (Parmely 1985). The simultaneous decrease of MAdCAM-1 and β7 +/c-IgA+ after weaning, together with their absence in virgin mice, is consistent with the role of MAdCAM-1 for extravasation of β7 +/c-IgA+ blasts. However, the increase in number of c-IgA+ blasts that we observed during lactation, which was not related to corresponding change in MAdCAM-1 expression, suggests that the recruitment of c-IgA+ blasts involves a contributing factor with the following properties, (a) secreted during lactation and (b) specific to B-cell extravasation/ retention. This is reminiscent of a chemoattractant (Butcher and Picker 1996), probably of epithelial origin and found in the milk, which is selectively chemotactic for mesenteric LN IgA+ B-cells and inactive towards inguinal LN cells (Czinn and Lamm 1986). Similarly, we showed the chemotactic activity of a β-casein derivative on B-lymphoblasts (Fronteau et al. 1998). It is not known if such a chemoattractant exerts its effects while being expressed on the endothelial surface. Our results concerning the location of β7 +/c-IgA+ plasma-blasts at the confluence of several alveoli again support the view of a chemoattractant reaching its highest concentration in this zone of confluence. On the other hand, the increase in β7 +/c-IgA+ plasmablast homing to lactating MG might be explained by the increase in chemokine production to peak at the end of lactation when pups suckle more milk than during the first days of lactation. Such a factor would be expected to be synthesized under the control of lactogenic hormones, which are involved in the homing of c-IgA+ blasts in the MG (Weisz-Carrington et al. 1978).
In conclusion, our results suggest that a common mechanism is set in place to recruit both T- and c-IgA B-cells via the MAdCAM-1
Footnotes
Acknowledgements
Supported by grants from the Institut National de la Recherche Agronomique and Conseil Régional du Centre.
We thank Drs D. Marc and P. Velge for review of the manuscript, Dr C. Taragnat for technical assistance in quantitative image analysis, Dr C. Kieda (CNRS; Orleans, France), and Dr P. J. Kilshaw (AFRC Babraham Institute; Cambridge, UK) for generously donating MAbs, and H. Leroux for animal care.