
Abstract
We raised a polyclonal antibody against a decapeptide corresponding to the carboxyl terminus of the rat angiotensin II AT1 receptor. This antibody was demonstrated to be specific for the rat receptor according to a number of approaches. These included (a) the ultrastructural localization of immunogold-labeled receptor on the surfaces of zona glomerulosa cells in the adrenal cortex, (b) the specific labeling of Chinese hamster ovarian (CHO) cells transfected with AT1 receptors, (c) the identification of a specific band on Western blots, (d) the immunocytochemical co-localization of angiotensin receptors on neurons in the lamina terminalis of the brain shown to be responsive to circulating angiotensin II, as shown by the expression of c-fos, and (e) the correlation between the expression of the mRNA of the AT1 receptor and AT1 receptor immunoreactivity.
Keywords
T
The anatomic localization of Ang II receptors and their subtypes in the brain (Mendelsohn et al. 1984; Rowe et al. 1990; Song et al. 1992), kidney, pituitary, and adrenal (Zhuo et al. 1995) has been greatly facilitated in the past decade through in vitro autoradiographic methods utilizing radioactively tagged antagonist analogues such as (125I [Sar1, Ile8])-Ang II, used alone or in conjunction with unlabeled peptide antagonists, to differentiate the distributions of AT1 and AT2 receptors. These approaches have been paralleled by the anatomic identification of mRNAs for these receptors (Bunnemann et al. 1992; Lenkei et al. 1995). The clear limitation of autoradiographic studies to localize receptors is one of resolution. Typically, such experiments involve unfixed, frozen sections and radioactive labels, and therefore are relatively incompatible with cellular and subcellular resolution and prohibit the co-localization of other peptides, enzymes, or neurotransmitters. To further our studies of the role of Ang II, particularly in pathways in the brain that mediate fluid and electrolyte homeostasis and control of blood pressure, we required an antibody to the pep-tide receptor that would offer high resolution, specificity and compatibility with other techniques. To this end, we raised antibodies that bind to the AT1 receptor for use in immunocytochemistry at both the light and electron microscopic levels. Although similar antibodies have been produced recently, none, to our knowledge, has been sufficiently well characterized to allow detailed anatomic studies. The antisera described here have been utilized to show the distribution of AT1 receptor in the brain and adrenal gland (at both the light and the electron microscopic level) and the localization of receptors specifically on neurons sensitive to blood-borne Ang II, as shown by their elevated content of Fos protein after treatment with the β-adrenergic agonist isoproterenol, a stimulus known to increase blood Ang levels resulting from increased renin secretion.
Materials and Methods
Peptide Synthesis and Antibody Production
The decapeptide corresponding to the carboxyl terminal sequence of the rat AT1A receptor (Murphy et al. 1991) was synthesized by the Boc method and purified by high-performance liquid chromatography (HPLC). The peptide has an amino-terminal Lys residue (KKPASCFEVE) and this was used to conjugate the peptide to keyhole limpet hemocyanin using glutaraldehyde (Rondeau et al. 1990). Antibodies were raised by injecting the equivalent of 0.1 mg of peptide per injection into each of five rabbits at 4-week intervals. Bleeds were taken from the ear vein and the serum tested for antibodies to the peptide by dot-blot analysis.
AT1A Receptor Cloning and Riboprobe Synthesis
RNA from rat liver was isolated by conventional methods (Chomczynski and Sacchi 1987). RNA (0.5 μg) was reverse-transcribed in a 25-μl reaction containing 100 mM KCl, 50 mM Tris-HCl (pH 8.4), 6 mM MgCl2, 10 mM dithiothreitol, 500 μM dNTPs (Progen; Queensland, Australia), 50 ng specific primer (5′GGTAAACATACATTGCC 3′, complementary to position 1890 of the rat sequence) (Murphy et al. 1991), 40 U RNasin (Progen), and AMV reverse transcriptase (Boehringer, Mannheim, Germany; 25 U) at 42C for 1 hr.
An aliquot of the reverse transcription reaction (1 μl) was used in the polymerase chain reaction. The primers used for amplification of the AT1A receptor mRNA were: sense 5′GTGGATTTCGAATAGTGTCTGAGAC 3′; anti-sense 5′TAAAGATGTTCACGTATGTGGAGAA 3′; corresponding to regions −47 to −23 and 1852–1828 of the rat AT1A receptor, respectively (Murphy et al. 1991). PCR was performed in a reaction containing 10 mM Tris-HCl (pH 8.3), 50 mM KCl, 400 μM dNTPs, Taq polymerase (Bresatec, Adelaide, Australia; 2.5 U), 3 μM MgCl2, and each primer at 400 nM. Denaturation, annealing, and extension were carried out at 94C, 60C, and 72C, respectively, for 1 min each for 30 cycles, followed by a final extension at 72C for 10 min. The resulting 1.89-KB polymerase chain reaction (PCR) product was cloned into the Sma site of pBluescript II SK+ to form the plasmid pAT1A.
Anti-sense (HindIII cut, T3 polymerase) and sense (BamHI cut, T7 polymerase) probes were synthesized from the plasmid pAT1A. The probes were labeled by incorporating [35S]-UTP into the synthesis reaction, using the Stratagene in vitro transcription kit (Stratagene; La Jolla, CA).
Western Analysis
Western blot analysis was performed using AT1A receptortransfected or nontransfected CHO cells. Cells were maintained in Ham's F-12 medium containing 10% fetal calf serum. Geneticin (500 μg/ml) was added to the medium for transfectant cells (Teutsch et al. 1992). At confluence, cells were washed twice with PBS and harvested in PBS containing peptidase inhibitors [5 mM EDTA, 1 mM benzamidine, 5 μg/ml pepstatin A, 0.1 mg/ml phenanthroline, 10 μM leupeptin, 1 μg/ml soybean trypsin inhibitor, and 1 mM phenyl methyl sulfonyl fluoride (PMSF)]. Cell membranes were prepared by homogenizing cells in the above buffer. Then the homogenate was centrifuged at 500 x g for 5 min at 4C. The supernatant was then centrifuged at 50,000 x g for 30 min at 4C. The membrane pellet was subjected to a Dounce homogenizer in the above buffer. Protein content of the membrane samples was measured using the Bradford reagent (Bio-Rad; Hertfordshire, UK). Membrane samples (3 μg protein) were treated with sample loading buffer (Curnow et al. 1995) at room temperature (RT) for 2 hr, and loaded into 10% SDS-polyacrylamide gels. Electrophoresis was performed in a standard protocol as described (Sambrook et al. 1989). The resolved proteins were transferred by electroblotting onto a nitrocellulose sheet, Hybond C-Extra (Amersham; Poole, UK). The nitrocellulose sheet was rinsed in 0.1% Tween-20/20 mM Tris-HCl (pH 7.5)/0.5 M NaCl (T-TBS), soaked in blocking solution [T-TBS containing 5% skim milk and 3% bovine serum albumin (BSA)] at RT for 1 hr. After a wash in T-TBS, the sheet was incubated with antiserum at 1:1000 dilution in 1% BSA/T-TBS at RT for 1 hr, washed in T-TBS, then incubated with peroxidase-labeled goat anti-rabbit secondary antibody at 1:3000 dilution (Bio-Rad) at RT for 1 hr. Specific bands were visualized with chemiluminescence, ECL Western Blotting Detecting Kit (Amersham). Rainbow marker (Amersham) was used as molecular weight size standards.
Hybridization Histochemistry
Probes. Hybridization histochemistry was performed according to a standard protocol (Beck et al. 1994). Briefly, paraffin-embedded sections 7 μm thick were cut and mounted on 2% silane-coated slides. Deparaffinized sections were treated with pronase E (Sigma; St Louis, MO) (125 μg/ml) for 20 min at 37C, postfixed in 4% paraformaldehyde, dried, covered with approximately 40 μl of diluted riboprobe (0.2 ng/ml; see above), and incubated for 16 hr at 50C in a humidified chamber. Sections were then thoroughly washed in formamide buffer at 50C and treated with RNase A (Sigma; 150 μg/ml) for 2 hr at 37C. After digestion the sections were washed at 65C in 2 x SSC, then dried. The slides were exposed to phosphor imaging plates (Fuji Photo Film Co; Tokyo, Japan) for 2 nights and then scanned using a Bioimaging analyzer (Fujix BAS 2000). Slides were dipped in K5 liquid emulsion (Ilford; Cheshire, UK) diluted 1:1.5 with distilled water and exposed at RT for 12–24 days. Emulsions were then developed and sections counterstained with hematoxylin and eosin.
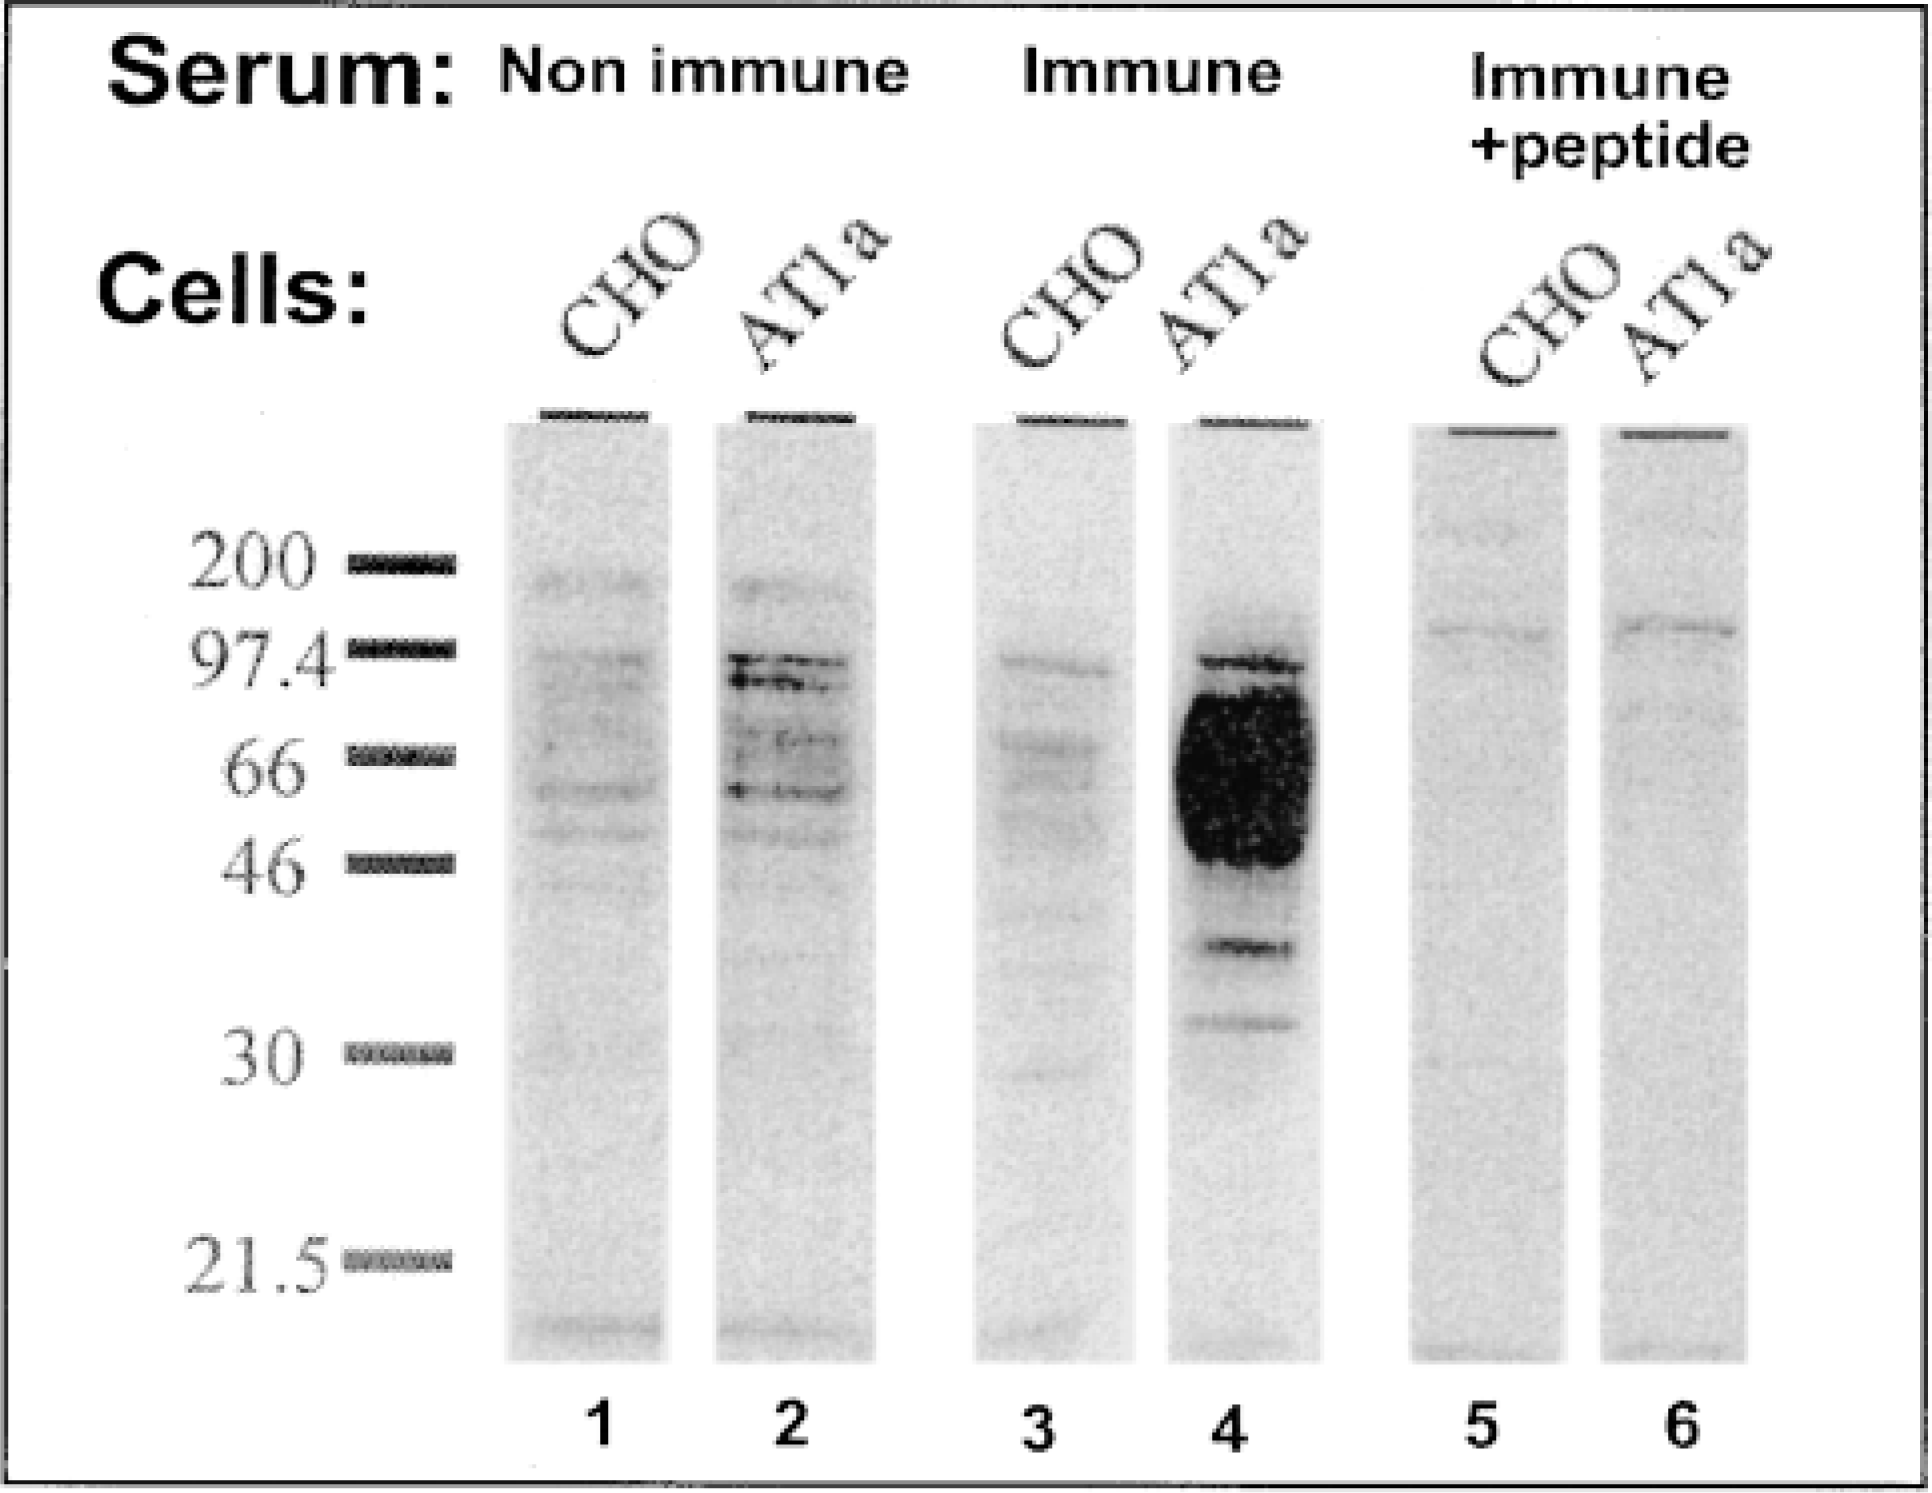
Western blots on membranes of CHO cells. Lanes 1, 3, 5, nontransfected CHO cells that have had nonimmune rabbit serum or AT1 antiserum or preabsorbed AT1 antiserum applied, respectively. Lanes 2, 4, 6, CHO cells transfected with the AT1 construct.
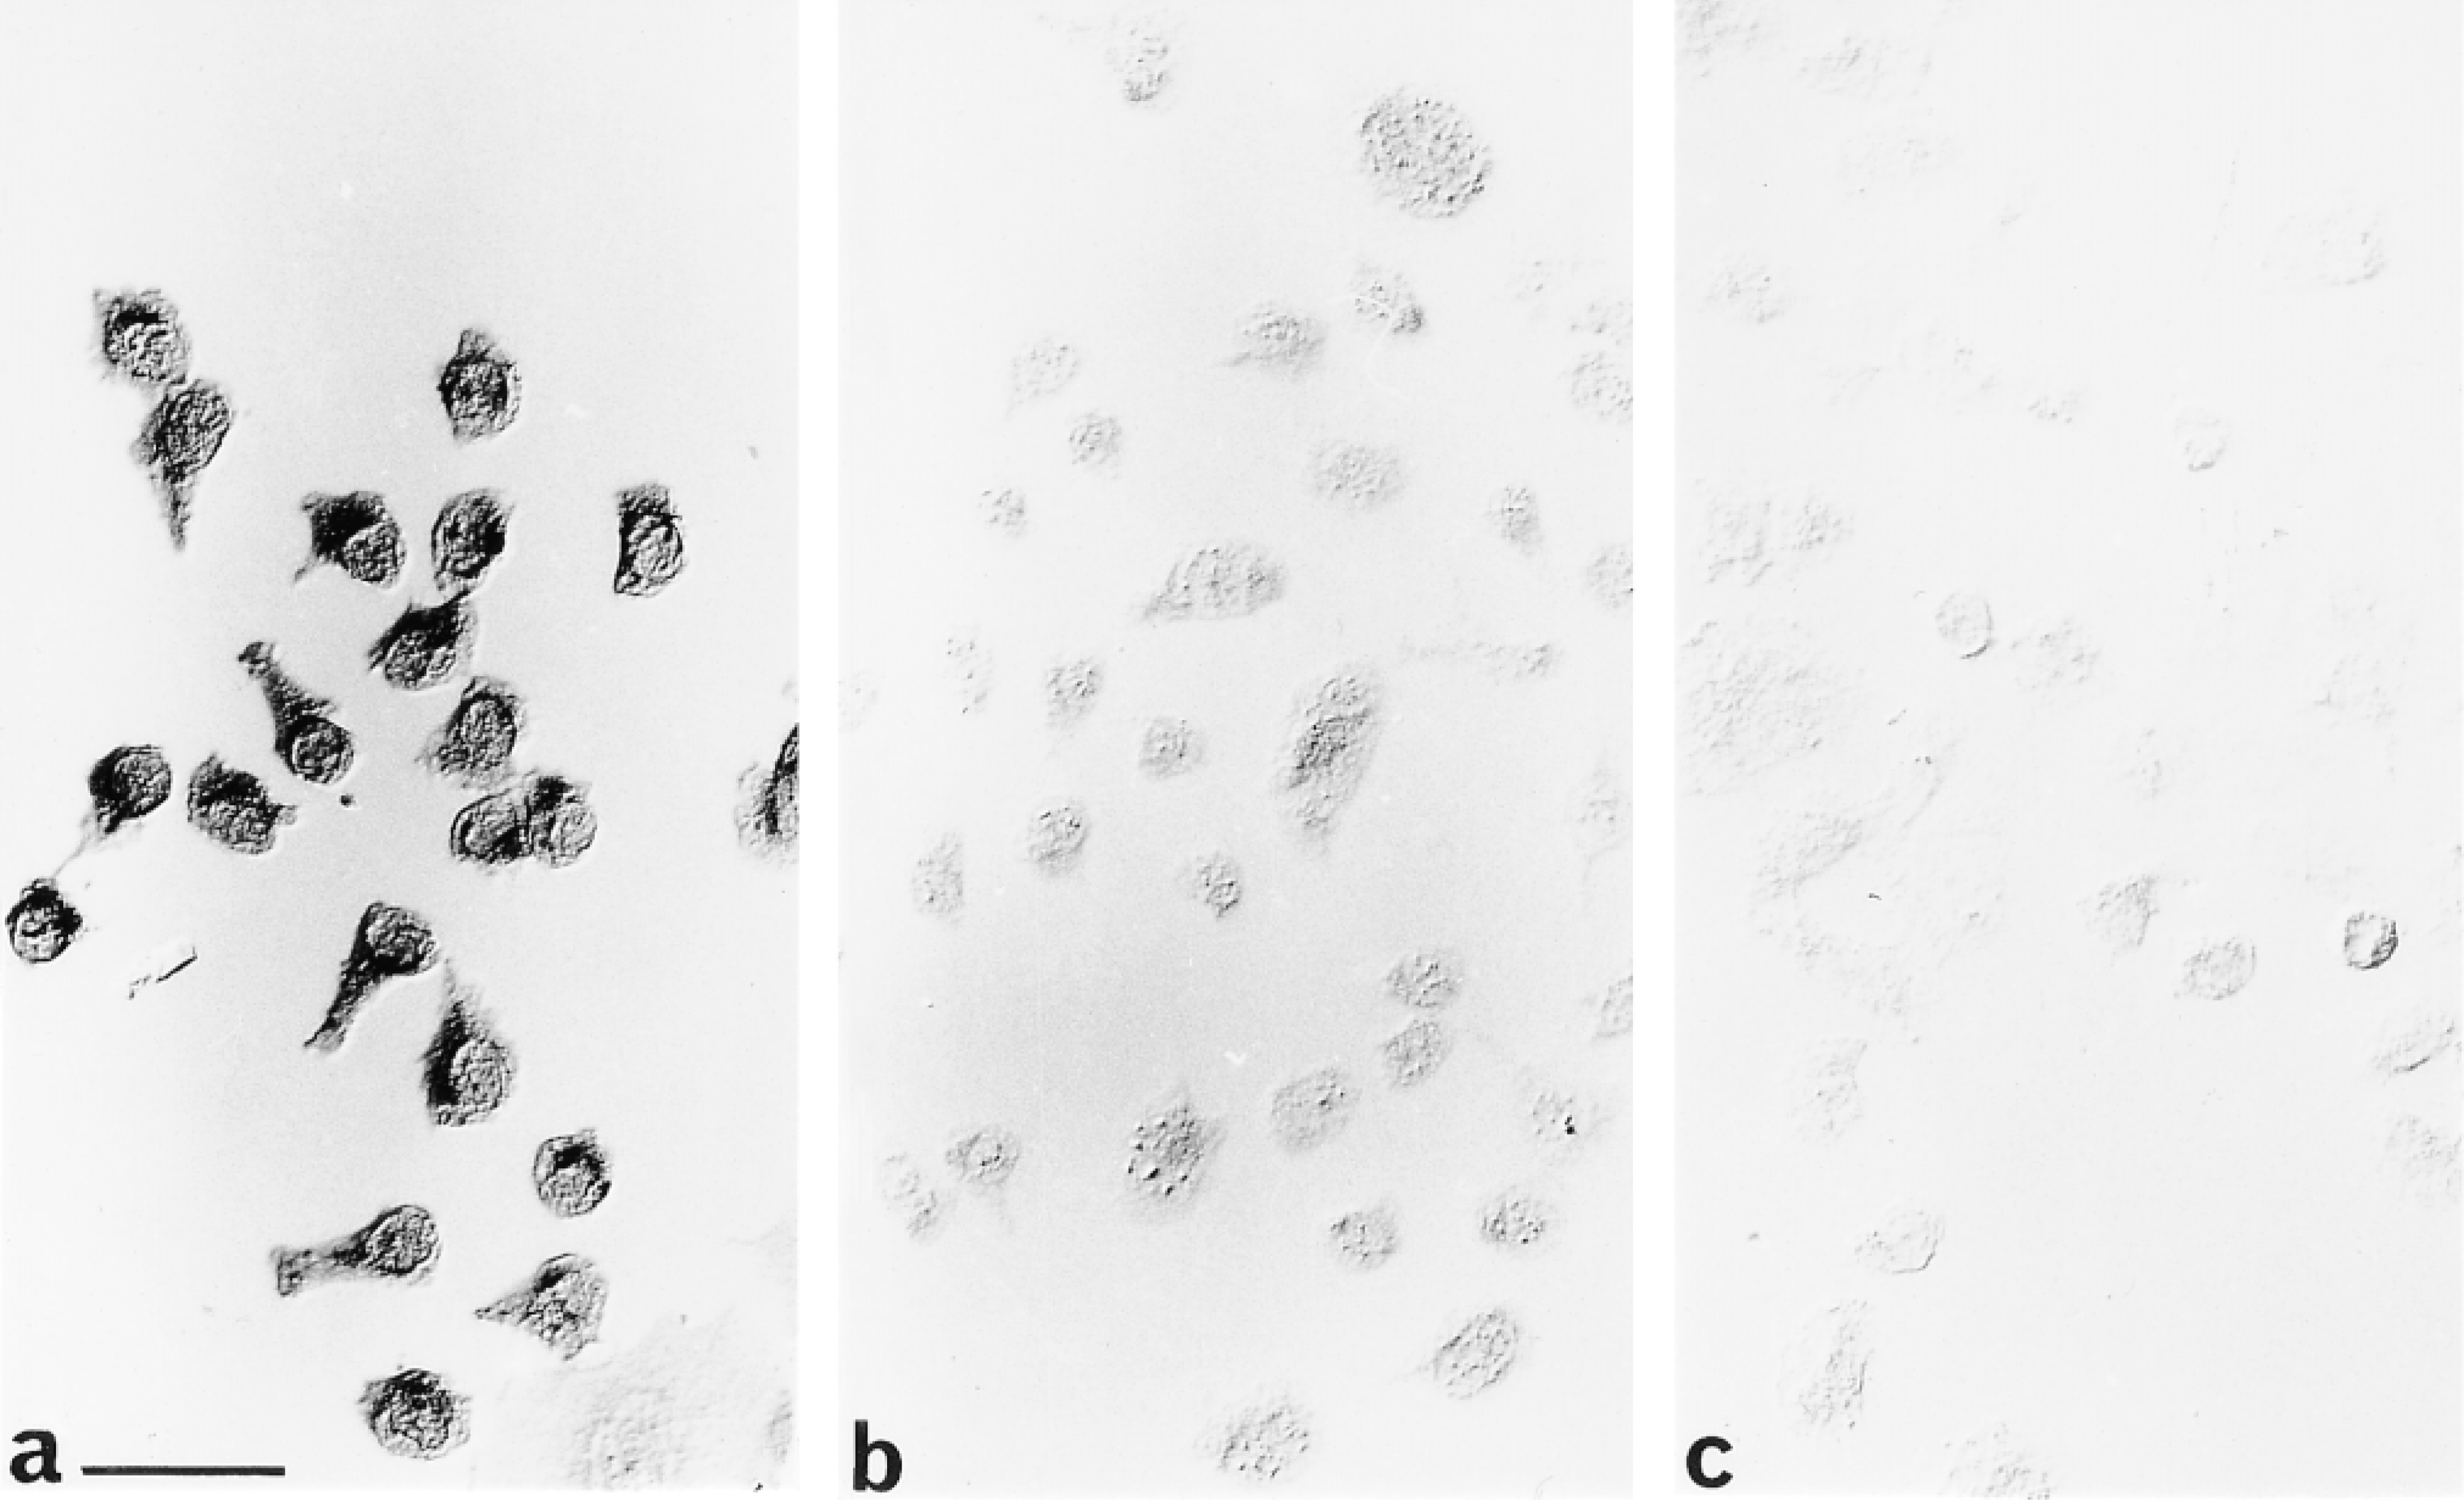
Cultures of CHO cells transfected with the AT1 receptor exposed to (a) AT1 receptor antiserum, (b) antiserum preabsorbed with 20 μg/ml of peptide, or (c) nonimmune antiserum. Bar = 40 μm.
Immunohistochemistry
Light Microscopy. Male Sprague-Dawley rats were anesthetized with sodium pentobarbital (100 mg/kg IP) and perfused transcardially with 4% paraformaldehyde in 0.1 M phosphate buffer, pH 7.2. The brain and adrenal glands were postfixed in the above fixative for 2 hr and then transferred to 20% sucrose in phosphate buffer overnight. Coronal frozen sections (40 μm) were taken throughout the preoptic hypothalamic area, medulla oblongata, and adrenal glands. These sections were exposed free-floating to 10% normal horse serum for 1 hr at RT before an overnight incubation in the AT1 receptor antibody diluted in phosphate buffer containing 2% normal horse serum and 0.3% Triton X-100 (BDH Chemicals; Victoria, Australia).
Electron Microscopy. The procedure for preparation of material for electron microscopy was based on a protocol for whole mounts (Young et al. 1994) and was applied to vibratome sections as follows. Briefly, rats were perfused transcardially with 4% paraformaldehyde and 0.05% glutaraldehyde in 0.1 M phosphate buffer, pH 7.4, and the adrenal glands were removed and postfixed in alkaline 4% paraformaldehyde overnight at 4C. Glands were washed thoroughly in phosphate buffer and then vibratome sections 100 μm thick were cut and immersed sequentially in 50% alcohol, phosphate buffer, 1% sodium borohydride, and again in phosphate buffer. The sections were blocked in 0.01 M phosphate buffer saline (pH 7.2) containing 1% bovine serum albumin, 1% fish gelatin (Sigma), and 10% normal horse serum for 30 min. The primary antibody was diluted in the above blocking buffer with the addition of 0.05% merthiolate and was applied to free-floating sections for 48 hr at 4C. After incubation the sections were washed in 0.01 M PBS, pH 7.2. They were then incubated with 1-nm gold secondary antibody (Amersham) diluted in the blocking buffer with 0.2% acetylated bovine serum albumin (aBSA) (Electron Microscopy Sciences; Warrington, PA), for 48 hr at 4C. Postfixation in 2% glutaraldehyde and further washes in distilled water followed washes in the blocking buffer and 0.01 M PBS, pH 7.2. Sections then underwent contrast staining and further fixation with 1.25% osmium tetroxide and 2% uranyl acetate. Sections were then silver-enhanced (Amersham), processed to Araldite/Epon according to standard methods, then flat-embedded and attached to blank polymerized resin blocks. Ultrathin sections were taken and collected on copper grids, then counterstained with 10% uranyl acetate and lead citrate for 5 min.
Chinese Hamster Ovarian (CHO) Cells In Vitro. CHO cells that had been transfected with the rat AT1A receptor were subjected to immunohistochemical procedures, as were nontransfected CHO cells. The cells were dipped in acetone, air-dried, and fixed in 4% paraformaldehyde in 0.1 M phosphate buffer, pH 7.2, for 5 min. The cells were then washed in phosphate buffer and the above light microscopic immunohistochemical method was used to identify the AT1 receptor.
Stimulation of Ang II-responsive Neurons in the Circumventricular Organs of the Rat Brain: A Comparison of the Distribution of Fos Protein and the AT1 Receptor
Animals. Six Sprague-Dawley rats were injected SC with 50 μg/kg isoproterenol (Isuprel Winthrop) to elevate endogenous circulating levels of Ang II. Two hr later, rats were deeply anesthetized with sodium pentobarbital (100 mg/kg IP) and were then perfused transcardially with isotonic saline (80 ml) followed by 4% paraformaldehyde (250 ml).
Dual Labeling of AT1 Receptor and Fos Protein. To immunocytochemically double label groups of neurons that had elevated levels of Fos protein and also expressed the AT1 receptor, specific antibodies raised against each of these were applied (as above) sequentially to free-floating sections.
First, Fos protein was identified using a commercial antibody raised against residues 4–17 of human Fos (c-fos Ab-2; Oncogene Science, Manhasset, NY). This antigen was visualized in neuronal cell nuclei as a black reaction product by virtue of the inclusion of 40% nickel ammonium chloride in the diaminobenzidine solution. Subsequently, the AT1 receptor (see above) was localized using the same chromogen without nickel ammonium chloride, which results in a brown reaction product. The primary antibodies in each case were visualized using avidin-biotin-peroxidase procedures (Vector; Burlingame, CA).
Results
Western Blot Analysis
The antibody detected a major band at approximately 70–80 kD in membranes from CHO cells transfected with rat AT1A receptors (Figure 1, Lane 4), but not from untransfected CHO cells (Figure 1, Lanes 1, 3, and 5). No bands were detected either with nonimmune rabbit serum (Figure 1, Lane 2) or with the mixture of antiserum after preincubation with the decapeptide (1 μM) used to raise the antibody (Figure 1, Lane 6).
Immunocytochemistry and Hybridization Histochemistry of the AT1 Receptor in CHO Cells
Antiserum applied to CHO cells transfected with the AT1 receptor resulted in an intense reaction product throughout the cell bodies and their processes (Figure 2a). This staining was abolished by preabsorption of the antibody with the 20 μg/ml of the peptide for 1 hr at 37C before to application to cells (Figure 2b). Similarly, when the primary antibody was omitted from the immunocytochemical protocol, cell staining was not apparent (Figure 2c). Despite the lack of staining in the latter cases (Figures 2b and 2c), the outlines of cells could be discerned using interference contrast optics. Nontransfected CHO cells did not exhibit any immunoreactivity when exposed to the AT1 receptor antiserum (data not shown).
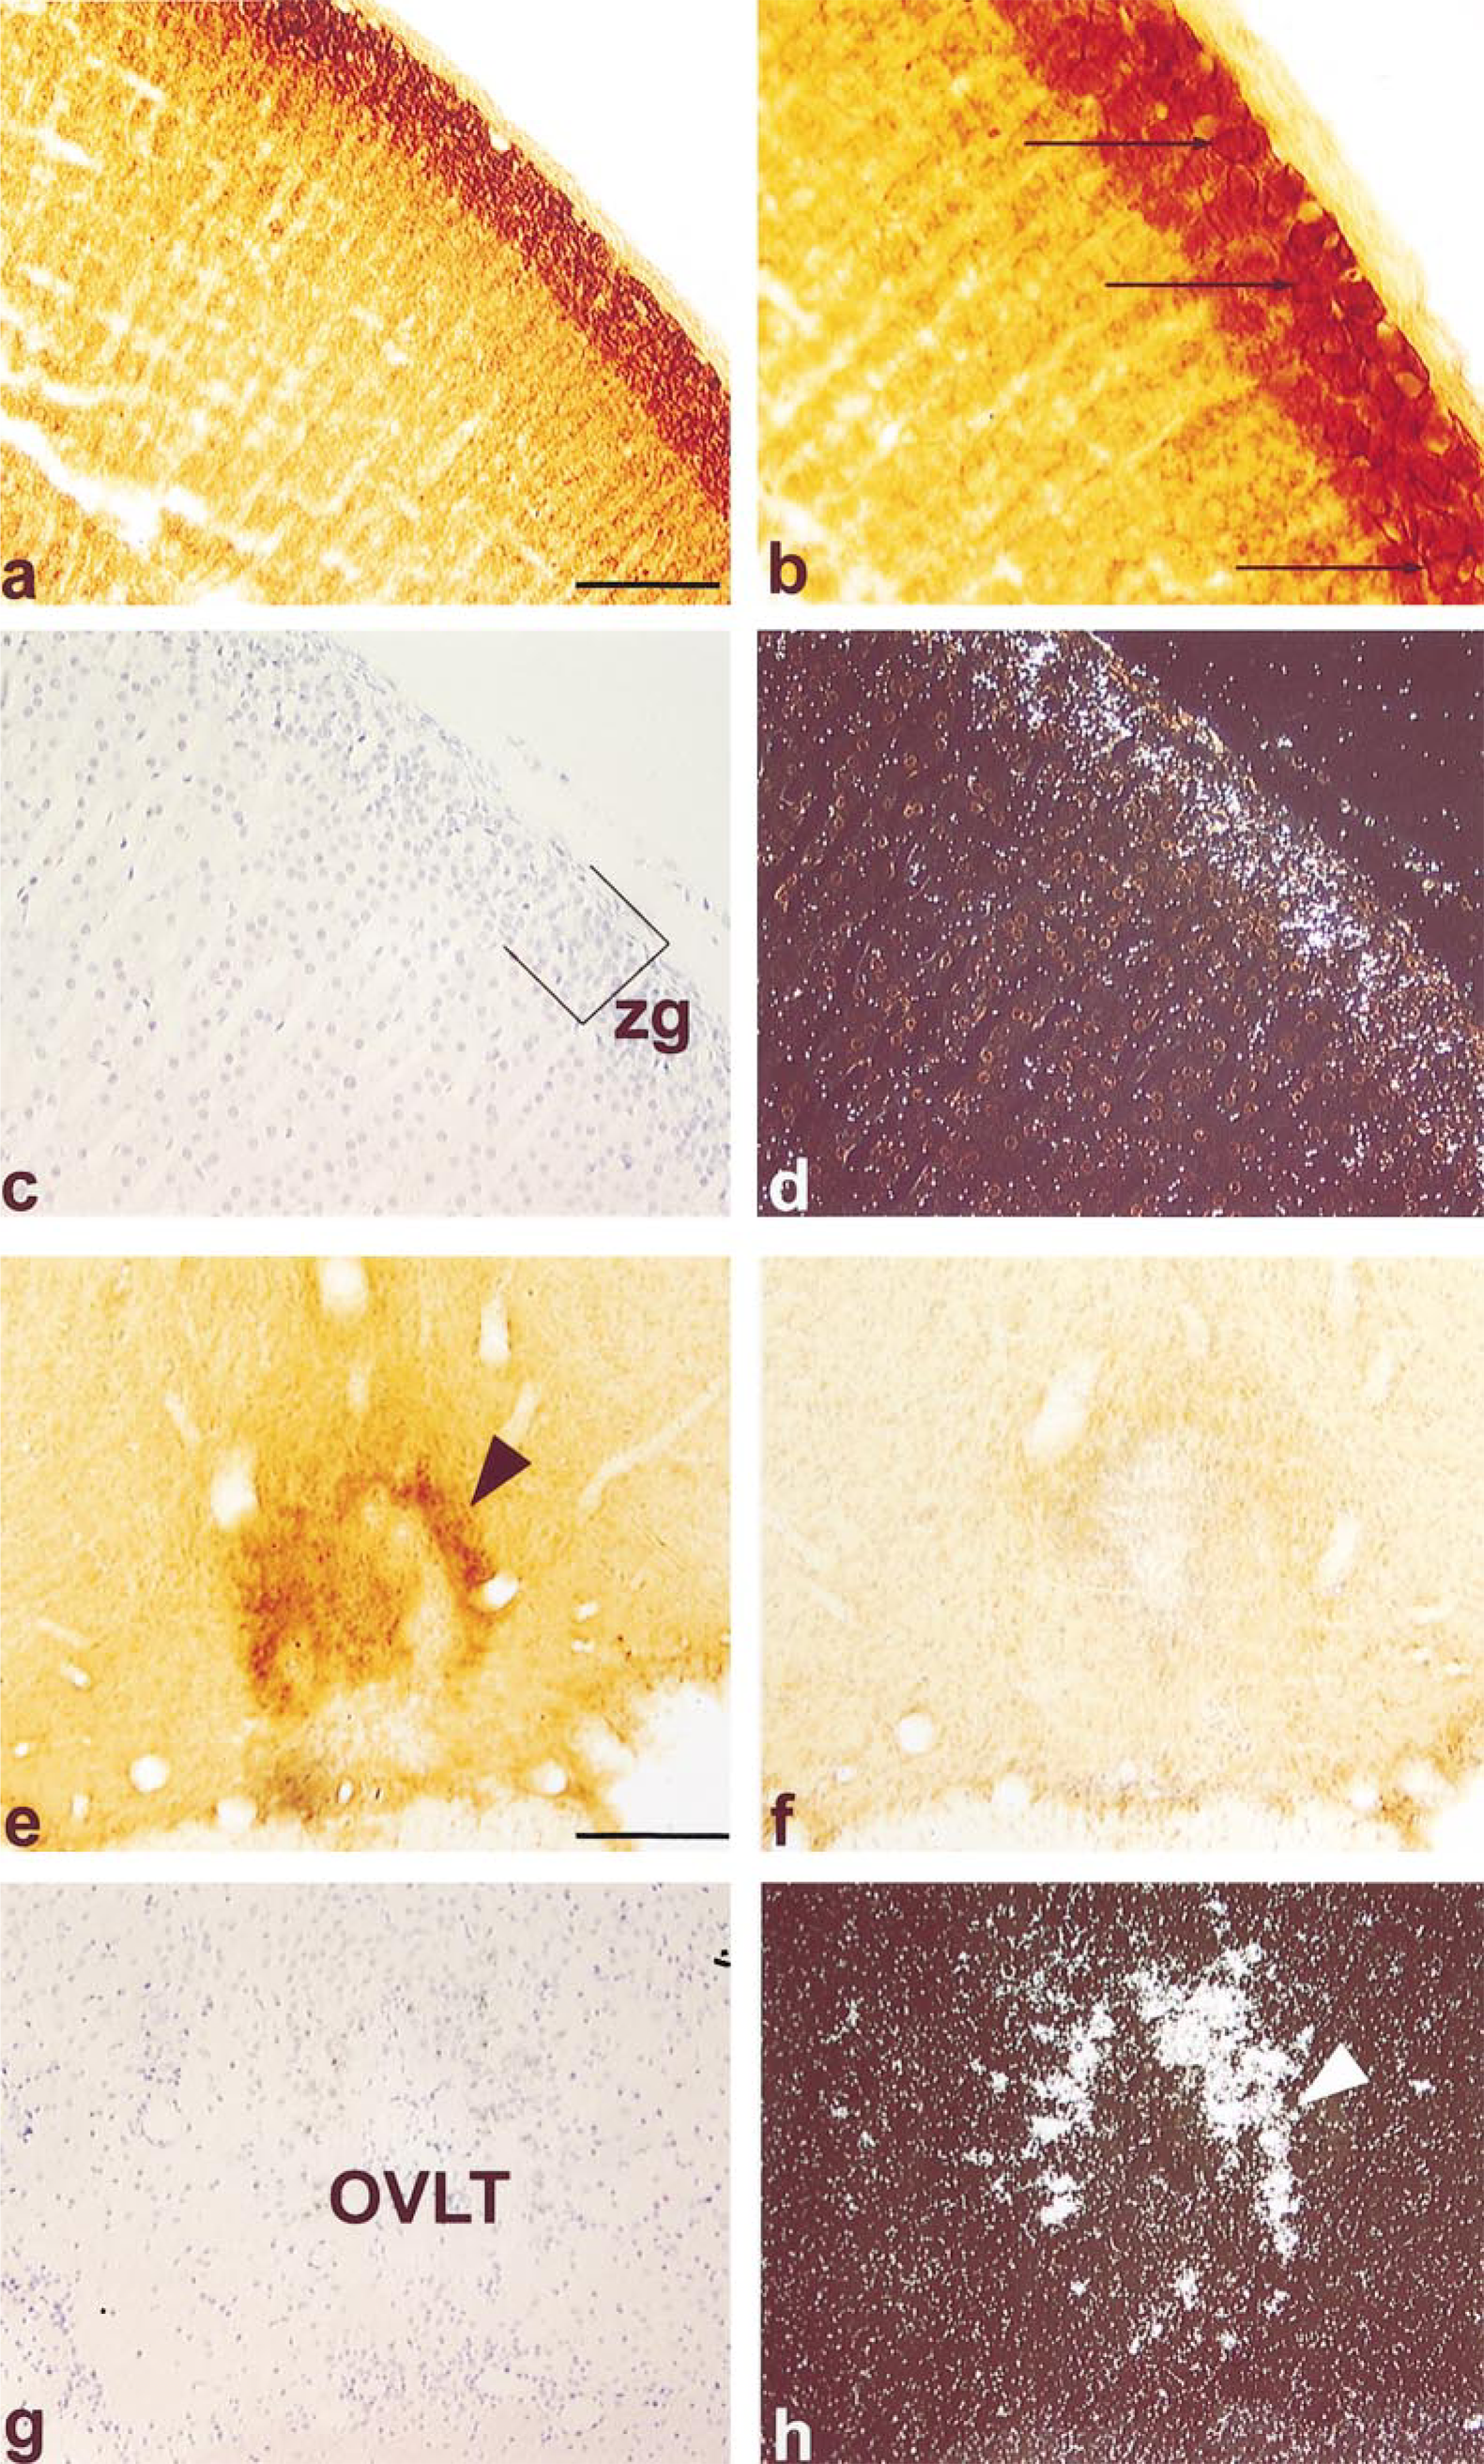
AT1 receptor antisera or riboprobe to the receptor applied either to sections of the adrenal gland (a-d) or to coronal sections of the organum vasculosum lamina terminalis (OVLT) of the forebrain (e-h). Sections in c and g are counterstained sections hybridized with AT1 receptor riboprobe of adrenal gland and OVLT respectively. The same sections were photographed using darkfield illumination in d and h. Arrows in b indicate immunoreactivity associated with the membrane of cells in the zona glomerulosa (zg). Arrowhead in e shows immunoreactivity in the lateral boundaries of the OVLT, which corresponds to high levels of AT1 mRNA in the same region (arrowhead in h). Immunoreactivity in the OVLT (f) was preabsorbed with 20 μg/ml of peptide. Bars: a = 200 μm; e = 90 μm.
Adrenal Gland
In the rat adrenal cortex, immunohistochemistry at the light microscopic level showed intense labeling of virtually all cells in the zona glomerulosa. The immunoreactivity was most intense on the plasma membrane of these cells (Figures 3a and 3b). Although there was some immunoreactivity in the zona fasciculata, this was of a low intensity compared with the neighboring zona glomerulosa. Preabsorption of the antiserum with 20 μg/ml of the C-terminal decapeptide completely abolished all immunostaining. Comparison of the distribution of the AT1A receptor pep-tide, as shown by immunocytochemistry, with that of its mRNA, demonstrated with hybridization histochemistry, indicated that the distributions were essentially the same (Figures 3c and 3d). When cells were examined at the ultrastructural level, it could be confirmed that immunoreaction product was restricted to the plasma membranes of cells in the zona glomerulosa (Figures 4a and 4b), whereas closely adjacent cells in the capsule or in the zona fasciculata (the latter distinguished on the basis of the characteristic appearance of their mitochondria; Figure 4b) were unlabeled.
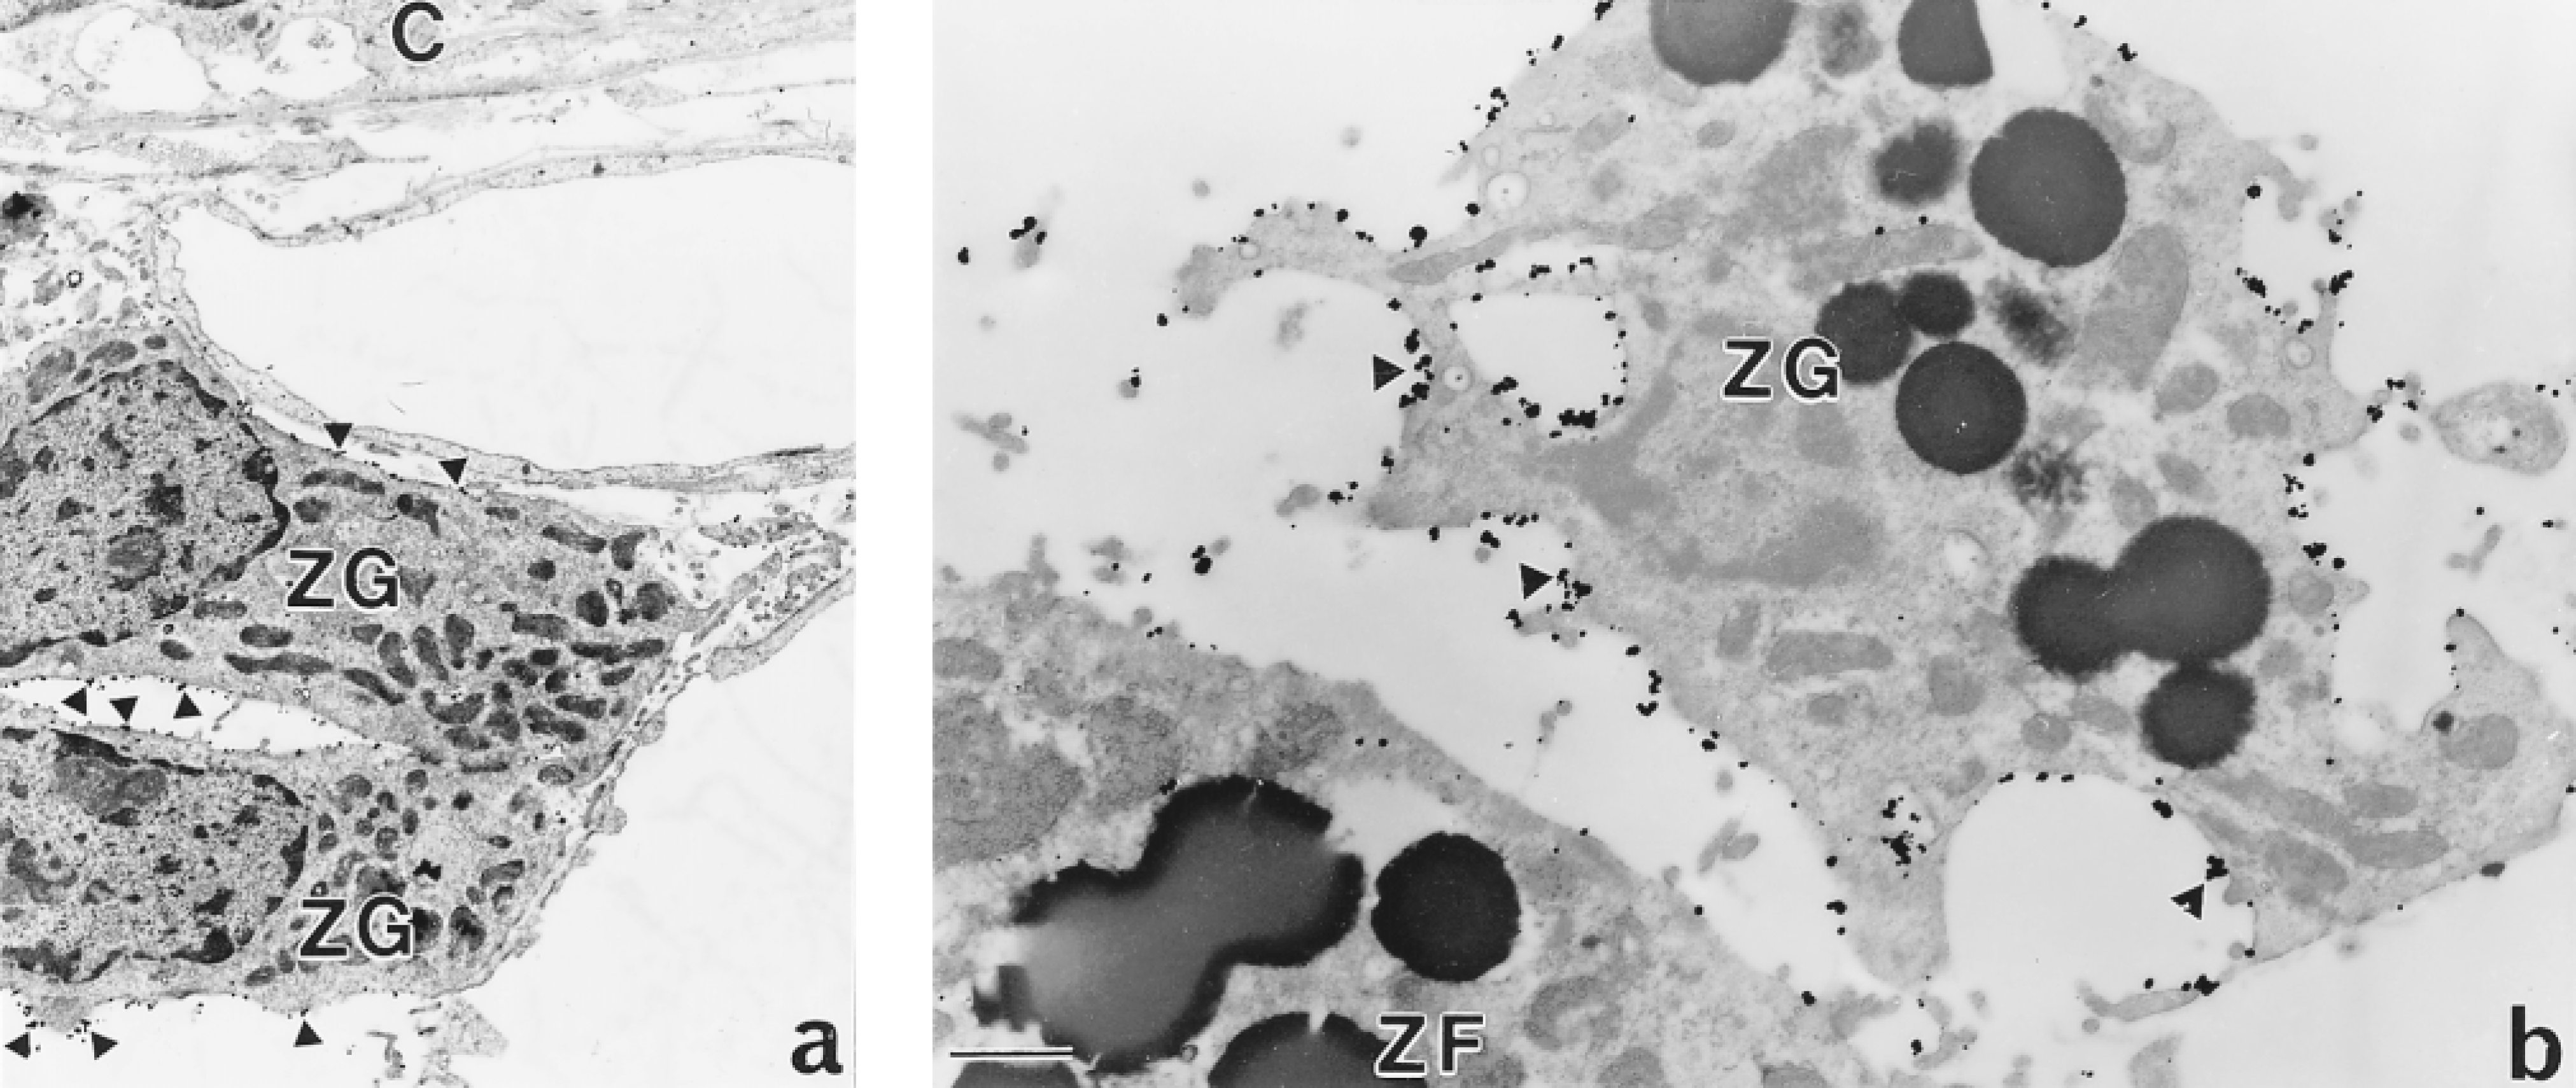
Electron micrographs of the rat adrenal gland showing AT1 receptor immunoreactivity. (a) The adrenal capsule (C) attached to cells of the zona glomerulosa (zg), which have silver grains on their membranes (arrowheads). Bar = 2 μm. (b) Silver grains (arrowheads) on the membrane of the zg cell but not on the adjacent zona fasciculata (zf) cell. Bar = 1 μm.
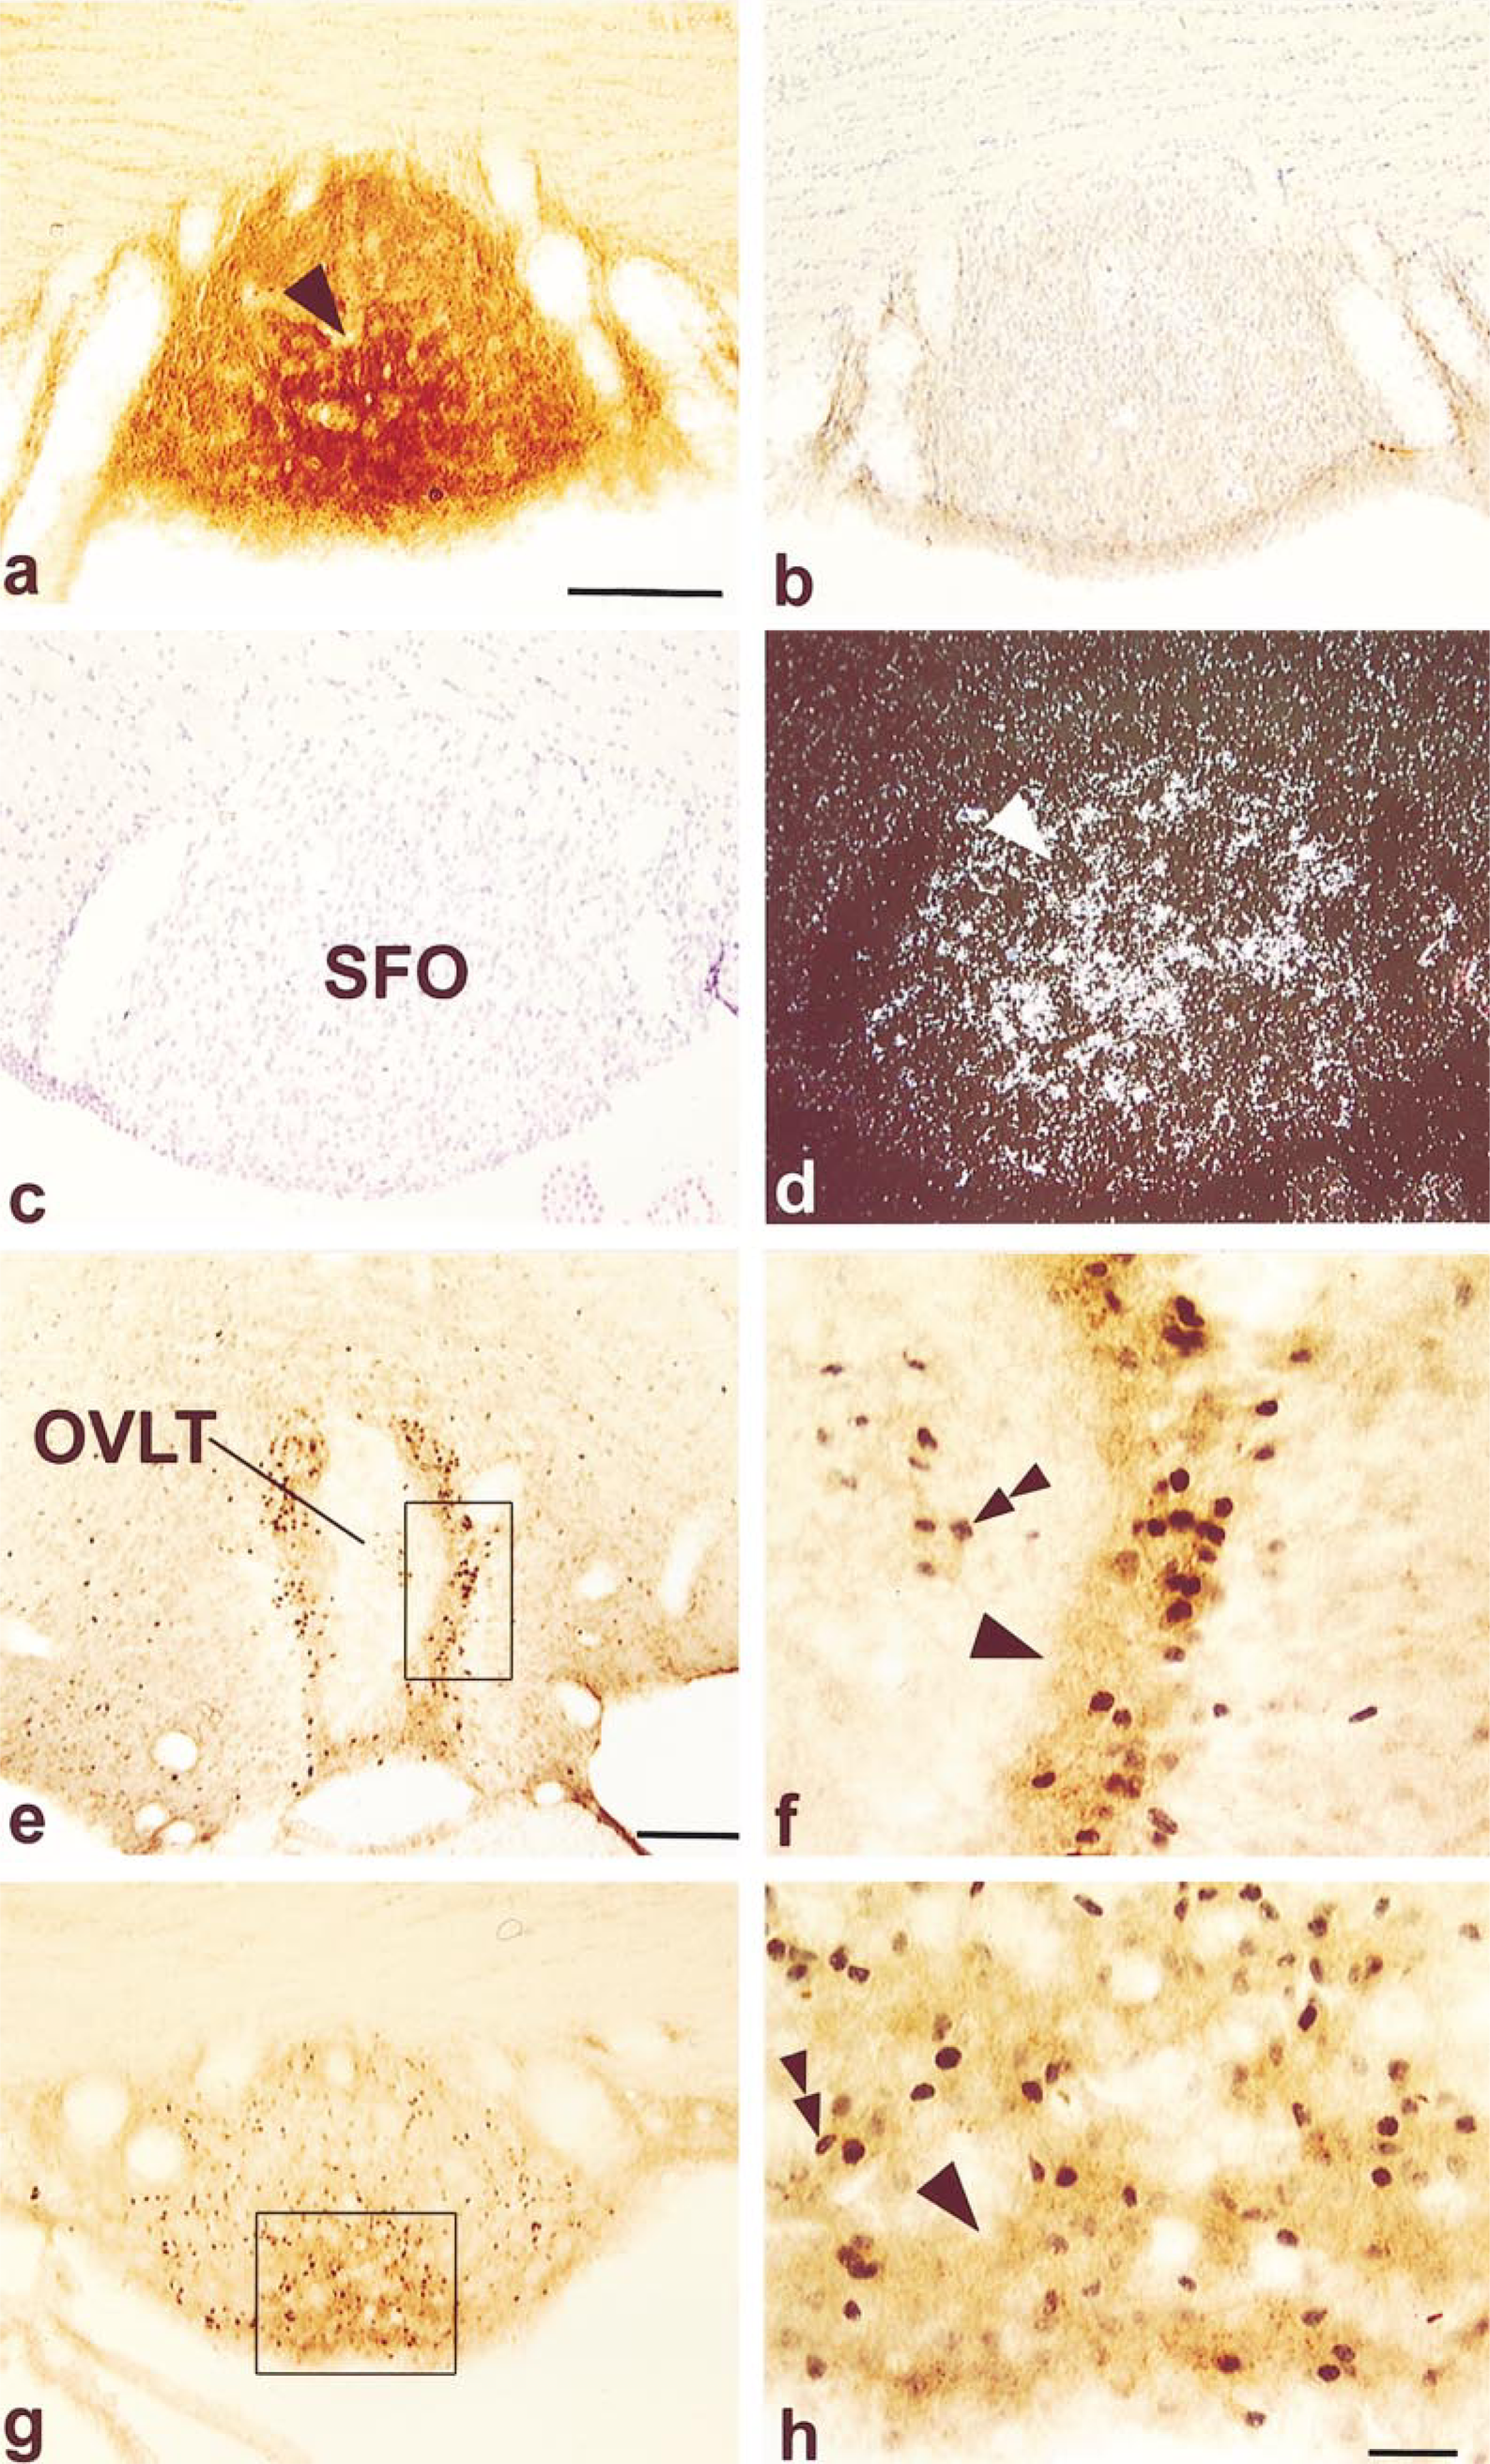
Coronal sections through the rat subfornical organ (SFO) (a-h) and OVLT (e,f). AT1 receptor immunoreactivity in the SFO (a), indicated with an arrowhead, is abolished after preabsorption of the antiserum with 20 μg/ml of peptide (b). SFO sections in brightfield (c) and darkfield (d), with the arrowhead pointing to the hybridization labeling after application of the AT1 receptor riboprobe. Immunohistochemical double labeling in the OVLT (e,f) and SFO (g,h) of the AT1 receptor (single arrowhead) and Fos protein (double arrowhead). The small box in e is enlarged in f and the small box in g is enlarged in h. Bars: a = 100 μm; e = 200 μm; h = 50 μm.
Brain
The AT1 receptor was found in discrete areas of the brain, most notably in the components of the lamina terminalis of the forebrain, i.e., the organum vasculosum lamina terminalis (OVLT) (Figure 3e), the median preoptic nucleus (MnPO) (not shown), the subfornical organ (SFO) (Figure 5a), and the nucleus of the solitary tract of the medulla oblongata (not shown). More specifically, reaction product was concentrated in the lateral margins of the OVLT and in the central (and ventral) regions of the SFO. It is precisely these areas that showed high levels of mRNA for the AT1 receptor when hybridization histochemistry using 35S-labeled riboprobes was performed on sections of the forebrain (OVLT, Figures 3g and 3h; SFO, Figures 5c and 5d). Immunostaining of either nerve fibers or cell bodies was also found in a range of brain regions throughout the remainder of the preoptic region, diencephalon, and hindbrain. In these areas labeling was most prominent in the anteroventral preoptic nucleus, anterior parvocellular division of the paraventricular nucleus, lateral hypothalamic area, anterior periventricular nucleus, retrochiasmatic area, lateral hypothalamus, and dorsomedial hypothalamus. Faint labeling could also be detected in the forebrain in the bed nucleus of the stria terminalis and the suprachiasmatic nucleus, and in the caudal and rostral ventrolateral medulla. Preabsorbing the antiserum with the C-terminal decapeptide, (see OVLT, Figure 3f, and SFO, Figure 5b) abolished all immunostaining.
After an SC injection of isoproterenol to elevate endogenous levels of circulating Ang II, a close anatomic correlation was found in the OVLT and SFO between activated neurons, identified by an elevation of Fos protein, and those expressing the AT1 receptor. In the OVLT, this co-distribution was prominent and complete in the lateral margins of the nucleus (Figures 5e and 5f) whereas in the SFO there was greatest overlap in its central and ventral aspect (Figures 5g and 5h). An SC injection of isotonic saline revealed no immunoreactivity for Fos protein in these brain regions (McKinley et al. 1992).
Discussion
The peptide chosen for raising antibodies corresponded to a decapeptide at the carboxyl terminus of the rat AT1A receptor. This is often the most suitable region of a protein for raising antibodies, which will recognize the entire protein (Siemens et al. 1994). The sequence used is likely to be unique to the rat AT1A receptor, based on a search of the Swiss Protein database (not shown).
The antibody appears, by a number of clearly defined criteria, to be specific. It binds specifically to cells in the zona glomerulosa of the adrenal gland and in a number of discrete brain regions, including the subfornical organ, organum vasculosum of the lamina terminalis (OVLT), median preoptic nucleus, bed nucleus of the stria terminalis, paraventricular nucleus of the hypothalamus, and nucleus of the solitary tract. These brain sites correspond well to those shown to possess high levels of the AT1 receptor by in vitro autoradiographic localization (Mendelsohn et al. 1984; Gehlert et al. 1986) and mRNA (Lenkei et al. 1997). Furthermore, the specific regional location of AT1 receptors, shown recently in the central core of the subfornical organ and in the lateral margins of the OVLT using both hybridization histochemistry and the Fos response to increased circulating levels of Ang II (see Figures 3e-3h and Figure 5) (Lenkei et al. 1995,1997; McKinley et al. 1998; McKinley and Oldfield 1998), coincide exactly with the distribution of receptors demonstrated with the antibody in the present study. The subfornical organ and the OVLT lack a blood-brain barrier, and neurons in these circumventricular organs, unlike those in most other regions of the brain, are exposed to circulating Ang II. There is considerable evidence indicating that neurons in these sites are responsive to Ang II, mediate the drinking response and vasopressin secretion caused by blood-borne Ang II (Simpson 1981), and increase the expression of Fos when stimulated by Ang II (McKinley et al. 1992).
The AT1A receptor antibody was also shown to be specific for the AT1 receptor by Western blotting. The antibody demonstrated strong binding to CHO cells transfected with the AT1A receptor but not to nontransfected cells. Furthermore, neither nonimmune serum nor immune serum preincubated with the decsignificantly with the extracts from CHO cells transfected with the AT1A receptor.
The broad band of labeling in the extracts from transfected cells is most likely due to differential glycosylation of the AT1A receptor. Although the predicted mass for the AT1A receptor is ∼41 kD, the receptor contains three potential glycosylation sites and the observed mobility is consistent with glycosylation. A similar size distribution of an epitope-tagged AT1A receptor has previously been demonstrated (Oppermann et al. 1996).
Although the need for immunocytochemical localization of the AT1 receptor has been recognized for some time, there has been little evidence that an appropriate antibody was forthcoming. Most recently, such an antibody has been used (Phillips et al. 1993) and sold commercially (Chemicon International; Temecula, CA). However, the description of receptor labeling using this antiserum is in certain instances, such as in the supraoptic nucleus (Phillips et al. 1993; Ying et al. 1995) or the magnocellular portion of the paraventricular nucleus of the hypothalamus (Dawson et al. 1998), at odds with the accumulated evidence from hybridization histochemistry (Lenkei et al. 1997) and in vitro receptor autoradiography (Rowe et al. 1990; Song et al. 1992). The supporting evidence provided in the present study from Western blots, electron microscopy, detection of receptor transfected into CHO cells, combination with Fos studies, and correspondence with the distribution of AT1 receptor mRNA give confidence that a polyclonal antisera has been obtained that is specific for the AT1 receptor. This antibody clearly has potential for the precise cellular and subcellular localization of this receptor in organs and tissues of the rat and can be used in combination with other histological techniques.
Footnotes
Acknowledgements
Supported by the National Health and Medical Research Council of Australia Block Grant 983001.
We would like to thank Dr Pierre Corvol and Dr Eric Clauser for their kind gift of CHO cells transfected with the AT1A receptor, and Dr John Wade for synthesizing the peptide.