
Abstract
Knowledge about intracellular signal transduction cascades is largely based on investigations of cultured cells whose responses to different stimuli are typically quantified via RIA, ELISA, or immunoblots. These techniques, which require relatively large amounts of biological material, are performed with homogenized cells and therefore do not allow localization of the molecules under investigation. We describe a protocol for recording dose-response curves directly from immunocytochemical preparations using rat pinealocytes as a model system. The cells were exposed to β-adrenergic stimuli inducing the phosphorylation of the transcription factor CREB (mediated by PKA), an increase in ICER protein levels, and synthesis and release of melatonin. Melatonin concentrations were determined by ELISA. cPKA, phosphorylated CREB, and ICER were demonstrated by immunocytochemistry and immunoblots. Dose-response curves were recorded by measuring the integrated density of the immunoreactive sites with an image analysis program. Dose-response curves from immunoblots and immunocytochemical preparations showed almost identical dynamics, validating the immunocytochemical approach, which minimizes the amount of biological material needed for such studies, allows combined quantification and localization of biomolecules, and may even be more sensitive than immunoblotting.
Keywords
C
The method is based on image analysis and its development included the following steps: (a) determination of a measurement parameter that correlates with the amount of antigen in immunoblots; (b) determination of this parameter in immunocytochemical preparations; and (c) validation of the measurements in immunocytochemical preparations by comparing dose-reponse curves recorded from immunoblots and immunocytochemical preparations.
The method was developed using a well-characterized cell culture system, i.e., isolated rat pinealocytes (Tamotsu et al. 1995; Korf et al. 1996; Schomerus et al. 1996; Maronde et al. 1997b). In these cells, adrenergic stimulation induces melatonin biosynthesis by activating the cAMP pathway (see Klein et al. 1996). This has been corroborated in a number of studies using various agonistic and antagonistic cAMP analogues, such as MBC-cAMP (Øgreid et al. 1985), Sp-DClcBIMPS (Sandberg et al. 1991; Genieser et al. 1992), and Rp-8-CPT-cAMPS (Gjertsen et al. 1995). Activation of the cAMP pathway involves protein kinase A (PKA) (Zatz and O'Dea 1976; Roseboom and Klein 1995; Maronde et al. 1997a) and causes the phosphorylation of the transcription factor CREB (cAMP-responsive element binding protein) (Gonzalez and Montminy 1989; Roseboom and Klein 1995; Tamotsu et al. 1995; Maronde et al. 1997b) and an increase in ICER expression (inducible cAMP-responsive element early repressor) (Stehle et al. 1993,1995; Stehle 1995). The intracellular distribution of these third messengers can be visualized with immunocytochemistry and highly specific antibodies.
Materials and Methods
Animals, Preparation of Rat Pinealocyte Cultures, and Stimulation
All experiments were conducted in accordance with guidelines on the care of experimental animals as approved by the European Communities Council Directive (86/609/EEC). For cell culture, pineal glands were removed from adult male Wistar rats. For isolation of pinealocytes, the glands were immediately dissociated by papain digestion and repeated pipetting as previously described (Tamotsu et al. 1995). Briefly, the dispersed cells were resuspended in Dulbecco's modified eagle's medium (DMEM) supplemented with fetal calf serum (10%), HEPES (10 mM), ascorbic acid (100 μg/ml), penicillin (100 U/ml), streptomycin (100 μg/ml), glutamine (2 mM) plus glucose (7 mg/ml), immobilized on poly-L-lysine-coated coverslips and kept in culture for 1-3 days before further experimental manipulations. Routinely, 10 such coverslips, each containing approximately 10,000 cells, were harvested from one pineal organ. The coverslips were placed in multiwell dishes containing 500 μl medium/well. The viability of the cells was approximately 95% as assessed by trypan blue exclusion. After changing of the medium, the test substances, diluted in medium, were directly applied to the cells.
Immunoblotting
After stimulation, the medium was removed and used for ELISA (see below). The cells were lysed directly on the coverslips by 50 μl of sample buffer according to Rittenhouse and Marcus (1983). Lysate from 30,000-50,000 cells had to be loaded on one lane to obtain a signal in the immunoblots. Electrophoresis and blotting were done as described (Rittenhouse and Marcus 1983; Szewczyk and Kozloff 1985). For calibration, rat pineal extracts whose protein content was determined by a protein assay (Bradford 1976) were serially diluted and immunoblotted (Figure 1).
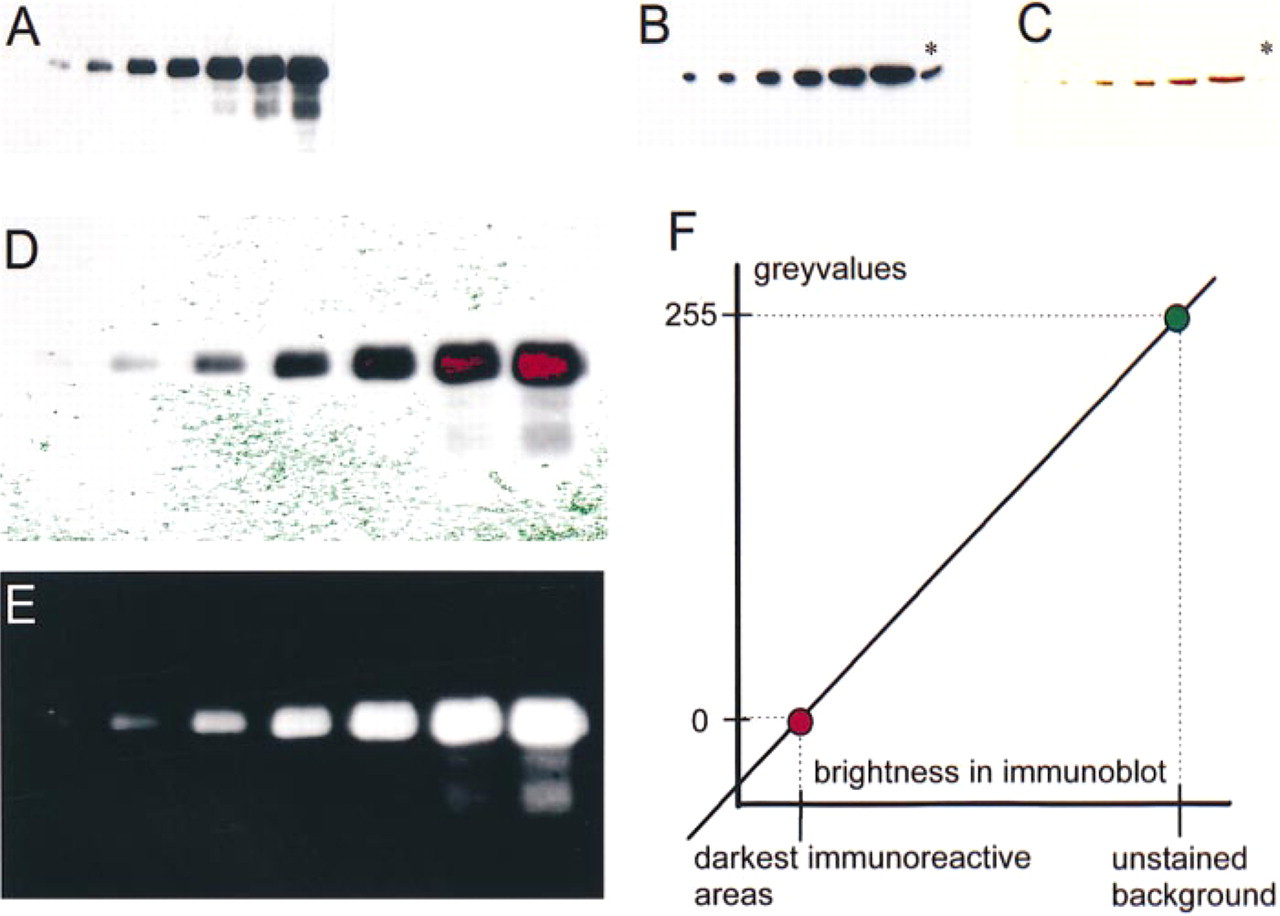
Calibrated immunoblots and their digitization. (A) Demonstration of total CREB in an immunoblot. The different lanes were loaded, from left to right, with increasing amounts (0.1-10 μg/lane) of protein extracts from a pineal organ. After protein separation and blotting, the membrane was reacted with an antibody against total CREB (1:5000) and developed via chemoluminescence (exposure time 3 min). (B,C) Demonstration of c-PKA in an immunoblot. The different lanes were loaded, from left to right, with increasing amounts (0.5-20 μg/lane) of protein extracts from a pineal organ. The lanes at right (asterisks) contain a molecular weight/specificity marker of 40 kD. After protein separation and blotting, the membrane was reacted with an antibody against c-PKA (1:50,000). The immunoreaction was first visualized by chemoluminescence on film (B, exposure time 5 min) and subsequently directly on the membrane (C, incubated with DAB/H2O2). (D) Digital image of the blot shown in A. The red and green areas are range indicators of the setting of the analogue/digital conversion. Pixels with gray values close to 255 (white background) are marked in green; those with gray values close to 0 (black immunoreaction) are marked in red. (E) Inverted version of the digital image shown in D, used as a gray value reference for the determination of the SUMDENS values. (F) Analogue/digital conversion graph for the blot shown in A and D. The color coding is the same as in D.
The membranes were incubated with polyclonal antibodies detecting Ser-133 phosphorylated CREB (pCREB; New England Biolabs, Beverley, MA; diluted 1:3000) (Schomerus et al. 1996; Maronde et al. 1997b), total (i.e., phosphorylated and nonphosphorylated) CREB (New England Biolabs; diluted 1:5000 or 1:2500) (Schomerus et al. 1996; Maronde et al. 1997b), or the catalytic subunit of cAMP-dependent protein kinase A (c-PKA, diluted 1:50,000) (Schwoch et al. 1980; Maronde et al. 1997b). Horseradish peroxidase (HRP)-conjugated anti-rabbit IgG (New England BioLabs; diluted 1:100,000) was used as secondary antibody. The signals were detected by chemoluminescence (UltraSignal; Pierce, Rockford, IL) on Kodak Biomax film exposed for 1, 3, 5, or 15 min. Immunoblots were incubated with higher concentrations of the primary and secondary antibodies when diaminobenzidine (DAB) was used as the coloring reagent. To confirm equal loading of the lanes, immunoblots were stained with India Ink (Pelikan; Hannover, Germany) after chemoluminescence detection. The intensity of the immunosignals was determined by image analysis (see below).
Immunocytochemistry of Cell Cultures
Pinealocytes were cultured for 1-3 days and stimulated as indicated. After stimulation, the medium was collected to determine the melatonin concentration by ELISA. The cells were fixed on the coverslips with 4% paraformaldehyde in PBS for 10 min and washed in PBS. To block endogenous peroxidase, the preparations were treated with methanol containing 0.45% hydrogen peroxide for 10 min. They were then washed and preincubated with 10% normal goat serum (30 min), and incubated with polyclonal antibodies against pCREB (1:500; New England BioLabs) or ICER (1:70,000) (Maronde et al. in press). The antibodies were dissolved in PBS containing 1% bovine serum albumin and 0.3% Triton X-100 to permeabilize the cells. Binding of the antibodies was visualized with biotin-conjugated anti-rabbit IgG as secondary antibody, HRP-conjugated streptavidin as tertiary antibody, and DAB as the coloring reagent. Some preparations were double labeled with an S-antigen antibody (diluted 1:1000) to identify the pCREB-immunoreactive cells as pinealocytes (Korf et al. 1986,1996). Binding of the S-antigen antibody was visualized with an FITC-conjugated anti-rabbit IgG (Dako, Copenhagen, Denmark; diluted 1:200) (Korf et al. 1996). The immunoreacted coverslips were inverted and mounted on standard glass slides.
ELISA
Medium was collected from each cell culture 6 hr after the beginning of the stimulation. Melatonin concentration was measured by a commercial ELISA using biotinylated melatonin (IHF GmbH; Hamburg, Germany) as tracer. The detection limit of this assay is 2 pg melatonin/ml. The intra-assay and interassay variation coefficients were below 15%.
Statistical Analysis
Apart from single immunoblots, the graphs show the means (±SEM) of 3-20 measurements which stem from one of three experimental series. These data were subjected to Student's t-test or one-way ANOVA with subsequent Bonferroni tests for multiple comparisons using the program PRISM (GraphPad; San Diego, CA) with p < 0.05 as the criterion of significance.
Optical Equipment/Computer Hardware
The images were recorded with a standard black/white CCD camera equipped with a macro-objective for analysis of immunoblots. The blots were placed in a dark chamber to reduce stray light and were illuminated either with transmitted light (chemoluminescence blots on photographic films; Figures 1A and B) or with reflected light (DAB-reacted blots on nitrocellulose membranes; Figure 1?). For analysis of the immunocytochemical preparations, the camera was connected to a microscope (Zeiss, Photomikroskop II; Oberkochen, Germany). The light source was controlled by a finely adjustable constant voltage transformer (Zeiss). A continuous color filter (400-700 nm; Zeiss) was used to adjust the contrast (see Peretti-Renucci et al. 1991). The signals from the camera were fed into an image analysis system (VIDAS 2.1; Kontron, Eching, FRG; 386 processor, DOS environment) via a video frame grabber board.
Digitization of Images
All images were digitized at a spatial resolution of 512 × 512 pixels and a gray value resolution of 8 bits (gray values 0-255). The present method requires controlled and reproducible access to the parameters of the analogue/digital (intensity/gray value) conversion. In the VIDAS 2.1 system, this conversion is controlled numerically via the software, but not all systems allow this control (Vigo et al. 1991). For all digitizations, we used a linear conversion (see Figure 1F). For the different digitization procedures (see below), this conversion line was adjusted and fixed by numerical values for its slope (gain) and y-intersection (offset).
Measurement of Area and Intensity of Signals in Immunoblots
Individual signals in immunoblots vary in size and intensity. On the basis of the assumption that the antigen amount affects both variables, we considered the integrated intensity of the signals a suitable measurement parameter to estimate the antigen amount. The integrated density can be determined by summing up the gray values of all pixels representing an immunosignal. To examine the correlation between this parameter and the antigen amount, we analyzed calibrated immunoblots containing known antigen amounts in the different lanes (Figure 1). To cover the entire dynamic range of gray values (0-255), the analogue/digital conversion was set in such a way that pixels of a gray value close to 0 were attributed to the most intensely immunostained areas (red range in Figures 1D and 1F) and pixels of gray values close to 255 to the unstained background (green range in Figures 1D and 1F). The image was then inverted (negative image in Figure 1E) to attribute the numerically highest gray values to pixels that represent the most immunoreactive sites. Thereafter, the sum of gray values of all pixels belonging to an individual band in the blot was calculated. This value was called SUMDENS (for sum of densities). To normalize the means of SUMDENS values from different blots, each value was given as percentage of the maximal value of the corresponding curve. The normalized means were plotted against the logarithm of the antigen concentration.
Measurement of Area and Intensity of Signals in Immunocytochemical Preparations
Each experiment required a set of 20-30 coverslips loaded with pineal cells that were prepared on the same day, cultured for the same time period, and treated with various concentrations of the stimulants. Typically, three to five coverslips were treated with the same concentration. The cells were then fixed and immunoreacted in one batch, i.e., they were exposed to identical antibody solutions, buffers, and chromogens, for exactly the same amount of time.
Compared to the analysis of the immunoblots, the semiquantitative analysis of immunocytochemical preparations raises the following additional problems. (a) Whereas in immunoblots several different lanes can be digitized as a single image, the images from several immunoreacted coverslips must be digitized separately but under identical conditions. (b) The cellular or subcellular compartments containing the immunoreactivity need to be identified and separated from their surroundings. (c) The number and density of cells per coverslip varies, and this variation needs to be corrected to obtain comparable measurements. Finally, (d) in different experiments comprising different sets of coverslips, the intensity of the immunocytochemical reaction may vary from set to set and has to be normalized.
From each set of coverslips, the preparation with the most intense immunoreactivity (Figure 2A, upper panel) was used to fix the settings of the light intensity, the color filter, and the analogue/digital conversion. These settings were visually controlled by a pseudo-color mask (Figures 2A and 2B), which was displayed online. The adjustable color filter was used to fit the contrast of strongly or weakly immunoreactive coverslips into the computer's dynamic range. After these settings were determined for the most intensely stained preparation of one experiment, they were kept constant during the digitization of all other less intensely immunoreactive preparations from the same experiment (Figure 2A, lower panels). During these digitizations, only very small changes in the intensity of the light source were allowed to adjust the background of each preparation to exactly 255. Therefore, the effects of variations in, e.g., the ambient light, intensity fluctuations of the light bulb, and differing thicknesses of the glass slides could be eliminated. Depending on the density of the cells, approximately 50-200 cells were contained in one image. Typically, three or four digital images were created from different regions of one coverslip and three to five coverslips were used for one particular stimulus concentration. Therefore, one data point reflects measurements of 500-4000 cells. This digitization procedure allowed each individual experiment to be normalized to the maximal/minimal response that was obtained under the particular conditions of the experiment itself.
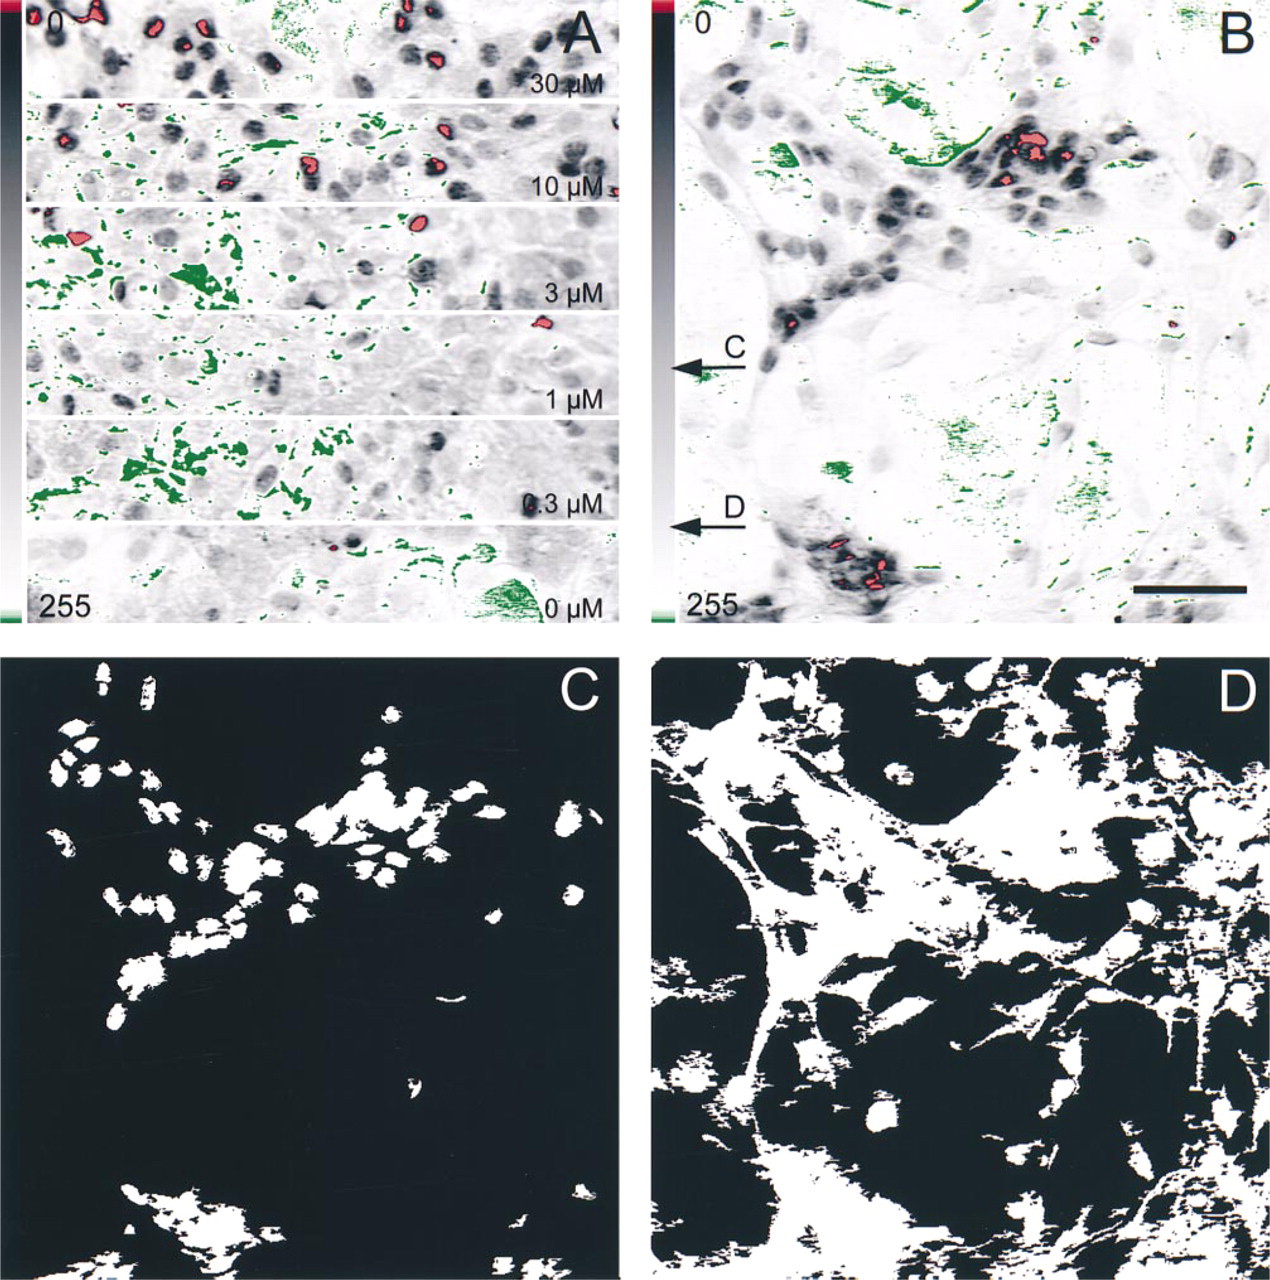
Immunocytochemical preparations, their digitization, and some steps of image analysis. (A) Sections of digital images from a set of immunocytochemical preparations used to record a dose-response curve. Cells were stimulated with Sp-DClcBIMPS (30-0 μM) and immunoreacted for pCREB. The immunostain is restricted to the nuclei. A pseudo-color mask is superimposed; its scale is displayed at left. Upper panel shows the most intensely stained preparation of the set that was used to set the parameters of the analogue/digital conversion. The less intensely stained preparations in lower panels were digitized with the same adjustments. Note the gradual decrease in numbers of red (intense immunoreaction) pixels from upper to lower panels and the constancy of green pixels over the background. (B) Full digital image with a pseudo-color scheme identical to that shown in A. The cells were stained for pCREB and digitized according to the routine illustrated in A. Arrows indicate the gray values that were used as segmentation thresholds for the generation of the binary images in C and D. These thresholds were kept constant for all images belonging to one experiment. (C) Binary image of the immunoreactive nuclei. (D) Binary image of the whole cells. Bar = 50 μm.
The procedures to determine the SUMDENS in an individual digital image and to correct it for various cell numbers are illustrated in Figure 2. The first image of an image analytical sequence (Figure 2B, still displaying the pseudocolor mask from the digitization) was inverted to generate a measurement image (not shown) in which strongly immunoreactive sites are represented by pixels with numerically high gray values. The first image was then slightly contrast-enhanced (not shown) and segmented to generate two binary images, one representing the immunoreactive area (Figure 2C), and the other representing the total area of all cells (Figure 2D). The segmentation thresholds (arrows in Figure 2B) were kept constant for all images stemming from one set of coverslips. One binary image (Figure 2C) served as a mask to determine the SUMDENS value with reference to the inverted image; the other (Figure 2D) was used to determine the total area covered by cells. The SUMDENS value was divided by this area value, and the resulting parameter was called corrected SUMDENS (corr. SUMDENS, for cell number-corrected sum of densities).
Comparison of Results from Immunoblots and Immunocytochemistry
To validate the recordings from immunocytochemical preparations, we subjected paired sets of coverslips to identical treatment and processed one set for immunocytochemistry and the other for immunoblotting. The SUMDENS and corrected SUMDENS, respectively, were measured in the blot and on the coverslips and the resulting dose-response curves were compared.
Results
Calibration Measurements in Immunoblots
SUMDENS values were measured in several calibrated immunoblots that contained known amounts of antigen in each lane detected by chemoluminescence. The measurements provided an array of saturation curves (Figure 3A) for the SUMDENS vs the antigen concentration for all antigens (CREB, pCREB, c-PKA) and exposure times (1-15 min) tested. A plot of normalized SUMDENS values against the logarithm of the antigen concentration (Figure 3B) showed an almost linear relation between the two parameters. A linear relation was also observed in blots developed with DAB, which is routinely used as a chromogen for immunocytochemical preparations. When the immunoreaction for c-PKA was visualized in the same preparation, first by chemoluminescence (on film, Figure 1B) and then with DAB (directly on the nitrocellulose membrane, Figure 1C), the curves reflecting the SUMDENS vs antigen concentration were strictly parallel, including a deviation from linearity at the second lowest antigen concentration detectable (Figure 3C).
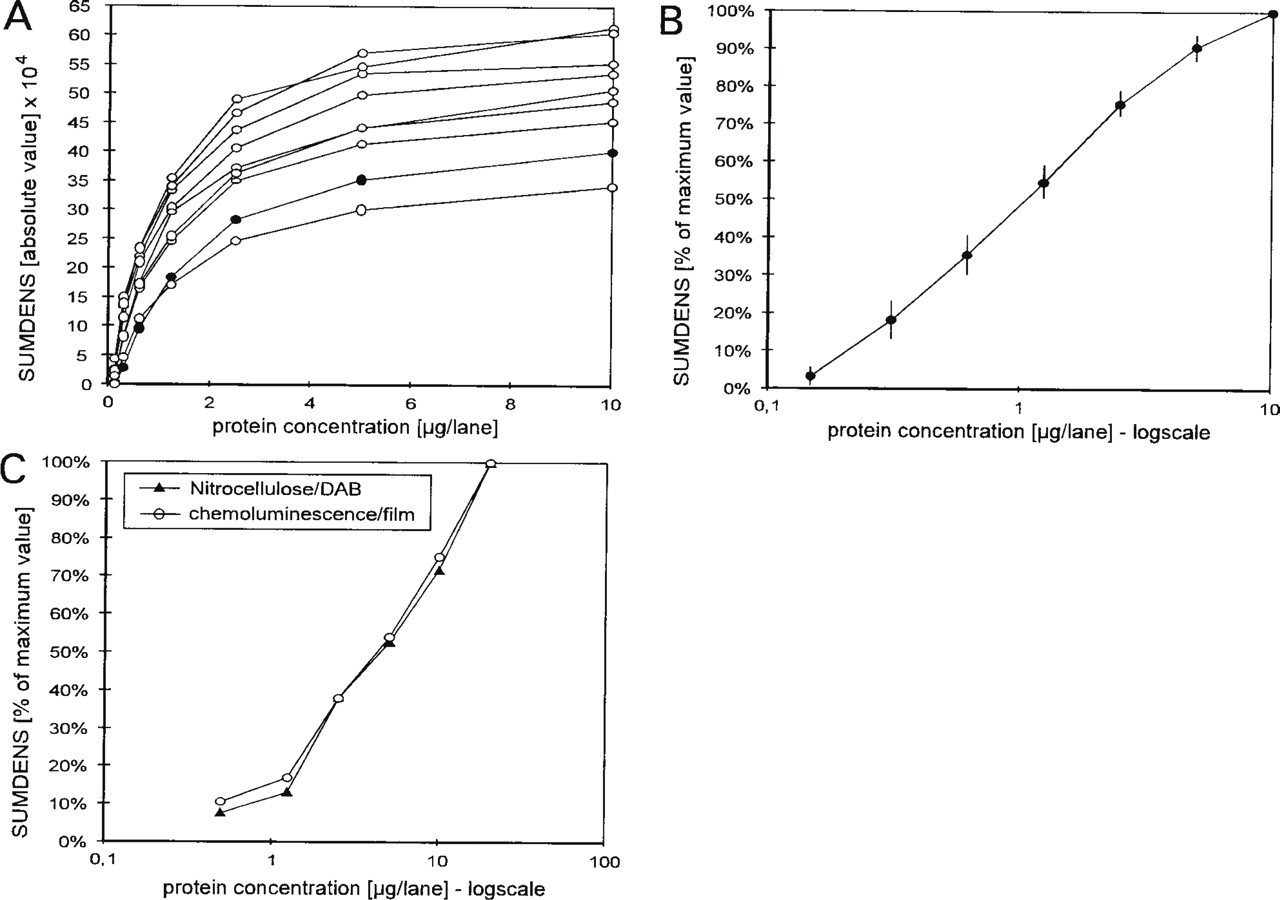
Results from measurements in calibrated immunoblots. (A) An array of saturation curves (absolute SUMDENS values vs antigen concentration) obtained from the blot illustrated in Figure 1A (dots) and from other blots (circles) incubated with antibodies against c-PKA and pCREB and developed by chemoluminescence with various exposure times (1-15 min). (B) Same set of data as in A, but the SUMDENS values were normalized to the maximal value of each curve; the means of these values (±SEM) are plotted against the logarithm of the antigen concentration. (C) Comparison of normalized SUMDENS values vs antigen concentrations obtained from the blot shown in Figures 1B and 1C.
Comparison of Measurements from Immunoblots and Immunocytochemical Preparations
Treatment of pinealocytes with increasing concentrations of the AMP analogue Sp-DClcBIMPS resulted in an induction of CREB phosphorylation, which was semiquantified in one and the same experiment by both immunocytochemistry (images of the cells are shown in Figure 2A) and immunoblotting (blot is shown in inset of Figure 4A). The immunocytochemical preparations showed the typical nuclear localization of pCREB. The dose-response curves generated by both methods matched very closely (Figure 4A) and revealed half-effective concentrations (EC50) of 5 or 6 μ? in the immunocytochemical preparations or the immunoblot, respectively. At very low concentrations of the stimulant, the measurement of the corrected SUMDENS in the immunocytochemical preparations appeared to be even more sensitive than the SUMDENS measurements in the immunoblot.
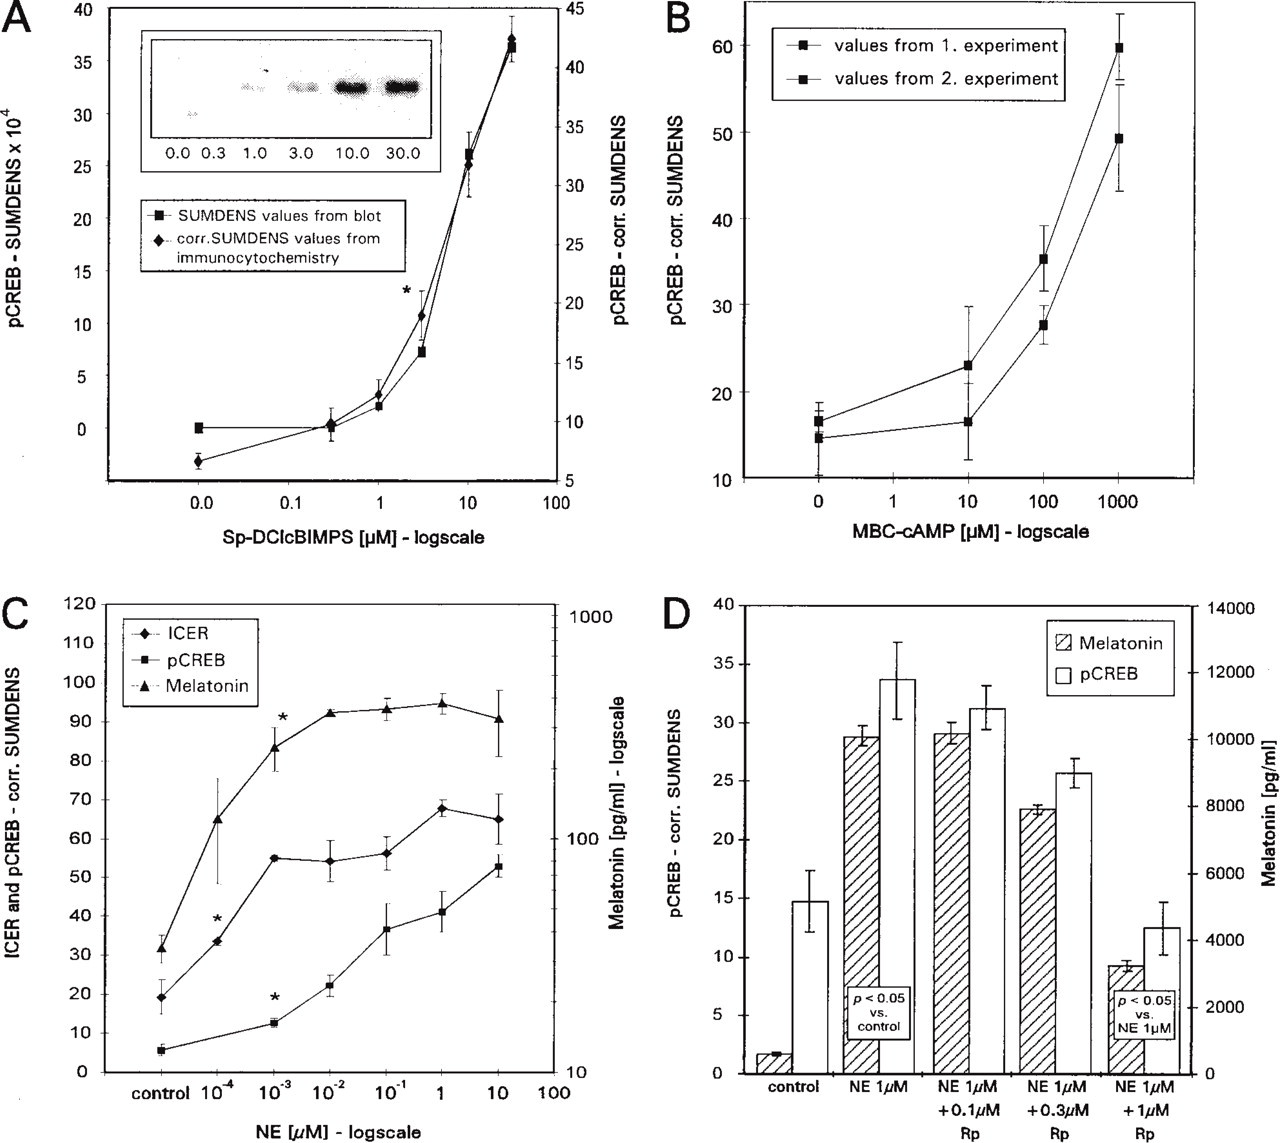
Results from validation experiments and from applications. (A) Dose-response curves recorded from cells stimulated with Sp-DClcBIMPS and immunoreacted for pCREB. One curve was obtained from SUMDENS measurements in immunoblots (inset), the other from corrected SUMDENS measurements in immunocytochemical preparations (images of the cell cultures are shown in Figure 2A). Values marked with an asterisk and higher values differ significantly (p<0.05) from control values. (B) Graph showing the corrected SUMDENS values of pinealocytes from two different experiments started on two different days using cell cultures from different animals. In both cases, the cells were stimulated with the cAMP analogue MBC-cAMP and immunostained for pCREB. (C) Three dose-response curves resulting from a stimulation of a single pinealocyte culture with norepinephrine (NE). Melatonin concentration in the medium was measured via ELISA; the concentrations of pCREB and ICER were determined by corrected SUMDENS measurements in immunocytochemical preparations. Values marked with an asterisk and higher values differ significantly (p<0.05) from control values. (D) Histogram showing the effect of the cAMP antagonist Rp-8-CPT-cAMPS (Rp) on melatonin concentration in the medium (determined via ELISA) and intracellular concentration of pCREB levels (determined via immunocytochemistry/corrected SUMDENS measurements). Increasing doses of the antagonist suppress the stimulatory effect of 1 μM norepinephrine on melatonin production and levels of pCREB.
Reproducibility of Measurements in Immunocytochemical Preparations
The effects of various cAMP agonists and antagonists on the intracellular concentration of pCREB and ICER were measured in a number of immunocytochemical experiments. Reproducible and comparable dose-response curves were obtained from different experimental sets of coverslips that were prepared from different animals on different days. An example is given in Figure 4B, showing corrected SUMDENS values from two such experiments. The cells were stimulated with the cAMP analogue MBC-cAMP and immunostained for pCREB; the dose-response curves obtained in both experiments are almost identical.
Application of the Method in Cytopharmacological Experiments
The intranuclear concentrations of pCREB and the inhibitory transcription factor ICER, as well as melatonin biosynthesis, are affected by β-adrenergic stimulation in a dose-dependent manner. The dose-response curves for both melatonin and ICER reached saturation at norepinephrine (NE) concentrations between 0.001 and 0.01 μM, whereas the values for pCREB did not reach saturation even at the highest NE concentration tested (Figure 4C).
Blockade of PKA with the cAMP antagonist Rp-8-CPT-cAMPS reduced the nuclear amount of pCREB (determined via immunocytochemistry) and suppressed induction of melatonin biosynthesis in a dose-dependent manner (Figure 4D).
Discussion
Many immunocytochemical reactions and interactions are nonstoichiometric (Vandesande 1979). Nevertheless, several studies (e.g., Agnati et al. 1984; Peretti-Renucci et al. 1991; Cowen and Thrasivoulou 1992; Dobado-Berrios et al. 1992; Thal et al. 1995) have shown that (semi)quantitative analyses of immunocytochemical preparations provide valid results if the immunochemical and image analytical parameters are vigorously controlled. Such quantifications may even be of diagnostic and prognostic value in clinical applications (e.g., Geisler et al. 1997; Kumar-Singh et al. 1997; Lehr et al. 1997).
The present study expands the possibilities of the combined immunocytochemical and image analytical approach to routine cytopharmacological applications: the determination of dose-response curves and the comparison of the effectiveness of various agonists and antagonists on intracellular molecules in cell culture systems. The measurement parameters (SUMDENS and corrected SUMDENS) are integrals of the intensity of an immunosignal over its area; both of these variables contain information on the antigen content (Cowen and Thrasivoulou 1992). Our analysis of immunoblots has shown that SUMDENS correlates with the amount of antigen over a wide range of concentrations and under different modes of preparation. The dose-response curves obtained by measurements of the corrected SUMDENS in the immunostained cell cultures were very similar, if not identical, to those obtained by measurements of SUMDENS in corresponding immunoblots. Reproducible data were obtained from different cell cultures that were prepared on different days.
The required equipment is present in many laboratories, and the image analytical procedure is based on a number of standard operations (segmentations and measurements) that can, in principle, be performed with any scientific image analysis software. The only really critical point is the numerical control of image acquisition, analogue/digital conversion, and segmentation. These parameters must be controlled interactively by the programmer/experimenter and must not be left to automatic adjustments of the computer's or camera's internal soft- or hardware (like automated adjustments of image brightness and contrast). Popular commercial programs, such as Adobe Photoshop or Coral Photo House, usually rely on external program/hardware modules for image aquisition, which may be more difficult to control than the internal modules of scientific software. In addition, they usually do not offer the routines that are required for densitometric and planimetric measurements.
The use of cell cultures and the segmentation step in the measurement routine offer the opportunity for regionalized measurements of antigen content. Images such as the ones shown in Figures 2C and 2D allow measurements in different cell compartments, e.g., cytoplasm or nucleus, thus tracing possible translocations of an antigen from one cell compartment into another. Alternatively, such images can be used to identify subpopulations of cells that show different responses to a given stimulus.
With this method, we identified protein kinases of Type A as catalysts of NE-induced/cAMP-mediated CREB phosphorylation in rat pinealocytes, as is the case in bovine (Maronde et al. 1997a). At low to moderate concentrations of adrenergic stimulants, the amount of nuclear pCREB rose in synchrony with the melatonin production, and both decreased when agonists were added. Because transcription of the rate-limiting enzyme of melatonin biosynthesis, arylalkylamine- N-acetyltransferase (AA-NAT) (Coon et al. 1995) can be induced by activation of the cAMP pathway (Borjigin et al. 1995; Roseboom and Klein 1995; Roseboom et al. 1996) and because the AA-NAT gene promoter contains a CRE (Foulkes et al. 1996; Baler et al. 1997), pCREB is likely to act as an excitatory transcription factor in this system. High doses of adrenergic stimuli saturate the melatonin but not the pCREB response. Adrenergic stimuli were also shown to induce formation of the inhibitory transcription factor ICER (Stehle et al. 1993) in a dose-dependent manner, and ICER may suppress AA-NAT transcription once it has reached a critical concentration (Stehle 1995). The continued increase in pCREB may serve other and yet unknown regulatory functions.
In summary, we have presented a method that we have used in our everyday laboratory work and that has proved to be a useful and flexible tool for different kinds of cytopharmacological investigations in cell cultures.
Footnotes
Acknowledgements
Supported by the Deutsche Forschungsgemeinschaft, Sonderforschungsbereich 269, Projekt B2.
Jörg Stehle and Martina Pfeffer contributed the data on ICER immunoreactivity to this study; Frank Nürnberger helped with some optical equipment that was needed to make the method work. We thank H.-G. Genieser (Bremen) for the gift of MBC-cAMP, C.A. Molina (New Jersey) for the ICER-antibody, G. Schwoch (Göttingen) for the cPKA antibody, and J. Pfeilschifter (Frankfurt) for his perspective and guidance in the preparation of this manuscript.