
Abstract
We used confocal microspectrofluorometry to investigate intracellular distribution of pirarubicin or THP-DOX in parental K562, CEM, and LR73 tumor cells and their corresponding multidrug-resistant (MDR) strains. Each spectrum of a recorded image was considered as a combination of cell autofluorescence and fluorescence of the drug. In the cytoplasm of parental K562, CEM, and LR73 cells, THP-DOX fluorescence emission profile was similar to that of free drug in aqueous buffer. The (I550nm/I600nm) ratio was 0.50 ± 0.1. However, in the cytoplasm of resistant cells the 550-nm band profile was modified. The I550nm/I600nm ratio was 0.85 ± 0.2 in MDR K562 cells, which is significantly different from the ratio in sensitive cells (p<0.01). This appeared first to correspond to accumulation and selfoligomerization of THP-DOX in cytoplasmic organelles of MDR cells. Transfection of LR73 cells with the mdr1 gene conferred this characteristic on the resistant LR73R cells. Bodipyceramide, a trans-Golgi probe, was co-localized with the typical fluorescence emission peak at 550 nm observed in the cytoplasm of MDR cells. This organelle has been shown to be more acidic in MDR cells. Moreover, this specific pattern was similar to that observed when anthracycline is complexed with sphingomyelin. The typical fluorescence emission peak at 550 nm decreased in MDR cells incubated simultaneously in the presence of the drug and quinine, verapamil, or S9788. Growth inhibitory effect and nuclear accumulation of THPDOX data obtained on LR73R and LR73D cell lines showed that only during reversion of resistance by verapamil and S9788 was an increase of nuclear THP-DOX accumulation observed. Our data suggest that characteristics of molecular environment, such as higher pH gradient or lipid structures, would be potential mechanisms of multidrug-resistance via the sequestration of anthracyclines.
S
Nucleo-cytoplasmic distribution and compartmentalization of anthracyclines have already been investigated, using confocal fluorescence microscopy, on both sensitive and resistant tumor cells (Schuurhuis et al. 1993; Rhodes et al. 1994; Seidel et al. 1995). This technique does not take into account the modifications that can affect the fluorescence profile of the drug, such as quenching and spectral shift of a few nanometers due to different molecular environments or specific interaction with the target.
In our previous works, using confocal laser microspectrofluorometry (Gigli et al. 1988; Morjani et al. 1992) and by measuring nuclear concentrations of anthracyclines on single living cells, we were able to acquire information on the mechanisms of drug resistance related to drug transport (Gigli et al. 1989; Pelletier et al. 1990; Pignon et al. 1995; Morjani et al. 1997). We could also show that this accumulation increased when MDR modulators were used in combination with the anthracyclines (Sebille et al. 1994). By using confocal fluorescence spectral imaging, Millot and co-workers have described a specific environment of rhodamine 123 (Millot et al. 1994) and acridine orange (Millot et al. 1997) in the cytoplasm of MDR cells.
Here we report on the spectroscopic evidence of a specific interaction of pirarubicin (THP-DOX) in cytoplasmic organelles of MDR cells. This specific spectral pattern disappeared in resistant cells incubated simultaneously in the presence of the drug and MDR modulators. Data obtained on growth inhibitory effect and nuclear accumulation of THP-DOX in the presence of MDR modulators, particularly quinine, poses intriguing questions regarding the role of the cytoplasmic environment of anthracyclines in MDR cells.
Materials and Methods
Chemicals
Anticancer Drugs. Pirarubicin or tetrahydropyranyl-doxorubicin (THP-DOX) was provided by Laboratoires Bellon (Neuilly, France). Doxorubicin (DOX) was purchased from Farmitalia (Milan, Italy). Vinblastine (VLB) was purchased from Sigma (St Quentin Fallavier, France). THP-DOX and DOX are prepared in PBS at a concentration of 1 mM and stored at -20C.
Resistance Modulators. S9788, a new triazinoaminopiperidine derivative, was generously given by Institut de Recherche Internationale Servier (Paris, France). Verapamil (VPL) and quinine (QUI) were purchased respectively from Biosedra (Malakoff, France) and Sigma. S9788 and QUI were prepared respectively in water and methanol at a concentration of 10 mM. VPL was provided in aqueous solution form at 5 mM. All stock solutions of modulators were kept at -20C.
Other Chemicals. The 3-[4,5-dimethylthiazol-2-yl]-2,5-diphenyltetrazolium bromide) or MTT and trypsin were purchased from Sigma. The trans-Golgi probe DMB-ceramide (C5-DMB-Cer) was purchased from Molecular Probes (Eugene, OR).
Cell Lines
LR73 Chinese hamster ovary-sensitive carcinoma cells were transfected with the mammalian expression plasmid pDREX4 containing the biologically active cDNA insert of phagel DR11 (LR73R) (Gros et al. 1986). LR73D cells were selected by exposure of LR73 cells to continuously increasing doxorubicin concentrations. The two MDR cell lines LR73D and LR73R overexpress the P-glycoprotein at the same level as determined by immunolabeling using FITC-conjugated C219 antibody or RT-PCR (Belhoussine et al. 1997). Sensitive and resistant LR73 cells were grown as monolayer cultures in RPMI 1640 medium (Gibco; Paris, France) supplemented with 10% fetal calf serum (Gibco) at 37C in a humidified chamber containing 5% CO2 in air. Resistant cell lines were maintained in the presence of 200 nM doxorubicin.
K562 is a human erythroleukemic cell line established from a patient with chronic myelogenous leukemia in blast transformation (Lozzio and Lozzio 1975). K562R cells were obtained by continuous exposure of parental cells to stepwise increasing concentrations of DOX in the medium until 100 nM (Tsuruo et al. 1986).
CEM is a human leukemic lymphoblastic cell line (Beck et al. 1979). CEMR cells have been selected for resistance to 500 nM of VLB (Beck 1983). Sensitive and resistant CEM and K562 cells were maintained in suspension culture in RPMI 1640 medium supplemented with 10% fetal calf serum at 37C in a humidified chamber containing 5% CO2 in air. The drug was removed from the culture medium 2 days before the experimentation. Northern blot, RT-PCR, and immunolabeling analyses have shown that resistant K562 and CEM cell lines overexpress the P-glycoprotein (Morjani et al. in press).
Cytotoxic Effect of THP-DOX
LR73 cells were maintained at 37C in the absence of THPDOX in a 96-multiwell dish (103 cells/well). After 1 day, THP-DOX (0.1 nM-100 nM) was added to each sample in the presence or absence of different concentrations of each modulator. After 48 hr, LR73 cells were washed and incubated for 2 days in fresh medium before MTT assay measurements. Cell viability was then determined by addition of 20 μl of 2.5 mg/ml MTT for 3 hr at 37C. Then the medium was discarded and 200 μl DMSO was added to each well. Optical densities were measured at 540 nm using a Series 750 microplate reader (Cambridge Technology; Watertown, MA). IC50 (concentration that induces 50% inhibition of cell growth) values were calculated from the ratio of optical densities of treated cells to that of control cells (Sebille et al. 1994).
Confocal Laser Scanning Microspectrofluorometry
This technique allowed the acquisition and analysis of fluorescence signals from a microvolume of living cancer cells treated with the anthracycline. The original microspectrofluorometer M51 (Dilor; Lille, France) is equipped with an ionized argon laser (2065; Spectra Physics, Les Ulis, France). For our measurements the 457.9-nm excitation line was used. The optical microscope BX40 (Olympus; Tokyo, Japan) equipped with a X 100 phase contrast water-immersion objective UVFL-100PL permitted a micrometer spatial resolution (Sharonov et al. 1994). The microscope was coupled to a single-grating (300 grooves mm-1) spectrograph through the confocal entrance chamber. Two synchronized scanners realized the line illumination along the X axis in the plane of the sample, and the motorized stage translates the sample along the Y axis. The fluorescence emission of treated cells was analyzed with an air-Peltier-cooled CCD detector (Wright; Stonehouse, UK) supplied with an 1125 X 298 pixel sensor element and optically coupled to an image intensifier (Sharonov et al. 1994).
Confocal Spectral Image Acquisition
Confocal spectral imaging analysis is an effective probe for antitumor drug distribution in single living cells. This approach is based on a line illumination system that employs a two-dimensional detector and a system of two synchronized scanning mirrors, which provides simultaneous spectral accumulation from hundreds of points on the sample in real confocal mode for each point. While the laser beam is being moved by the first scanning mirror along the X axis in the plane of the cell, the emitted light from the line is timeencoded on the first scanning mirror and transmitted to the pinhole diaphragm for confocal filtration. After passing through the diaphragm, the signal is decoded by the second scanning mirror vibrating in phase with the first one. Then the light is dispersed into spectra by the grating spectrograph and focused onto a two-dimensional CCD detector. The sample holder is moved with an automatic scanning stage along the Y axis with a minimal step size of 0.1 μm. A set of 50 X 50 spectra are recorded at different locations of the cell and a whole spectral image is generated by the line-by-line scanning system. The scanning of the sample stage and mirrors of the optical scanners and all operations connected with recording of spectra are computer-controlled. All treatment and analysis of spectral images were acquired with an RISC 6000 model 520 workstation (IBM).
Determination of Nuclear Concentration of THP-DOX
The fluorescence emission spectrum originating from nuclei of LR73-treated cells F(λ), can be expressed as a sum of the spectral contributions of free THP-DOX, DNA-bound THPDOX, and signal of nuclear autofluorescence (Gigli et al. 1988)

where Ff and Fb are the fluorescence spectra of free and bound drug referred to a unitary concentration. Taking this concentration into account, Cf and Cb represent intranuclear concentrations of free and bound drug, respectively. Cn is the contribution of autofluoresence responsible for the intrinsic nuclear spectrum Fn. In aqueous solution, each of these contributions has a characteristic spectral shape. The fluorescence yield in the free form was 40 times higher than that of the bound-DNA form. These spectral contributions lead to the concentrations of free and DNA-bound THPDOX. The sum of the values obtained gives the total nuclear concentration of THP-DOX (Gigli et al. 1988,1989).
Co-localization of THP-DOX and DMB-Ceramide in LR73D Cells
Cells were incubated in the presence of C5-DMB-Cer complexed with defatted BSA (DF-BSA) for 30 min at 2C, washed, and incubated with 5 μM THP-DOX in HMEMB for 2 hr at 37C. The complex contained 5 μM of both the fluorescent lipid and DF-BSA and was prepared in 10 mM 4-(2-hydroxyethyl)-1-piperazineethane sulfonic acid-buffered Eagle's MEM, pH 7.4, containing 0.5 mM choline chloride, ethanolamine, serine, and (myo)inositol (HMEMB) (Pagano et al. 1991).
Results
Cytoplasmic Localization of THP-DOX in MDR Cell Lines
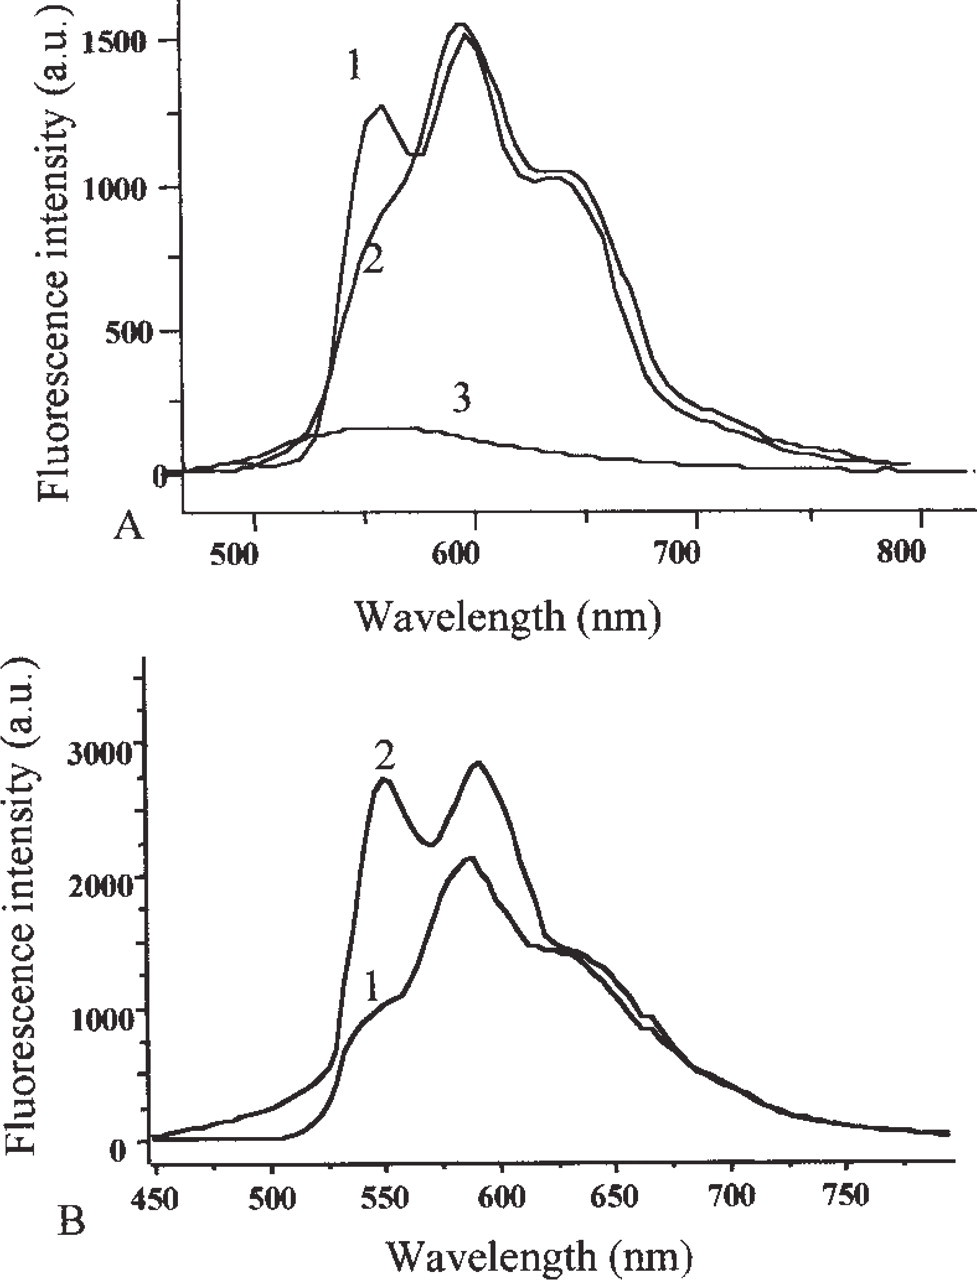
For spectral measurements, cells at 100,000 cells/ml density were incubated in the presence of 1 μM THPDOX for 2 hr at 37C. Figure 1A shows the spectra recorded from the cytoplasmic region of K562 and K562R cells. After subtraction of autofluorescence, analysis of the spectral contributions of THP-DOX showed that, in the cytoplasm of K562 cells, THPDOX emission was similar to that in PBS. In this case, the intensity ratio of the 550- and 600-nm bands (I550nm/I600nm) was 0.5 ± 0.1 in K562 cells and 0.5 in PBS. However in the cytoplasm of K562-resistant cells, the I550nm/I600nm was 0.85 ± 0.2, which was significantly different from the ratio in sensitive cells (p<0.01). We observed the same spectral profile in CEMR, LR73R, and LR73D cells. It is important to note that the LR73R cell line was transfected with the mdr1 gene. Data on the emission intensity ratios (I550nm/I600nm) corresponding to sensitive and resistant K562, CEM, and LR73 cells are summarized in Figure 2A.
(
Using the scanning system, a set of 50 X 50 spectra were recorded at different locations in the tumor cells and the integrated intensities of spectra allow a fluorescence spectral image equivalent to that expected with a conventional microscope to be obtained. In each of the 50 X 50 spectra, the contribution of the model spectra, i.e., (a) fluorescence spectrum of untreated cells, (b) fluorescence spectrum of THP-DOX in the cytoplasm of a sensitive cell, and (c) fluorescence spectrum of THP-DOX in the cytoplasm of resistant cells, were determined (Figure 1).
Taking into account the scale and by employing a pseudocolor intensity representation, the integrated intensities of these three contributions allowed us to obtain three images: (a) autofluorescence of the cell (data not shown), (b) THP-DOX fluorescence in a sensitive-like environment, and (c) THP-DOX fluorescence in a resistant-like environment. We investigated the distribution of THP-DOX in the resistant cell lines K562R, CEMR, LR73D, and LR73R. As expected, Figure 3 shows that in K562R cells the contribution of THP-DOX in a resistant-like environment was more important than the contribution of the free drug. In contrast, the images from K562 cells showed a significant contribution of free THP-DOX in the cytoplasm and no spectral contribution of THP-DOX as recorded in a resistant-like environment. A similar pattern of THP-DOX distribution was observed in the sensitive and resistant CEM and LR73 cells.
To identify the organelle in which THP-DOX is localized in MDR cells and especially the 550-nm emission band, LR73D cells were incubated in the presence of C5-DMB-Cer and THP-DOX (see Materials and Methods). The results in Figure 4 show that THPDOX fluorescence emission in both the sensitive- and resistant-like environments (Figure 1A, Spectrum 1) appears to be co-localized. This co-localization (cf. Figures 4E and 4F) is probably due to the existence of an equilibrium between the free and bound forms of the drug. Distribution of the monomeric form of C5-DMB-Cer (green fluorescence) appears to be more diffuse in the cytoplasm, whereas the oligomeric form (red fluorescence) is more localized in the trans-Golgi apparatus. In fact, DMB-ceramide in the cis-Golgi (monomer) is converted to DMB-sphingomyelin, which accumulates in the trans-Golgi. This red fluorescence was partially co-localized with THP-DOX fluorescence in a resistant-like environment (cf. images 4D and 4E). Figure 1B shows that this specific pattern of fluorescence emission (Figure 1A, Spectrum 1) was similar to that obtained when THP-DOX is complexed to sphingomyelin (Figure 1B, Spectrum 1). THP-DOX complexed to sphingomyelin was prepared as described by Schwartz and Kanter (1979).
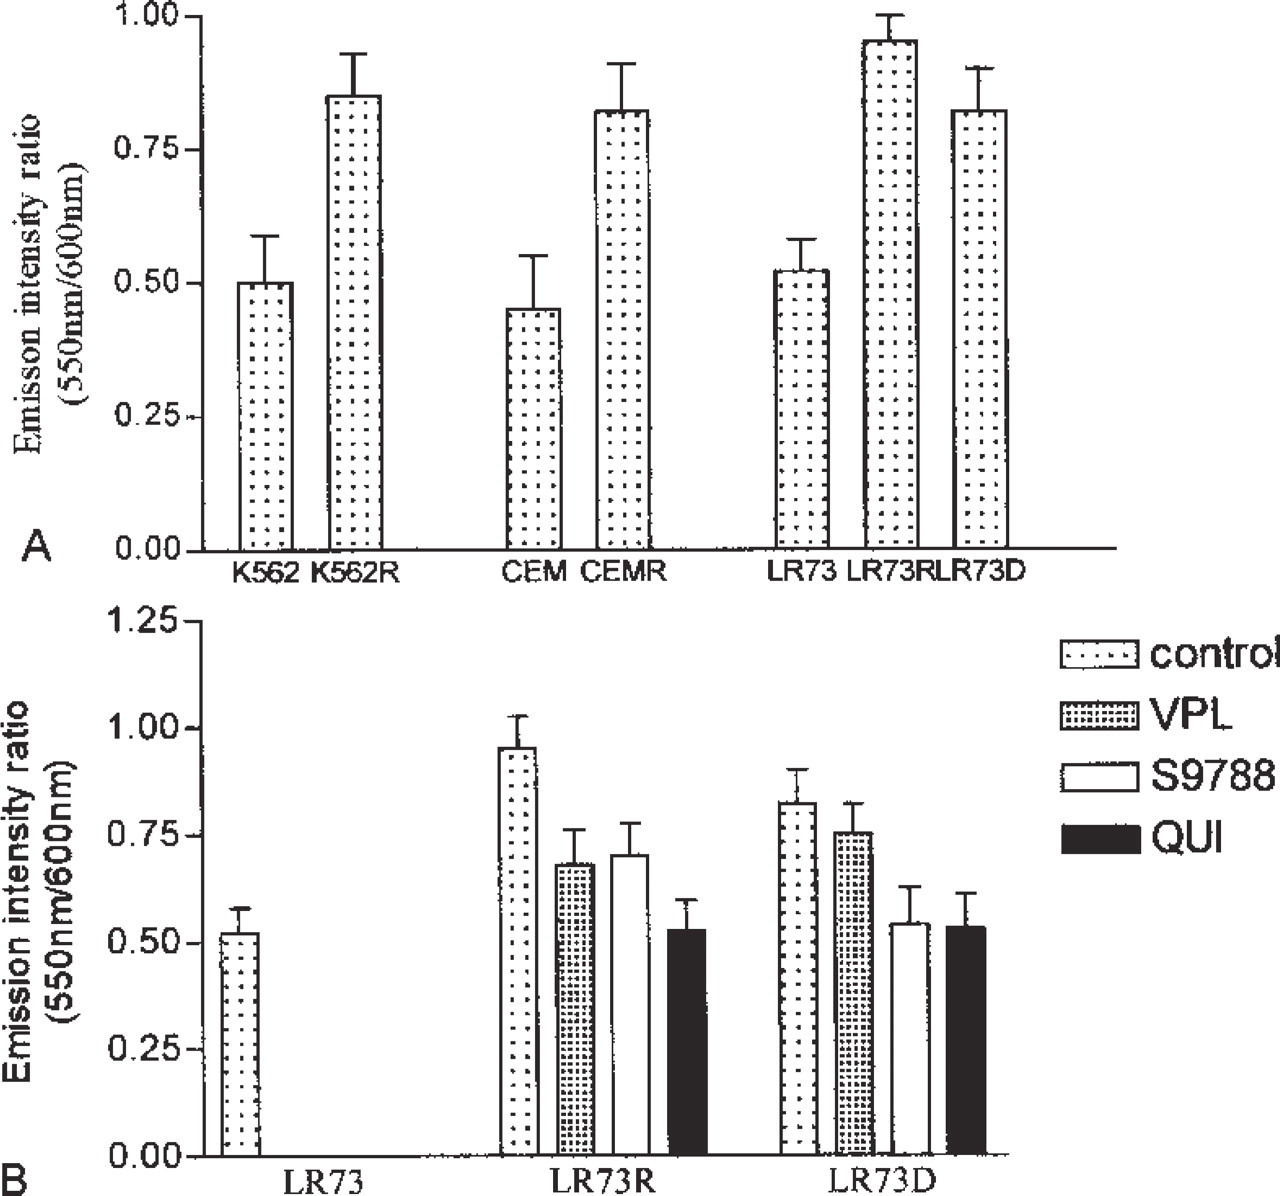
Emission intensity ratio (I550nm/I600nm) of THP-DOX. (
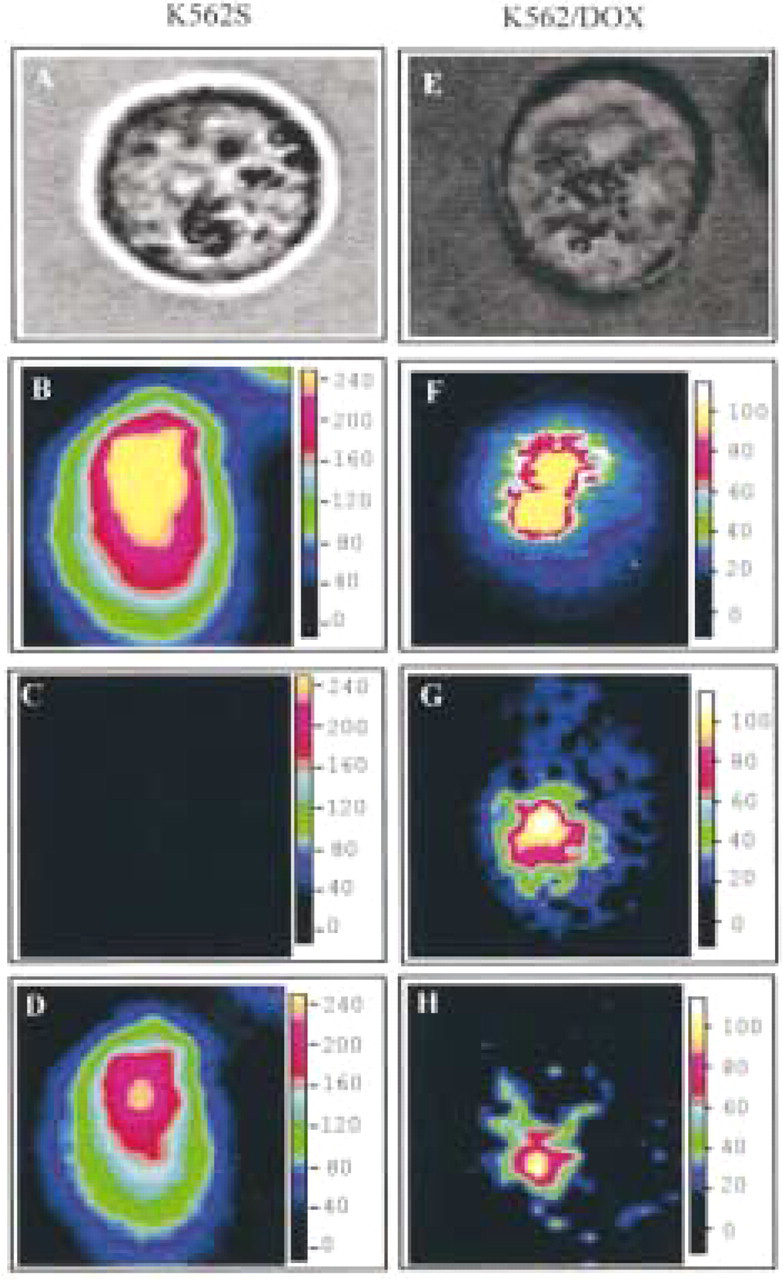
Scanning microspectrofluorometric images of THP-DOX in K562 (
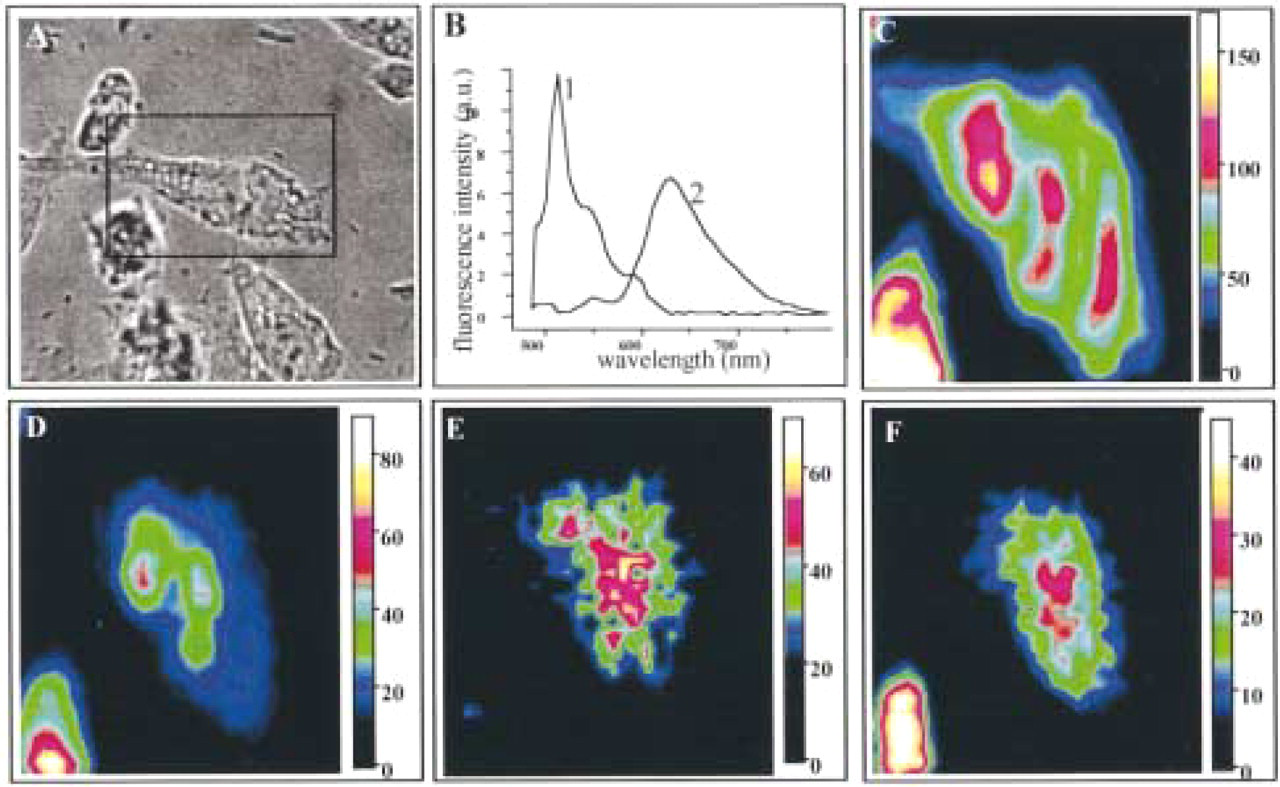
Co-localization of THP-DOX and C5-DMB-Cer in an LR73D cell. (
Effect of the Reversing Agents on THP-DOX Distribution in LR73 Cells
To study the effect of MDR modulators on the subcellular distribution of THP-DOX in MDR cells, LR73R and LR73D at 100,000 cells/ml were incubated simultaneously with 1 μM of THP-DOX and 5 μM QUI, VPL, or S9788, maintained for 2 hr at 37C, and then washed with PBS at 4C. The effect of VPL, S9788, and QUI on emission intensity ratio (I550nm/I600nm) of THPDOX are summarized in Figure 2B. The results show that modulators were able to decrease the fluorescence intensity ratio (I550nm/I600nm).
We have evaluated the cytotoxic effect and nuclear accumulation of THP-DOX. For this, LR73D and LR73R cells were incubated with THP-DOX and reversing agents (S9788, QUI, and VPL) as described in Materials and Methods. The results obtained are summarized in Table 1. At modulator concentrations that induce less than 10% cell death, S9788 and verapamil appear more potent than QUI. Verapamil and S9788 decreased the IC50 to the same level as that in sensitive cells. The reversing activity of QUI was different in the two cell lines. Treatment with 20 μM QUI decreased the IC50 of THP-DOX in LR73D cells to the same level as that obtained in LR73 cells (the reversing factor was 43), whereas in LR73R cells the reversing factor was 14.4.
To determine if co-incubation of MDR cells in the presence of THP-DOX and S9788, QUI, or VPL induces an alteration in the nucleo-cytoplasmic distribution of THP-DOX, we measured the nuclear concentration of THP-DOX by confocal laser microspectrofluorometry. In this study, LR73 cell lines were incubated simultaneously with 1 μM THP-DOX and an appropriate modulator for 2 hr at 37C. It should be noted that, for all experiments performed on all cell lines, the intercell variations were small, and for each experiment the nuclear drug concentration was measured in 20-30 nuclei. Table 2 shows that VPL and S9788 were able to restore drug accumulation in nuclei of resistant cells, whereas QUI was unable to significantly increase nuclear THP-DOX accumulation even at a much higher concentration (20 μM). In addition, LR73D and LR73R cells were not affected in the same manner in the presence of VPL. Nuclear accumulation of THP-DOX in LR73D cells appeared to be less affected by VPL than in the transfected cells, whereas S9788 increased drug accumulation in the same manner in both resistant cell lines.
MDR-reversing effect of modulators a
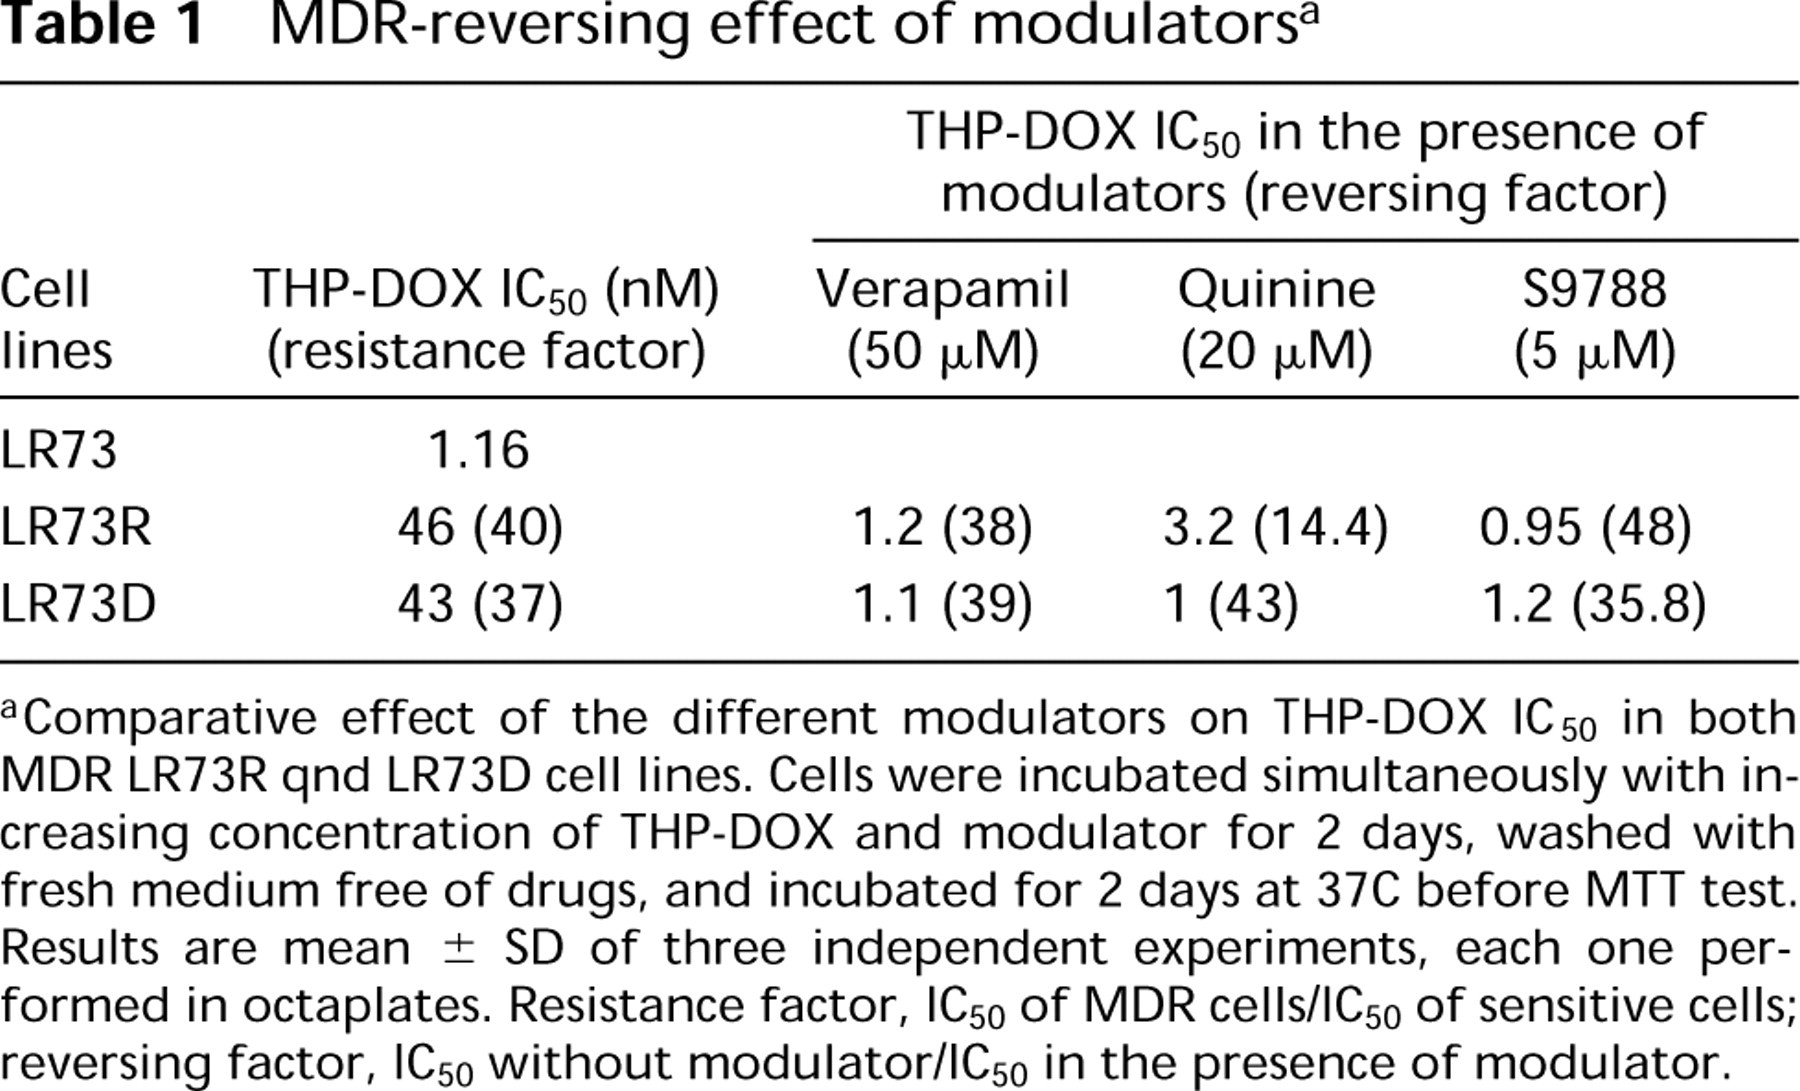
Comparative effect of the different modulators on THP-DOX IC50 in both MDR LR73R qnd LR73D cell lines. Cells were incubated simultaneously with increasing concentration of THP-DOX and modulator for 2 days, washed with fresh medium free of drugs, and incubated for 2 days at 37C before MTT test. Results are mean ± SD of three independent experiments, each one performed in octaplates. Resistance factor, IC50 of MDR cells/IC50 of sensitive cells; reversing factor, IC50 without modulator/IC50 in the presence of modulator.
Discussion
Cytoplasmic Interaction of THP-DOX in MDR Cells
We report here that the specific fluorescence spectral shape of THP-DOX recorded in the cytoplasm is different in MDR cells (I550nm/I600nm = 0.85 ± 0.2) compared to sensitive ones (I550nm/I600nm = 0.5 ± 0.1). Our spectral imaging data show that the observed phenomenon in MDR cells does not depend on the origin of the MDR cell line (K562, CEM, and LR73 cells) and on the drug used for resistance selection (doxorubicin or vinblastine). Moreover, transfection of LR73 cells with the mdr1 gene leads to the observation of this fluorescence spectral pattern. Bodipy-ceramide (green fluorescence), which is converted to bodipy- sphingomyelin in the cis-Golgi and accumulated in the trans-Golgi (red fluorescence), was co-localized with the typical fluorescence emission peak at 550 nm relative to the anthracycline in the cytoplasm of MDR cells. Neutral red, a vital probe of lysosomes, did not have the same cytoplasmic distribution as THP-DOX in resistant cells (data not shown). The same pattern of fluorescence emission at 550 nm was obtained in solution when THP-DOX was complexed with sphingomyelin (Figure 1B). In this case, the complex THPDOX- sphingomyelin was prepared as described by Schwartz and Kanter (1979). The three modulators (verapamil, quinine, and S9788) were able to decrease fluorescence intensity of the 550-nm band, especially quinine and S9788. The relationship between the disappearance of the typical fluorescence emission peak at 550 nm of THP-DOX relative to the cytoplasm of MDR cells in the presence of VPL, S9788, and QUI and the capacity of these modulators to restore nuclear THP-DOX accumulation and sensitivity was studied. All modulators were able to restore THPDOX sensitivity in the resistant cell lines. Our previous data using short time incubation (Belhoussine et al. 1997), and the present work shows that VPL and S9788, which compete with azidopine labeling of P-glycoprotein (Bennis et al. 1995), were able to restore nuclear THP-DOX in both resistant cell lines. However, quinine was unable to significantly increase nuclear THP-DOX accumulation. We have obtained similar results on MDR K562 and CEM cells (Morjani et al. in press).
Models of THP-DOX Interaction in the Cytoplasm of MDR Cells
Phospholipid Hypothesis. Results obtained on THPDOX when complexed to sphingomyelin suggest that a lipidic environment of MDR cells could play an important role in THP-DOX distribution. Sweet and Hume (1996), have shown that bacterial lipopolysaccharide treatment of a murine macrophage cell line conferred on it a transient resistance to the cytotoxic drugs taxol and doxorubicin. Fluorescence properties of THP-DOX and other anthracyclines when incorporated into phospholipids in vitro have been reported by other workers and are similar to those of THPDOX in the cytoplasmic structures of MDR cells (Schwartz and Kanter 1979; Samuni et al. 1986). Results from Samuni and co-workers (1986) have indicated that exposure of vesicular stomatitis virus or E. coli to DOX resulted in the gradual generation of the typical fluorescence emission peak at 550 nm. Lavie et al. (1996) have reported an important accumulation of glucosyl-ceramides in MDR cells and that MDR modulators block glycosphingolipid metabolism by inhibiting ceramide glycosylation in MDR cells (Lavie et al. 1997). A recent study has shown that ratios of fatty acids (methylene/methyl and methyl/choline) are much lower in MDR cells (Le Moyec et al. 1996). Jaffrézou and co-workers (1992) have characterized laminated inclusions in the cytoplasm of MDR cells. These lipidic structures are similar to those observed in Niemann-Pick disease, which is described as a sphingomyelin lipidosis. Other close structures are the lipidic lamellar bodies specific to alveolar Type II pneumocytes, in which H+-ATPase has been functionally demonstrated (pH 5.5-6.0) (Fabisiak et al. 1987). In this case, the weak base propanolol accumulated specifically in these organelles.
Effect of modulators on nuclear THP-DOX accumulation at 1 μM a
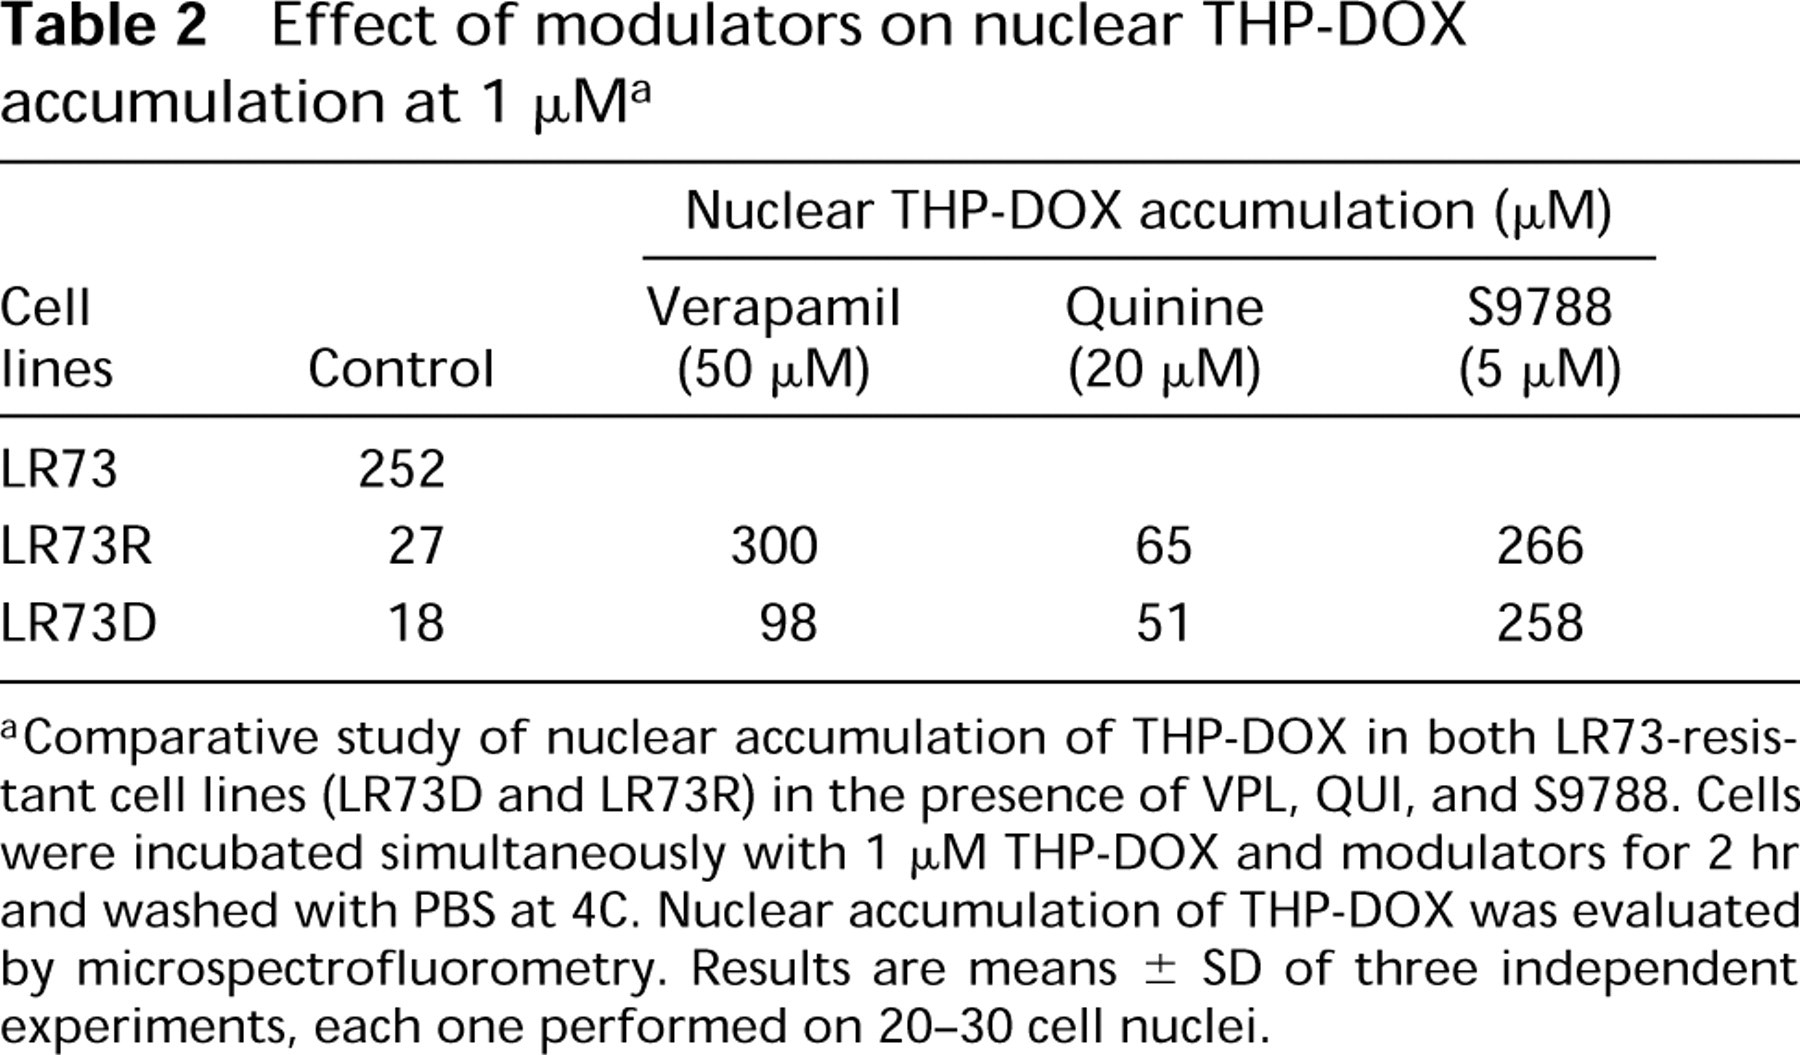
Comparative study of nuclear accumulation of THP-DOX in both LR73-resistant cell lines (LR73D and LR73R) in the presence of VPL, QUI, and S9788. Cells were incubated simultaneously with 1 μM THP-DOX and modulators for 2 hr and washed with PBS at 4C. Nuclear accumulation of THP-DOX was evaluated by microspectrofluorometry. Results are means ± SD of three independent experiments, each one performed on 20-30 cell nuclei.
pH Hypothesis. pH could also play an important role in intracellular drug distribution. The pH-dependent character of anthracycline entrapping in unilamellar vesicles has been shown (Mayer et al. 1986,1990). Several investigators have reported an ATP-dependent uptake of anthracyclines by acidic organelles (Willingham et al. 1986; Moriyama et al. 1994). Weak bases are non-ionized and can cross the cytoplasmic membranes, whereas in acidic vesicles, these molecules bind protons and become membrane-impermeable, i.e., acidtrapping. Evidence of direct involvement of the positively charged amino group of doxorubicin (NH3 +) and the phospholipid phosphate PO2 - group has been provided using infrared spectroscopy (Goormaghtigh et al. 1987). In the study reported by Schindler and coworkers, trans-Golgi and pericentriolar recycling compartments (Barasch et al. 1991) were suspected to be implicated in weak base sequestration (Schindler et al. 1996). On the basis of our results, it appears that THP-DOX is localized in the trans-Golgi. If we postulate that there are negative sites on the internal face of the membrane of this organelle (phospholipids) and that THP-DOX has high affinity for these sites, then the acid-trapping mechanism in MDR cells would induce an increase in binding of anthracycline to these sites. Thus, the spectral shape alteration observed in MDR cells might correspond to accumulation of the anthracycline in such acidic organelles (Schindler et al. 1996). P-glycoprotein, which has been reported to function as a Cl- channel (Valverde et al. 1992), could be responsible for maintenance of acidic pH. This is necessary for trans-Golgi recycling function and for protecting cells from environmental xenobiotics, particularly antitumor agents (Schindler et al. 1996). More recently, we have identified acidic compartments in sensitive and MDR cells by monitoring the emission spectra of acridine orange. The acidification was suppressed by equilibrating the pH gradient through acidic vesicles by carboxylic ionophores (Millot et al. 1997). Therefore, we suggest that an acidic pH of organelles and a lipidic environment may prevent diffuse distribution of anthracyclines and protect MDR cells from their cytotoxic effect.
Footnotes
Acknowledgments
We are grateful to the Institut de Recherche International Servier and Laboratoires Bellon (Paris, France) for their kind gifts of S9788 and pirarubicin, respectively. We thank Dr G.D. Sockalingum for his assistance in the preparation of the manuscript.