
Abstract
Spectral morphometric characterization of typical chronic lymphocytic leukemia (B-CLL) cells vs normal small lymphocytes stained by May-Grunwald-Giemsa was carried out by multipixel spectral imaging. The light intensity (450–850 nm of 104 pixels) from nuclear domains of each stained cell was recorded and represented as light transmittance spectra and optical density. Transmitted light spectra of two nuclear domains were determined, one with low-intensity light transmittance (LIT) and the other with high-intensity light transmittance (HIT). A spectral library was constructed using the four transmitted light spectra representing the HIT and LIT domains of the normal human lymphocytes and the LIT and HIT domains of the CLL cells. The spectral library served to scan CLL lymphocytes from 10 cases of CLL and the lymphocytes of 10 healthy individuals. Each spectrally similar domain in the nuclei of the lymphocytes was assigned an arbitrary color. The morphometric analysis of the spectrally classified nuclei showed specific spectral patterns for B-CLL in 92% of the cells. The specific spectral characteristics of each of the two cell populations were also observed by their optical density light absorbance spectra. We propose that spectral morphometric analysis may serve as an additional diagnostic tool for detection of CLL lymphocytes in a hematological specimen.
The French-American-British group (FAB) has proposed criteria based on cytochemical and immunological methods to establish a clear diagnosis (Bennett et al. 1989; Bain 1993). Immunophenotypic analysis reveals large amounts of surface immunoglobulin (slg) in normal B-cells, which is only weakly expressed or undetectable on B-CLL cells. The CLL cell expresses the pan-B antigens CD19 and CD20 and the activation antigens CD5 and CD23. However, it does not express the terminal B-cell differentiation antigens exhibited by plasma cells (Freedman and Nadler 1993; Harris et al. 1994). B-CLL cells express either κ- or λ-light chains and the monoclonality is essential to establish the diagnosis. Receptors for mouse red blood cell rosettes (MRBC-Rs) are detectable on both B-CLL cells and normal B-cells. However, the two populations express different patterns of complement receptor. Chromosomal abnormalities have been described in about 50% of CLL patients using conventional cytogenetics (Juliusson et al. 1990). The most common are trisomy 12 (10–18%) and structural aberrations of 13q14 (10–28%), including interstitial deletions (Garcia-Marco et al. 1996). In typical CLL, del (11q) is the most common chromosomal abnormality, whereas trisomy 12 is common in atypical CLL (Criel et al. 1997).
To improve CLL diagnosis, we applied spectral imaging techniques for differential analysis of peripheral blood lymphocytes. Spectral imaging enhances the information obtained with light microscopy by providing multipixel spectra that otherwise are impossible to obtain from cytological specimens (Malik et al. 1996a,b,1997; Rothmann et al. 1997). The spectral measurements are based on Fourier transform spectroscopy, a technique of proven capability for spectral analysis. The spectroscopic analysis is based on the ability of histological and cytological specimens to absorb, reflect, or emit photons in ways characteristic for their interactions with specific stains. A high-resolution trace of the intensity of light radiation vs wavelength forms a graphic record unique to a given material. This technology is highly data-intensive, requiring the collection of hundreds of spectral data points for every pixel of an image. Spectral image analysis creates a unique database that enables the demarcation of features and the evaluation of quantities from multipoint spectral information for a histological specimen. Any single position in space defined by a pixel of the image is actually a volume that is very large compared to molecular size, so that the spectral signal coming from each pixel contains contributions from a number of different types of molecules, each with its own complex spectrum.
The capability of spectral imaging to detect and identify known and unknown substances has wide biological application. In cytogenetics, spectral imaging using 24 whole chromosome probes, each one labeled and emitting a different fluorescence spectrum, enables easy detection of chromosomal aberrations in solid tumors (Schrock et al. 1996) and hematological malignancies (Veldman et al. 1997). Spectral imaging of stained histological and cytological specimens reveals unique spectral characteristics based on the interaction between chromatin and stain (Rothmann et al. 1997).
Here we describe a novel spectral analysis technique, termed spectrally resolved morphometry, for the discrimination of CLL from normal lymphocytes based on multipixel spectral data. The analyzed cells were stained with May-Grunwald-Giemsa (MGG) and inspected by conventional light microscopy. The spectral morphometric measurements utilizes the specific chromatin-stain complexes that enhance the shape and structure of the nuclei in each cell population.
Materials and Methods
May-Grunwald-Giemsa Staining of Peripheral Blood Specimens
Peripheral blood was obtained from 10 patients with typical B-CLL, who were diagnosed according to established criteria (Bennett et al. 1989; Cheson et al. 1996), and from 10 healthy individuals (Hematology Unit, Rabin Medical Center, Golda-Hasharon Campus). Patient WBC count consisted of <30 × 103/liter small (>10 μm) mature-appearing lymphocytes per 1 μl, >10% prolymphocytes in the differential count, and the cells were in Stages I-III by the Rai system. Cases with CLL/PL or CLL/large cells were excluded. The patients did not receive chemotherapy for at least 3 months before the samples were obtained. The B-CLL cells displayed surface antigens CD19, CD20, and CD5, and showed light-chain monoclonality. Staining was performed according to the standard MGG method.
Fourier Transform Multipixel Spectrometry System for Microscopy
Spectral imaging was performed using the SpectraCube SD- 200 (Applied Spectral Imaging; Migdal HaEmek, Israel). The SpectraCube system consists of an interferometer situated in the parallel beam between an objective lens (infinity corrected) and a lens equivalent to an eyepiece, whose purpose is to form an image on a CCD camera. The light beam passing through the specimen is split in the interferometer in opposite directions and is united again at the exit with an optical path difference (OPD) that is a function of the angle between the incoming beam and the interferometer itself. The OPD arises because for non-zero angles the two beams undergo different optical paths in the beamsplitter. The inherent mechanical stability of this interferometer allows the Fourier technique to be successfully applied to the visible spectral region. The measurement is done by recording successive CCD frames in synchronization with the steps of the motor used to rotate the collimated beam, so that the instantaneous OPD is known for every pixel in every recorded frame and can be used in the FFT calculation (Malik et al. 1996a). During a measurement (20 sec), each pixel of the CCD (512 × 512) is recording the interfered light from the interferometer, which is then Fourier transformed to give the spectrum. (A detailed description of the optical system is published in Malik et al. 1996a.)
Briefly, in spectral imaging each pixel is actually one of several tens of thousands of microspectrometers, acting simultaneously and independently. As a result, spectral imaging acquires a so-called cube whose appellate signifies the two spatial dimensions of a flat sample (x and y) and the third spectrum dimension representing light intensity at any wavelength. The calculated pixel size in a spectral image is 0.04 μm2. The spectral resolution (FWHM, full width at half maximum) is 5 nm at 400 nm (12 nm at 600 nm) and the spectral range (more than 5% response) is 400–1000 nm (Garini et al. 1996).
Optical Density Images
The SpectraCube software provides the possibility for calculation of approximate values of optical density for each pixel in the image, based on the spectra stored in the transmittedspectra “cube.” For these calculations, the incident light was defined as a pixel outside a cell. The calculated data are stored in a new optical density cube, revealing the corrected optical density for each pixel of the cells. The optical density cube served to construct absorbance images of the cells.
Spectral Similarity Mapping
Similarity mapping is useful in a situation in which the sample is composed of a number of spatially separated components, each characterized by a known and unique spectrum, and the task is to detect and map all components. Spectral analysis of normal human lymphocytes and B-CLL cells revealed two different spectral domains composing the nucleus. The steps of this algorithm were as follows. First, the spectra of the distinct nuclear domains were stored in a “spectral library.” Second, for every pixel of the cube a comparison was made between its measured spectrum and all the spectra of the library. Third, each pixel in the image was identified with the most similar spectrum in the library. Fourth, each pixel was displayed in a previously established color identifying the specific library spectrum, forming a socalled “classified image.”
The comparison formula for the second step of the similarity mapping algorithm was as follows: n functions fn
x,y
(n is the number of spectra in the library) are defined for every pixel of spatial coordinates x and y, as follows:
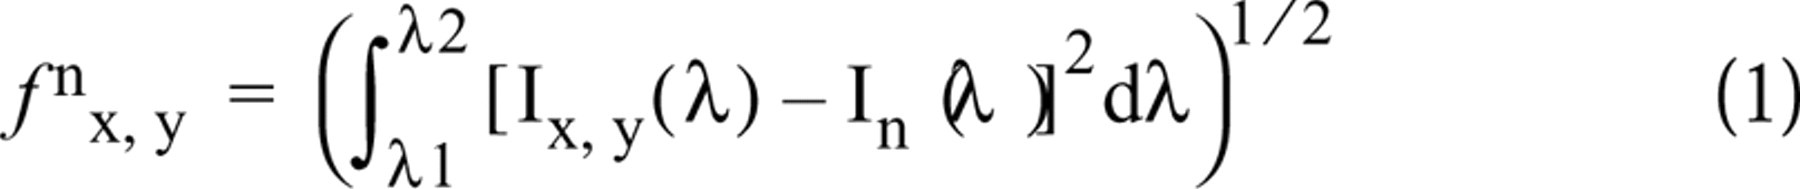
where the integral over λ stands for an integral over a predetermined spectral range λ1-λ2, Ix,y (λ) is the spectrum of the pixel in question, and I n (λ) are the n spectra of the library. n artificial colors are associated with each of these spectra. In this analysis scheme, each pixel is displayed in the color that corresponds to the library spectrum for which Equation 1 is minimum. The resulting “classified image” reveals areas with similar chromophore compositions. In some cases, additional quantitative assessments of the classified regions' size are needed, either in absolute or relative terms. Gray shades can be added according to the value of the selected fn x,y . When there is only one component (n = 1) with which to compare each pixel, a black-and-white image is all that is needed, and the gray levels according to the values of f1 x,y are used for a good rendition of the image. The presence of the component in question is then easily seen in the bright pixels, whereas the dark ones represent its absence; the gray levels may correspond to different amounts of the component.
To eliminate intensity variations, scanning was performed using normalized spectra. To eliminate the variance in dye concentration between different stained specimens, the spectra of all cubes were standardized according to the spectrum of a standard stained erythrocyte.
Results
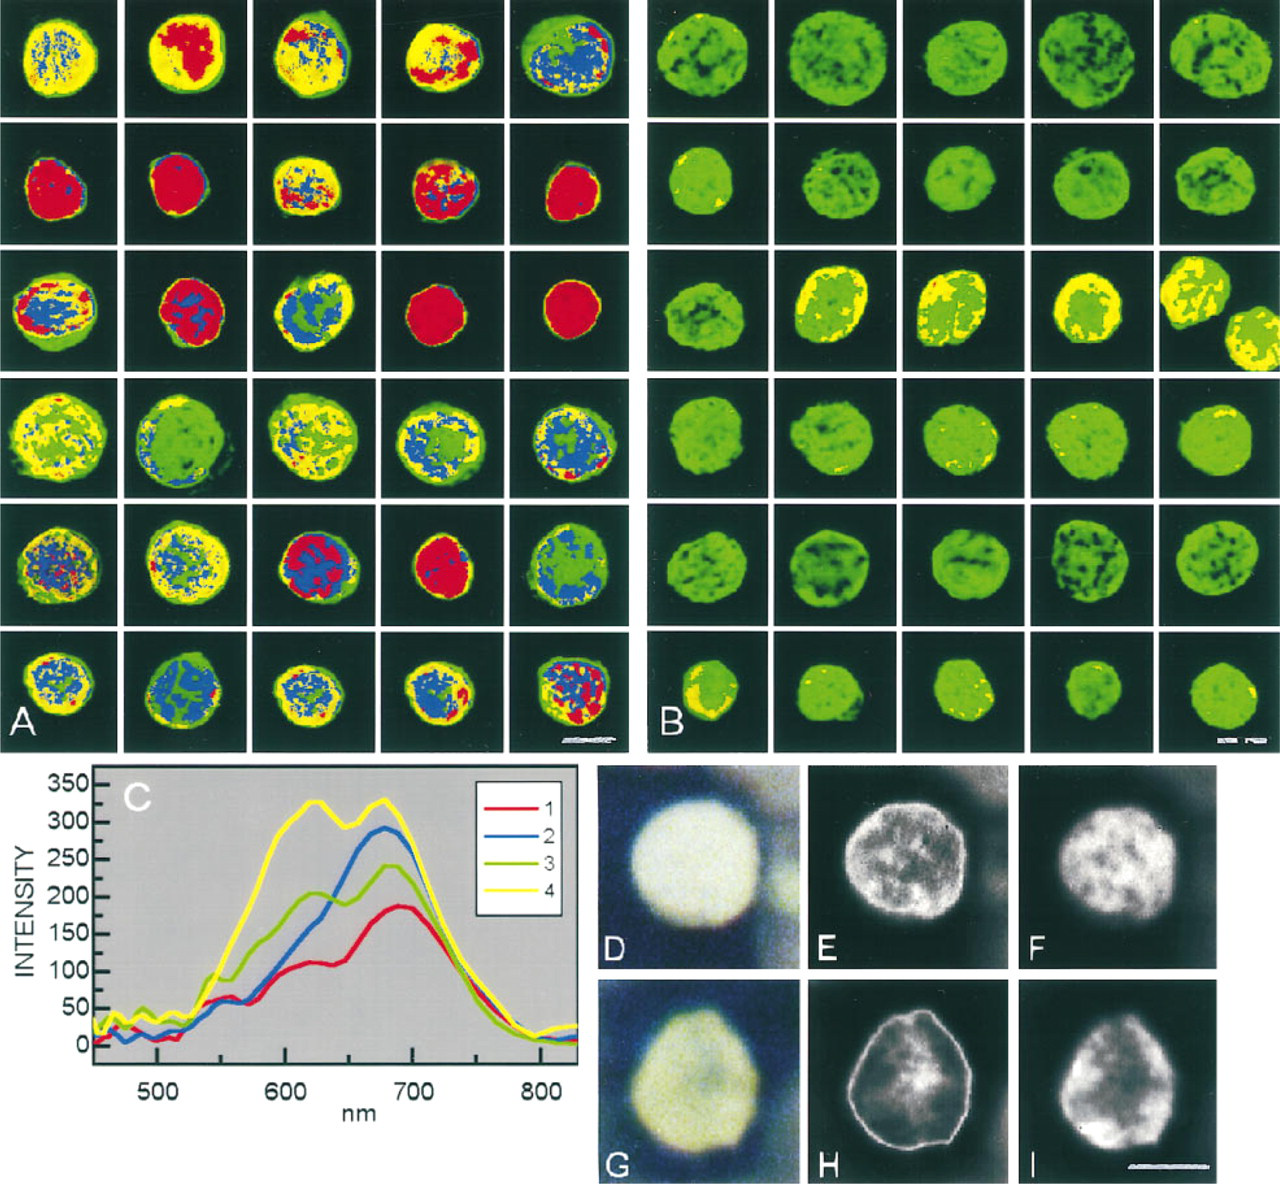
An attempt to discriminate normal human lymphocytes from B-CLL cells stained by MGG was performed by multipixel spectral analysis. We have observed two main spectral domains in the lymphocyte nuclei, representing two main condensation states of the chromatin: one domain of high condensation and low intensity light transmittance (LIT) and the other with high intensity light transmittance (HIT) from domains of low chromatin condensation. To measure the area of each domain in the two lymphocyte populations, we constructed a spectral library consisting of the four transmitted light spectra representing HIT and LIT domains of normal and CLL lymphocytes. These spectra were each assigned an arbitrary color (Figure 1C). Using the spectral library, CLL lymphocytes from 10 cases of CLL and lymphocytes from 10 healthy individuals (10 lymphocytes from every donor) were scanned and each nuclear domain was assigned the color of the library spectrum most similar to its spectral characteristics. The scan produced a classified image for each lymphocyte using a mathematical algorithm called “spectral similarity mapping” as described in Materials and Methods.
Figures 1A and 1B show the spectrally classified images obtained for the two populations of normal and B-CLL lymphocytes. Distinct nuclear domains are revealed, with each colored domain corresponding to one spectrum of the library. Spectra no. 1 (red) and 2 (blue) were uniquely associated with normal lymphocytes (Figure 1A), whereas spectrum no. 3 (green) of the library appeared to dominate the nucleus of most of the CLL cells (Figure 1B).
Morphometric measurements were performed on the spectrally classified images. Table 1 presents the number of normal and CLL lymphocytes displaying each spectral domain and the relative area of that domain in their nuclei. Most of the normal lymphocytes displayed more than one spectral domain in the nucleus. The calculations of the classified areas revealed that 82% of the normal lymphocytes displayed either spectrum no. 1 or spectrum no. 2, or both, in the nucleus. However, spectra no. 1 and 2 did not appear in the nucleus of 92% of the CLL lymphocytes, which displayed either spectrum no. 3 or 4, or both.
Spectral distinctions between the two cell populations were made on the basis of their optical density characteristics, which reflect light absorbance properties of the stained cells. Absorbance images were constructed for the normal (Figure 1D) and B-CLL lymphocytes (Figure 1G) using the spectral information stored in the optical density cube (see Materials and Methods). Figures 2A and 2B show a set of spectra revealing the chromatin optical density values for lowabsorbance and high-absorbance domains. Each spectrum in Figure 2 is an average of 400 pixel spectra from four patients with CLL (Figure 2B) and 400 pixel spectra from four healthy individuals (Figure 2A). The normal lymphocytes absorbed light in the range of 450–800 nm, with an absorbance peak at 520–550 nm in high-absorbance domains and a peak at 510–540 nm in low-absorbance domains (Figure 2A). B-CLL cells displayed absorbance peaks in the range of 480–580 nm in high-absorbance domains and 500–570 nm in low-absorbance domains (Figure 2B).
(
The organization of the two nuclear domains in the normal and B-CLL lymphocytes was revealed by spectral similarity mapping using a single reference spectrum. The first similarity mapping was performed using a spectrum from the low-absorbance domains (Figure 1E) and the second using a spectrum from the high-absorbance domains (Figure 1F). The nucleus of normal lymphocytes was revealed as composed mainly of high-absorbance domains (Figure 1F), with a few low-absorbance domains scattered all over the nucleus (Figure 1E). In contrast, the B-CLL nucleus appeared to be composed of a single central low-absorbance domain (Figure 1H) surrounded by a single high-absorbance rim (Figure 1I).
Morphometric measurements of spectrally classified lymphocytes a
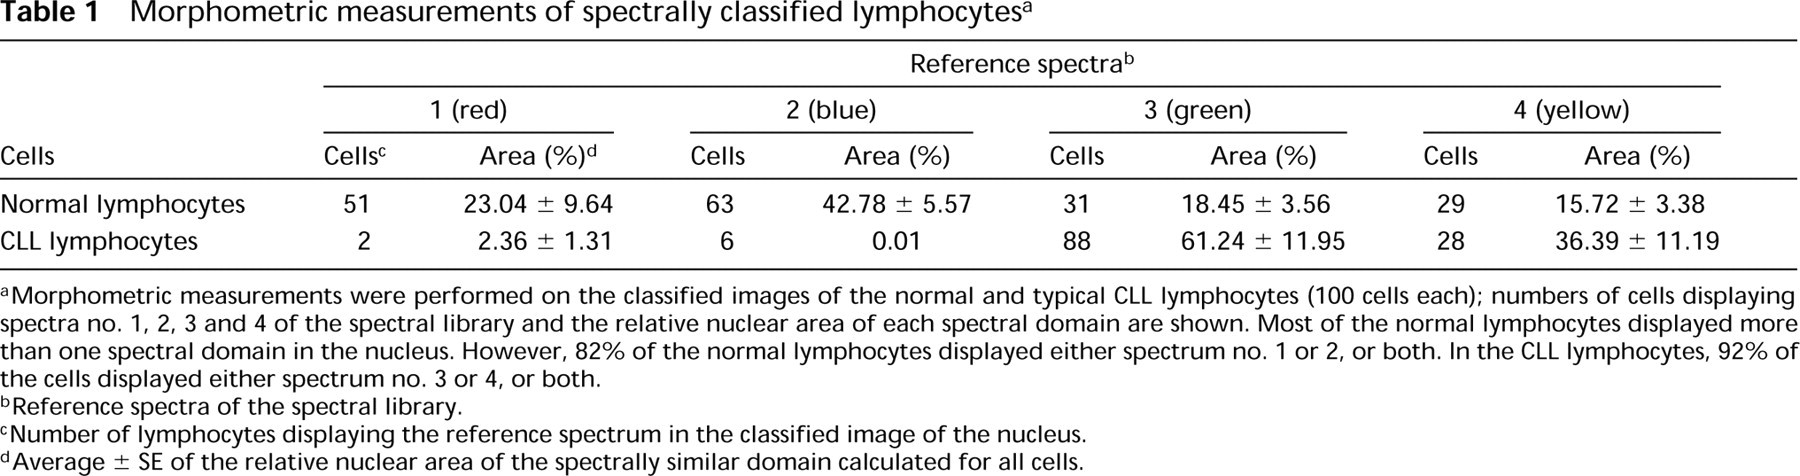
a Morphometric measurements were performed on the classified images of the normal and typical CLL lymphocytes (100 cells each); numbers of cells displaying spectra no. 1, 2, 3 and 4 of the spectral library and the relative nuclear area of each spectral domain are shown. Most of the normal lymphocytes displayed more than one spectral domain in the nucleus. However, 82% of the normal lymphocytes displayed either spectrum no. 1 or 2, or both. In the CLL lymphocytes, 92% of the cells displayed either spectrum no. 3 or 4, or both.
b Reference spectra of the spectral library.
c Number of lymphocytes displaying the reference spectrum in the classified image of the nucleus.
d Average ± SE of the relative nuclear area of the spectrally similar domain calculated for all cells.
Discussion
Spectral morphometric analysis was used in the present study for the characterization of typical B-CLL and normal small lymphocytes on the basis of spectral nuclear features. The nuclear structure is a dynamic reflection of the metabolic state of the nucleus and a physical correlate of its total content of biochemical constituents (Sorensen 1992). During malignant transformation, major nuclear components, such as DNA, RNA, histone and nonhistone proteins, inorganic materials, and water, may undergo changes, along with functional dedifferentiation and an increase in the nucleo-cytoplasmic ratio (Sorensen 1992). However, RNA and DNA content in CLL is similar to that of normal lymphocytes (Andreeff et al. 1980).
Here we present the concept of spectral morphometry for the determination and distinction of cell populations. The spectral morphometric analysis was applied in the present study to B-CLL and normal lymphocytes. Although the Giemsa-stained CLL cells generally appear similar to normal resting lymphocytes (Kipps 1995), we detected spectral distinctions. In normal lymphocytes, two specific chromatin-stain complexes dominated the nucleus and were identified by reference spectra 1 and 2 of the spectral library. A spectral resemblance to either reference spectrum 1 or 2 of the spectral library or with both of them was revealed for 82% of the normal lymphocytes from all cases. However, these spectra were not observed in the nuclei of 92% of the CLL cells. Therefore, the reference spectra 1 and 2 may be associated with the normal state of the lymphocytes, whereas in the leukemic process distinct stain-chromatin complexes were formed in the nucleus and were identified by the spectra 3 and 4 of the spectral library.
The specific absorbance characteristics of the two cell populations were reflected in their optical density spectra. In normal lymphocytes an absorbance peak was seen at 520–550 nm in high-absorbance domains and at 510–540 nm in low-absorbance domains. B-CLL cells displayed absorbance peaks in the range of 480–580 nm in low-absorbance domains and at 500–570 nm in high-absorbance domains. By choosing a single optical density spectrum from each domain and performing the spectral similarity mapping process, we revealed distinct chromatin organization patterns in the nuclei of CLL and normal lymphocytes. In the normal lymphocytes, the highly condensed chromatin was scattered over the nucleus, whereas in the B-CLL the condensed chromatin concentrated in the center of the nucleus and was surrounded by a less condensed chromatin rim. We have to bear in mind that normal peripheral blood lymphocytes are mainly T-cells whereas the blood cells in the present study are B-CLLs. A situation in which normal peripheral blood displays a large population of B-lymphocytes is extremely rare. An elevation in the number of B-lymphocytes in the peripheral blood usually indicates a pathological condition. Therefore, the spectral morphological distinctions observed are of significant importance for the discrimination of peripheral blood of CLL patients from that of healthy individuals.
Micromorphometry plays an increasing role in clinical diagnostics by providing clues derived from the shape and structure determinations of cell nuclei. Image analysis of the digitized data engenders high sensitivity to subtle changes not perceived by human visual assessment and offers instant access to large image databases for comparison (Wied et al. 1989). Our technique has advantages over the image analysis systems already in use. In addition to standard morphometric parameters, spectra (400–850 nm) are obtained for each pixel of an image, providing more information than conventional grayscale image analysis, even when the latter is used in combination with color filters (Wells et al. 1992). The transformation from a fully colored image to a grayscale image, in previous morphometric methods, introduces some inaccuracy, which is totally eliminated by spectral imaging. A colored image displaying closely related wavelengths with the same intensity might appear similar in a grayscale image. However, spectral imaging is sensitive and specific, differentiating between closely related colors even when the total intensity is similar.
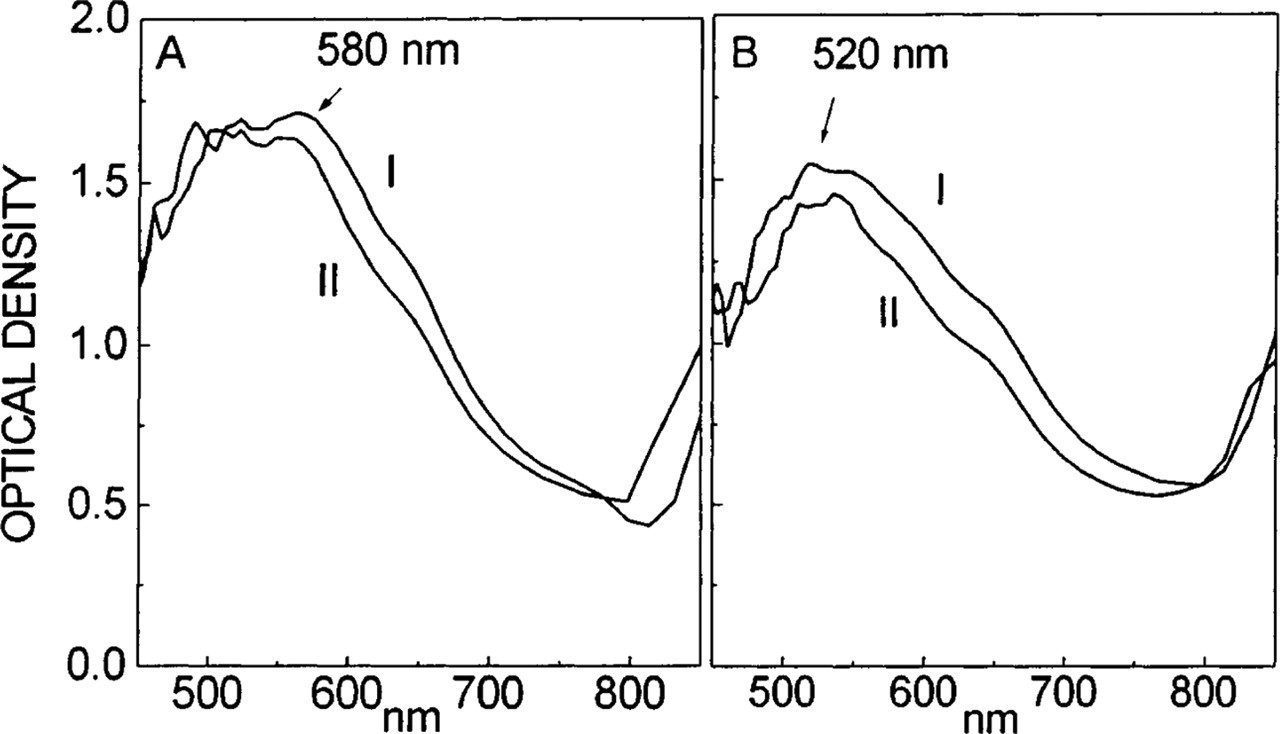
Optical density spectra of normal human lymphocytes and B-CLL cells. The average ± SE of 400 arbitrarily chosen pixels of the two nuclear domains, one with high absorbance (I) and the second with low absorbance (II), from normal (
In the relatively short time that spectral morphometry has been applied to cytological research and diagnostics, it has become clear that the advantages provided by this technique include an objective tool for cytological and cytogenetic diagnosis, advancement and automation of cytological specimen examination, and the facilitation of nuclear structure and chromatin organization analysis.
Footnotes
Acknowledgements
Supported by a grant from Applied Spectral Imaging, Migdal HaEmek, Israel.
We acknowledge the helpful remarks of Dr Judith Radnay from the laboratories of Molecular Biology and Hematology, Sapir Medical Center, Kfar Saba, Israel. We gratefully thank Ms Judith Hanania for help in editing the manuscript and Mr Jacob Langsam for skillful assistance.