
Abstract
This article describes the calibration of a histochemical method to determine the myoglobin concentration in individual cardiomyocytes. Calibration is based on paired microdensitometric determinations in sections stained for myoglobin and on biochemical myoglobin determinations in tissue samples from different hearts. In addition, the staining intensity of sections from gelatin blocks containing known amounts of myoglobin is determined. To construct a calibration line, sections stained for myoglobin must be corrected for the degree of shrinkage caused by glutaraldehyde fixation and biochemical myoglobin determinations must be corrected for interstitial space. As an example, the method is used to determine the myoglobin concentration in individual skeletal muscle fibers and in control and hypertrophied rat cardiomyocytes. The amount of myoglobin per cardiomyocyte nucleus is increased two- to threefold in hypertrophied cardiomyocytes, whereas changes in myoglobin concentration depend on the model of hypertrophy used.
M
The promoter of the myoglobin gene has been studied (Garry et al. 1996), but it is unknown how the myoglobin concentration in mature muscle cells is regulated. In view of its function, it can be hypothesized that the myoglobin concentration is regulated so that anoxia of muscle cells is prevented. To study this hypothesis it is necessary to determine in individual muscle cells the distribution and volume density of mitochondria, the shape and cross-sectional area of the cell, and the myoglobin concentration (cf. Meyer et al. 1984). All of these measurements can be carried out if calibrated histochemical methods for oxidative enzymes and myoglobin concentration in cross-sections of muscle cells are available (Swatland 1984; van der Laarse et al. 1985). Although it is possible to determine the maximal rate of oxygen consumption by single muscle cells with quantitative histochemistry of succinate dehydrogenase activity (van der Laarse et al. 1989), until now it has not been possible to determine the myoglobin concentration in individual muscle cells with quantitative cytochemistry. For this reason we developed a calibrated histochemical method to determine the myoglobin concentration in the cytoplasm of individual muscle cells.
As an example, we applied the method to determine the myoglobin concentration in individual rabbit cardiomyocytes, control and hypertrophied rat hearts, and in high- and low-oxidative muscle fibers of a fast rat skeletal muscle. The determination of the myoglobin concentration in individual cardiomyocytes is particularly important because it is known that the myoglobin content of the myocardium, determined biochemically, changes during the transition from cardiac hypertrophy to cardiac failure (O'Brien et al. 1992a, 1995; des Tombe et al. 1997). Weil et al. (1997) demonstrated that the immunoreactivity of myoglobin in failing hearts varies among cardiomyocytes, indicating that biochemical myoglobin determinations in failing hearts must be interpreted with care.
Materials and Methods
Animals and Sample Collection
All animals were treated according to the guidelines of the Animal Experimental Committee of the Vrije Universiteit. Male Wistar rats weighing 175–200 g, were used. Cardiac hypertrophy was induced in five rats by daily
Tissue samples (about 1 g wet weight) of the left ventricular wall of Tyrode-perfused hearts of four New Zealand White rabbits (for experimental details see Zuurbier and van Beek 1997) were treated as described above.
An extensor digitorum longus (EDL) muscle of a rat was excised after removal of the heart. The muscle was washed in ice-cold Tyrode equilibrated with 95% oxygen and 5% carbon dioxide. The muscle was cut in two pieces with a razor blade. One part was embedded in 15% (w/v) gelatin in Tyrode, pH 7.5, and frozen in liquid nitrogen, and the other part was fixed as described above.
Biochemical Myoglobin Determination
Myoglobin content in freeze-dried tissue was determined by a modification of the assay described by O'Brien et al. (1992b). The Tyrode-perfused samples were homogenized in a solution (0.25–0.5 ml/mg dry weight) containing 80 mM KCl and 50 mM Tris-HCl, pH 8.0, on ice for 1.5–2 min. The homogenate was centrifuged at 5000 X g for 10 min at 4C and 200 μl supernatant was added to the reaction medium. The reaction medium consisted of 760 μl water, 40 μl ethanol containing 50 mM ortho-tolidine (Sigma; St Louis, MO), and 200 μl of 1 M tertiary-butyl-hydroperoxide (Sigma). After 60 min of incubation at room temperature (22–25C) the absorbance was determined at 436 nm. Equine myoglobin (<99% purity; Sigma), dissolved in the homogenation buffer, was used as a standard.
Using sections stained for myoglobin (see below), we determined the number of erythrocytes remaining in the myocardial tissue after Tyrode perfusion. The peroxidase activity of hemoglobin, which interferes with the myoglobin determination, calculated from the number of erythrocytes remaining in our Tyrodeperfused preparations and the peroxidase activity of rat blood, was less than 1% of the peroxidase activity in the samples. For this reason we did not separate hemoglobin from myoglobin by precipitation of hemoglobin, which in our hands reduces the accuracy and the sensitivity of the myoglobin determination described by O'Brien et al. (1992b).
Histochemistry of Myoglobin
Fixed tissue was washed in water at room temperature (RT) and frozen in liquid nitrogen. Sections 10 μm thick (if not indicated otherwise) were cut in a cryostat at −22C, collected on slides treated with Vectabond (Vector Laboratories; Burlingame, CA), airdried for 10 min at RT, and stored at −80C until use. We verified that storage under these conditions for at least 3 months does not affect the peroxidase activity of myoglobin. The sections were incubated for 60 min (if not indicated otherwise) at RT in a medium of the same composition as used in the biochemical assay (see above). The incubation medium was not stirred during the incubation. The sections were washed with water and mounted in glycerin-gelatin.
To construct a calibration line, 3 × 3 × 20-mm blocks of 15% (w/v) gelatin in homogenation buffer, containing known concentrations of equine myoglobin, were fixed in glutaraldehyde as described above. After fixation the blocks were washed with water. The dimensions of the blocks were determined accurately under the microscope before and after fixation to determine the degree of shrinkage. The blocks were frozen, sectioned, and incubated as described above. The specificity of the method has been demonstrated previously (van der Laarse et al. 1985).
Succinate Dehydrogenase Histochemistry
Succinate dehydrogenase activity of 10-μm-thick cross-sections of the unfixed part of the EDL was determined as described by Pool et al. (1979) to establish the oxidative capacity in individual muscle fibers. Sections were incubated for 10 min at 37C in a medium consisting of 0.4 mM tetranitroblue tetrazolium (Sigma) and 75 mM sodium succinate (Sigma) in 37.5 mM sodium phosphate buffer, pH 7.6. The staining intensity obtained with this method correlates with the maximal rate of oxygen consumption of single muscle fibers of Xenopus laevis (van der Laarse et al. 1989).
Sections for Morphometry
Sections 5 μm thick were cut from unfixed tissue samples and collected on slides, air-dried, and fixed at RT for 5 min in 4% formalin. They were stained with hematoxylin and eosin (HE), dehydrated, and mounted in Entellan (Merck). These sections were used to determine the interstitial space, the degree of shrinkage of sections stained for myoglobin, and the volume of cytoplasm per cardiomyocyte nucleus as described below.
Image Analysis
Sections were studied with a Leica DMRB microscope (Wetzlar, Germany) fitted with calibrated gray filters. The absorbance spectrum of the precipitate in the section (see below) was obtained using a continuous interference filter. Absorbance measurements to determine the myoglobin concentration were made using an interference filter at 436 nm (bandwidth 9.7 nm). Images were obtained with a X20 objective and a monochrome charge-coupled device camera (Sony XC−77CE; Towada, Japan) connected to an LG-3 frame grabber (Scion; Frederick, MD) in an Apple Power Macintosh computer. Images were analyzed using the public domain NIH Image 1.61 program (developed at the US National Institutes of Health, available at
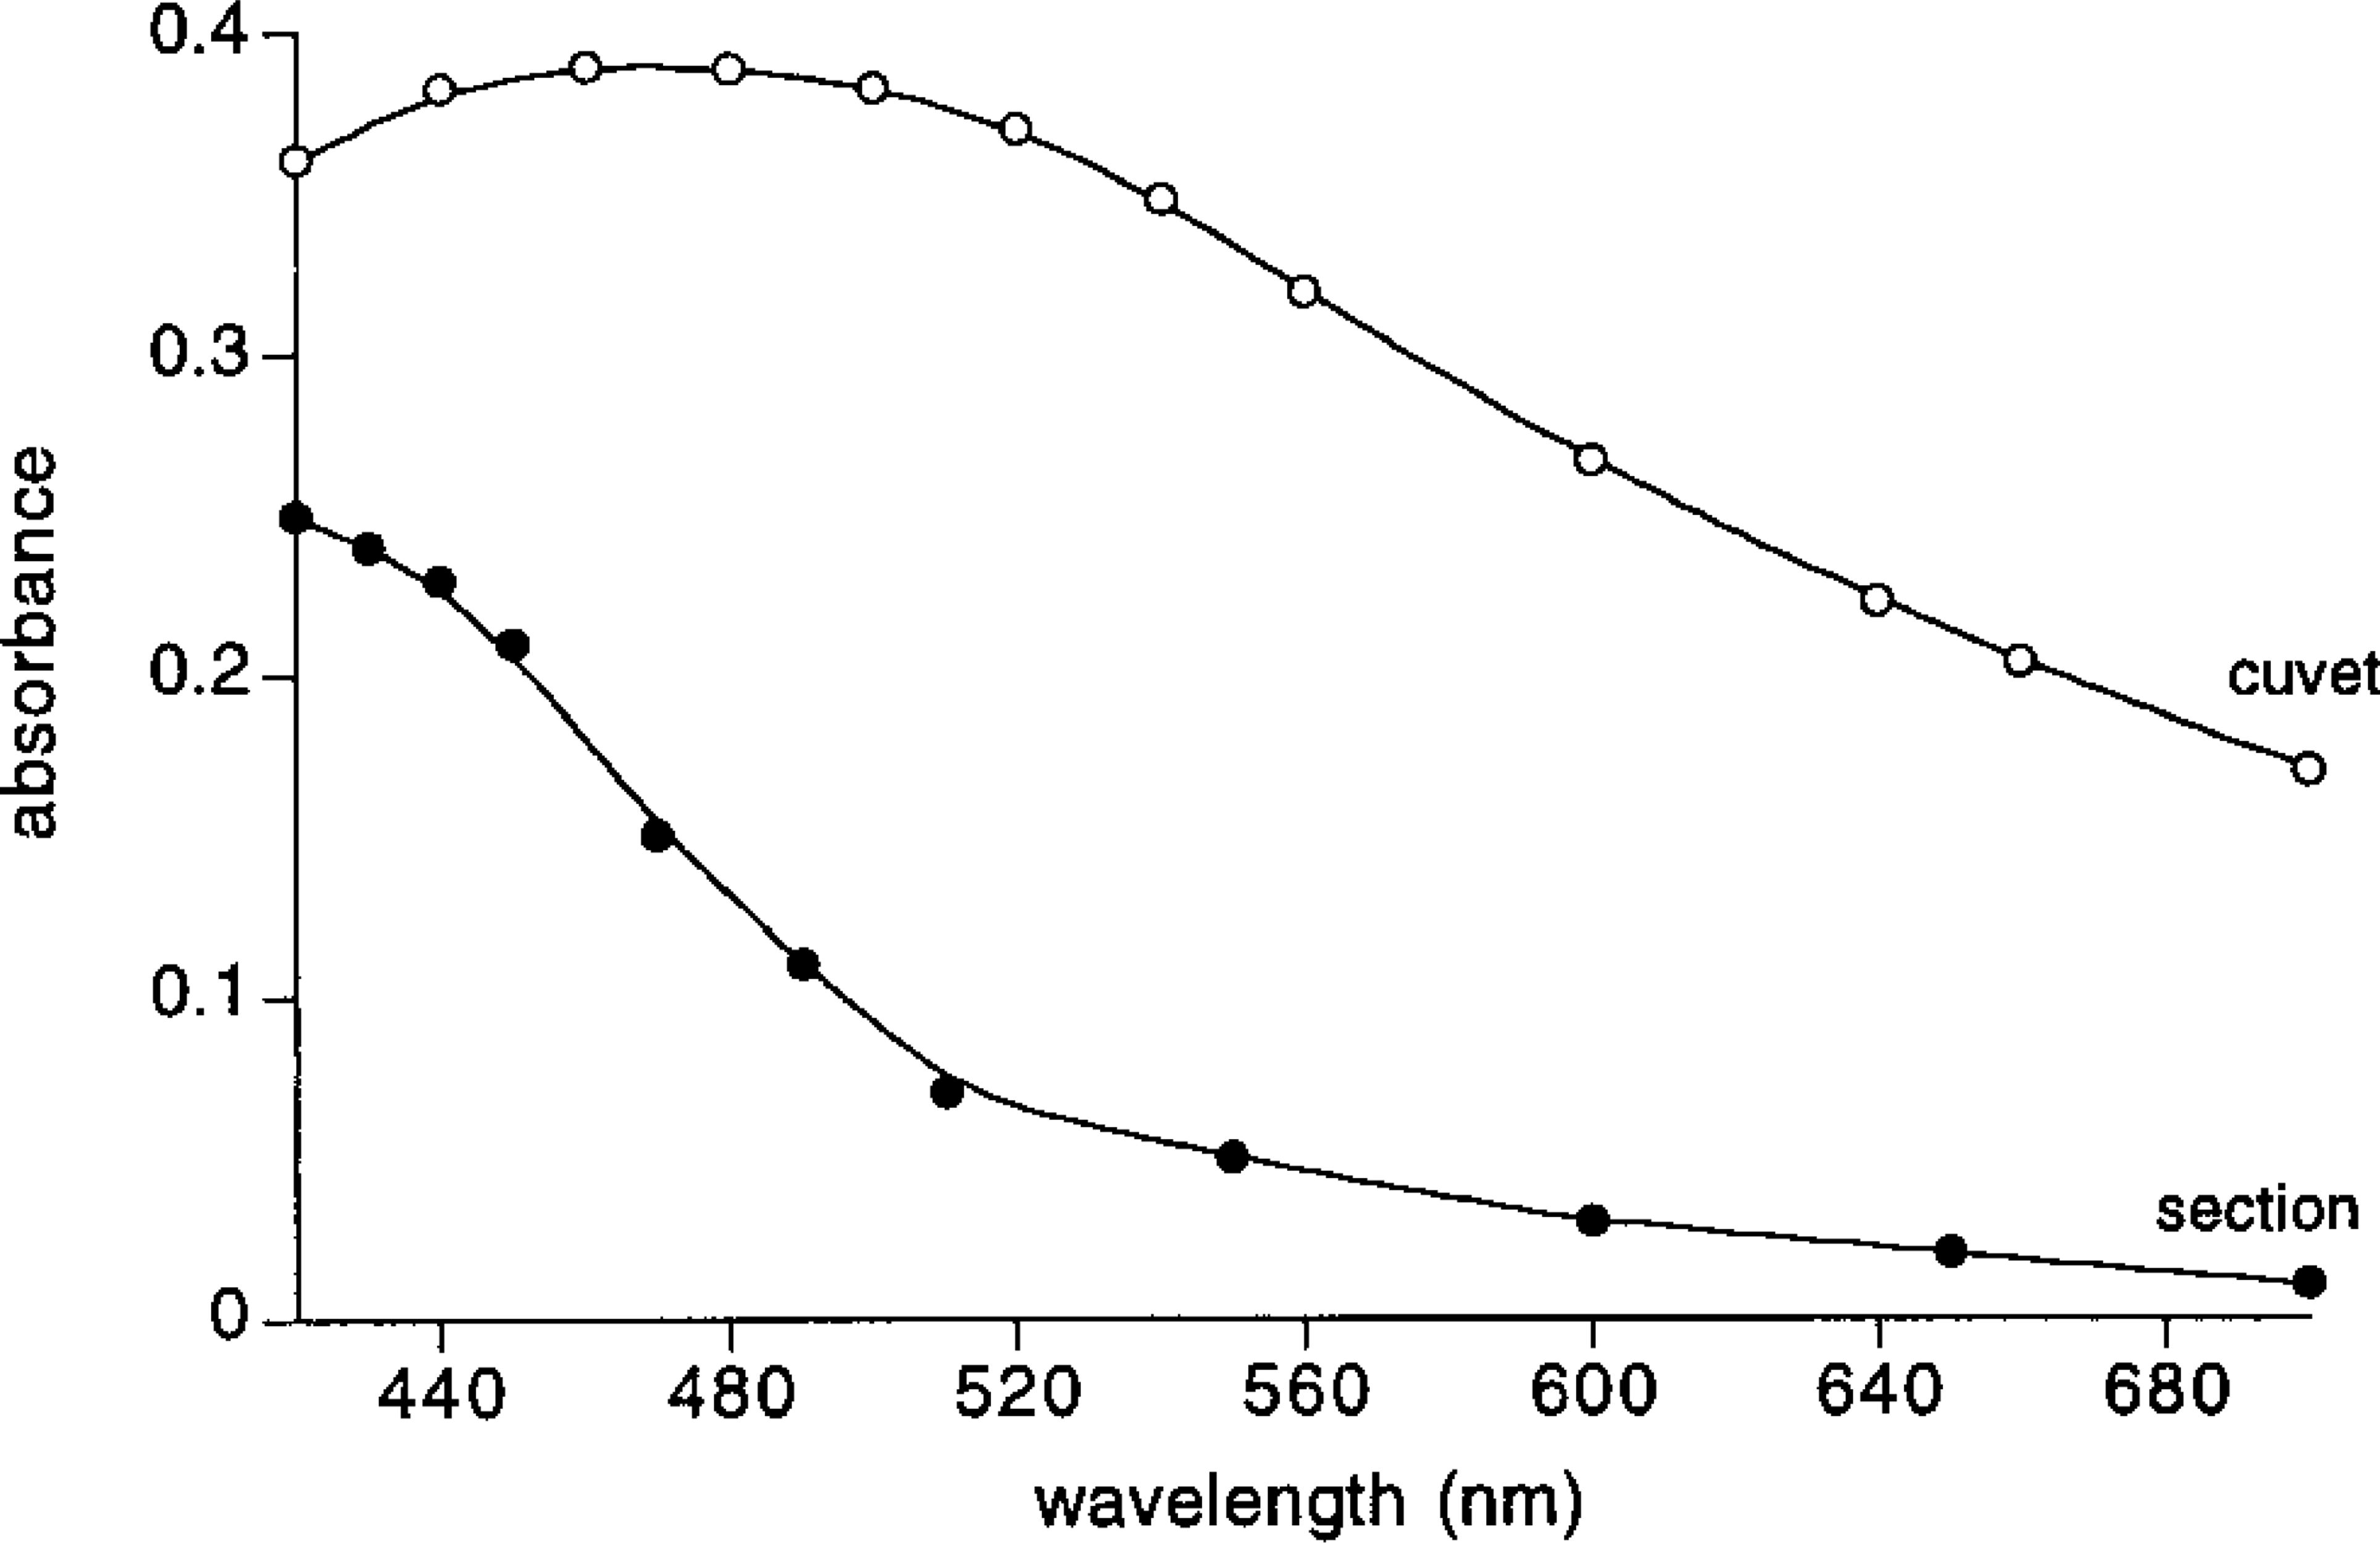
Absorbance spectra of the reaction product measured in the biochemical assay in a 10-mm cuvet and in the histochemical assay in a 10-μm thick cross-section. The amount of myoglobin in the lightpath in both cases is the same (concentrations 0.25 μM in the biochemical assay and 0.25 mM in the histochemical assay, respectively). The myoglobin concentration in the muscle cell was determined using the calibration line in Figure 4.
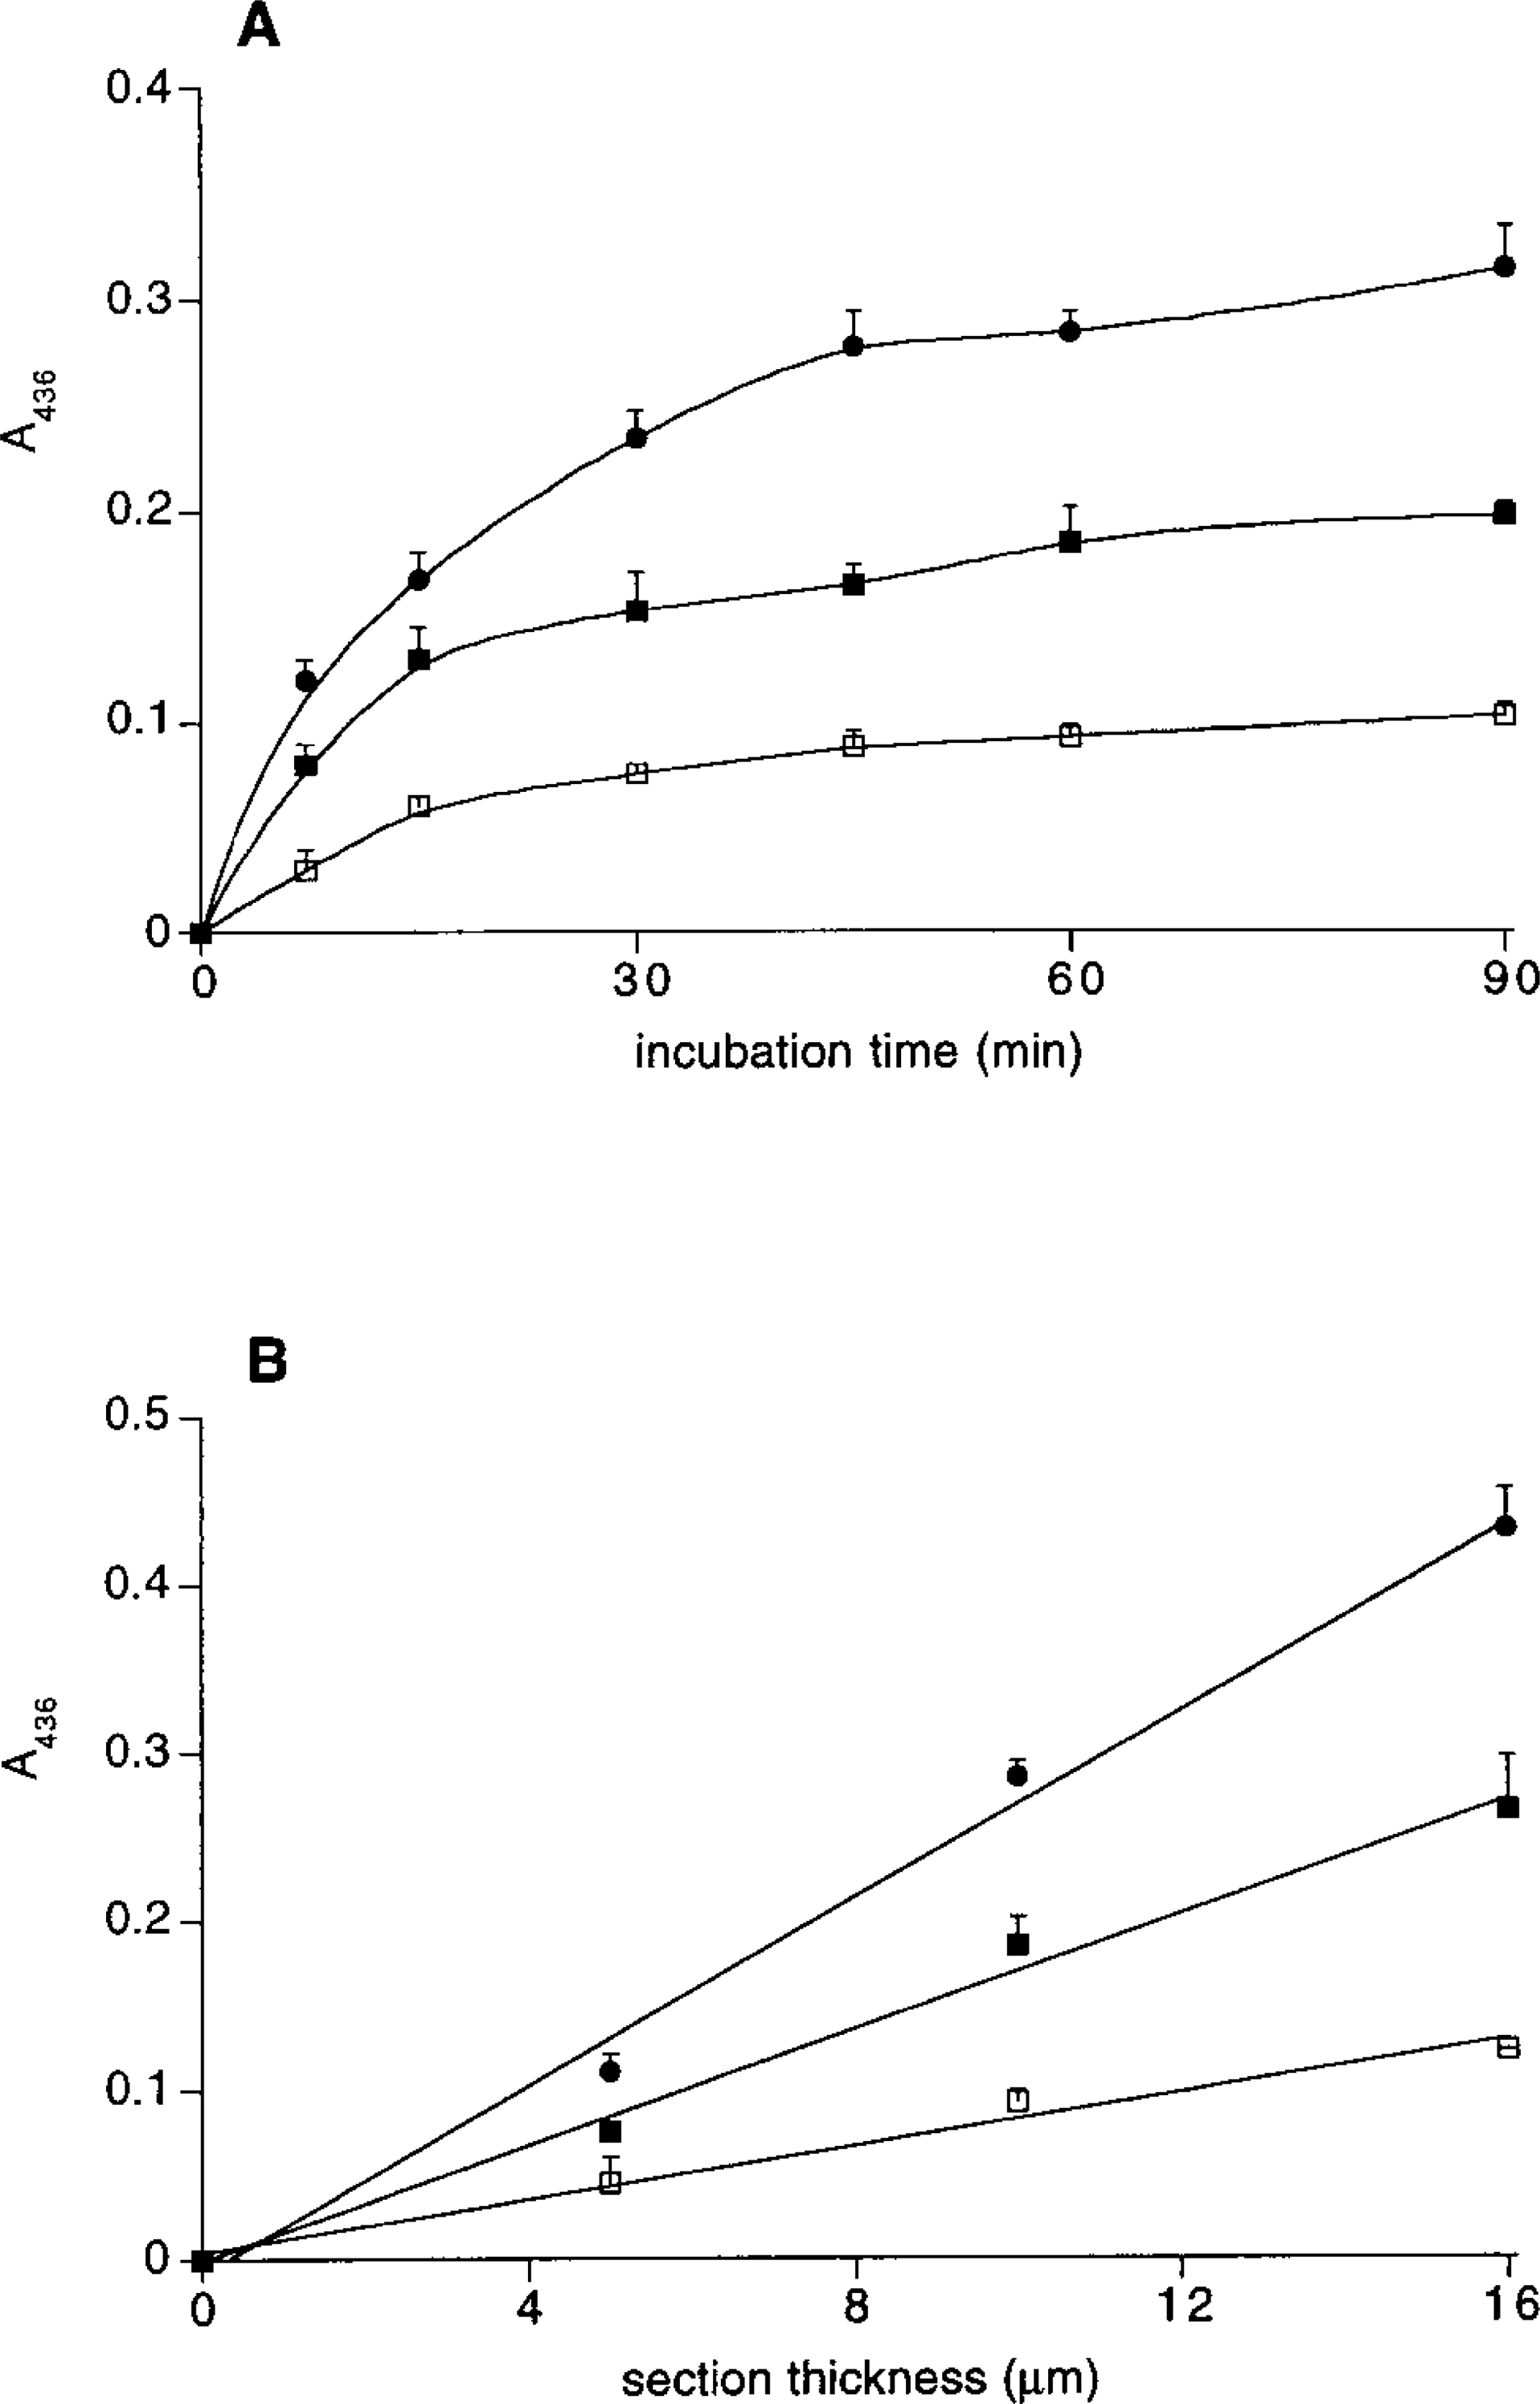
Absorbance of the reaction product measured in sections stained for myoglobin (A436) as a function of incubation time (
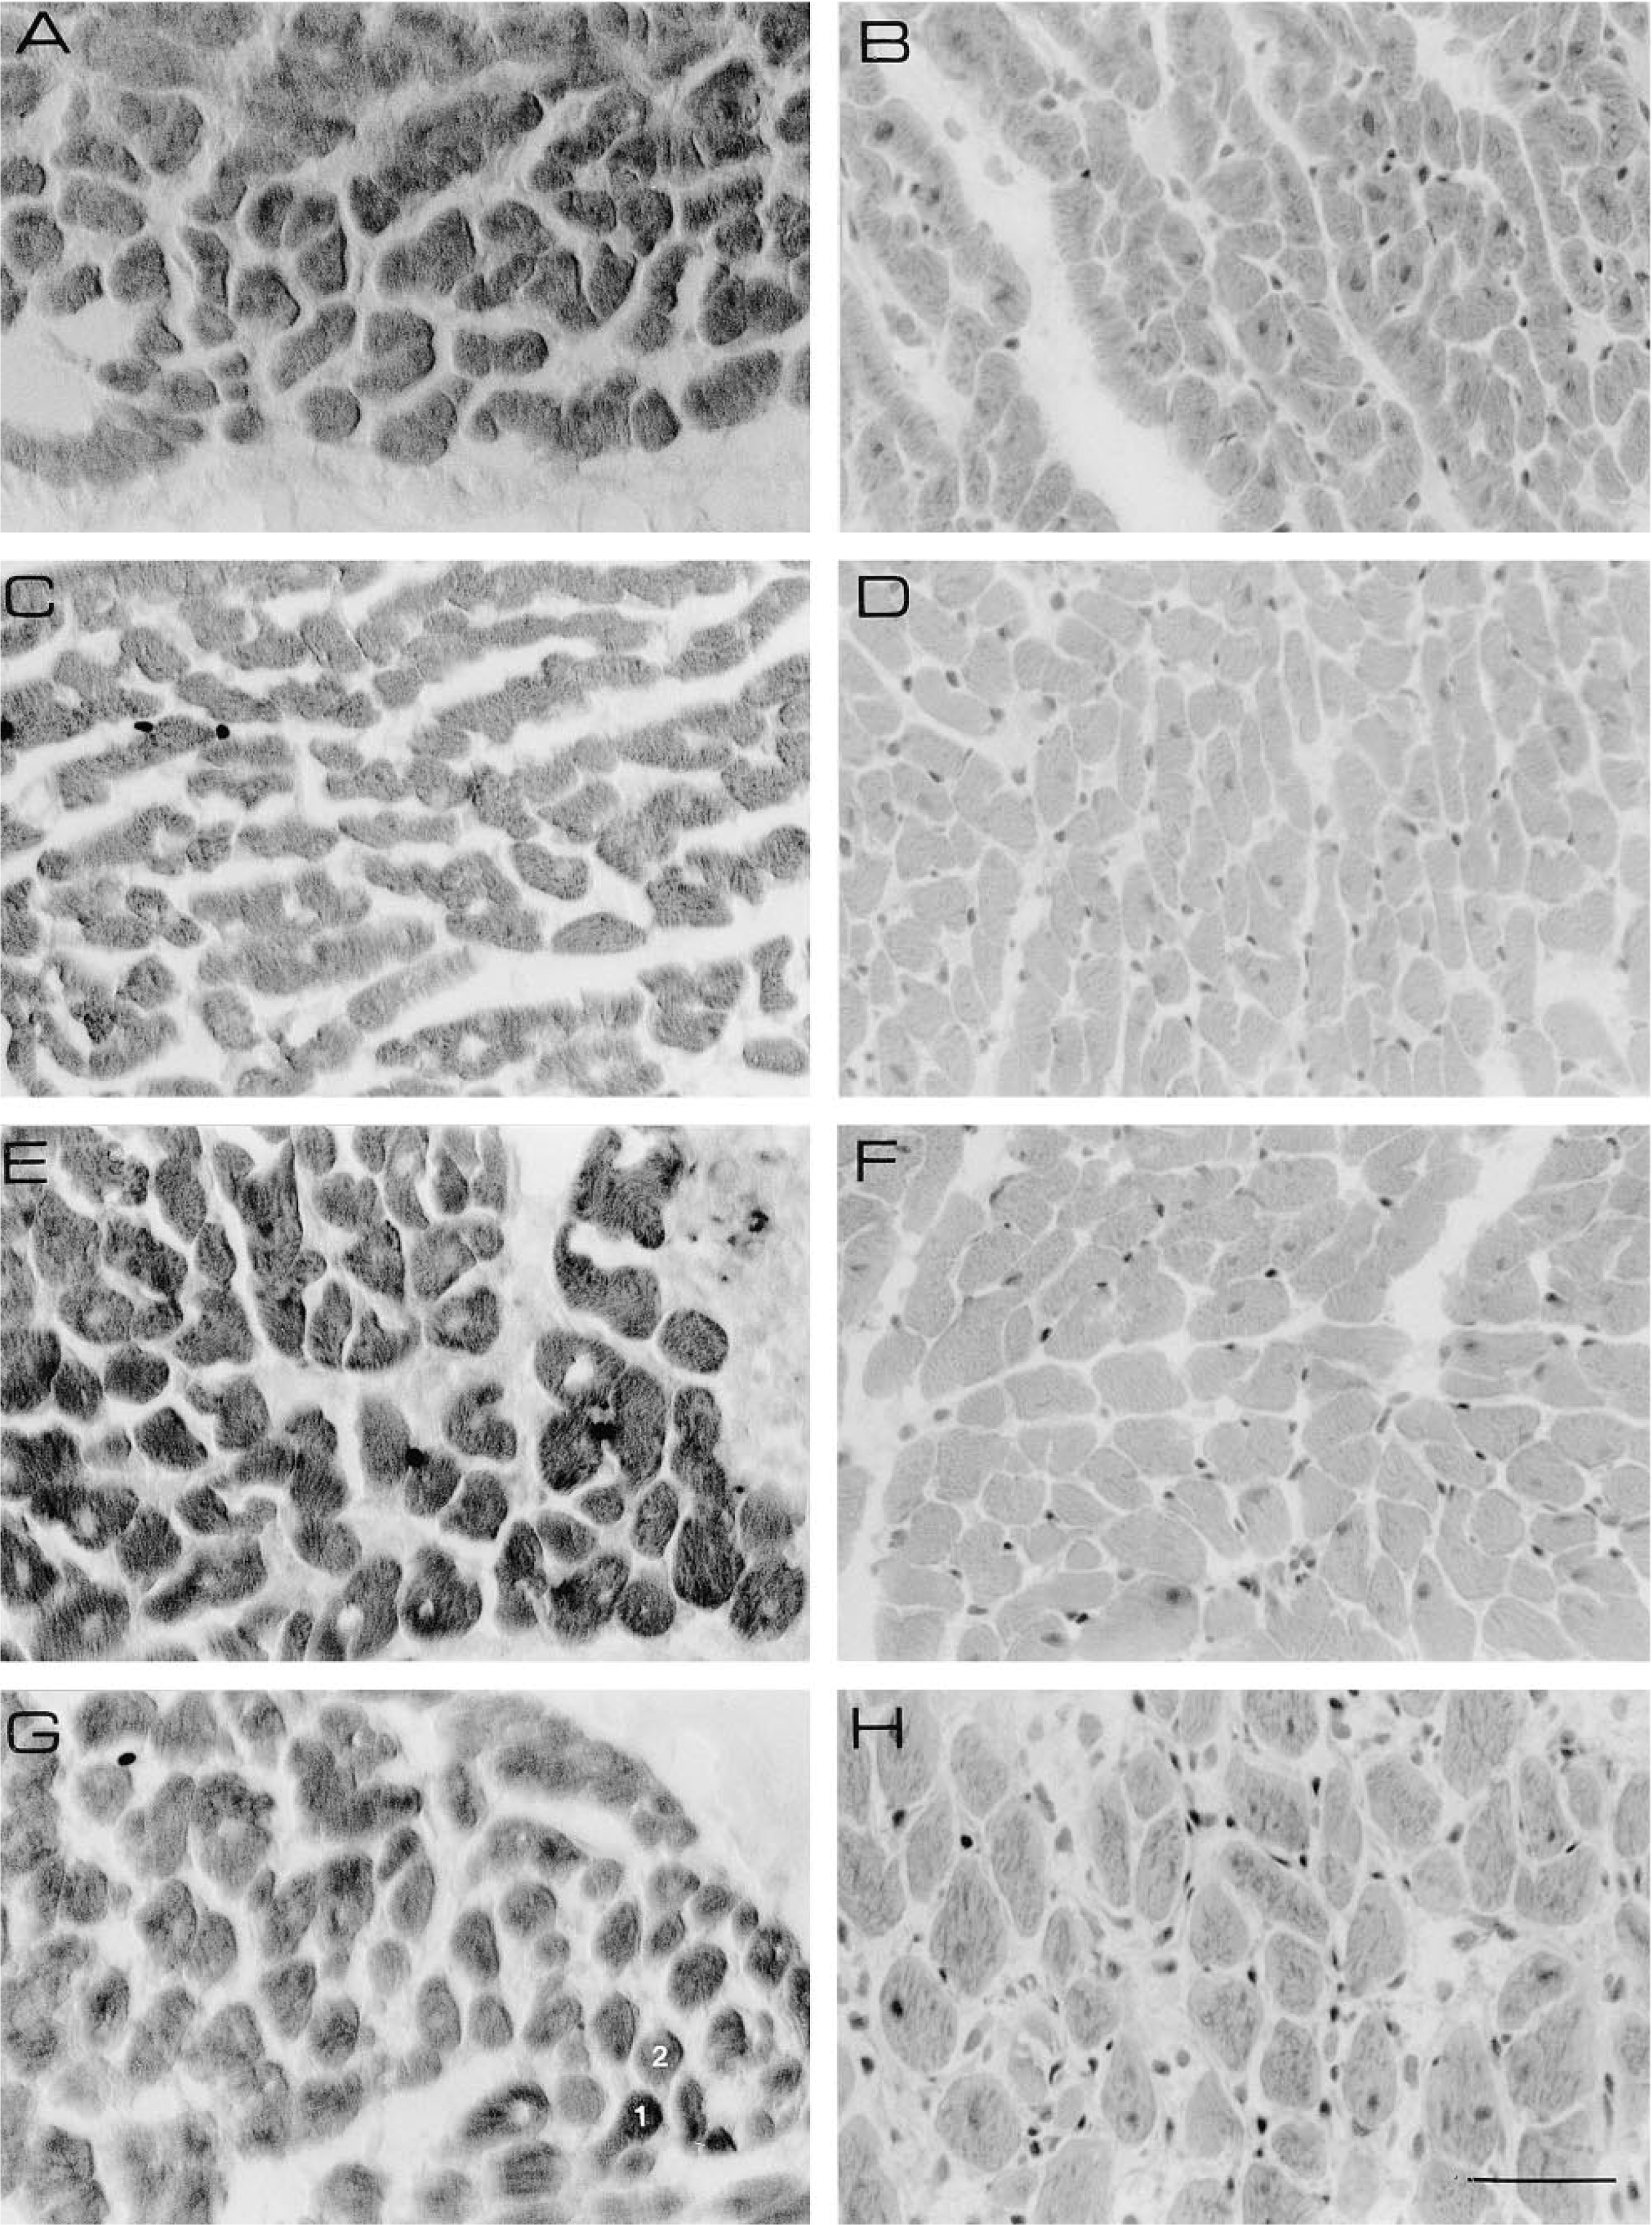
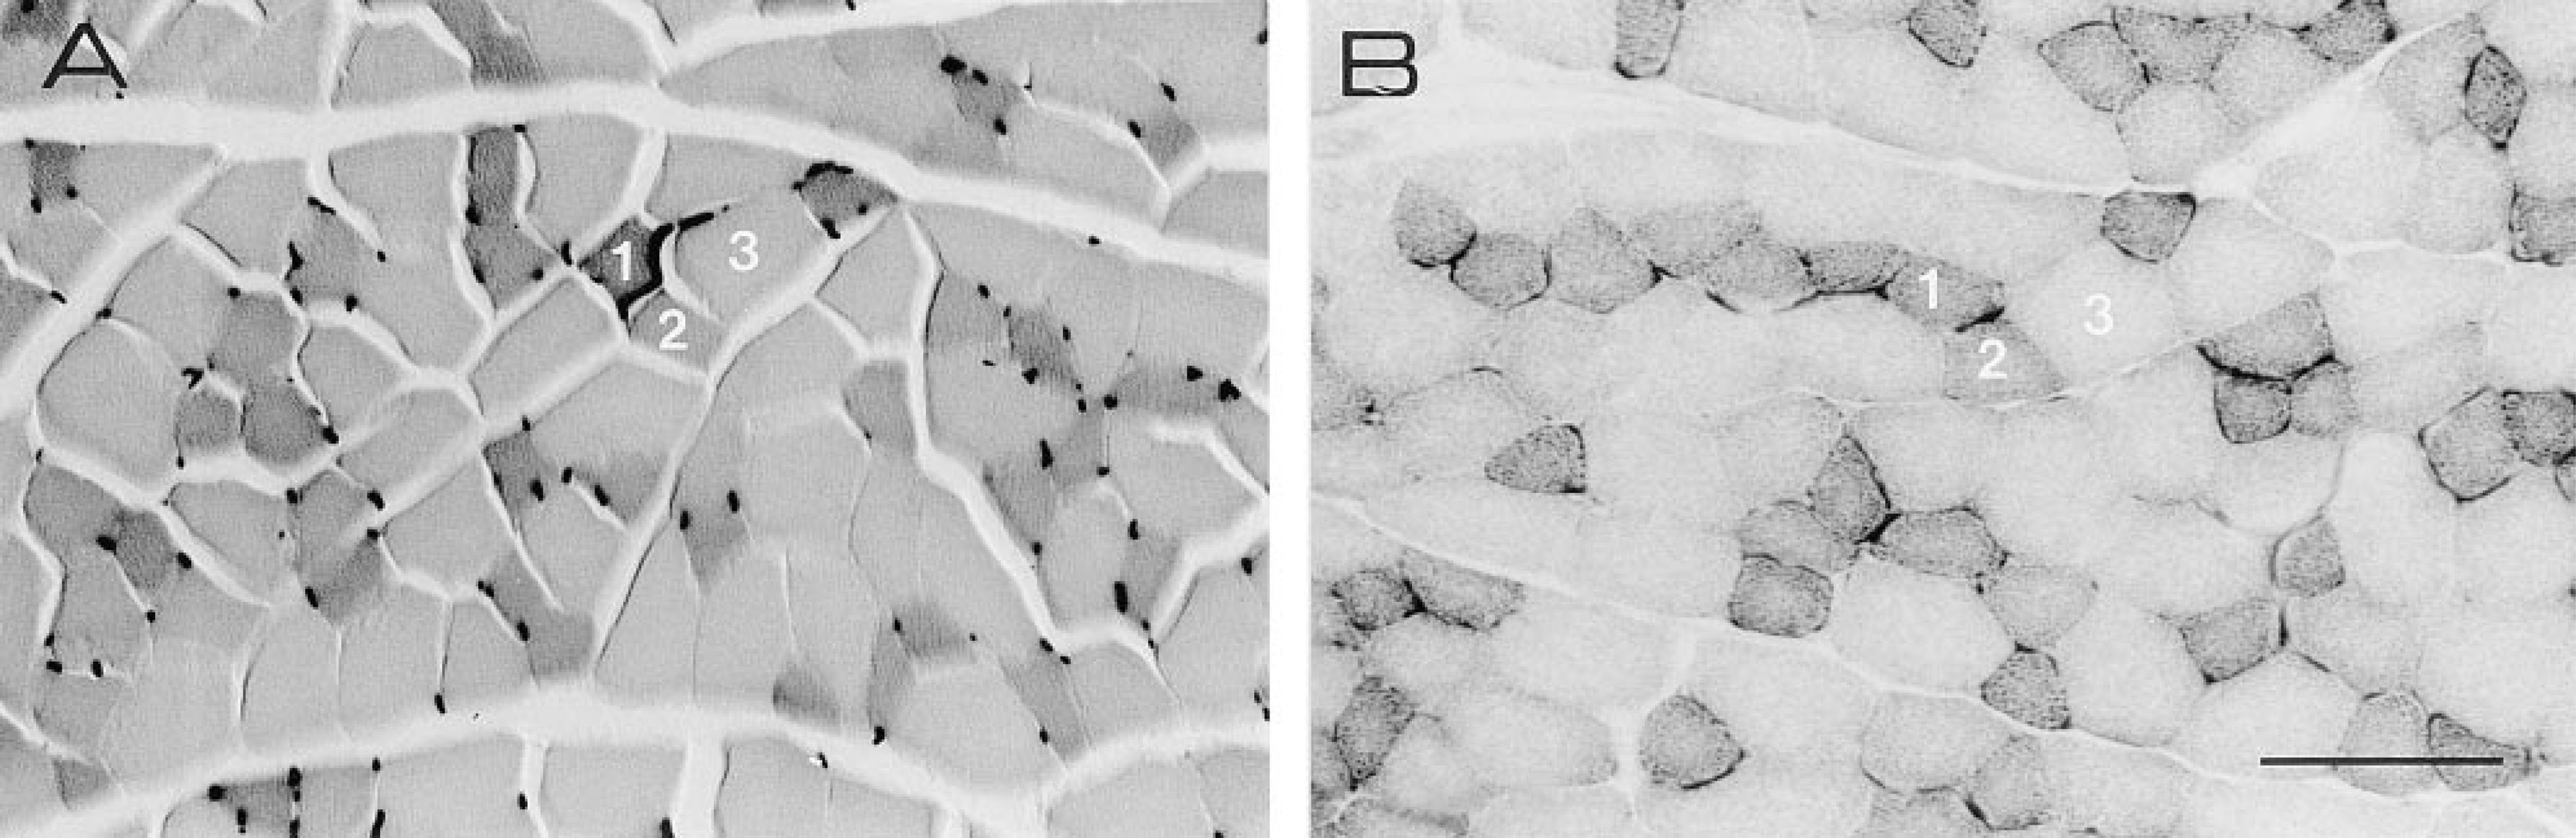
Sections stained for myoglobin (left) and HE (right) of cardiomyocytes of the left ventricular wall of a rabbit (
For the myoglobin and interstitial space determinations, regions in the heart sections were selected in which the muscle cells were cut perpendicularly to their longitudinal axis. The interstitial space (i.e., the area not occupied by cardiomyocytes, Ai) relative to the area of the section (As) was determined in the HE-stained sections and sections stained for myoglobin.
The numbers of cardiomyocytes with visible nuclei per unit of area (Nn,a) were counted using a X 40 objective. In areas of the section where cells were cut along their longitudinal axis, nuclear length (ln, which varied between 11 and 15 μm) was determined. These data were used to calculate the number of cardiomyocyte nuclei per unit of volume (Nn,v) as follows (cf. Loud and Anversa 1984):

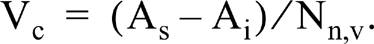
where ls is section thickness and pn is the minimal thickness of grazing nucleus slices (pn = 2.5 μm using a X 40 objective. We checked this using a X 100 objective and the fine focusing of the microscope). Average volume of cytoplasm per nucleus (Vc) was calculated using the equation:
Results
We first determined the absorbance spectra of the reaction products in the biochemical and histochemical assays. The spectra, after subtraction of the blanks, of the final reaction products are shown in Figure 1. We found that the extinction coefficient with respect to myoglobin of the final reaction product in the histochemical assay differs from that in the biochemical assay and that the magnitude of this difference is wavelength-dependent. The reason for this difference is not known, but several possibilities are obvious: high concentrations of glutaraldehyde-fixed myoglobin present in the sections may produce a smaller amount (Deimann et al. 1991) and/or a different form of final reaction product than that produced by low concentrations of native myoglobin in the cuvet, and/ or the blue light is scattered more in the section than in the cuvet. On the basis of this result we decided to carry out the absorbance measurements at 436 nm, which is close to the absorbance maximum in both assays. At this wavelength the extinction coefficients with respect to myoglobin equal 15.2 × 10⁵ M−1.cm−1 in the biochemical assay and 9.4 × 10⁵ M−1.cm−1 in the histochemical assay.
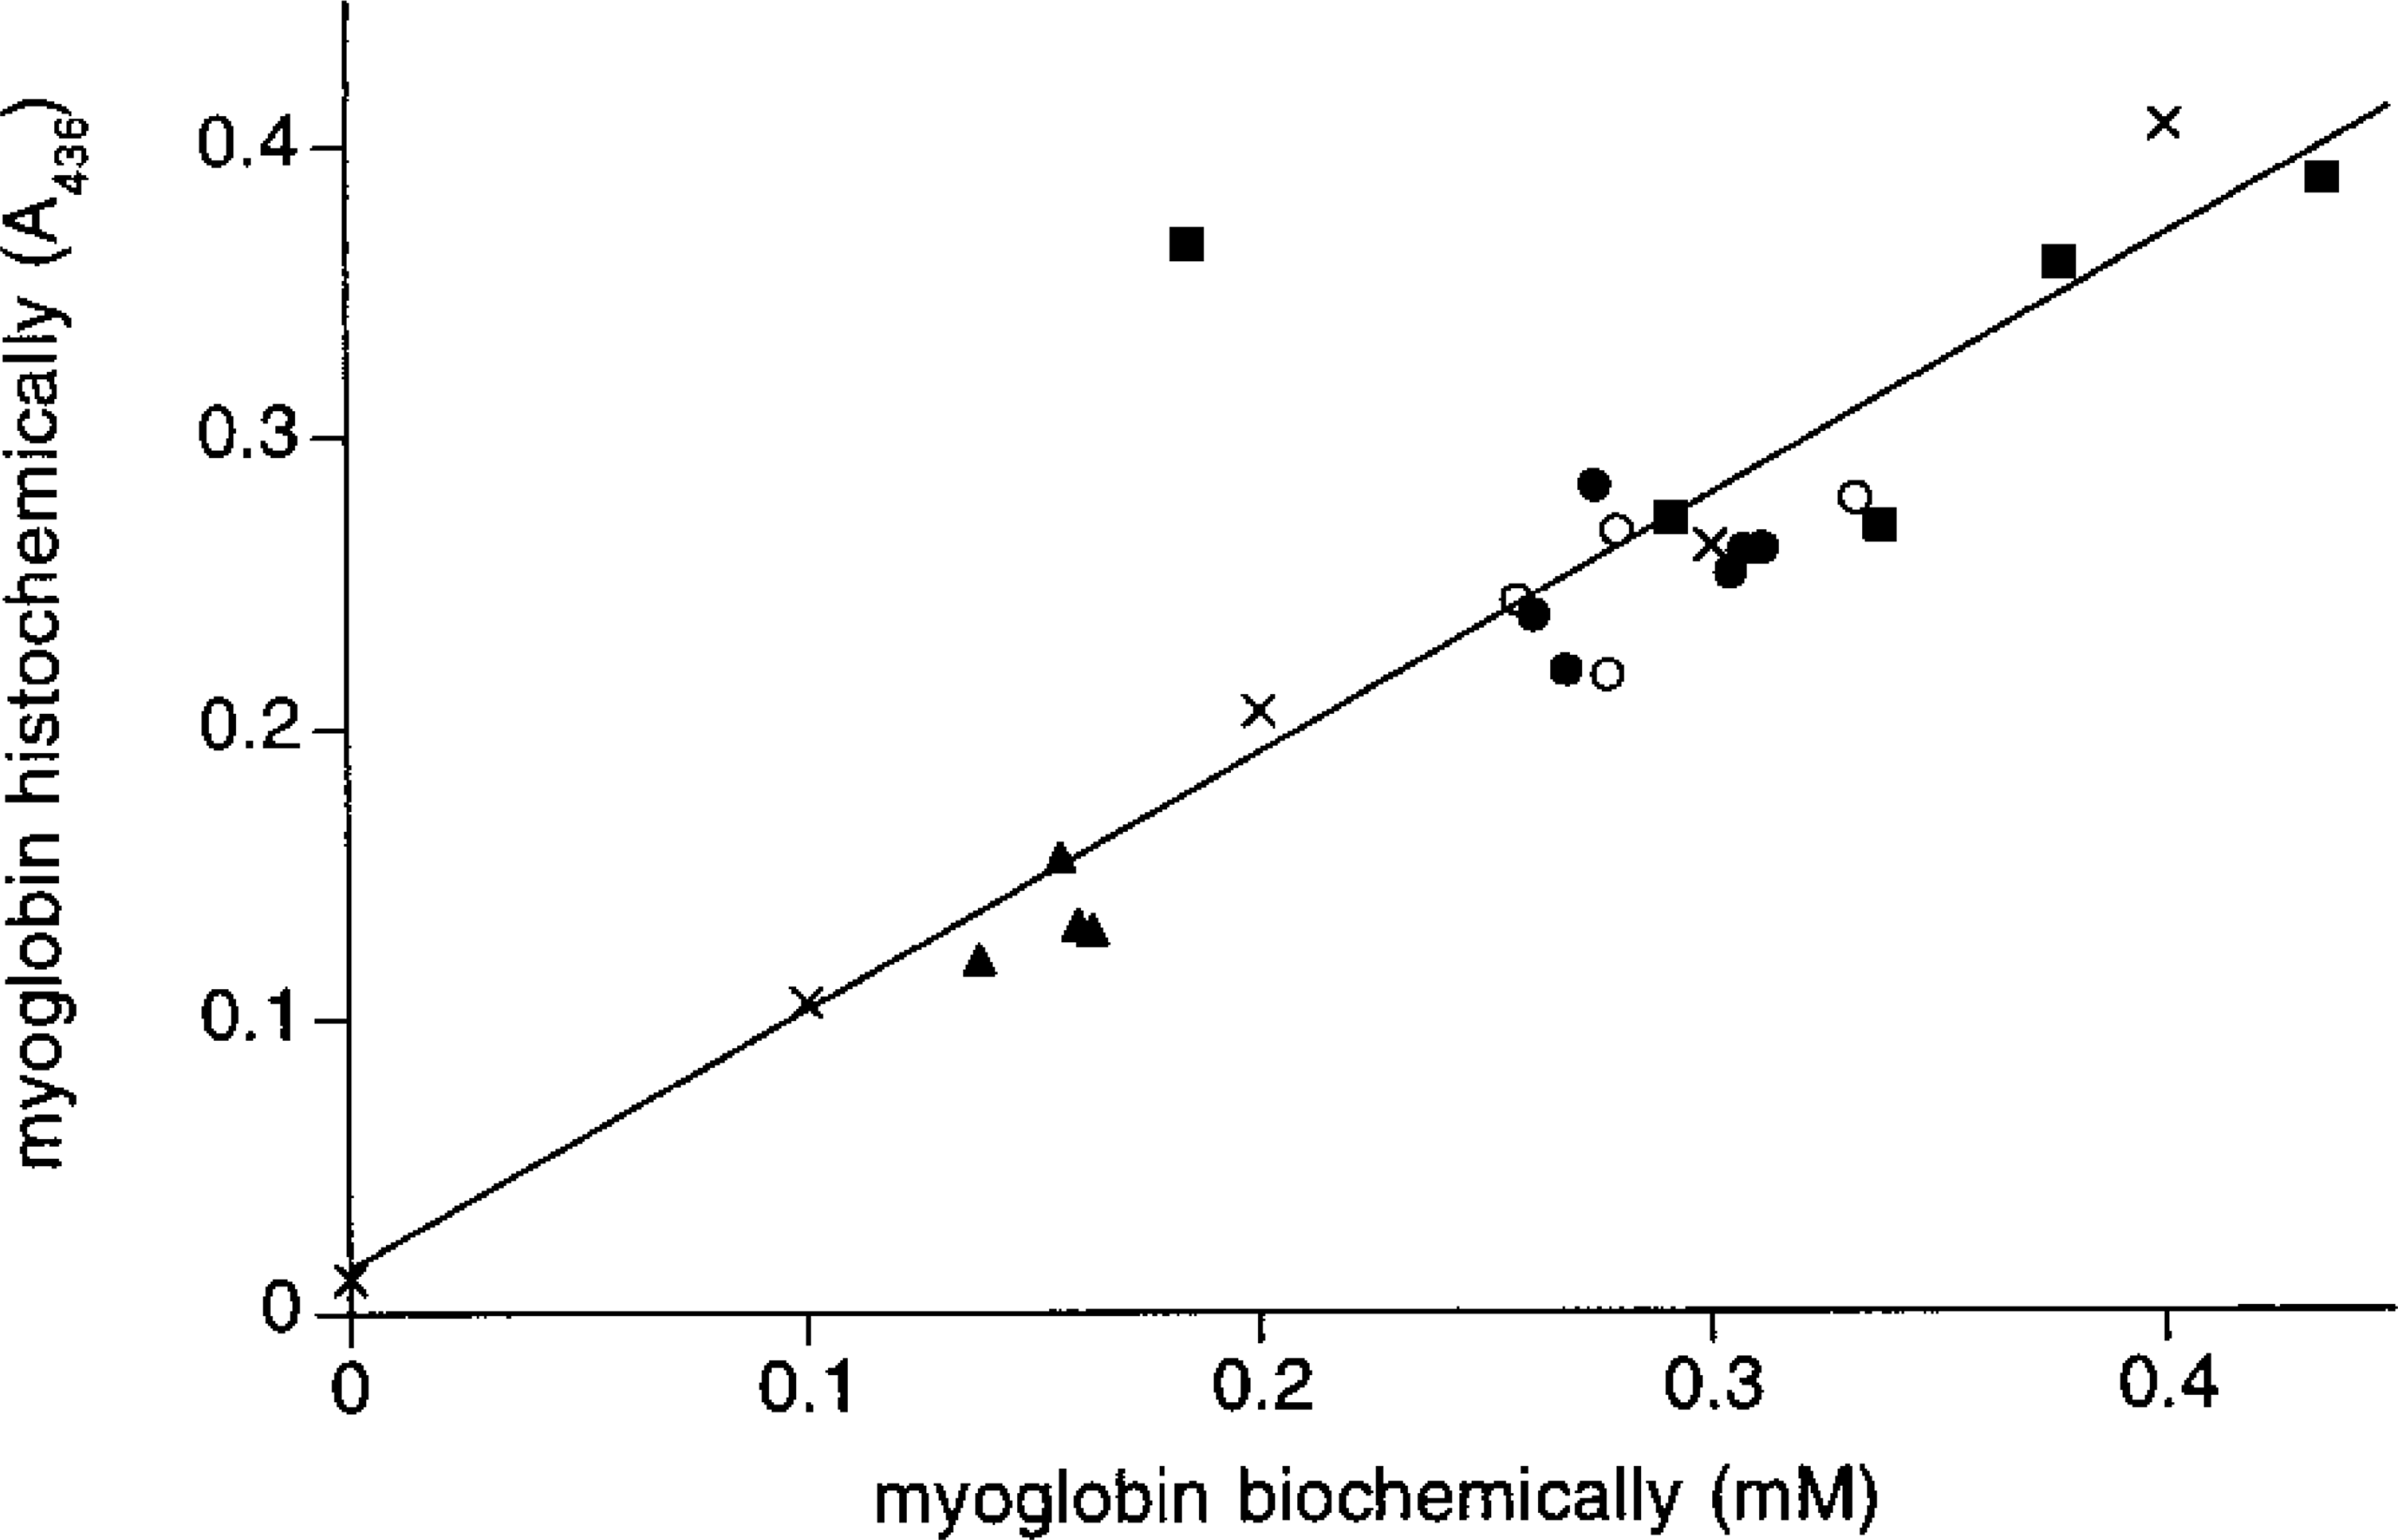
Calibration line for the histochemical myoglobin assay. Mean absorbance was determined in 10 cardiomyocytes in sections stained for myoglobin. Four sections of each heart were used. The corrected absorbance measured in the section (see text) is plotted against the corrected myoglobin concentration (see text) measured biochemically in tissue samples of the left ventricular wall of rabbits (triangles, n = 4), right ventricular wall of control rats (filled circles, n = 6), right ventricular wall of rats 3–4 weeks after monocrotaline injection (open circles, n = 4), and right ventricular wall of rats 2–4 weeks after thyroid hormone injections (squares, n = 5). The crosses give the absorbance measured in sections of gelatin blocks containing known concentrations of equine myoglobin. Values are the mean of four sections. The equation of the regression line fitted through all data points equals A436 = 0.0151 + 0.8855 X myoglobin concentration (in mM), r = 0.90, p>0.001; the intercept is not significantly different from zero. The equation of the calibration line without the outlier is A436 = −0.0073 + 0.9402 X myoglobin concentration (in mM), r = 0.97, p>0.001. The latter equation is used for the calculation of the myoglobin concentration from the absorbance in sections stained for myoglobin.
Figure 2A shows that the absorbance of the reaction product increases nonlinearly with the incubation time until it levels off after about 1 hr (the same result, not shown, was obtained in the biochemical assay). This indicates that the peroxidase activity of myoglobin decreases during the incubation, until it has been completely deactivated. This is in agreement with previous results (van der Laarse et al. 1985; O'Brien et al. 1992b) and has also been found for other peroxidases (Deimann et al. 1991; van Duijn 1991). On the basis of these results we decided to incubate sections for 60 min (cf. Nibbering et al. 1986) to maximize the accuracy and sensitivity of the assay.
Cross-sections of the rat EDL, cut as closely to one another as possible, stained for myoglobin (
Figure 2B shows a linear relationship between the absorbance and section thickness at least up to 16 mm, indicating that there are no diffusion gradients in the section (cf. van der Laarse et al. 1985).
Figure 3 shows sections stained for myoglobin and HE that were used to construct the calibration line shown in Figure 4. The interstitial space in sections stained for myoglobin was compared to the interstitial space in HE sections to estimate the degree of shrinkage of cardiomyocytes caused by glutaraldehyde fixation. We found that the cross-sectional area of glutaraldehyde- fixed cardiomyocytes had shrunk between 0 and 20% of the cross-sectional area measured in the HE sections. Because shrinkage leads to an increase in the amount of myoglobin per unit of cell cross-section, the absorbance measured in sections stained for myoglobin was corrected for the degree of shrinkage by multiplying the absorbance by the cross-sectional area of cardiomyocytes in the sections stained for myoglobin divided by the cross-sectional area of cardiomyocytes in HE sections. It should be noted that this correction assumes that shrinkage of the cardiomyocytes in the longitudinal direction is negligible.
The gelatin blocks containing known amounts of myoglobin shrink by a similar percentage (5–15% of their original volume; see Materials and Methods). The absorbance measured in sections from these blocks was multiplied by the volume after fixation divided by the original volume of the blocks measured before fixation.
Furthermore, the myoglobin concentration determined in the biochemical assay was corrected for interstitial space, which ranges between 20% of the volume in control rat hearts (similar to Anversa et al. 1986) and up to 50% of the volume in rats treated with monocrotaline (Figure 3H).
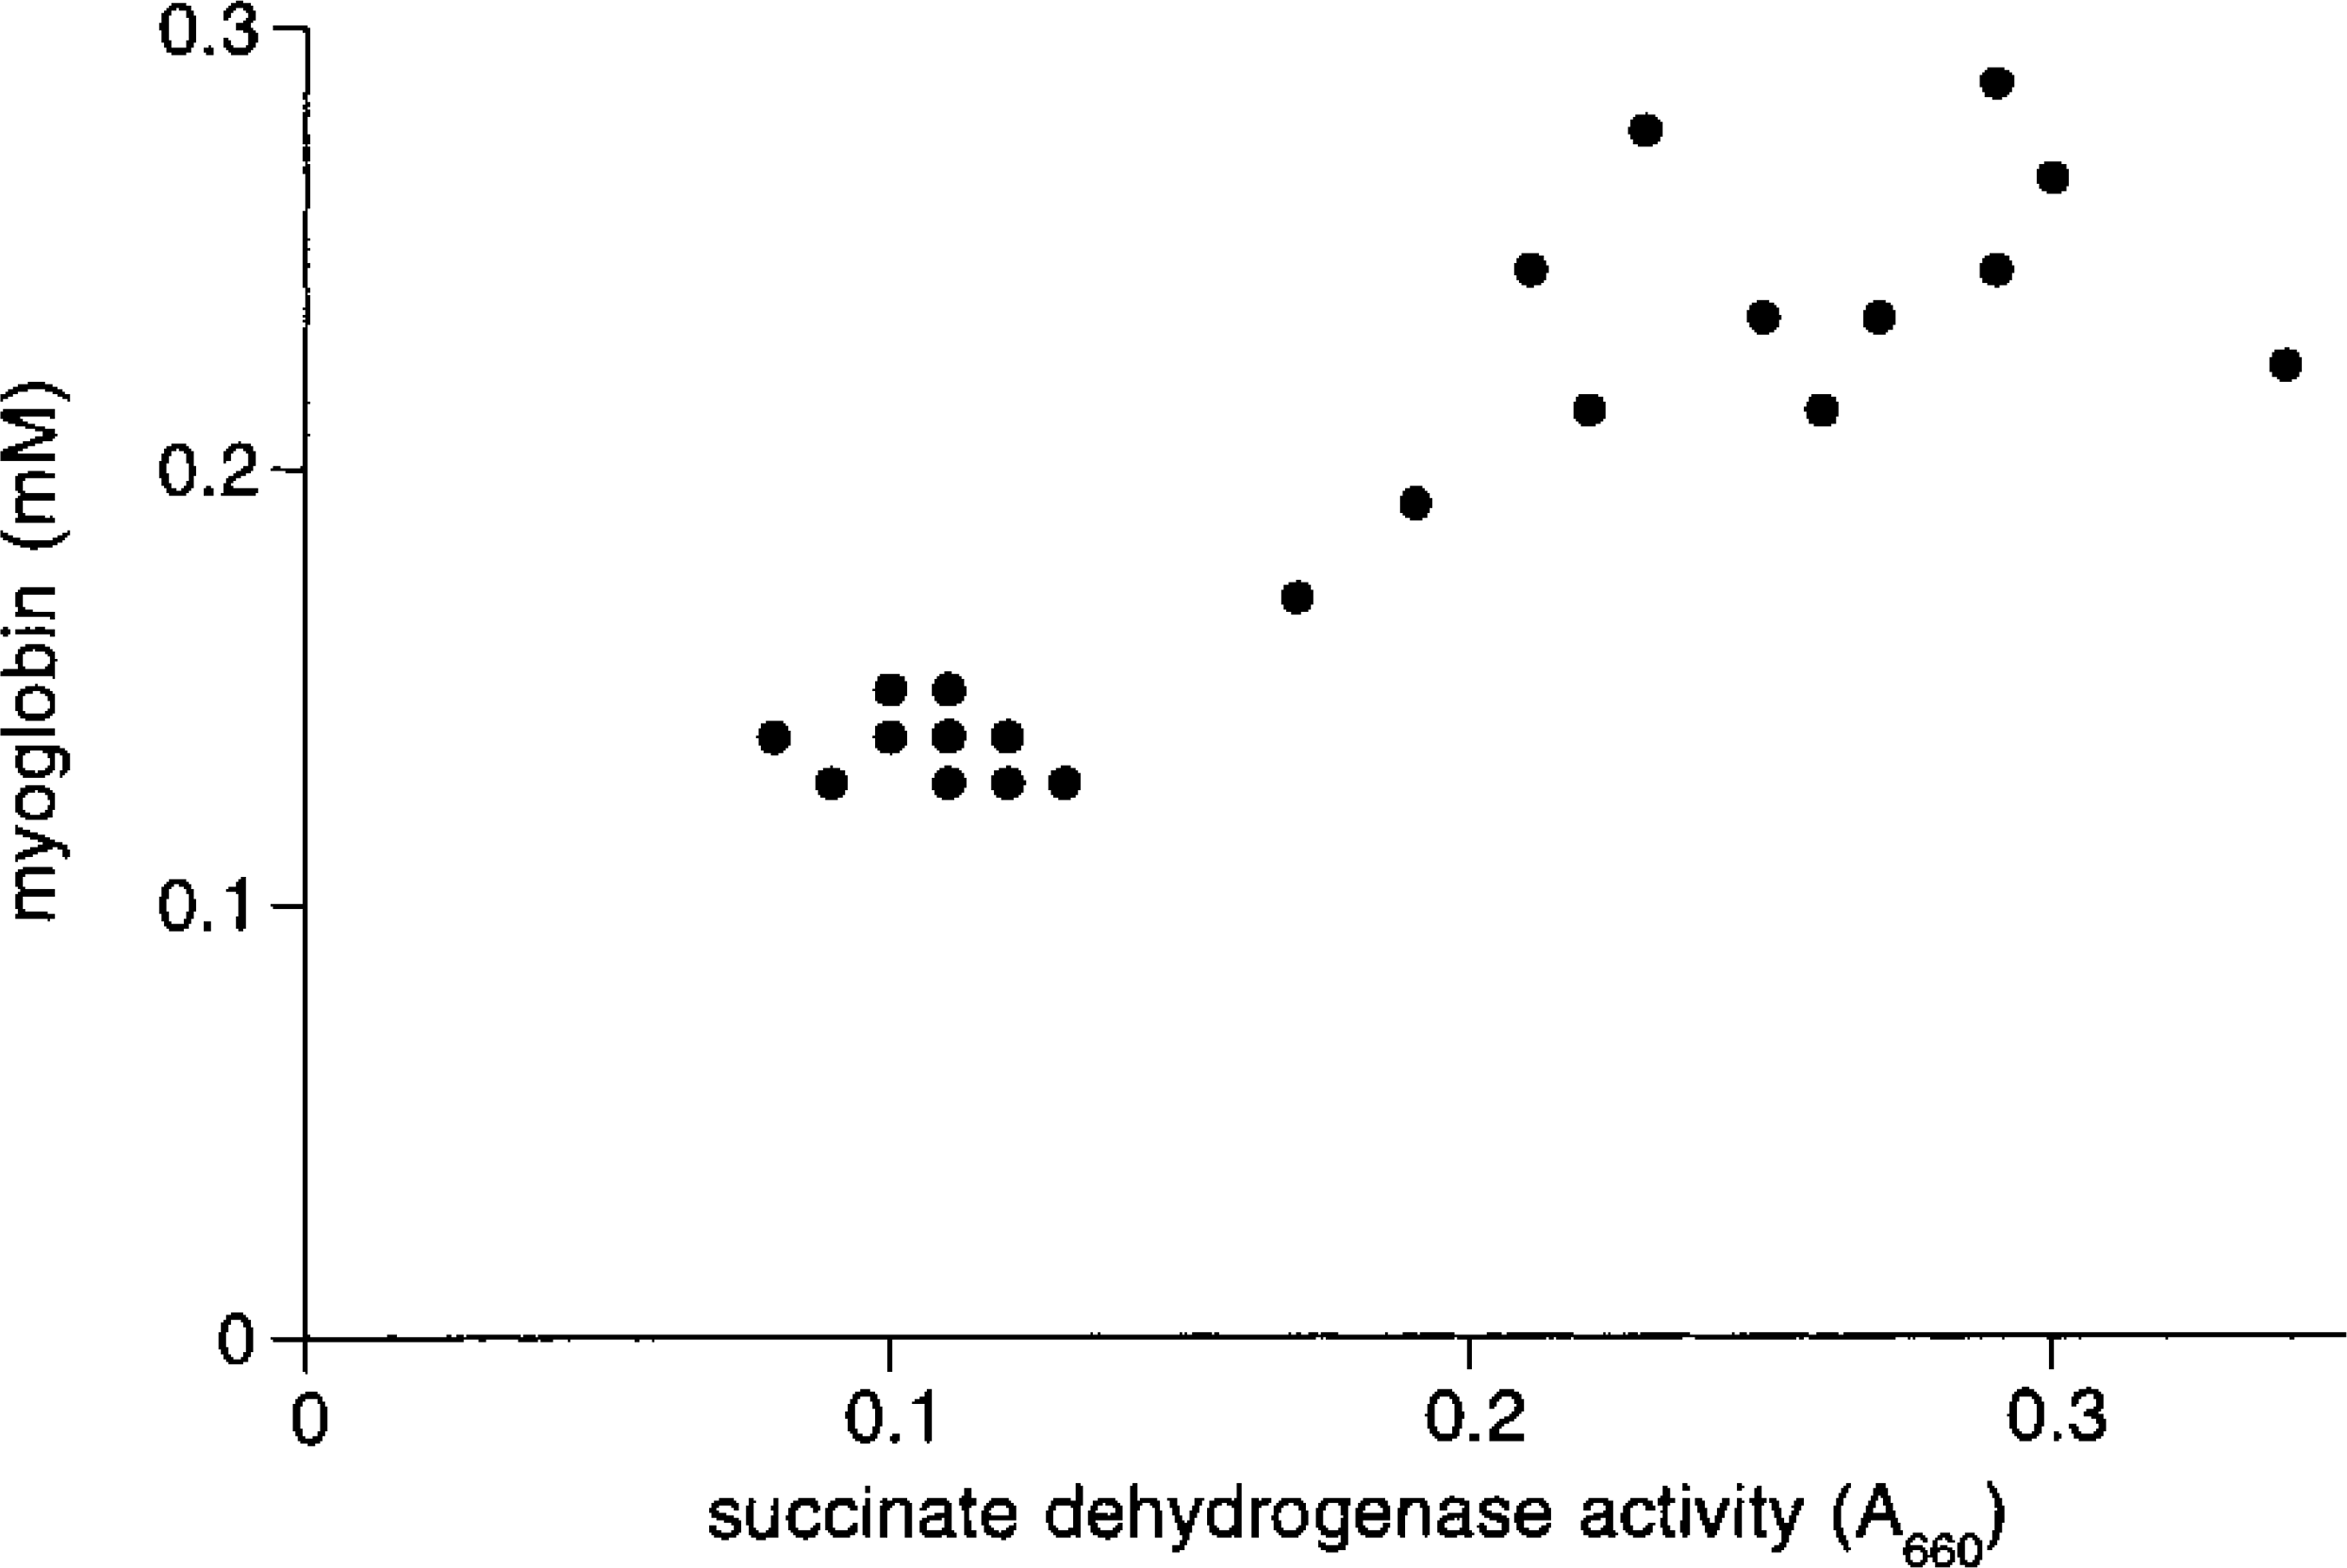
Figure 4 shows a highly significant correlation between the histochemical and biochemical myoglobin determinations, although one measuring point for a hyperthyroid rat deviates obviously. A possible cause for the deviant measurement is that the tissue sample for the biochemical myoglobin assay contained fewer cardiomyocytes and more interstitial space than the tissue sample used for the histochemical assay, which does not deviate from the other hyperthyroid rats. The calibration line clearly indicates that, provided corrections for interstitial space and degree of shrinkage are made, the histochemical method allows accurate myoglobin determinations in individual cardiomyocytes. As an example, we applied the method to determine the myoglobin concentration in individual high- and low-oxidative muscle fibers of the rat EDL (Figure 5). As found previously in the plantaris muscle of the mouse (van der Laarse et al. 1985), the myoglobin concentration correlates (r = 0.90; p>0.001) with the oxidative capacity of individual muscle fibers as judged from the succinate dehydrogenase activity (Figure 6). In the rat EDL the myoglobin concentration in highoxidative fibers can be threefold higher than that in low-oxidative fibers. This result confirms that biochemical myoglobin determinations must be interpreted with care when the distribution of myoglobin concentrations among individual cells is not known.
Three-level nested analysis of variance of the myoglobin concentration among cardiomyocytes a
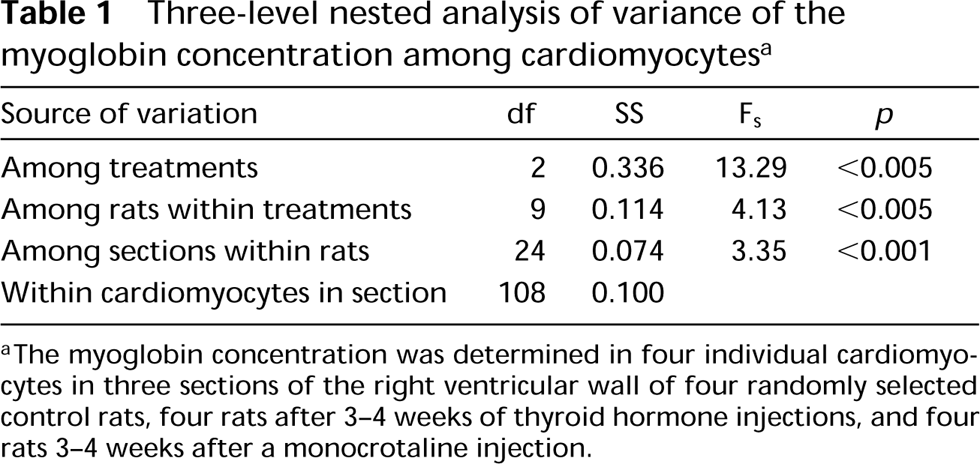
aThe myoglobin concentration was determined in four individual cardiomyocytes in three sections of the right ventricular wall of four randomly selected control rats, four rats after 3–4 weeks of thyroid hormone injections, and four rats 3–4 weeks after a monocrotaline injection.
To study the distribution of myoglobin concentration among cardiomyocytes from hypertrophied and control rat hearts, we measured the myoglobin concentration in four randomly selected individual cardiomyocytes in three sections of different hearts. The data were analyzed with a three-level nested analysis of variance (Table 1). The analysis detects significant differences between the myoglobin concentration after different treatments, between individual rats within groups, and between different sections from the same heart. The latter suggests that the myoglobin concentration among cardiomyocytes of a given heart differs. To test this possibility, the myoglobin concentration of two cardiomyocytes (indicated in Figure 3G) was determined in four serial sections. Two-way analysis of variance detected a significant difference (F1,3 = 132.3; p>0.05) between the two cardiomyocytes but no significant difference between the serial sections (F3,1 = 0.012).
Table 2 gives the mean myoglobin concentration, the mean volume of cytoplasm per nucleus, and the amount of myoglobin per nucleus. Analysis of variance of these data showed that differences between groups were significant for the volume of cytoplasm per nucleus, indicating different degrees of hypertrophy, and that the amount of myoglobin per nucleus was also different between the groups. Note that the myoglobin concentration in cardiomyocytes of monocrotaline- treated rats was lower than the myoglobin concentration in cardiomyocytes of hyperthyroid rats, whereas the volume of cytoplasm per nucleus was higher in monocrotaline-treated rats than in hyperthyroid rats. The amount of myoglobin per cardiomyocyte nucleus in hypertrophied hearts was two- to threefold higher compared to control.
Discussion
Our results clearly demonstrate that it is possible to determine the myoglobin concentration in rat and rabbit cardiomyocytes by the present histochemical method. The peroxidase activities of glutaraldehyde-fixed myoglobin from rat, rabbit, and horse are similar and are proportional to the activity of native myoglobin. We have found differences in the absorbance spectra of the final reaction products in the histochemical and biochemical assays, indicating that the slope of the calibration line shown in Figure 4 is wavelengthdependent. The reason for this difference remains to be elucidated.
Contrary to previous studies reporting myoglobin deficiency in failing hearts (O'Brien et al. 1992a, 1995; Weil et al. 1997), we find an increase of the myoglobin concentration in cardiomyocytes of hyperthyroid rats and no change in the myoglobin concentration of cardiomyocytes of rats treated with monocrotaline. It should be noted that we normalized myoglobin content by the volume of cardiomyocyte cytoplasm and not by wet weight or protein content of the samples, as was done previously. We propose to take into account changes in interstitial space when the myoglobin content of control and failing hearts is normalized (cf. Figure 3).
The results indicate that, not only in skeletal muscle but also in control and hypertrophied hearts, differentiation among cardiomyocytes exists with respect to the myoglobin concentration. The mean myoglobin concentration may or may not change during the development of right ventricular hypertrophy, depending on the model used. Interestingly, the results show that, despite differences in the degree of hypertrophy and differences in the myoglobin concentration we have found in the two models, the amount of myoglobin per nucleus has increased approximately to the same extent. This indicates that in hypertrophied hearts the rate of myoglobin synthesis is increased and/or the rate of myoglobin degradation is decreased, and warrants further research into the role played by myoglobin in the transition from compensatory hypertrophy of the heart to heart failure.
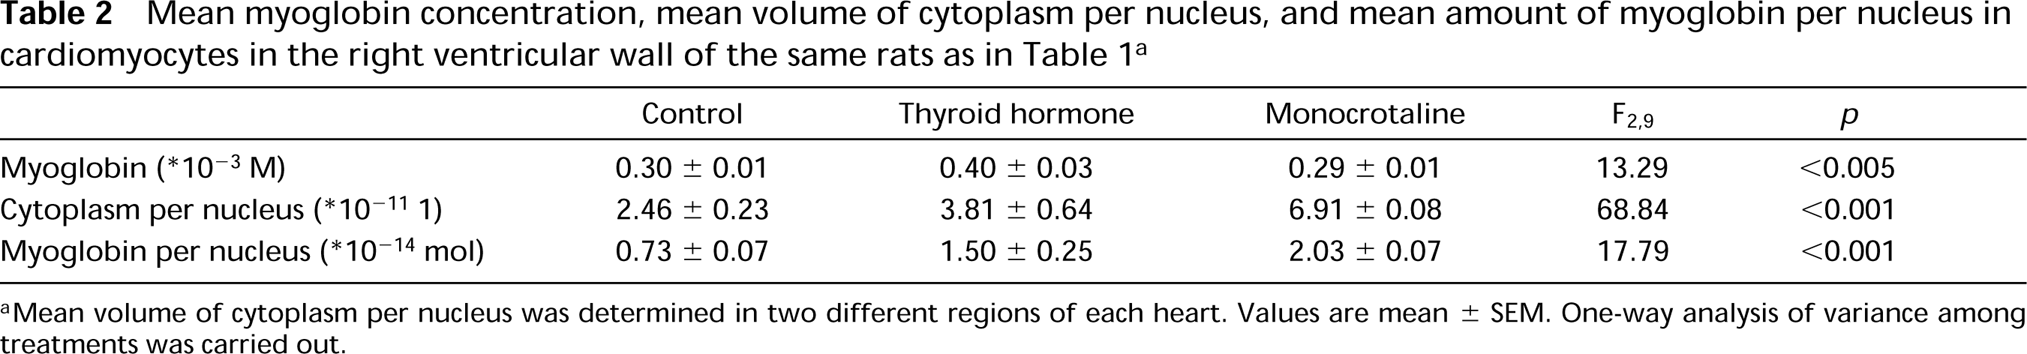
aMean volume of cytoplasm per nucleus was determined in two different regions of each heart. Values are mean 6 SEM. One-way analysis of variance among treatments was carried out.
Footnotes
Acknowledgements
Supported by the Netherlands Heart Foundation, NHS grant 94.003.
We thank Dr G. Harrison for kindly donating the biopsies of the rabbit hearts.