
Abstract
We investigated phosphorescent metalloporphyrins as potential labels for time-resolved microscopy. On the basis of spectroscopic analysis of their physicochemical properties (quantum yield, molar absorption coefficient, decay times) the best candidates were selected. Next, we synthesized antibody and avidin metalloporphyrin conjugates. The optimal F/P ratio with respect to quantum yield, decay time, and retention of biological activity of these immunoreagents was determined. The reagents were then evaluated by in situ hybridization and immunocytochemical procedures for demonstration of hapten-labeled DNA probes, membrane antigens (CD type), and 28S rRNA. All stained samples exhibited bright phosphorescence that could be selectively detected using time-resolved microscopy, especially when glucose/glucose oxidase was added to the embedding medium to deplete oxygen. Applications of time-resolved detection of phosphorescent porphyrins in strongly autofluorescent material (histological sections) are discussed.
Keywords
F
Recently, it was demonstrated that application of the biotin–tyramide amplification system (CARD) originally developed for applications on filters (Bobrow et al. 1989, 1992; Adams 1992) can also be used for cytochemical applications (Kerstens et al. 1995; Raap et al. 1995). The signal intensity of an in situ bound streptavidin–Eu chelate could be significantly enhanced when this amplification system was used for DNA or RNA in situ hybridization or for detection of tissue antigens using a immuno(histo-)cytochemical approach (de Haas et al. 1996).
In addition to lanthanide chelates, metalloporphyrins form another class of potentially interesting labels for time-resolved microscopy (Eastwood and Gouterman 1970; Savitski et al. 1989; Vinogradov and Wilson 1995; Hennink et al. 1996). Their luminescence properties depend on the metal substitution. The palladium (Pd)- and platinum (Pt)-substituted complexes have a high phosphorescence quantum yield even in an aqueous environment at room temperature (RT). In particular, the Pt porphyrin complexes are of interest because they exhibit a higher quantum yield and shorter lifetime under aqueous conditions at RT than the Pd complexes, enabling a higher excitation and emission duty cycle when used for time-resolved microscopy (Hennink et al. 1996).
Recently, Mantrova et al. (1994) reported the application of a Pd coproporphyrin in phosphorescence-based immunoassays with a quantum yield of 0.17 and a molar extinction coefficient of 200,000 M-1.cm-1, resulting in a detection sensitivity higher than can be achieved with a horseradish peroxidase method employing ABTS (2,2-azino-di-[3-ethylbenzthiazoline sulfonate]) as substrate.
The aim of this study was to investigate the use of Pt meso-tetracarboxyphenyl porphyrin and Pt coproporhyrin as labels for antibodies and (strept)avidin for application in time-resolved microscopy. The porphyrins selected on the basis of measured photophysical properties were converted into an active N-hydroxysuccinimide ester (Konig and Geiger 1970) by a 1,3-dicyclohex-ylcarbodiimide-mediated reaction in the presence of 1-hydroxybenzotriazol as a catalyst and were coupled to the antibodies and (strept)avidin. The properties of the conjugates (quantum yield, photostability, decay time) were spectroscopically determined. They were subsequently tested for various immunocytochemical applications, including detection of DNA and RNA sequences by FISH.
Materials and Methods
Photophysical Characterization of Pt meso-tetra (4-carboxyphenyl)porphine (PTP) and Pt 3, 8, 13, 18-tetramethyl-21H, 23H-porphine-2, 7, 12, 18-tetrapropionic Acid (PTCP)
PTP and PTCP (Porphyrin Products; Logan, UT) were dissolved in a 50 mM phosphate buffer (pH 8.0) and absorption spectra were recorded on a D4–64 Beckman absorption spectrophotometer. The excitation and emission spectra of both porphyrin derivatives were recorded on a SPEX Fluorolog 2 spectrofluorometer (SPEX Industries; Edison, NJ), using 400-nm and 380-nm light to excite PTP and PTCP, respectively. For recording of the excitation spectrum, the 670-nm emission for PTP and 650-nm emission for PTCP were selected. Luminescence lifetimes were determined with an OMAIII (optical multichannel analyzer) (EG&G; Vaudreuil, Quebec, Canada) setup using an Nd YAG laser as excitation source (λex 532 nm). The quantum yield was determined using rhodamine B (Q 1.0) (Aldrich; Bornem, Belgium) dissolved in the same buffer as the porphyrin samples. For all measurements, samples were diluted such that the absorbance was less than 0.1. The measured spectra and calculated quantum yield were corrected for the detector sensitivity and lamp intensity.
Synthesis of Pt meso-tetra(4-carboxyphenyl) porphine-N-hydroxy-succinimide Esters (PTP-N-NHS) and Pt 3,8,13,18-tetramethyl-21H, 23H-porphine-2, 7, 12, 18-tetrapropionic acid-N-hydroxy-succinimide Esters (PTCP-N-NHS)
Pt meso-tetra(4-carboxyphenyl)porphine 19.3 mg was dissolved in 700 μl DMF (Aldrich) (water-free, double-distilled). After a clear solution was formed, 53 μl 1-hydroxybenzotriazol (Aldrich) (50 mg/ml, 370 mM) and 81 μl 1,3-dicyclohex-ylcarbodiimide (Pierce; Rockford, IL) (50 mg/ml, 242 mM) were added. The resulting solution was agitated for 15 min at RT and 45 μl of a solution containing 50 mg/ml (434 mM) N-hydroxysuccinimide (Aldrich) in DMF was added. This reaction mixture was agitated for 20 hr in the dark at RT and then cooled to −20C to settle and precipitate the N,NR'-dicyclohexylurea that is formed as a side product during the course of the reaction. The tube was centrifuged for 30 min at 4C and the supernatant was divided into small aliquots and stored in the dark at −20C without further purification. A solution of 22.2 mM PTP-1-NHS ester was obtained. The PTP-2-NHS, PTP-3-NHS, and PTP-4-NHS esters were in principle prepared by the same procedure by altering the ratios of 1-hydroxybenzotriazol, 1,3-dicyclohexyl-carbodiimide, and N-hydroxysucciminide in the reaction mixture. The following solutions were prepared in this way: 18.5 mM PTP-2-NHS, 17.0 mM PTP-3-NHS, and 10 mM PTP-4-NHS.
For preparation of Pt 3, 8, 13, 18-tetramethyl-21H, 23H-porphine-2, 7, 12, 18-tetrapropionic-N-hydroxy-succinimide esters (PTCP-N-NHS (n 1, 2, 3, or 4)) the same method as described above was used. The following esters were obtained: 18.7 mM PTCP-1-NHS, 17.0 mM PTCP-2-NHS, 17.7 mM PTCP-3-NHS, and 10 mM PTCP-4-NHS.
Conjugation of PTP-N-NHS and PTCP-N-NHS to Avidin, Streptavidin, Neutravidin, and Antibodies
Avidin-D (Vector; Burlingame, CA), streptavidin (Rockland; Gilbertsville, PA), and neutravidin (Pierce) were dissolved in 1 × NHS buffer (5 × NHS buffer is 0.250 M Naphosphate, pH 8.0, 0.500 M NaCl, and 25.0 mM EDTA, pH 8.0) and allowed to react with the various porphyrins with different concentrations under different incubation conditions (Table 1).
The conjugates were purified after labeling by gel filtration using Sephadex G50. Unreacted porphyrins remain at the top of the column because they bind strongly to the Sephadex beads (Hennink et al. 1996), whereas the protein–porphyrin conjugate elutes in the void volume.
For antibody labeling the total IgG fractions of goat anti-mouse (Pierce), goat anti-digoxigenin, and goat anti-dinitrophenol (kindly provided by Dr. M. Daha, Department of Nephrology, University Hospital, Leiden, The Netherlands) were dialyzed against 1 × NHS buffer and the protein concentration was determined using the BCA reagent (Pierce) according to the manufacturer's instructions. The immunoaffinity-purified goat anti-mouse IgG F(ab')2 fragment (Pierce) was directly dissolved in 1 × NHS buffer. The total IgG fractions were labeled with PTP-1-NHS, PTP-3-NHS, and PTCP-2-NHS. The immunoaffinity-purified goat anti-mouse and goat anti-mouse F(ab')2 fragments were labeled with PTCP-2-NHS ester under various conditions (Table 2). The conjugates were purified after labeling as described for the streptavidin labeling and the F/P ratio, yield, and retention of biological activity were determined (see below). The yield of the conjugates was determined on the basis of the volume obtained after gel filtration. The protein concentration in the samples was determined by measuring the absorbance at 280 nm corrected for the contribution of the porphyrin absorbance at this wavelength.
Labeling of avidin-
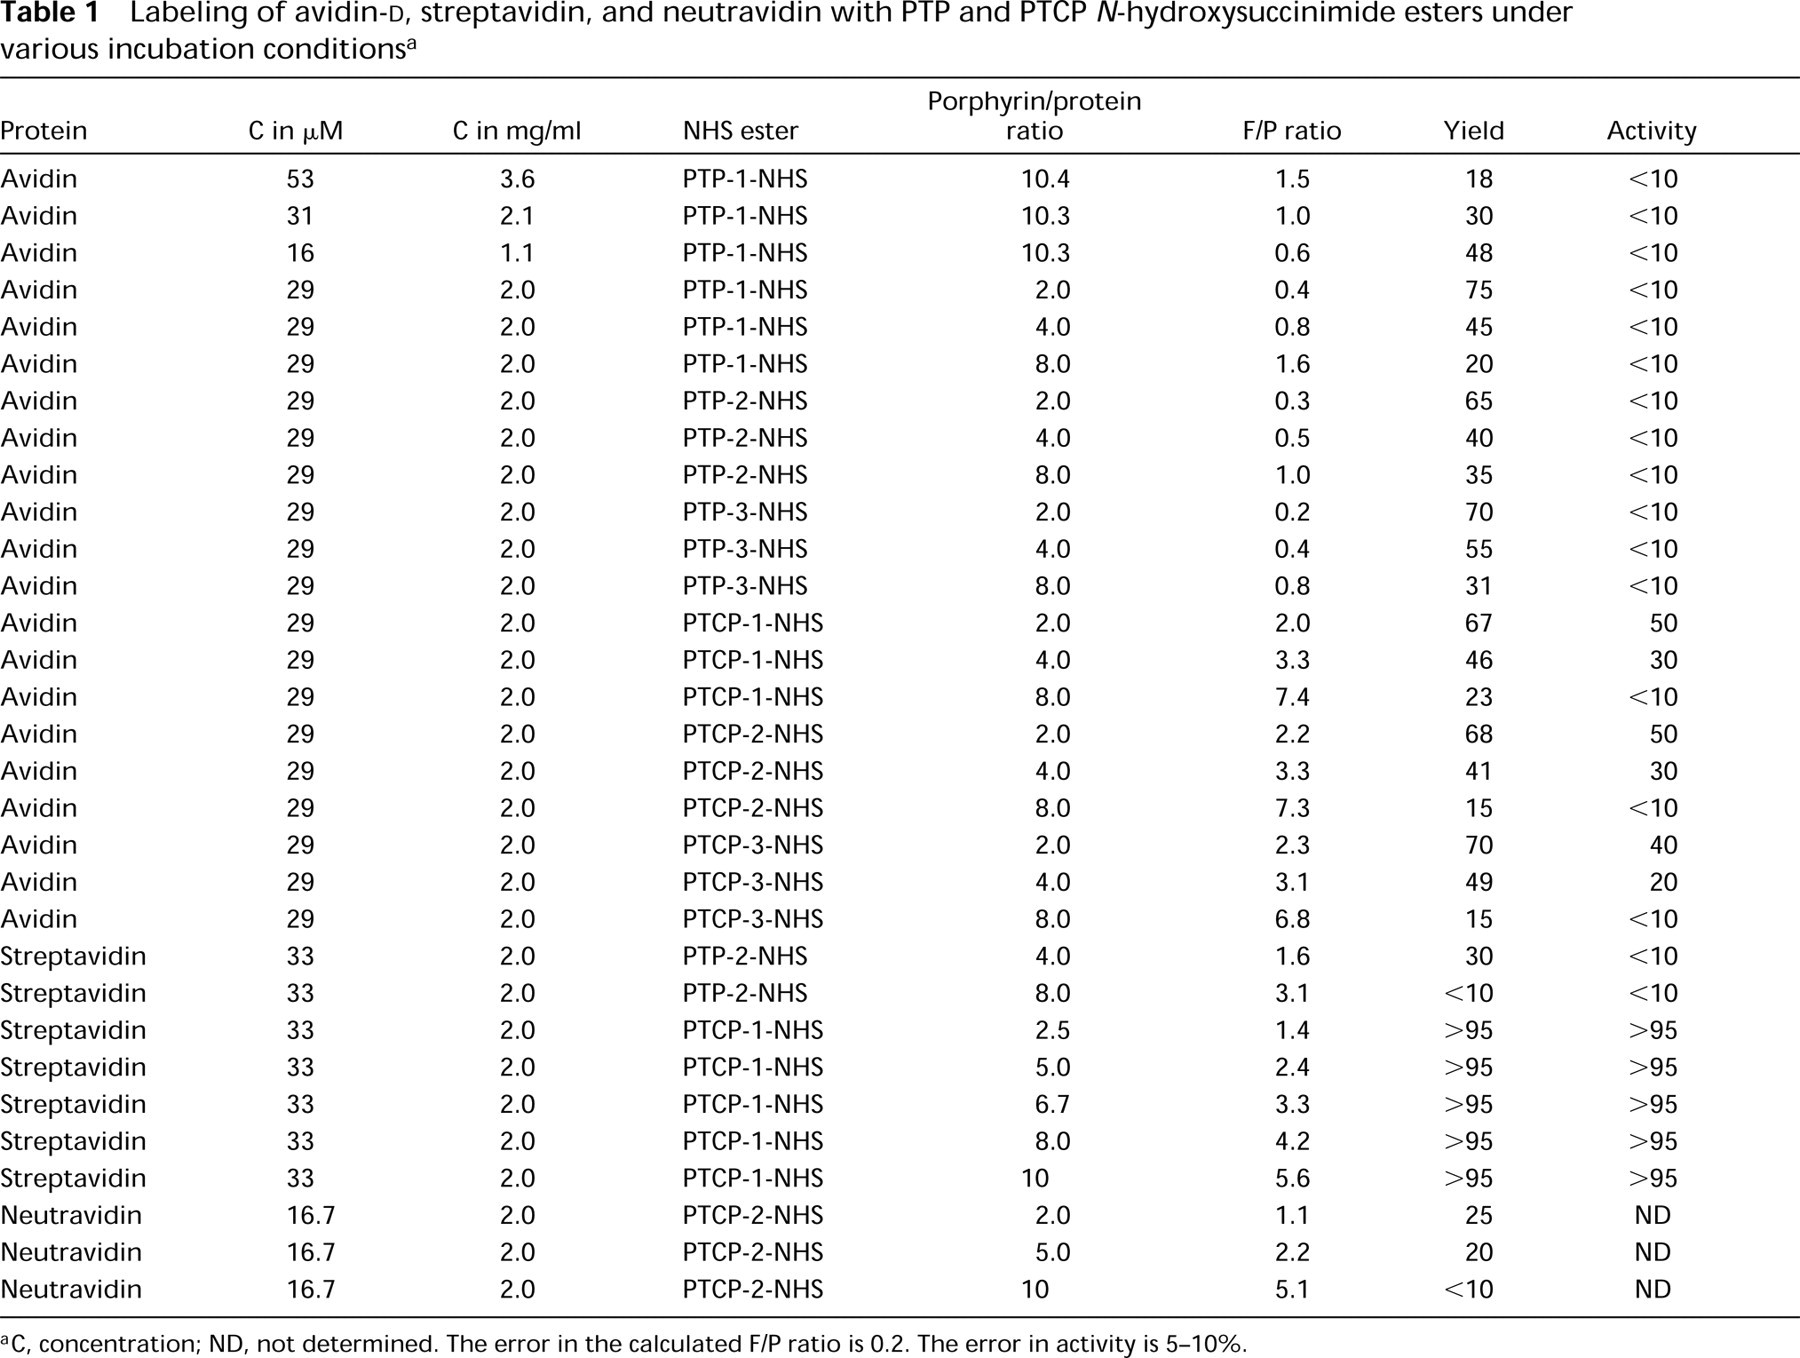
C, concentration; ND, not determined. The error in the calculated F/P ratio is 0.2. The error in activity is 5–10%.
Determination of F/P Ratio of the Labeled Protein–porphyrin Conjugates
The protein and porphyrin concentration of a sample was calculated on the basis of the absorbance at 280 nm, 370 nm, and 397 nm for protein, PTP, and PTCP respectively. The contributions of PTP and PTCP at 280 nm were 15% and 30%, respectively, of their main absorbance peak.
On the basis of the determined molar extinction coefficient of the porphyrins, the F/P ratio for avidin- (1.7 × A380)/((A280 - (0.3 × A380))
For PTP, similar formulas were derived.
Determination of Retention of the Biological Activity of the (Strept-)avidin and Antibodies Labeled with PTP and PTCP
For determination of the biotin binding capacity of (strept) avidin-labeled PTP/PTCP the following ELISA test was performed. BSA (bovine serum albumin) (Sigma; St Louis, MO) was labeled at 20 mg/ml in 1 × NHS buffer for 2 hr at 30C with 5 mg/ml biotin-LC-NHS (Pierce) from a 50 mg/ml stock solution in DMSO (dimethylsulfoxide) (Aldrich). The biotinylated BSA was purified by gel filtration with Sephadex G50 fine (Pharmacia; Roosendaal, The Netherlands) equilibrated with TBSE, after which the BSA concentration was determined using the BCA reagent from Pierce.
Labeling of goat anti-mouse, goat anti-dinitrophenyl, and goat anti-digoxigenin antibodies under various incubation conditionsa
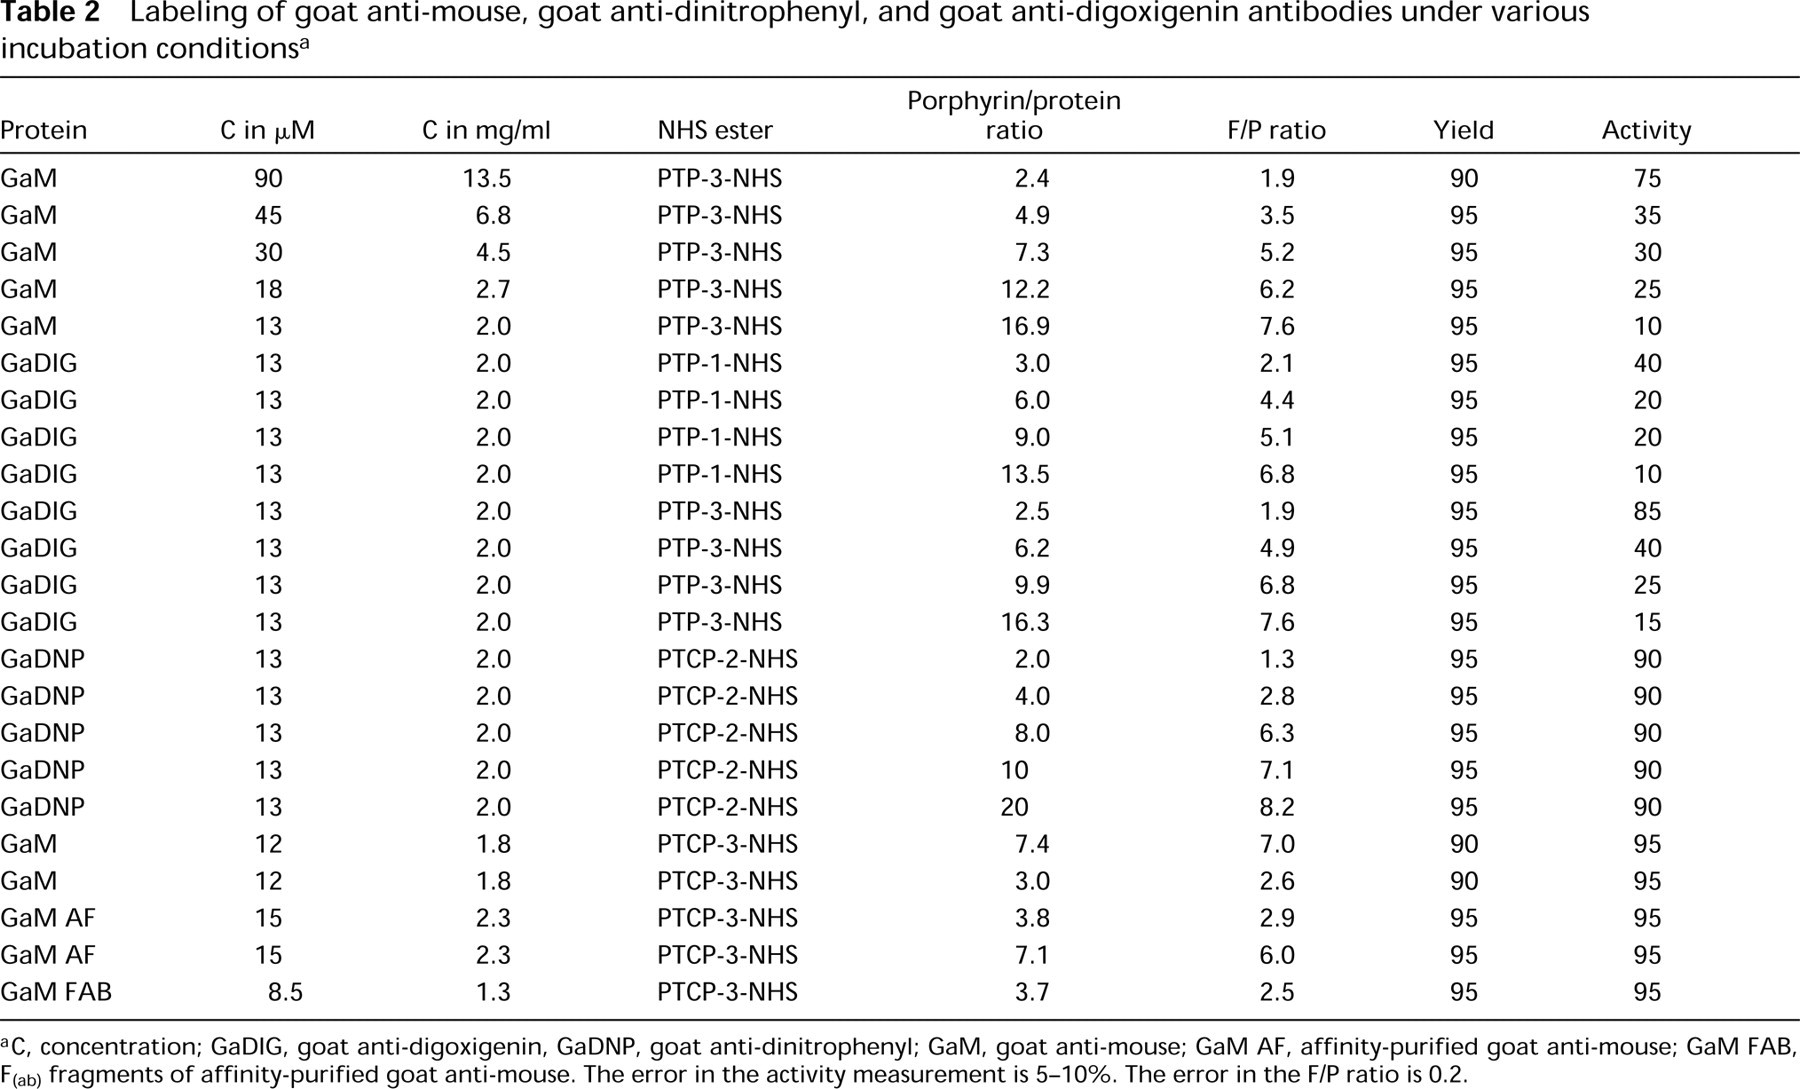
C, concentration; GaDIG, goat anti-digoxigenin, GaDNP, goat anti-dinitrophenyl; GaM, goat anti-mouse; GaM AF, affinity-purified goat anti-mouse; GaM FAB, F(ab) fragments of affinity-purified goat anti-mouse. The error in the activity measurement is 5–10%. The error in the F/P ratio is 0.2.
A 96-well plate (Costar; Badhoevedorp, The Netherlands) was coated with 150 μl 10 μg/ml biotinylated BSA per well for 2 hr at 37C, washed three times with TNT (50 mM Tris-HCl, pH 7.4, 0.15 M NaCl, 0.05% Tween-20 (Aldrich) and incubated with 150 μl TNB [0.5% (w/v) Boehringer blocking reagent in TBS] for 30 min at 37C. Samples of PTP/ PTCP-labeled (strept-)avidin were twofold serially diluted in TNB starting with 200 μg/ml and incubated for 1 hr at 37C, after which the plate was washed three times with TNT. Then the wells were incubated with 125 μl (1:400 dilution in TNB) goat anti-avidin labeled with peroxidase (Vector), washed three times with TNT, and developed with OPD using 150 μl per well in OPD buffer (0.1 M citrate/phosphate, pH 5.3, containing 0.03% H2O2) for 30 min. The reaction was stopped with 50 μl 0.18M H2SO4 and the absorbance of each well was measured at 492 nm. Unlabeled avidin and streptavidin were used as 100% control.
For determination of retention of biological activity of goat anti-digoxigenin, goat anti-dinitrophenyl and goat anti-mouse, similar ELISA tests were performed. The quantum yield and decay time of the conjugates were measured as described for the free dyes (see above).
Evaluation of PTCP-labeled (Strept-)avidin and Neutravidin for In Situ Hybridization
DNA hybridization for the centromeric region of chromosome 1 was performed as described previously (Wiegant et al. 1993). After posthybridization washing, the slides were rinsed twice for 5 min in TBS and blocking was performed in 0.5% BMP/TBS for 30 min at 37C in a moist chamber. After blocking, the first antibody layer was applied to the slides. Biotinylated mouse anti-digoxigenin was applied. Next, streptavidin-PTCP conjugates with F/P ratios of 1.4, 2.4, 3.3, 4.2, and 5.6 were applied to the slide. (Note: all immunological incubations were performed at 37C in a moist chamber unless stated otherwise.) After 2 hr of incubation the slides were rinsed with TNT, three times for 5 min each. After the final TNT wash the slides were counterstained with a DAPI (4′6-diamine-2′-phenylindole dihydrochloride) solution (5 ng/ml) for 15 min at RT. The slides were then washed twice with TBS, dehydrated in ethanol, and air-dried. The slides were embedded in 25 μl glycerol:0.5 M PB (9:1 v/v), pH 8.0, containing 20 mM glucose and 20 U/ml glucose oxidase (Boehringer).
Time-resolved Detection of 28S rRNA Sequence in HeLa Cells
The 28S RNA in situ hybridization using a digoxigenin-labeled probe was performed as previously described (Dirks et al. 1993; de Haas et al. 1996). The immunocytochemical detection was carried out as follows. The cells were blocked with 0.5% BMP/TBS for 30 min. The cells were then incubated with biotinylated mouse anti-digoxigenin (3 μg/ml) in 0.5% BMP/TBS for 30 min in a moist chamber at 37C. The cells were then incubated with streptavidin–PTCP (10 μg/ ml) or with streptavidin–FITC as a control in TNB and rinsed afterwards with 0.05% Tween-20/TBS, three times for 5 min. Those slides that were incubated with streptavidin–PTCP were counterstained with DAPI in PBS at a final concentration of 5 ng/ml for 10 min at RT. The cells were dehydrated in ethanol and embedded as described above. Slides incubated with streptavidin–FITC were dehydrated and counterstained with DABCO/DAPI.
One slide was counterstained with 500 ng/ml propidium iodide in TNT for 15 min at RT, washed two times in TNT, and subsequently dehydrated and embedded in Vectashield.
Detection of CD4 Marker on Formaldehyde-fixed Human Lymphocytes
Mononuclear cells were isolated from peripheral blood by density gradient centrifugation, fixed with 5% formaldehyde (v/v) in PBS, pH 7.4, for 30 min at 4C, and cytospin preparations were made using ethanol/ether-cleaned glass slides. The endogenous peroxidase was inactivated by incubation with 3% H2O2 in methanol for 30 min at RT.
After blocking in TNB for 30 min at RT in a moist chamber, mouse anti-CD4 was applied (diluted 1:50 in TNB) for 30 min at RT. After washing, the cells were incubated with rabbit anti-mouse-labeled peroxidase 3 μg/ml for 30 min in TNB. The cells were subsequently washed and incubated with biotin–tyramide (NEN–Dupont; Boston, MA) 1:300 (3.3 μg/ml) in 50 mM Tris-HCl pH 8.0, with 0.001% H2O2 and 10 mM imidazole for about 30 min. After extensive washing with TNT (four times for 10 min each at RT), a streptavidin-labeled fluorescein or streptavidin–PTCP conjugate with F/P = 5.6 was applied. The slides were embedded in Vectashield.
Photostability of Streptavidin–PTCP Conjugates Under In Situ Conditions
The photostability of the streptavidin–PTCP conjugates was investigated using slides stained by FISH with a biotinylated probe for the centromeric region of chromosome 1 embedded in various media. The slides were stained with the streptavidin conjugate with an F/P of 5.6 and were stored in the dark before measurements. To avoid bleaching of the porphyrin before the measurements, images were first focused onto the CCD camera on the basis of their autofluorescence on excitation with blue light.
The excitation time of the specimen was varied from 0 to 60 min, and images were recorded and stored on a hard disk for further analysis. The bleaching of the pixel with the highest intensity of the signal in the interphase nuclei at t = 0 was followed in time; this pixel intensity was set to 100% after subtracting the background signal. Within one image, at least three stained nuclei were measured and the experiment was repeated twice. The data points were averaged and a bleaching curve was drawn by hand.
Detection of Initial Signal Intensity in Several Embedding Media
Morphologically well shaped and equally sized interphase nuclei containing two regularly stained centromeres for chromosome 1 were chosen for measurements. The signal intensities were corrected for the background and averaged for each embedding medium, and the standard deviation was calculated. The initial signal intensity of 50 nuclei was measured for each of the embedding media. Integration time was kept constant at 2 sec.
Conventional Microscopy
Photomicrographs were taken with a Leica DM epifluorescence microscope equipped with a 100-W mercury arc lamp and appropriate filter sets for visualization of DAPI fluorescence and porphyrin phosphorescence. The filter block for porphyrin contained a bandpass 500–560-nm and a long-pass 580-nm filter. In the emission pathway, a 600–700-nm bandpass filter was used. A x40 NA 1.30, a x100 NA 1.30 PL Fluotar or a x63 NA 1.32 PL APO objective was used, using 640 ASA 3M color slide film. The exposure time was 2–5 sec (DAPI counterstain) to 2–5 min (porphyrin conjugate).
Time-resolved Laser Microscopy
Porphyrin-stained samples were also investigated using a time-resolved laser scanning microscope (Hennink et al. 1996). This microscope consists of a Leitz Orthoplan (Leitz Wetzlar; Oberkochen, Germany) fitted with an argon ion laser (Spectra Physics series 2000; Spectra-Physics, Mountain View, CA). The excitation light was chopped by an Acousto-optical Modulator (AOM) (Isomet model 1205–2; Isomet, Springfield, VA), coupled into an optical fiber and fed to the microscope stand using a beam expander. Laser excitation light of 514 nm was used in combination with a TK580 dichroic mirror and an LP600 interference barrier filter. A gated MCP image intensifier (xx1450; DEP, Roden, The Netherlands) was used as detector. The AOM and the gated MCP image intensifier were controlled by a sequencer interfaced to a Macintosh IIfx computer. This setup enables complete computer control of the excitation and emission shutters with a time resolution of 0.5 μsec. For time-resolved detection of the stained biological objects, the following typical duty cycle was used: illumination time 50 μsec, delay time 2 μsec, detection time 48 μsec, repetition time 100 μsec, and integration time 300 msec.
Results
Photophysical Properties of PTP and PTCP
The molecular structures of PTP and PTCP and their excitation and emission are shown in Figures 1 and 2, respectively. PTP has an excitation maximum at 402 nm (the so-called Soret transition) and other maxima at 230, 280, and 514 nm. Its maximal emission peak is at 672 and 735 nm. For PTCP, the excitation maximum is shifted to shorter wavelengths compared with PTP and is located at 380 nm; the other maxima are at 242, 291, 503, and 505 nm. PTCP has emission peaks at 649 nm and 709 nm. Calculated molar absorption coefficients (Table 3) show that PTP has twice as high a molar extinction coefficient at 402 nm as PTCP. PTP has a quantum yield (Q) of 0.05 when oxygen is present and of 0.23 when oxygen is removed from the solution by flushing with argon gas. PTCP has a Q of 0.04 in the presence of oxygen, increasing to 0.23 on oxygen removal. For PTP and PTCP, decay times of respectively 2 μsec and 2 μsec were found in the presence of oxygen. This decay time increased to 27.7 μsec and 51.6 μsec on removal of oxygen. These data show that oxygen is a very efficient quencher of the triplet state. In all cases, the decay follows a monoexponential function.
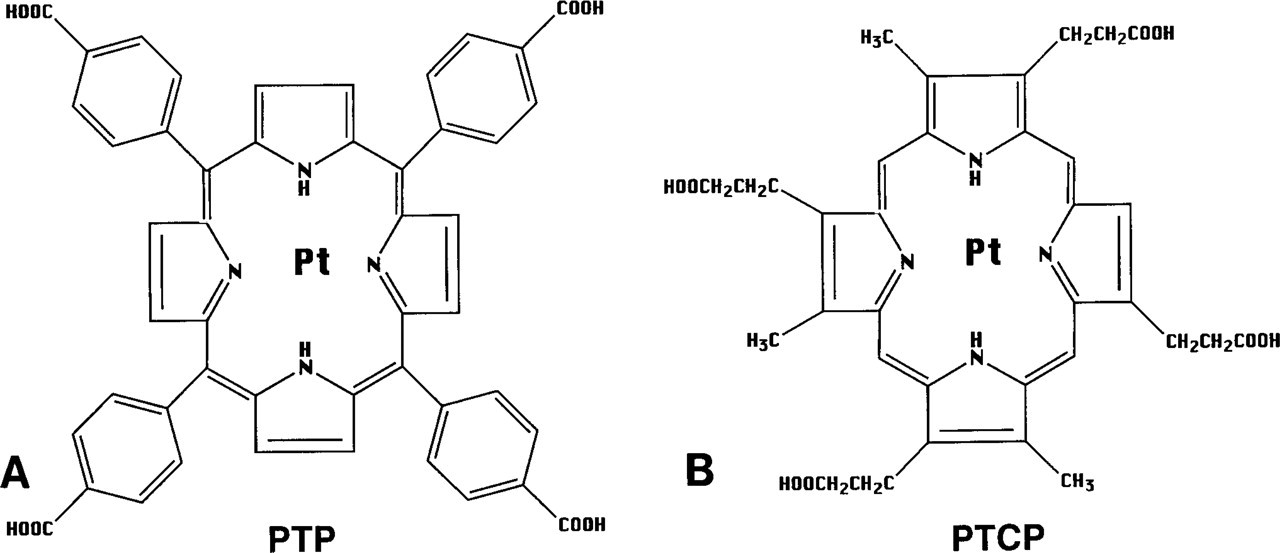
(A) Molecular structure of Pt meso-tetra(4-carboxyphenyl) porphine (PTP). (
Table 3 summarizes the influence of the embedding medium on the photophysical data for both porphyrins. The results show that, in general, the decay time increases with a higher viscosity (as in glycerol). This is likely to be explained by the lower diffusion rate of oxygen, which results in a lower quenching rate of the porphyrin triplet state, thereby increasing the decay time and quantum yield. Removal of oxygen results in a further increase of decay time up to 91.5 μsec with a quantum yield of 0.54, irrespective of the method used to remove the oxygen. This indicates that neither glucose oxidase nor glucose quenches the phosphorescence. The data also suggest that another quenching mechanism of the triplet state probably plays a role, indicated by the fact that there is a significant difference in decay time between PTCP in phosphate buffer or in oxygen-depleted glycerol. Vectashield apparently contains components that quench the triplet state, resulting in a decreased decay time and quantum yield.
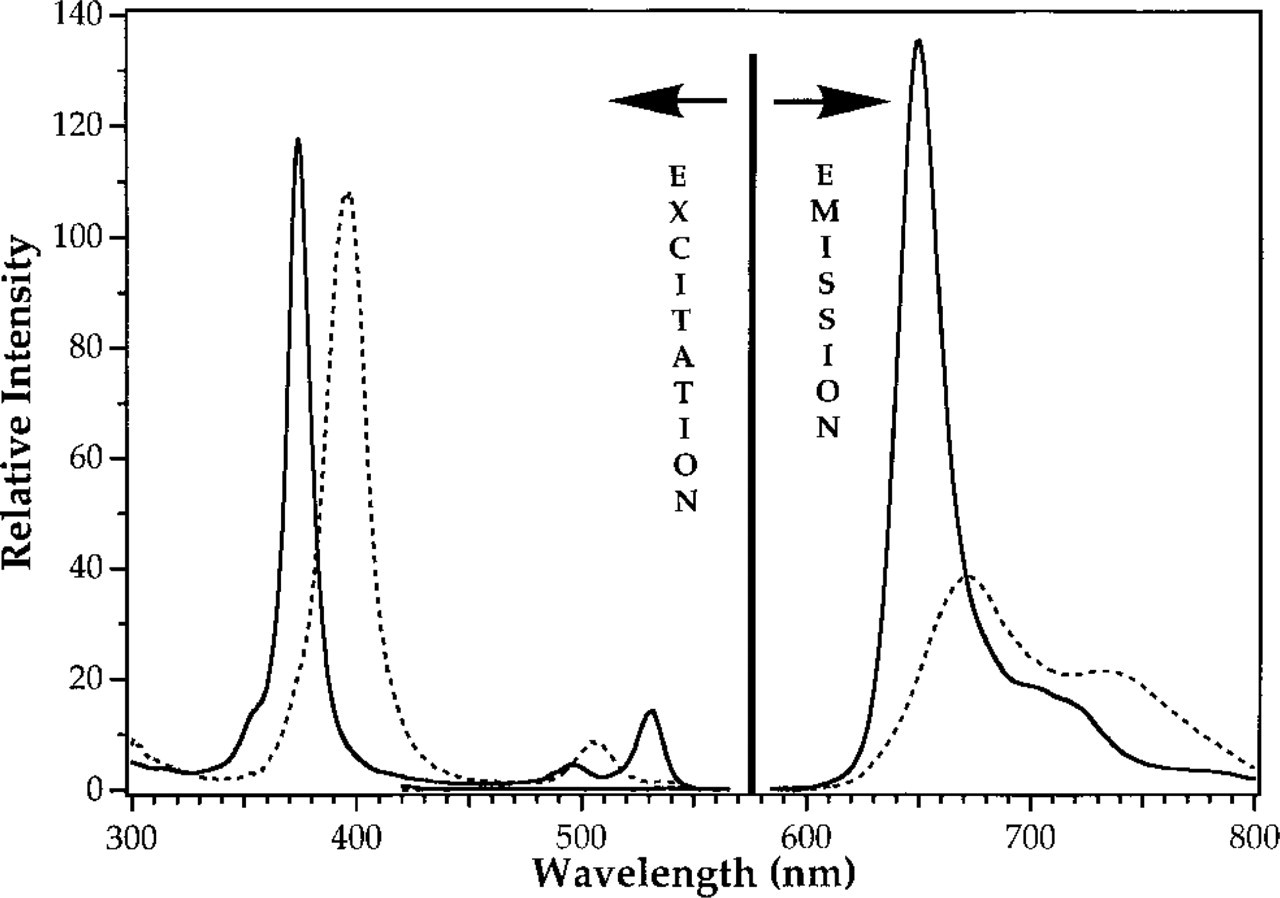
Excitation and emission spectra of PTP (dotted line) and PTCP (solid line) at a concentration of 5 μM in 50 mM PB, pH 8.0.
Preparation of N-hydroxysuccinimide Esters of PTP and PTCP
For coupling of porphyrin to proteins, only the carboxylic groups of the porphyrin side-chain are of consideration because they are the most reactive moieties present in the molecule. Modifications at these sites do not significantly change its luminescence properties.
In Figure 3 the preparation of the porphyrin N-hydroxy-succinimide esters is outlined. 1,3-Dicyclohexylcarbo-diimide (DCC) reacts with a carboxylic group to an intermediate formed Compound 1, which can undergo several routes. The first is an irreversible intramolecular rearrangement to an N-acylurea derivative (Compound 2). The activated intermediate can also react with another intramolecular carboxylic group from a second porphyrin molecule, forming a symmetric anhydride (Compound 3). These two routes only occur when no nucleophile is present. In the presence of the catalysator 1-hydroxybenzotriazole (HOBT), however, the DCC group is replaced by HOBT (HOBT reacts as a nucleophile). The highly reactive intermediate (Compound 4) subsequently reacts with N-hydroxysuccinimide to form the NHS ester (Compound 5) (HOBT is liberated in an unchanged form), whereby N,N'-dicyclohexylurea as a poorly soluble side product is formed. Furthermore, the small amounts of the symmetrical anhydride also react with N-hydroxysuccin-imide to form an NHS ester.
Photophysical properties of PTP and PTCPa
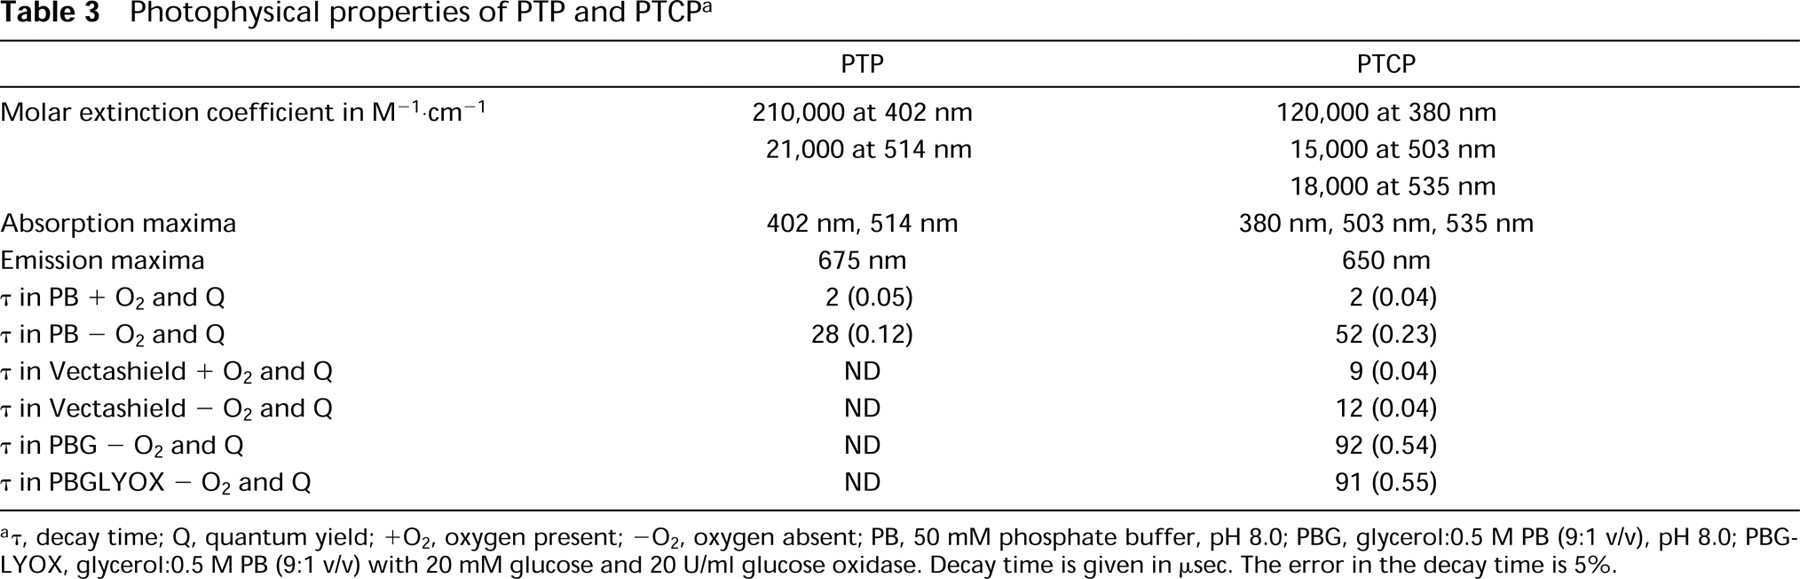
τ, decay time; Q, quantum yield; +O2, oxygen present; -O2, oxygen absent; PB, 50 mM phosphate buffer, pH 8.0; PBG, glycerol:0.5 M PB (9:1 v/v), pH 8.0; PBGLYOX, glycerol:0.5 M PB (9:1 v/v) with 20 mM glucose and 20 U/ml glucose oxidase. Decay time is given in μsec. The error in the decay time is 5%.
By altering the molar ratio of porphyrin/NHS in the DCC/HOBT-mediated reaction, we were able to make the one, di, tri, and tetra NHS ester. The formed tetra NHS ester is not soluble in DMF and is precipitated once formed.
When no HOBT was included in the reaction mixture, no detectable precipitate was formed, although NHS esters can be formed without this catalysator; extending the incubation time did not result in formation of a precipitate. The formation of the N-acylurea Compound 2 in the reaction scheme predominates. Steric hindrance prevents NHS ester formation. In addition, when DCC or N-hydroxisuccinimide was omitted, no activated porphyrin was formed.
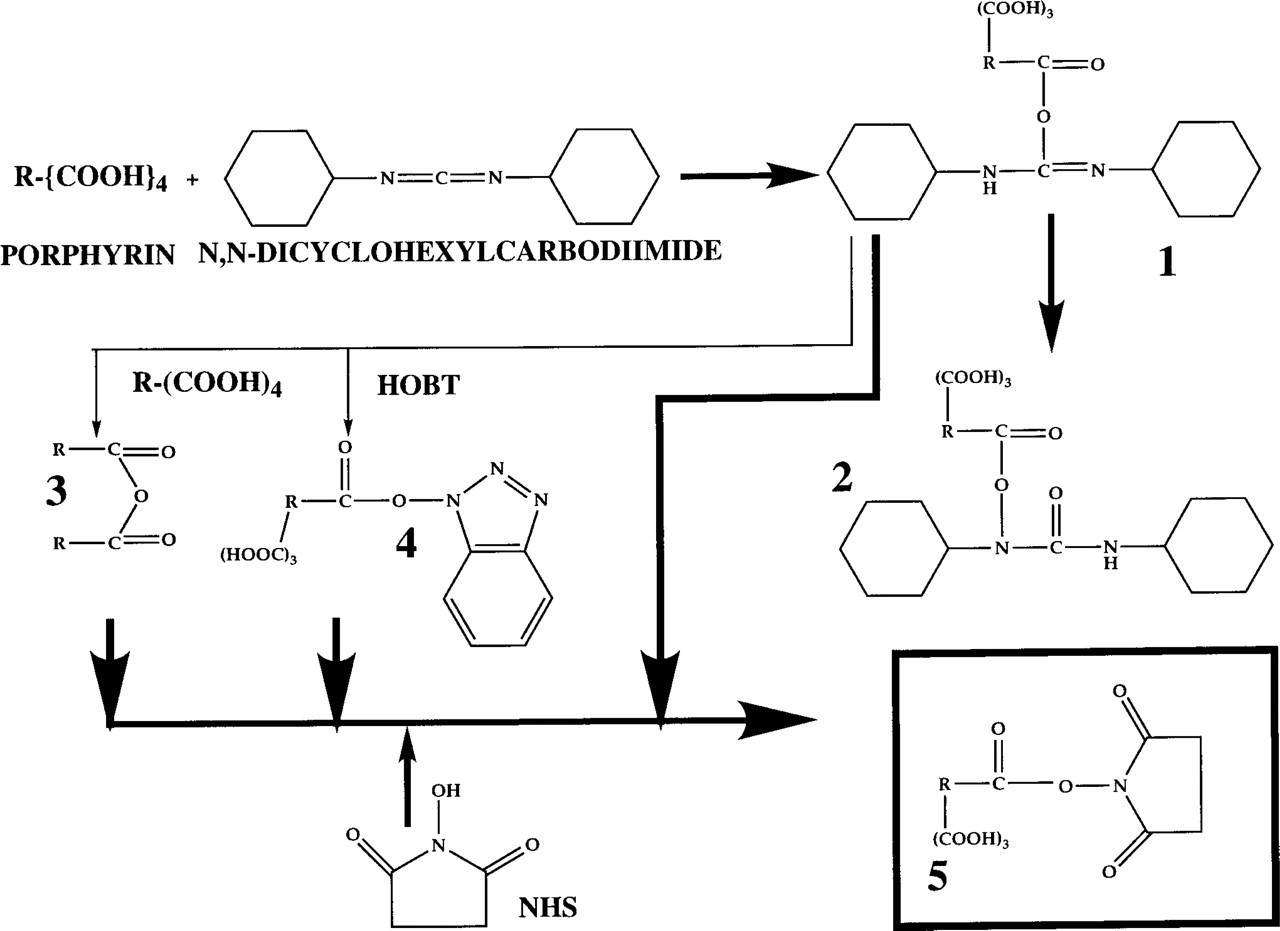
Reaction scheme for the preparation of PTP and PTCP N-hydroxysuccinimide esters (see text for details).
Experiments showed that neither the presence of unreacted DCC, NHS, HOBT nor the side product influenced the labeling of (strept-)avidin or antibodies. These components were subsequently removed during the purification of the labeled protein. The NHS esters were stable for at least 1 year at −20C.
Labeling of Avidin-d , Streptavidin, Neutravidin, and Antibodies with PTP-NHS and PTCP-NHS Ester
Table 1 shows the results of the labeling of avidin-
At a protein concentration of 3.6 mg/ml with a 10.4-fold excess of PTP-1-NHS ester, an F/P ratio of 1.5 was obtained with a yield of 18%. Decreasing the avidin concentration to 1.1 mg/ml increased the yield to 48%, but the F/P ratio dropped to 0.6. The retention of biological activity was less than 10%. To obtain higher F/P ratios and to increase the yield, the PTP-2-NHS and PTP-3-NHS esters (the actual PTP concentration remains the same in the sample) were used at an avidin concentration of 2 mg/ml (see Table 1). No higher F/P ratios were obtained in combination with a high yield of the conjugate.
Subsequently, the PTCP-NHS esters were evaluated for labeling of avidin-
Table 1 shows the results of the streptavidin labeling with PTP-2-NHS and PTCP-2-NHS ester under conditions as described above. During the labeling reaction with PCTP-2-NHS ester, no precipitation occurred. Compared with avidin-
The labeling conditions of the antibodies were optimized (see Table 2). Almost 100% recovery of the antibodies was obtained when an antibody concentration of 2 mg/ml was used for labeling. Labeling at this protein concentration showed no precipitation during the reaction if PTCP-2-NHS ester was employed. The goat anti-mouse showed precipitation at elevated antibody concentrations if a PTP-3-NHS ester was used. Furthermore, when antibodies were labeled with PTP the retained biological activity dropped with increasing F/P ratio, unlike the PTCP-labeled antibodies, which retained at least 90% of their biological activity (see Table 2 and Figure 4). Antibody conjugates with various F/P ratios can be obtained by altering the porphyrin/antibody ratio.
Control labeling of proteins with unmodified porphyrins at a tenfold excess and the proteins of interest resulted in an F/P ratio of 0.3 and 0.1 for PTP and PTCP, respectively, which dropped after concentration and gel filtration to 0.05 for PTP and PTCP, respectively. For streptavidin and antibodies, this value was less than 0.05 with PTCP.
Retention of Biological Activity
The results of the ELISA tests used to measure the biological activity of the conjugates are shown in Figure 5. Reduced biological activity results in a shift of the S-shaped curve to the right. The biological activity of the goat anti-mouse PTCP is well retained but labeling with PTP results in a reduction of biological activity of approximately 90% for an F/P of 7.1. The observations for PTCP- and PTP-labeled (strept-)avidin were similar.
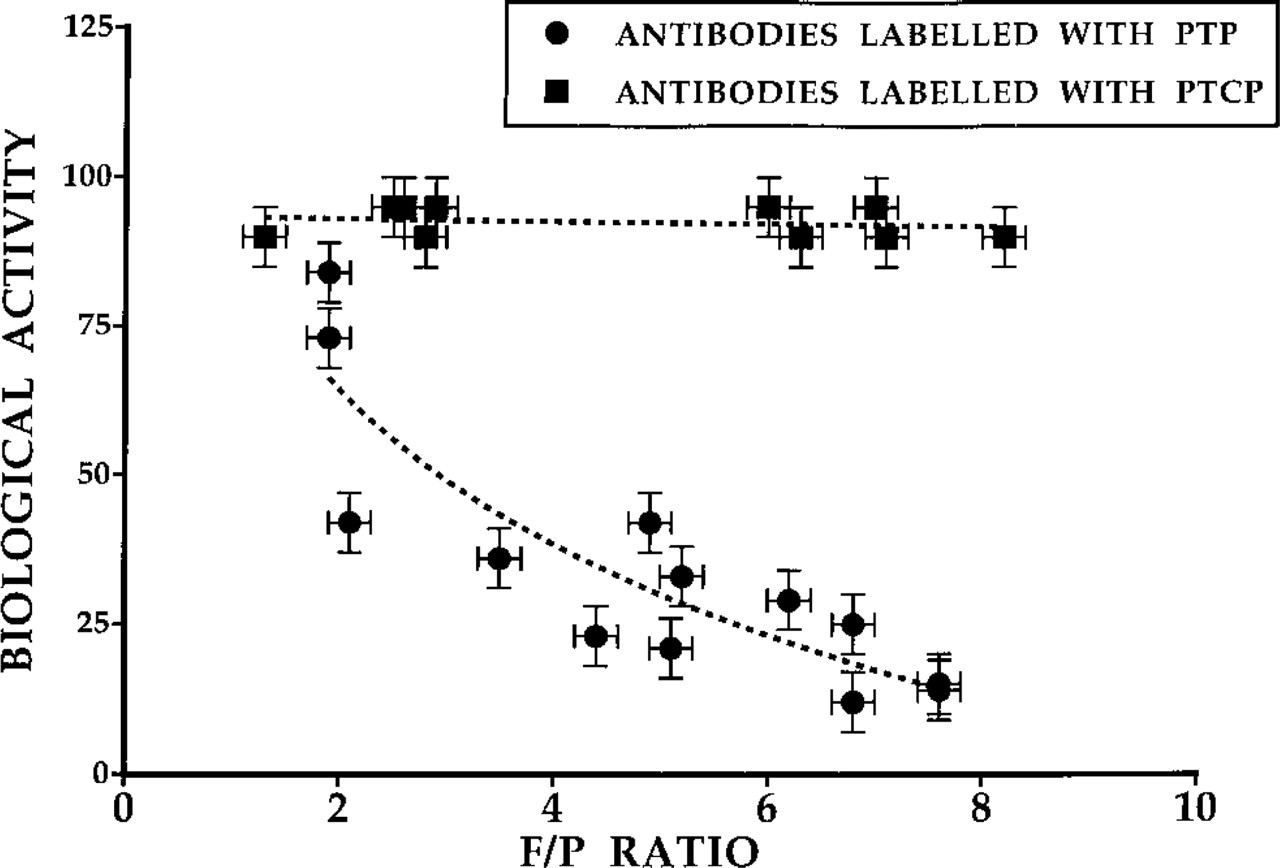
Biological activity of antibodies labeled with PTP or PTCP as a function of the F/P ratio.
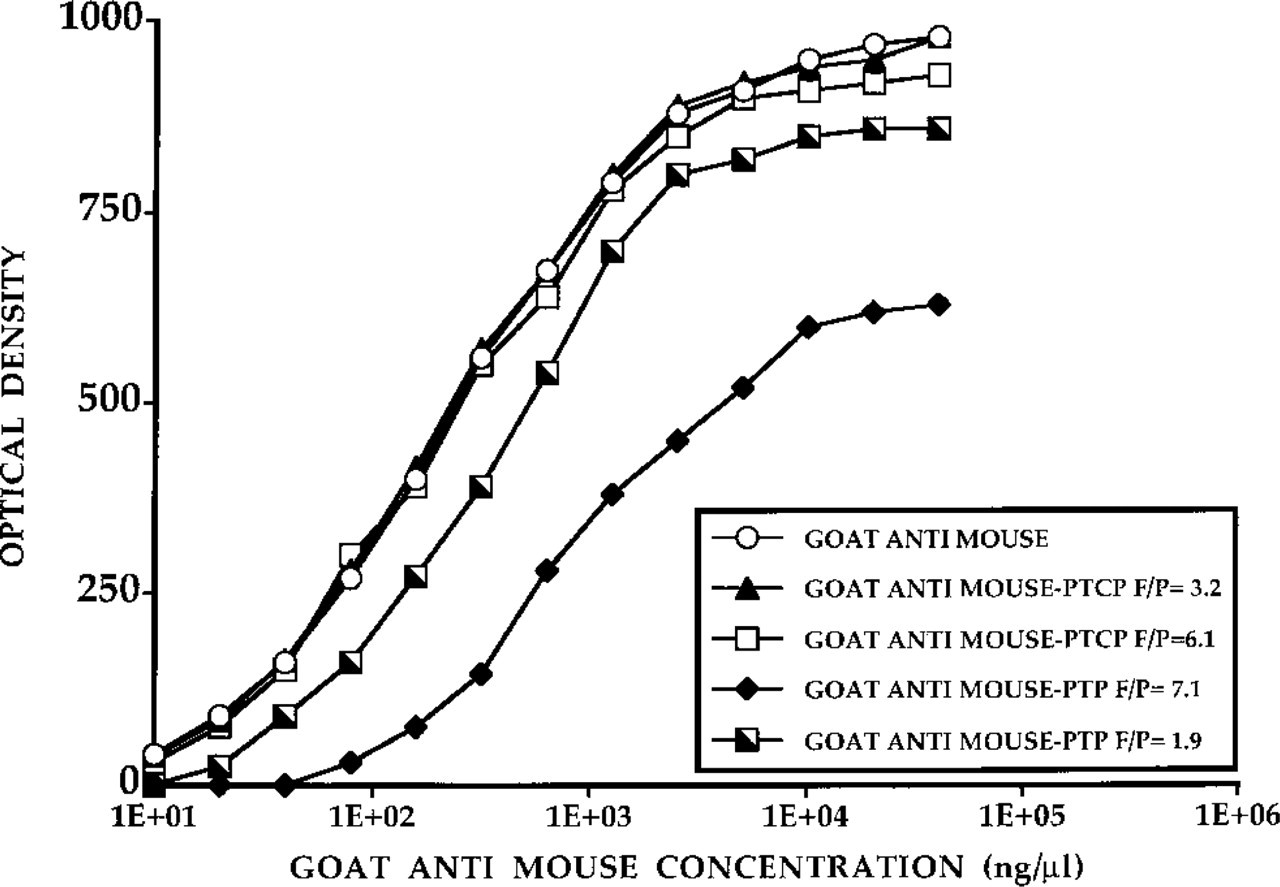
Biological activity of goat anti-mouse antibodies labeled with PTP and PTCP NHS ester, as measured by ELISA.
Photophysical Properties of Streptavidin and Antibody Conjugates
The results of the photophysical studies of the porphyrin conjugates are summarized in Table 4.
The quantum yield of PTCP-labeled conjugates declines with higher F/P ratios, independent of the presence of oxygen. The average luminescence quantum yield per molecule of porphyrin decreased by a factor of 4 when the F/P ratio was increased from 1.4 to 5.6. This may be due to PTCP–PTCP interaction (triplet–triplet interaction), leading to quenching. It was found that conjugation of approximately 1 PTCP per strepta-vidin leads to an increase in quantum yield of PTCP compared to the free dye. When PTCP was coupled to antibodies, such an increase was not observed. An increase in the F/P ratio of labeled antibodies also showed a drop in the average quantum yield per PTCP molecule, although the effect was not as strong as for streptavidin–PTCP. Although the actual quantum yield per PTCP decreased, the relative amount of light increased when more PTCP labels were attached to streptavidin or goat anti-DNP. Figure 6 shows the maximal amount of light achievable for the streptavidin–PTCP and goat anti-DNP series. The lifetimes of the bound PTCP porphyrins are given in Table 4.
Results of FISH and Immunocytochemical Detection of Membrane Antigens
Bleaching Properties of the Streptavidin–PTCP Conjugate Under In Situ Conditions. The photostability of the streptavidin–PTCP conjugate was evaluated on metaphase chromosomes stained by FISH. A typical example is shown in Figure 7. Figure 8 shows the bleaching curves for the various embedding media that were tested with the bleaching decay times for PTCP. The bleaching decay times were calculated from the bleaching curves on the assumption that the bleaching curve follows a monoexponential decay.
The data indicate that the presence of oxygen has a strong effect on the bleaching rate of PTCP. PTCP is less bleached when Vectashield is used as the embedding medium, and moderate bleaching occurs in oxygen-depleted glycerol medium.
Initial Signal Intensity. The results of the intensity measured for chromosome 1 centromeres are shown in Figure 9. Among the various embedding media, Vectashield and glycerol:0.5 M PB (9:1 v/v) with glucose and glucose oxidase gave the brightest signals. Initially, the high intensity in Vectashield appears unexpected. From spectroscopic measurements of strept-avidin–PTCP in Vectashield decay of 9 μsec and a Q of 0.04 (see above), one would expect a low intensity.
Photophysical properties of streptavidin and antibodies labeled with PTCPa
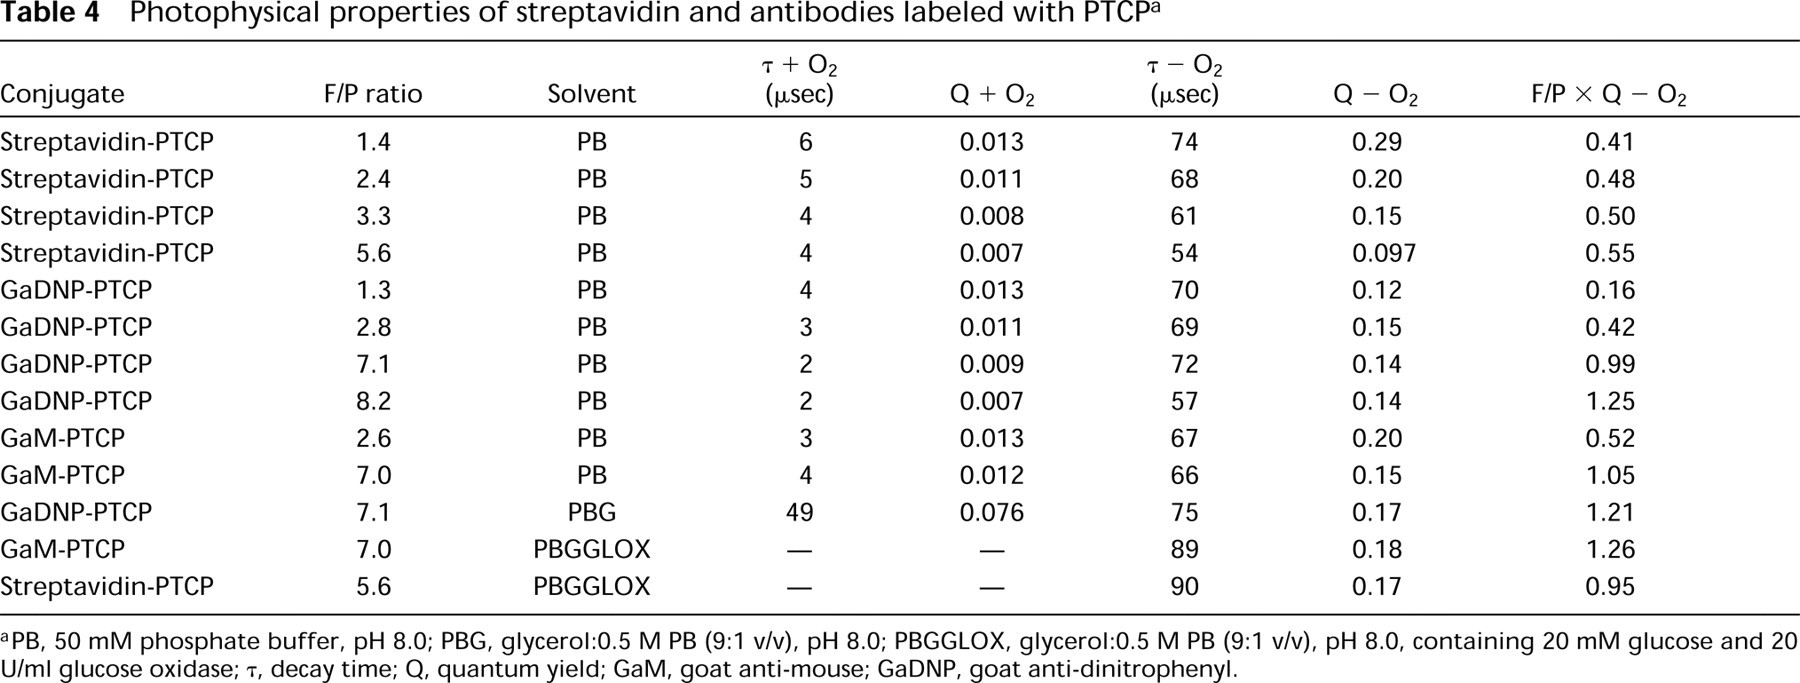
PB, 50 mM phosphate buffer, pH 8.0; PBG, glycerol:0.5 M PB (9:1 v/v), pH 8.0; PBGGLOX, glycerol:0.5 M PB (9:1 v/v), pH 8.0, containing 20 mM glucose and 20 U/ml glucose oxidase; τ, decay time; Q, quantum yield; GaM, goat anti-mouse; GaDNP, goat anti-dinitrophenyl.
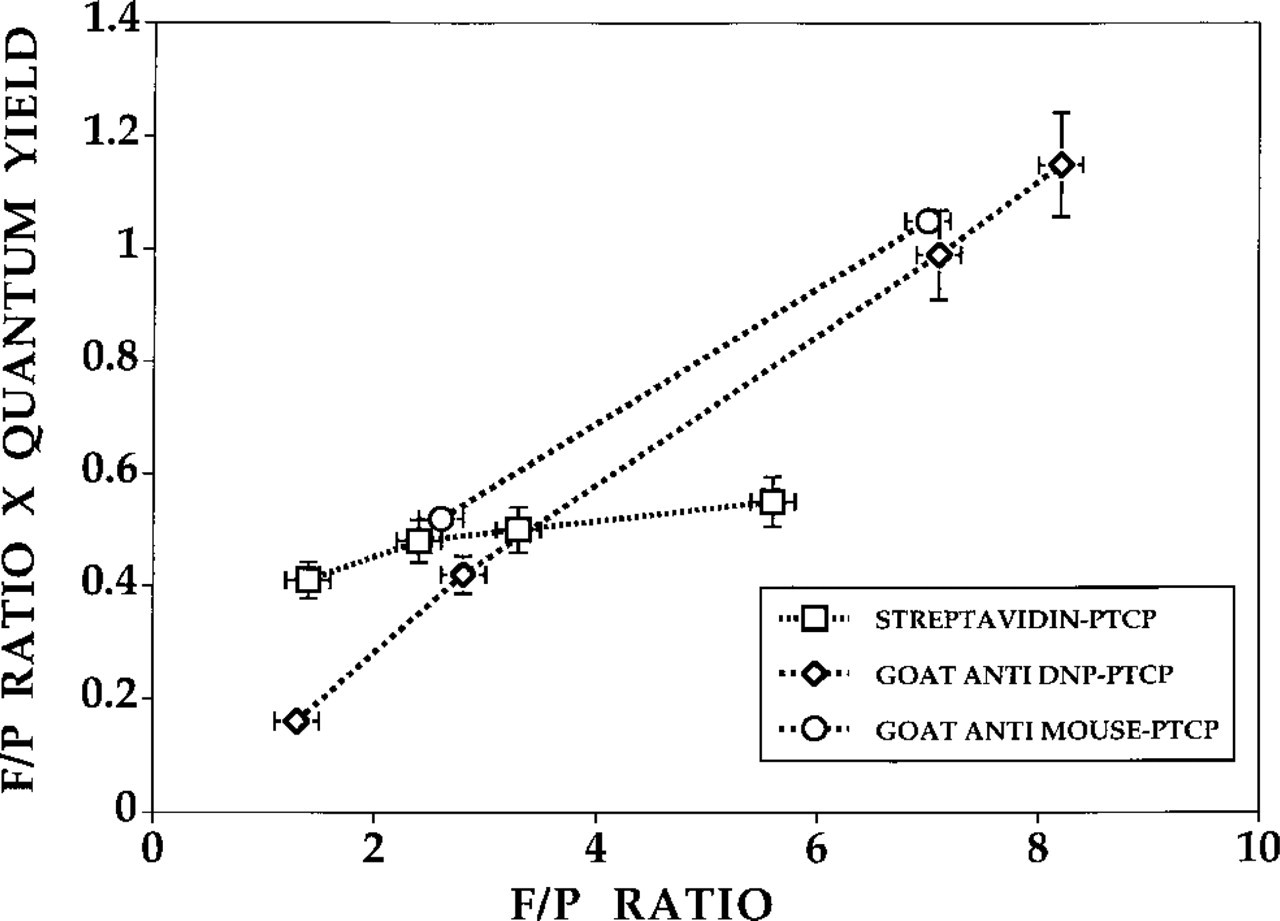
Relationship between the F/P ratio and maximal achievable luminescence intensity (F/P ratio × quantum yield) for streptavidin, goat anti-DNP, and goat anti-mouse antibodies labeled with PTCP [in 50 mM PB buffer, pH 8.0 (oxygen depleted by argon gas)]. AU, arbitrary units. Error bars indicate SEM.
Evaluation of Porphyrin-labeled Antibodies/Avidin for In Situ Hybridization. Figure 10 shows the results of the luminescence intensity of the centromeric spots stained with the various streptavidin, avidin-
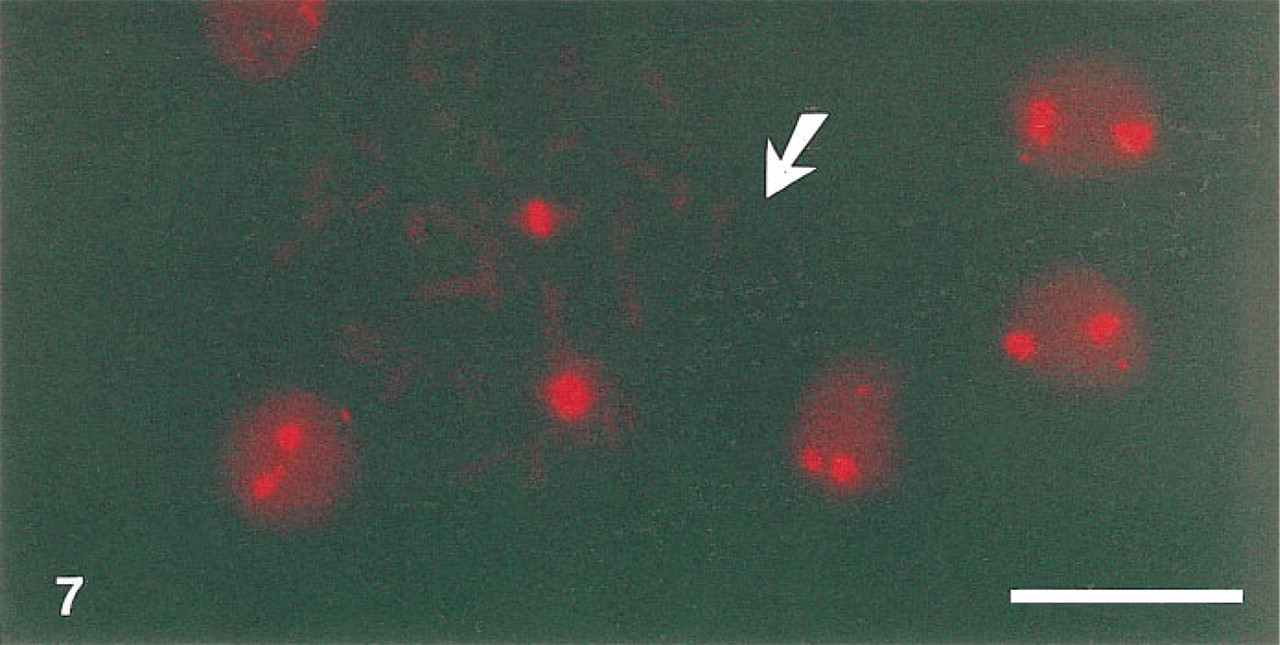
Staining of the centromere of chromosome 1 by a digoxigenin-labeled plasmid probe, biotinylated mouse anti-digoxigenin, and streptavidin–PTCP (F/P 5.6). The specimen was embedded in glycerol:PB (9:1 v/v) with 20 mM glucose and 20 U/ml glucose oxidase. Arrow indicates a metaphase cell. Bar = 10 μm.
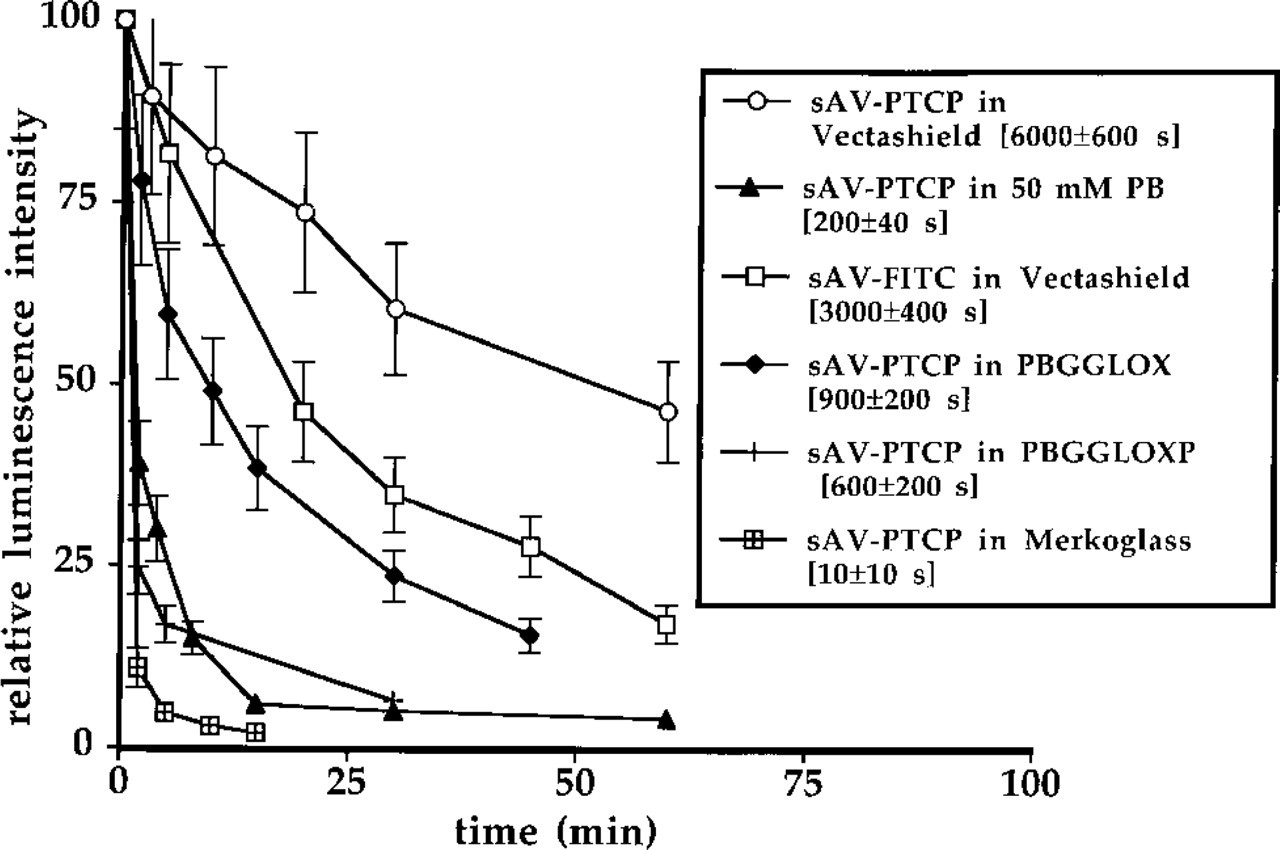
Bleaching of streptavidin–PTCP. The stained region of the centromere of chromosome 1 was used for measurements. The relative error in the intensity is 10–20%; the 95% confidence interval for the bleaching decay time is given in the figure. sAV, streptavidin; PB, 50 mM phosphate buffer, pH 8.0, PBGGLOX, glycerol:0.5 M PB (9:1 v/v), pH 8.0, containing 20 mM glucose and 20 U/ml glucose oxidase, PBGGLOXP, glycerol:0.5 M PB (9:1 v/v), pH 8.0, containing 20 mM glucose, 20 U/ml glucose oxidase, and 20 mM paraphenylenediamine.
Time-resolved Detection of the 28S rRNA Sequence in HeLa Cells and CD4 Staining
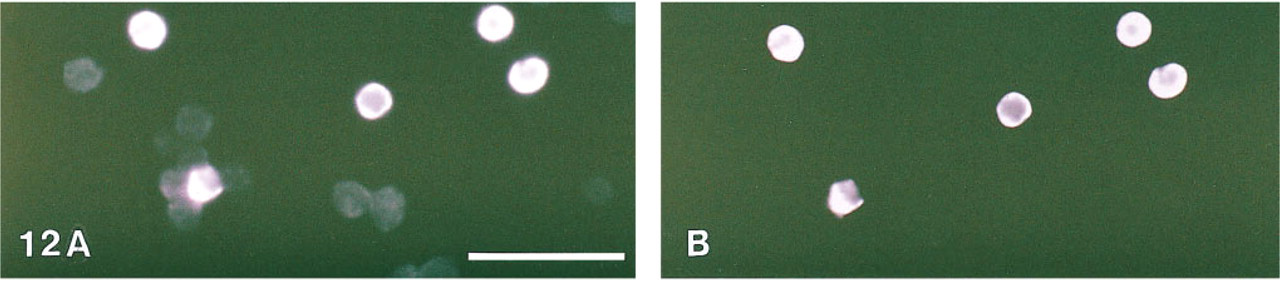
Detection of 28S rRNA using streptavidin labeled with PTCP was found feasible (Figure 11). As shown in Figure 12, the delayed red porphyrin signal can be selectively detected against the prompt red propidium fluorescence when the time-resolved laser microscope was used in the delayed mode. Control experiments using the CDCH probe as negative control did not show RNA staining, nor did cells previously treated with RNAse.
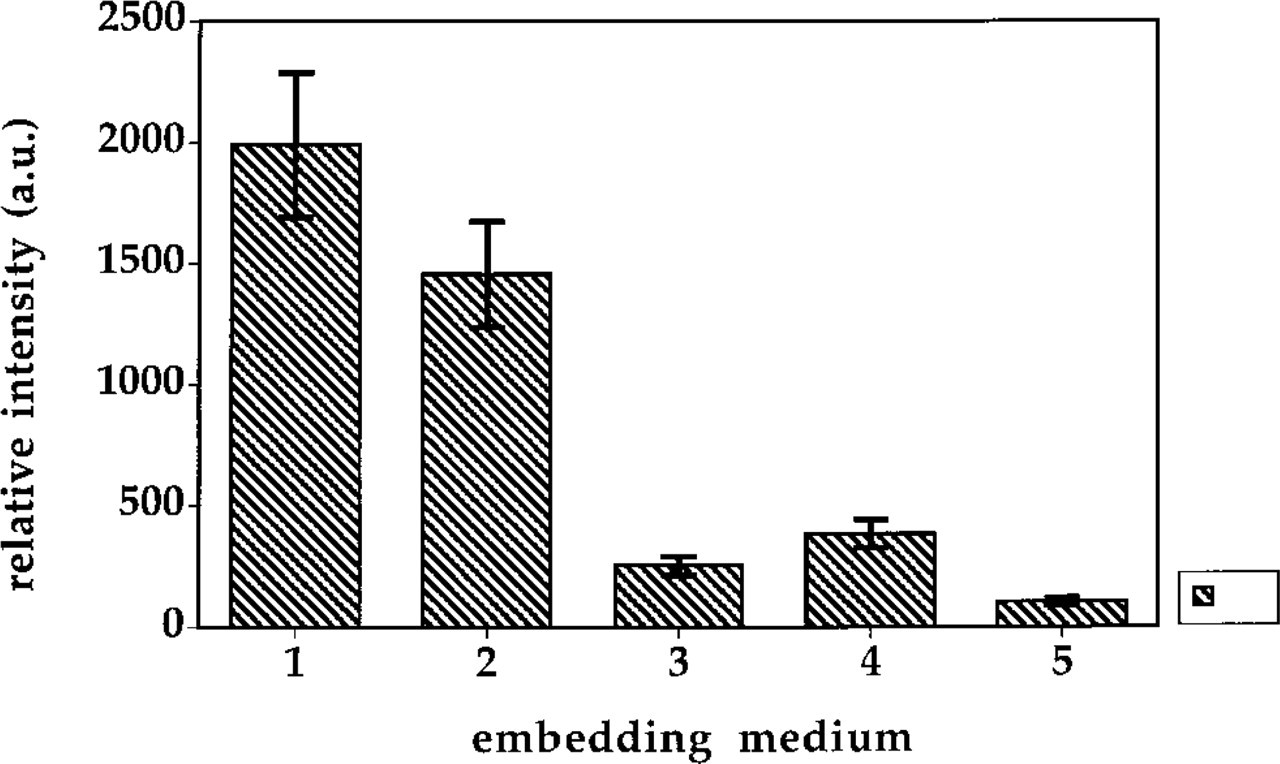
Initial signal intensity of FISH stained centromeric regions for various embedding media. 1, Vectashield; 2, glycerol:0.5 M PB (9:1 v/v), pH 8.0, with 20 mM glucose and 20 U/ml glucose oxidase; 3, Merkoglass; 4, 50 mM phosphate buffer, pH 8.0, with 20 mM glucose and 20 U/ml glucose oxidase; 5, glycerol:0.5 M PB (9:1 v/v), pH 8.0, with 20 mM DABCO. au, arbitrary units. Error bars indicate SEM.
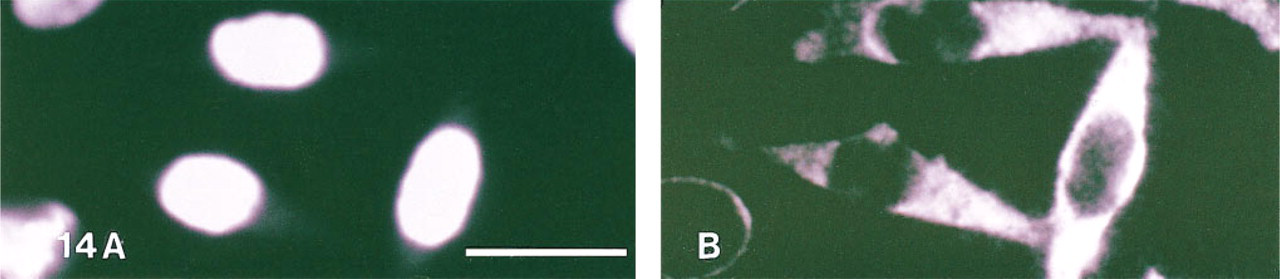
The results of the CD4 membrane staining are shown in Figures 13 and 14. Bright phosphorescence was detected when the cells were observed in a conventional fluorescence microscope (Figure 13B). Using the time-resolved laser microscope, the autofluorescence of the negative cells was effectively suppressed in the delayed mode (Figure 14B). During the tyramide amplification, a tyramide radical is formed. This radical partly diffuses away from the site of generation, resulting in an intracellular type of staining.
Discussion
Two metalloporphyrins (PTP and PTCP) were selected on the basis of their photophysical properties, their solubility under aqueous alkaline conditions (pH >7.5), and the presence of a functional group for coupling to proteins.
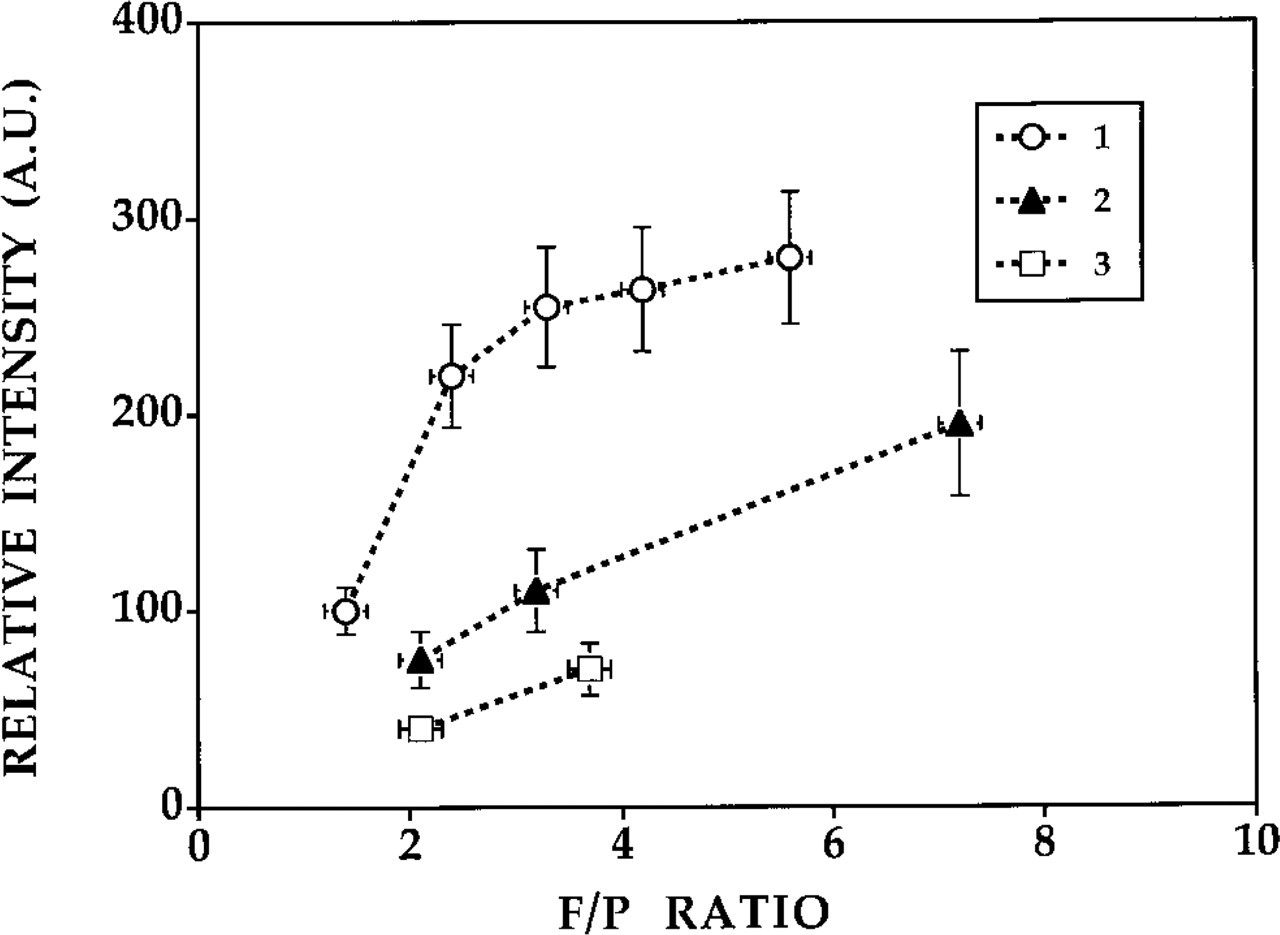
Relative phosphorescence intensities of centromeric region stained by FISH using biotinylated probes and PTCP-labeled (strept-)avidin conjugates as a function of F/P ratio. 1, streptavidin–PTCP conjugates; 2, avidin–PTCP conjugates; 3, neutravidin–PTCP conjugates. AU, arbitrary units. Error bars indicate SEM.
Several conjugation procedures have been described in which the carboxylic moieties of the porphyrin were used to couple the porphyrin molecule to the antibody (Roberts et al. 1987; Bedel–Cloutour et al. 1991; Martsev et al. 1995). Many of them are based on the use of water-soluble EDC (1-(3-dimethylami-nopropyl)-3-ethylcarbodiimide hydrochloride) in the presence or absence of N-hydroxysuccinimide (Sehgal and Vijay 1994; Gilles et al. 1990). The methods generally used suffer from poor yields or reduced biological activity of the labeled antibody. In addition, formation of protein aggregates and nonspecific adsorption of the porphyrin are observed. These problems can be attributed to the poor solubility of the porphyrins at pH 5.0 (the coupling pH), strong hydrophobic interaction of the porphyrins with the antibody, and a high porphyrin/protein ratio.
The method presented here circumvents these problems. The porphyrins are activated in DMF in the presence of DCC, NHS, and 1-hydroxybenzotriazole as catalyst, resulting in an in situ-formed porphyrin-N-hydroxysuccinimide ester, which could be used directly even without further purification. Porphyrin-NHS esters react in phosphate buffer at pH 8.5 with ∊-lysine residues of (strept-)avidin and antibodies. PTCP-NHS esters were found better suited for labeling than PTP-NHS esters and resulted in a good yield of greater than 90% and no significant loss of biological activity. After labeling, only monomers of streptavidin and antibodies were obtained (data not shown). By varying the PTCP/(strept-)avidin ratio, (strept-)avidin–PTCP conjugates with various F/P ratios can be obtained. PTP may be less suitable for labeling because it is more strongly hydrophobic than PTCP, which causes streptavidin and antibodies to denature and lose their biological activity.
Interestingly, the favorable properties of the free dyes remained almost unchanged when conjugation was performed. An increase in the F/P ratio usually leads to an improved luminescence yield of the conjugates, which reaches a plateau at an F/P of 5.6 or 8.0 for streptavidin or antibodies, respectively. The difference may be explained by the larger size of the antibody.
From the measurements of the luminescence yield and the degree of fading in various embedding media, we conclude that the conjugates luminescence strongly and are relatively photostable, especially when depletion of oxygen is performed or when Vectashield is used as embedding medium.
The excitation of the specimens stained by FISH or immunocytochemical methods was suboptimal, in the sense that either the 366-nm line from the mercury lamp or the 514-nm laser line does not match well with the narrow absorption peak of PTCP at 380 nm. Nevertheless, a higher detection sensitivity was obtained compared with the previously used streptavidin europium chelate (de Haas et al. 1996). In that study, the biotin–tyramide amplification system was required to obtain visible staining of the centromeric region of chromosome 1 or of 28S RNA. In the present study, comparable results were obtained without such an amplification system.
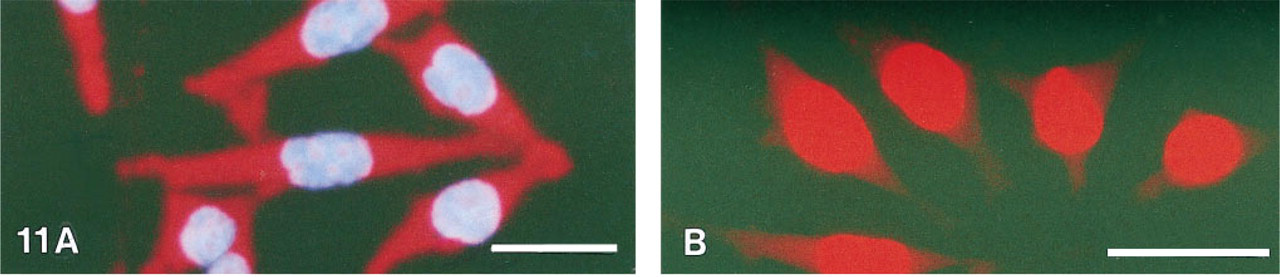
Staining of 28S rRNA sequence in HeLa cells with streptavidin–PTCP (F/P 5.6) embedded in Vectashield. (
CD4 membrane staining of human lymphocytes. (
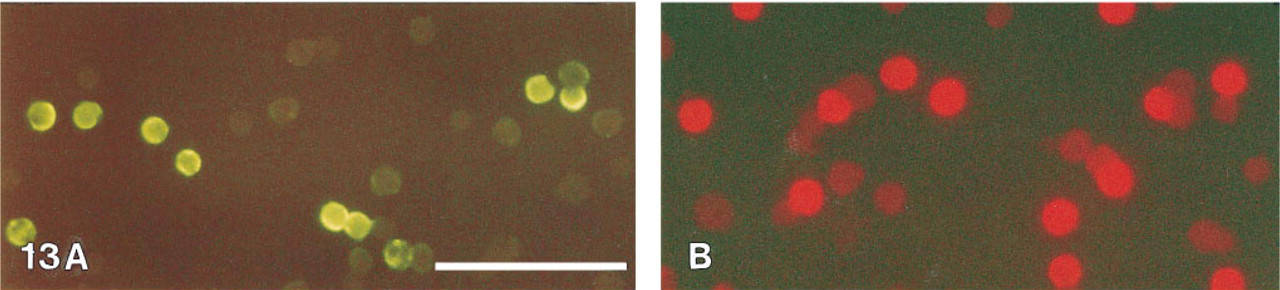
CD4 membrane staining of human lymphocytes. (
Staining of 28S rRNA sequence in HeLa cells with streptavidin–PTCP (F/P 5.6) embedded in Vectashield. (
The fact that streptavidin- and antibody-labeled PTCP can be embedded in Vectashield allows combination with other conventional fluorphores, unlike the streptavidin Eu chelate, which requires embedding in Merkoglass for good luminescence yield and is therefore not suitable for conventional fluorphores (low quantum yield in Merkoglass).
As expected, the photophysical properties of the coproporpyrin conjugates made it possible to successfully detect membrane antigens or nucleic acid sequences using standard FISH methods. Time-resolved fluorescence microscopy of delayed luminescing dyes is particularly useful in situations where the native fluorescence of the material is high, as in paraffin-embedded histological sections of lung, liver, or gut, or in cells containing chlorophyll (e.g., protoplasts). It should be noted that for sensitive detection of phosphorescence, prolonged integration is often necessary because the number of photons that are produced per time unit is orders of magnitude less than in the case of prompt fluorescence dyes with decay times in the nanosecond range. In that context, the relatively slow fading of the coproporpyrins is important.
It can be stated that the porphyrin conjugates described here approach the theoretically possible phosphorescence yield for a given decay time. A quantum yield of approximately 40% at room temperature, in combination with a molar absorption coefficient of around 200,000 M-1cm-1 for visible light, is in practice the maximum achievable. Higher quantum yields are unlikely, and higher absorption is only achievable with larger size molecules, which is unfavorable for immunocytochemical applications.
In addition to applications in immunocytochemistry, coproporpyrin-labeled antibodies, prepared as described here, may be used to study oxygen concentrations at specific cellular sites to be determined by the antibody used. Measuring phosphorescence intensity and lifetime allows quantification of oxygen concentrations (Rumsey et al. 1988; Vanderkooi et al. 1990). In the case of imaging of cells, this can be accomplished on a pixel-by-pixel basis by applying phase-modulation methods. Such applications could be used to study the effect of hypoxia in tissue or the intracellular oxygen concentration related to mitochondrial activity (Vanderkooi et al. 1990).
Footnotes
Acknowledgements
Supported by Technology Foundation grant LGN 22.2734 and in part by Boehringer Mannheim.
Mr J. van Ramesdonk (Department of Organic Chemistry, University of Amsterdam) is gratefully acknowledged for technical assistance with the spectroscopical analysis and Prof Dr J.W. Verhoeven (Department of Organic Chemistry, University of Amsterdam) for useful discussions and critical reading of the manuscript.