
Abstract
The basal layer of the epidermis contains two types of proliferating keratinocyte: stem cells, with high proliferative potential, and transit amplifying cells, which are destined to undergo terminal differentiation after a few rounds of division. It has been shown previously that two- to three-fold differences in the average staining intensity of fluorescein-conjugated antibodies to β1 integrin subunits reflect profound differences in the proliferative potential of keratinocytes, with integrin-bright populations being enriched for stem cells. In the search for additional stem cell markers, we have stained sections of normal human epidermis with antibodies to proteins involved in intercellular adhesion and quantitated the fluorescence of individual cell-cell borders. In the basal layer, patches of brightly labeled cells were detected with antibodies to E-cadherin, β-catenin, and γ-catenin, but not with antibodies to P-cadherin, α-catenin, or with pan-desmocollin and pan-desmoglein antibodies. In the body sites examined, palm and foreskin, integrinbright regions were strongly labeled for γ-catenin and weakly labeled for E-cadherin and β-catenin. Our data suggest that there are gradients of both cell-cell and cell-extracellular matrix adhesiveness within the epidermal basal layer and that the levels of E-cadherin and of β-and γ-catenin may provide markers for the stem cell compartment, stem cells expressing relatively higher levels of γ-catenin and lower levels of E-cadherin and β-catenin than other basal keratinocytes.
T
We recently showed that two- to threefold differences in cell surface levels of the α2β1, α3β1, and α5β1 integrins reflect profound differences in the proliferative potential of human epidermal keratinocytes (Jones et al. 1995; Jones and Watt 1993). Variation in integrin levels was inferred from three different types of experiment: quantitative confocal microscopy, FACS of disaggregated keratinocytes, and adhesion to extracellular matrix ligands of the integrins. Cells in the basal layer that have high surface integrin levels include the stem cells, defined by a number of criteria, including high proliferative potential in vitro, ability to self-renew and generate differentiating daughters, ability to reconstitute epidermis when grafted into nude mice, and low probability of being in S-phase in vivo. The integrin-dull population is enriched in transit amplifying cells, i.e., cells that initiate terminal differentiation within 5 rounds of division in vitro and have a relatively high probability of being in S-phase in vivo.
Variation in integrin levels can be detected by con-focal microscopy of epidermis labeled with FITC-conjugated anti-integrin antibodies. Isolation of integrin-bright cells directly from the epidermis confirms that they are enriched in stem cells (Jones et al. 1995). Stem and transit amplifying cells appear to have a non-random distribution. Patches of integrin-bright cells are found at the tips of the rete ridges (i.e., where the epidermis projects farthest into the dermis) in palm and sole epidermis, but at the tips of the dermal papillae (i.e., where the epidermis is shallowest) in other body sites examined (foreskin, breast, abdomen, and interfollicular scalp epidermis) (Jones et al. 1995).
The proportion of integrin-bright basal cells is 25–50%, depending on body site (Jones et al. 1995), yet the best estimate of the percentage of stem cells is closer to 10% (Potten and Morris 1988). There is therefore a need to find additional markers that can be used to enrich further for stem cells. The purpose of the present study was to label sections of human epidermis with antibodies to proteins that are involved in intercellular adhesion, to determine whether the levels of expression of these proteins differ between stem cells and other basal keratinocytes. Proteins mediating intercellular adhesion were chosen for investigation because there is evidence that cell-cell adhesiveness changes during keratinocyte terminal differentiation (Watt 1984) and that cadherins can regulate keratinocyte proliferation, differentiation, and integrin expression (Zhu and Watt 1996; Hodivala and Watt 1994).
Materials and Methods
Immunofluorescence Staining
One specimen of adult human palm skin was obtained postmortem and neonatal foreskins were obtained from routine circumcisions. Skin samples were embedded in OCT compound (Miles; Elkhart, IN), snap-frozen in liquid nitrogen, and stored at — 70C until required. Frozen sections (5μm) were prepared with a cryomicrotome (Reichart-Jung; Leitz, Milton Keynes, UK) and collected on silane-coated slides.
Sections were fixed for 10 min in 3.7% formaldehyde, 0.1% Triton X-100 in PBS containing 1 mM calcium and 1 mM magnesium (PBSABC). Fixed sections were blocked for 1 hr with PBSABC containing 0.2% bovine serum albumin and 0.01% Triton X-100. Each primary antibody was applied to sections and incubated for 1 hr in a moist chamber at room temperature, then washed three times in PBSABC. The relevant secondary antibodies were applied for 30 min and then sections were extensively washed before mounting with Gelvatol (Monsanto; St. Louis, MO). Double labeling was performed exclusively with primary antibodies from different species and involved sequential addition of first primary antibody, first secondary antibody, second primary antibody, and second secondary antibody.
The following primary antibodies were used. Mouse monoclonals HECD-1 to E-cadherin and NCC-CAD-299 to P-cadherin were kindly provided by M. Takeichi and S. Hirohashi (Shimoyama et al. 1989). The anti-integrin antibodies used were P5D2 (to the β1 integrin subunit; Dittel et al. 1993) and VM-2 (to α3β1; Kaufmann et al. 1989). For some experiments, VM-2 was conjugated to fluorescein (FITC), as described previously (Jones and Watt 1993). Rabbit antibodies to α-catenin, β-catenin, and γ-catenin (VB1, VB2, and VB3, respectively) were described by Braga et al. (1995). The following antibodies to desmosomal cadherins were kindly provided by A.I. Magee (National Institute for Medical Research, London): rabbit antiserum 919, raised against a fusion protein containing the cytoplasmic domain of desmoglein 1, which crossreacts with all desmogleins (Wheeler et al. 1991); rabbit antiserum 1027, an anti-peptide antibody specific for desmoglein 2 (A.I. Magee, unpublished); rabbit antiserum 144, raised against a fusion protein containing the extracellular domain of desmocollin 2, which recognizes all desmocollins (King et al. 1993); and monoclonal antibody CE1, raised against gel-purified bovine muzzle desmocollins, which recognizes all human desmocollins (King et al. 1991). Goat anti-mouse IgG-FITC (Jackson Immunoresearch; West Grove, PA), goat anti-rabbit IgG-FITC (Jackson), and donkey anti-rabbit IgG-Texas red (Jackson) were used as secondary antibodies.
Quantitation of Fluorescence
Tissue sections were analyzed with a confocal microscope (MRC 600; BioRad, Richmond, CA) as described previously (Jones et al. 1995). Sections were examined with the x25 objective and an optical section thickness of 1 μm. To avoid artifacts due to the plane of sectioning, only rete ridges and dermal papillae in which all the intercellular borders of all basal keratinocytes could be seen were included. Fluorescence was quantitated from the confocal images by measuring pixel intensity (from gray levels) along a line drawn through the lateral cell-cell borders. Measurements were standardized by assigning an unstained field zero pixel intensity (relative value = 0) and assigning the maximal fluorescence of a cell-cell border within the basal layer in any given section a relative value of 255 units. Three randomly selected fields of four different sections were analyzed per sample, each field containing two or three rete ridges. The results presented in Table 1 correspond to the average pixel intensity of the eight to 15 cell-cell borders at the tip of each dermal papilla or rete ridge ± SD. Statistical analysis of significance was carried out using a paired Student's t-test with a one-tailed distribution.
Average fluorescence intensity of cell–cell borders of basal keratinocytes in foreskin epidermis labeled with antibodies to the antigens shown
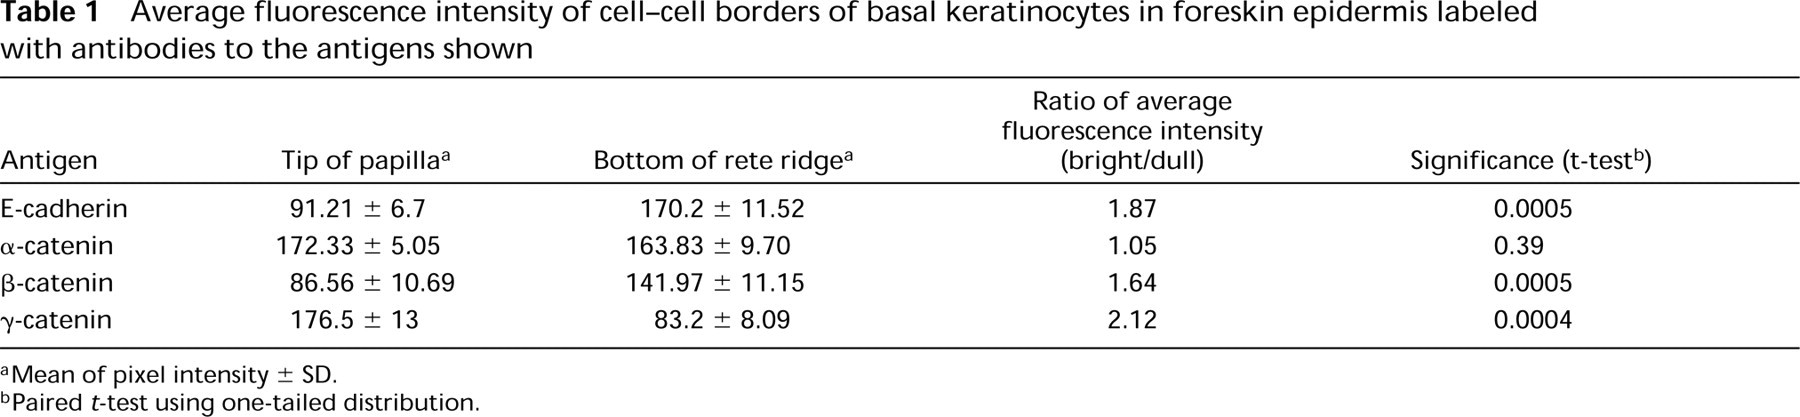
aMean of pixel intensity ± SD.
bPaired t-test using one-tailed distribution.
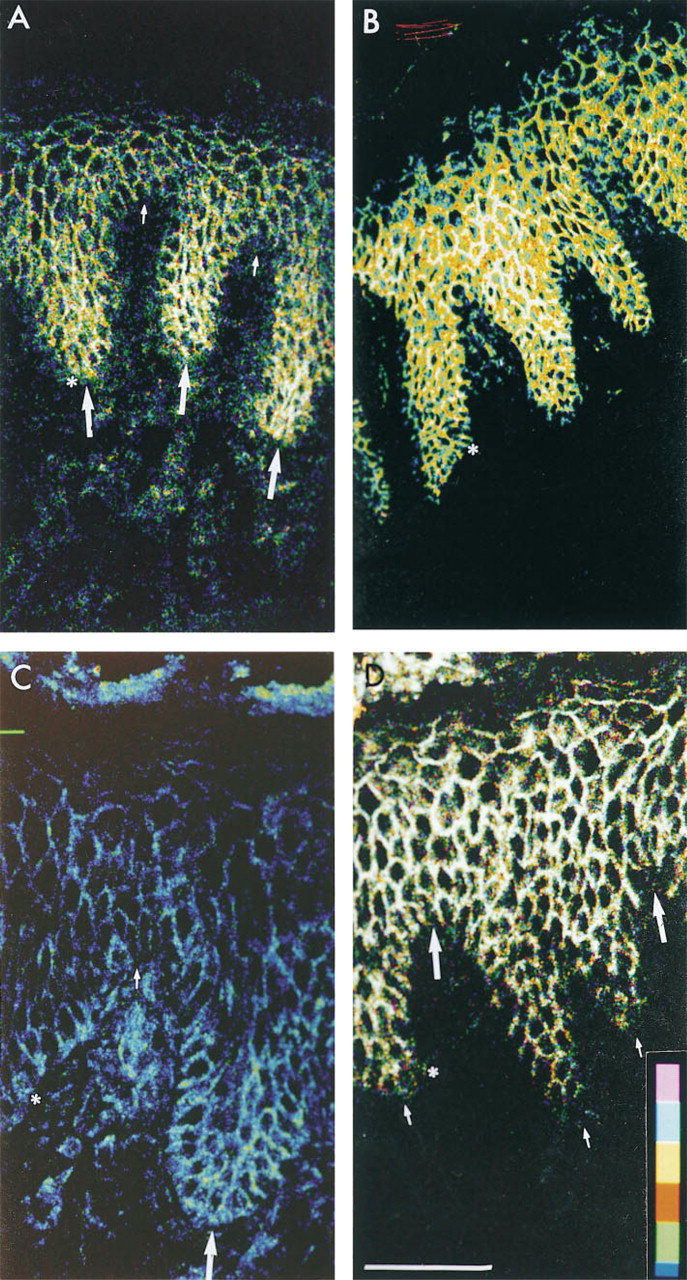
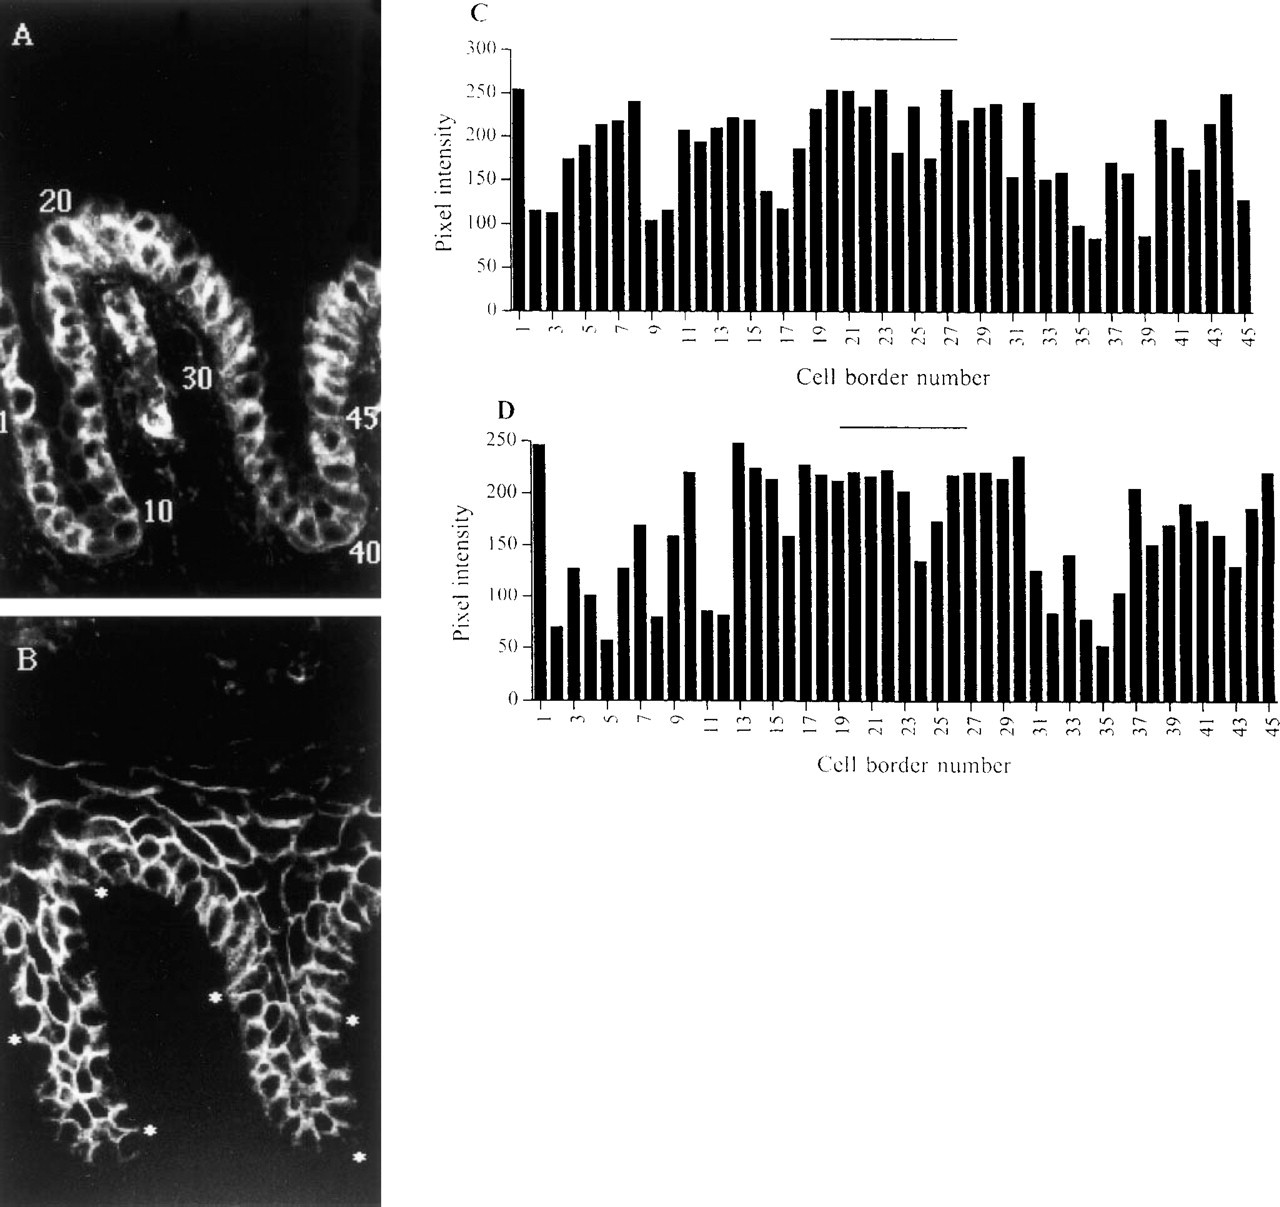
Distribution of E-cadherin and catenins in foreskin epidermis. Sections were stained with antibodies to E-cadherin (
Results
Quantitation of Indirect Immunofluorescence
In our previous studies of integrin levels within the epidermis, we stained sections with anti-integrin antibodies that had been directly conjugated to fluorescein isothiocyanate (FITC), thereby obviating the amplification of signal provided by a secondary antibody (Jones et al. 1995). In screening a large number of antibodies that are in short supply it is not practical to conjugate them all with FITC, and we therefore investigated whether the difference in fluorescence of integrin-bright and -dull regions and the location of those regions were the same when epidermis was stained with an unconjugated primary antibody and an FITC-conjugated secondary antibody. There was no significant difference in the results obtained with an FITC-conjugated antibody to the α3 integrin subunit and the same antibody unconjugated and detected with an FITC-conjugated secondary antibody (p=0.32). On scalp epidermis the ratio of fluorescence in the bright and dull regions of the basal layer was 2.37 ± 0.2 (p<0.0002) by indirect labeling and 2.1 ± 0.1 (p<0.0001) by direct labeling.
Range of Antibodies Tested
Frozen sections of foreskin epidermis were stained with antibodies to proteins that are known to mediate intercellular adhesion of keratinocytes. We examined E-cadherin, which is expressed in all the living layers of the epidermis, P-cadherin, which is confined to the basal layer (Nicholson and Watt 1991, and references cited therein), and α-, β-, and γ-catenin (plakoglobin), cytoplasmic proteins that regulate cadherin function (reviewed by Aberle et al. 1996). In keratinocytes, γ-catenin is associated both with the classical cadherins and with desmosomes (Haftek et al. 1996; Zhu and Watt 1996). We also stained with antibodies to the desmocollins and desmogleins, the glycoprotein components of desmosomal junctions (Koch and Franke 1994; Buxton and Magee 1992). Although most of the antibodies tested stain all the living layers of the epidermis, we made quantitative measurements of fluorescence only within the basal layer because integrin expression is almost exclusively found in the basal layer (e.g., Jones et al. 1995).
Foreskin Epidermis
Quantitation of fluorescence at individual intercellular borders of basal keratinocytes is shown in Figures 1 and 2. Figure 1 shows the micrographs that provided the data for Figure 2. In each panel of Figure 1, the cell-cell border marked with an asterisk corresponds to cell-cell border number 1 in the corresponding panel of Figure 2. Subsequent cell-cell borders are numbered from left to right along the basal layer. Note that in these measurements it is the relative rather than the absolute fluorescence values that are important. Absolute values varied according to antibody labeling conditions and the basal cell-cell border with maximal fluorescence in any given section was assigned a pixel intensity of 255 units.
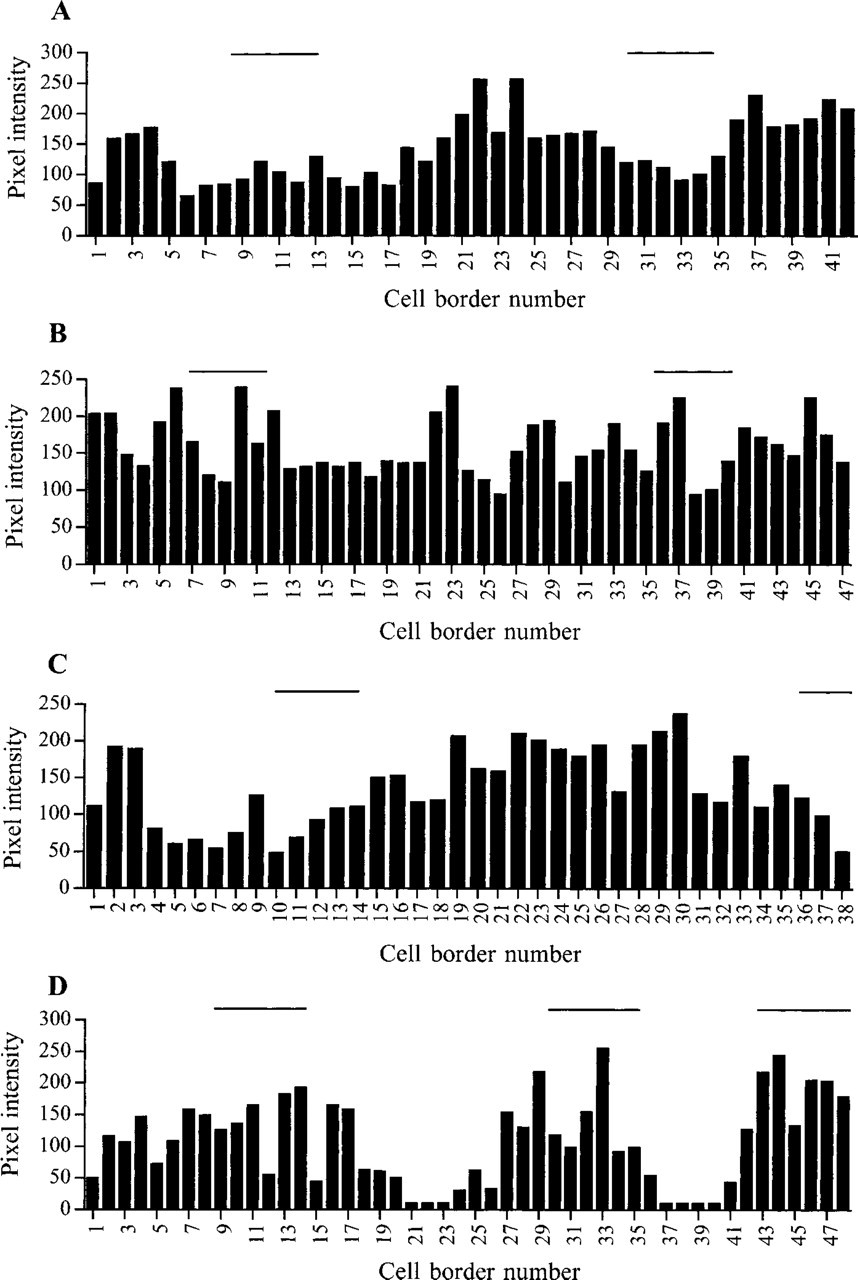
Quantitation of fluorescence staining shown in Figure 1. The fluorescence of individual intercellular borders of basal keratinocytes (pixel intensity, arbitrary units) in
When fluorescence at individual intercellular borders of basal keratinocytes was quantitated, all antibodies tested showed at least a two-fold variation in staining intensity, but in the case of E-cadherin, β-catenin, and γ-catenin the range was greater (4–25 fold; Figure 2, and data not shown). Furthermore, in sections labeled with antibodies to E-cadherin, β-catenin, and γ-catenin, groups of bright cells were found (>8 contiguous bright borders; Figures 1A, 1C, 1D, 2A, 2C, and 2D), whereas other antibodies tended to give strong staining of individual cells or pairs of cells (e.g., Figures 1B and 2B). Cells at the tips of the dermal papillae (horizontal lines in Figure 2) tended to have the highest fluorescence labeling for γ-catenin (Figures 1D and 2D) and the lowest fluorescence labeling for E-cadherin (Figures 1A and 2A) and β-catenin (Figures 1C and 2C).
To examine whether the variation in fluorescence at individual cell-cell borders was statistically significant, the fluorescence intensity of the 8–15 cell-cell borders at the tips of individual dermal papillae or rete ridges was averaged. At least 24 dermal papillae and 24 rete ridges were analyzed per antibody (Table 1). The ratio of fluorescence intensity of cells at the tips of the dermal papillae and rete ridges was significantly different in sections labeled with antibodies to E-cadherin, β-catenin, or γ-catenin, but not in sections labeled with α-catenin antibodies.
Palm Skin
Whereas in foreskin the integrin-bright patches lie at the tips of the dermal papillae, in palm they lie at the tips of the rete ridges (Jones et al. 1995). We therefore examined whether the location of cadherin- and catenin-bright cells differed between foreskin and palm (Figure 3). In palm skin, the E-cadherin (Figures 3A and 3B) and β-catenin (Figures 3C and 3D)-bright patches were at the tips of the dermal papillae, whereas the γ-catenin-bright patches were at the tips of the rete ridges (data not shown). The variation in fluorescence could be visualized more easily when the lowest 50% of pixel intensity was electronically subtracted (Figure 3B cf.3A, Figure 3D cf.3C).
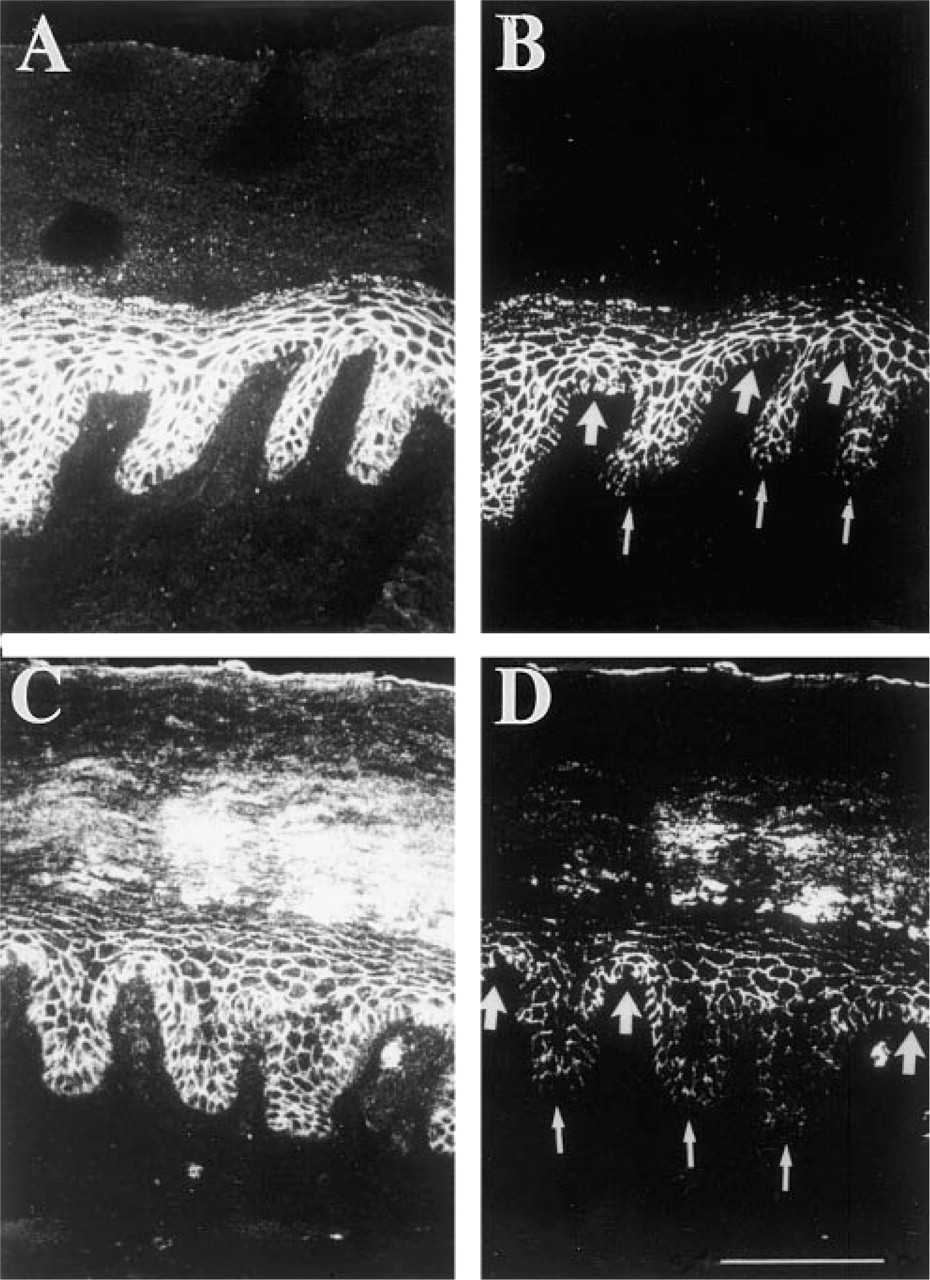
Distribution of E-cadherin (
Double-label immunofluorescence with antibodies to the β1 integrin subunit (
Integrin/Catenin Double-label Immunofluorescence
We also compared the size and position of the patches defined by integrin staining with those of the patches defined by catenin labeling. Because the number of cells per rete ridge varies, we did not compare the average number of bright cells per patch but investigated the variation of fluorescence intensity of all the basal cells in a single rete ridge by double-label immunofluorescence. Double labeling was performed on nine sections, using either β1 integrin and β-catenin antibodies or β1 integrin and γ-catenin antibodies. In the example of epidermis shown in Figure 4, the cluster of integrin-bright cells at the tip of the dermal papilla extends from cell border 19 to 32, whereas the γ-catenin-bright patch is between borders 13 and 30. From these observations we conclude that there is approximate coincidence of the patches defined with integrin and catenin antibodies.
Discussion
In a search for further markers of epidermal stem and transit amplifying cells, we stained sections of foreskin epidermis with antibodies to a range of cell adhesion molecules. The overall staining patterns were as reported previously. E-cadherin was found in all the living cell layers, whereas P-cadherin was confined to the basal layer (Nicholson et al. 1991; Shimoyama et al. 1989; Nose and Takeichi 1986). Pan-desmocollin and pan-desmoglein antibodies stained all the living layers of the epidermis (Koch and Franke 1994; Arnemann et al. 1993; King et al. 1993). Antibodies to α-, β-, and γ-catenin stained all the living cell layers, consistent with the presence of E-cadherin in those layers (Haftek et al. 1996).
In previous studies of integrin levels we used FITC-conjugated primary antibodies and we measured the average fluorescence of groups of cells at defined locations within the epidermal basal layer (Jones et al. 1995). In the present work we showed that the same variation in fluorescence is seen when sections are labeled with an unconjugated primary antibody followed by an FITC-conjugated secondary antibody. We also extended the analysis by comparing both the fluorescence of individual cell-cell borders (e.g., Figure 2) and the average fluorescence of groups of cells (e.g., Table 1). The measurements of individual borders suggest that there are gradients of fluorescence rather than discrete groups of brightly and weakly labeled cells.
Of the antibodies tested, only three showed patchy staining within the basal layer (see Figure 5). In foreskin, the tips of the dermal papillae, where the β1 integrinbright cells lie, showed low levels of E-cadherin and β-catenin and high levels of γ-catenin. In palm, the β1-, γ-catenin-bright, E-cadherin-, β-catenin-dull cells were at the tips of the rete ridges. The ratio of the average fluorescence intensity of bright and dull cells ranged from 1.6 to 2.1 (Table 1), which is comparable to the ratio of 2.1 previously reported for the α2β1 and α3β1 integrins (Jones et al. 1995). The number of bright cells per patch was on the order of 9–12 cells. There were no marked differences in the sizes of patches defined by the different proteins, and double labeling for γ-catenin and β1 integrins showed broad coincidence of bright cells.
The finding of heterogeneity in the levels of E-cadherin, β-catenin, and γ-catenin is of interest because of evidence that cadherins play a major role in epithelial morphogenesis (Takeichi 1995) and may regulate keratinocyte growth and differentiation (Zhu and Watt 1996). Furthermore, cadherin-mediated adhesion is involved in the downregulation of integrin expression that occurs during keratinocyte terminal differentiation (Hodivala and Watt 1994). The mechanism by which cadherins could regulate integrin expression is presently under investigation and is believed to involve the mutual association of integrins and cadherins with the actin cytoskeleton which, in the case of cadherins, is mediated by catenins (Braga et al. 1995). Therefore, one would predict that the levels of integrins and cadherins in basal keratinocytes would be inversely correlated, and this is indeed the case for α2β1, α3β1, and E-cadherin. The complementary distribution of β-catenin- and γ-catenin-bright cells in the basal layer is interesting, given that the cytoplasmic domains of cadherins form complexes that contain either β-catenin or γ-catenin in addition to α-catenin (Zhu and Watt 1996; Gumbiner 1995) and that γ-catenin not only binds to the cytoplasmic domain of cadherins but also is a component of desmosomes. Furthermore, β-catenin is believed to have signaling functions that are independent of its role in cell adhesion (Gumbiner 1995).
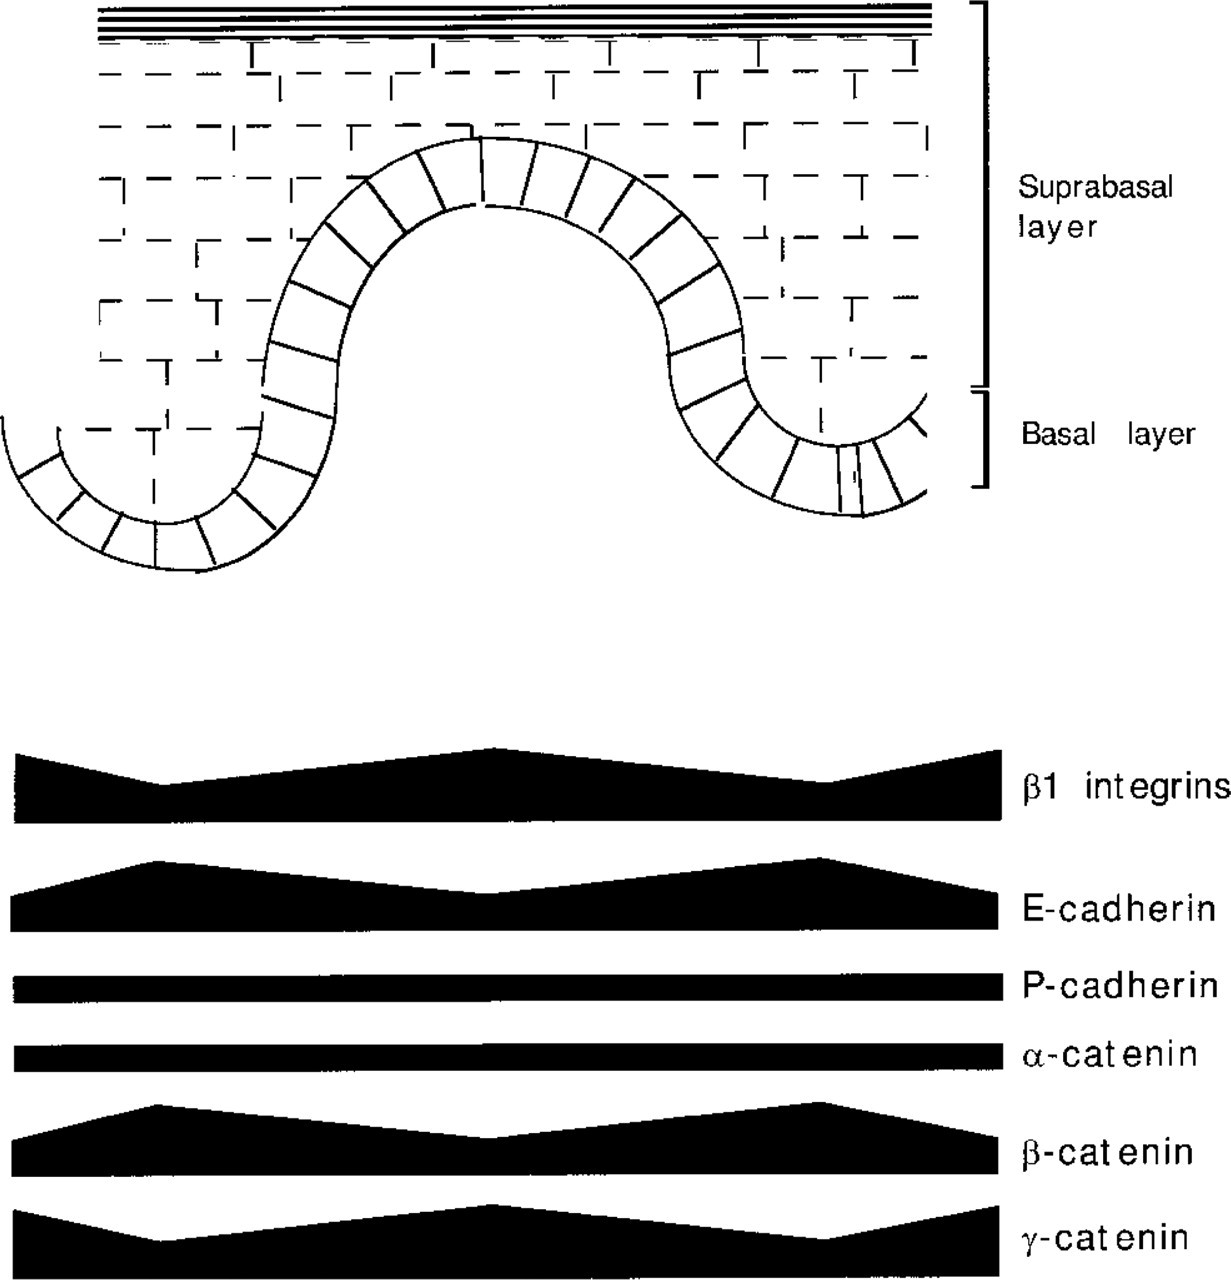
Schematic representation of the abundance of different adhesion molecules within the basal layer of foreskin epidermis. The stem cell compartment localizes at the tip of the dermal papilla and is characterized by high levels of β1 integrins and γ-catenin, whereas cells at the tip of the rete ridge express high levels of E-cadherin and β-catenin.
In conclusion, our observations suggest that there are gradients of cell-cell and cell-matrix adhesiveness within the basal layer (see Figure 5; see also Jones and Watt 1993). Cell-cell adhesiveness, like cell-extracellular matrix adhesiveness, may be an important component of the stem cell niche (Hall and Watt 1989).
Footnotes
Acknowledgements
J-PM was supported by fellowships from the European Community (Human Capital and Motility) and from INSERM (Bourse de Formation Postdoctorale). We gratefully acknowledge additional funding from Bristol-Myers Squibb.
We are grateful to M. Takeichi, A.I. Magee, and S. Hirohashi for generous gifts of antibodies, to P.H. Jones for interesting discussions, and to P. Jordan for help with confocal microscopy. We thank W. Senior for typing the manuscript.