
Abstract
We studied the effects of shear stress on protein kinase C (PKC) in cultured human umbilical vein endothelial cells by use of a flow channel and a monoclonal antibody (MAb 1.3) that recognizes the PKC β-isozyme. The fluorescence intensity (FI) of the secondary antibody, crystalline tetramethylrhodamine isothiocyanate, was determined by image analysis. The results on each of five shearing experiments were normalized by using the paired stationary control. After 30-min shearing at 2 N/m2, FI per cell increased to 1.6 times that of control, as did the mean FI per unit cell area. The FI per unit stained area and the stained area/cell area ratio were also increased significantly by shearing. The distribution of immunostaining in each cell was determined for its cortical, cytoplasmic, perinuclear, and nuclear regions. The normalized FI per unit area in all four regions and the stained area/cell area ratio in cortical and cytoplasmic regions were significantly higher in the sheared cells than in control; the increases were greatest in the cortical area. Double staining with rhodamine-phalloidin and MAb 1.3 showed the association of actin with the PKC isozyme in both stationary and sheared cells.
P
The wall shear stress in the vascular system is maintained at an optimal level by an autoregulatory mechanism (Kamiya and Togawa 1980). The endothelial cells (ECs), which line the inner surface of blood vessels and are in direct contact with blood flow, are essential for this autoregulatory mechanism (Langille and O'Donnell 1986). The ECs are continuously exposed to blood flow and appear to be able to sense the resultant mechanical forces, including shear stress. Therefore, cell changes in ECs induced by shear stress reflect a physiological response to a stimulus present in the normal environment of these cells.
The responses of ECs to shear stress have usually been studied by the use of cultured human umbilical vein endothelial cells (HUVECs). Such investigations have demonstrated changes in morphology (Dewey et al. 1981), arachidonic acid metabolism (Nollert et al. 1989), protein synthesis (Diamond et al. 1989), and gene expression (Hsieh et al. 1992) in ECs subjected to mechanical shear stress. The available evidence suggests that shear stress stimulates the production of intracellular second messengers rather than causing a general perturbation of cell metabolism.
Hemodynamic forces, including shear stress, play an important role in the focal nature of atherosclerosis (Nerem and Leveque 1983). However, the mechanism by which these mechanical forces cause gene regulation is not yet clearly understood. The purpose of the present investigation was to study the effect of shear stress on PKC distribution in the ECs, thus shedding some light on the possible participation of this molecule in mechanochemical signal transduction in health and disease.
PKC is widely distributed in many tissues and cell types. The tissue PKC content varies from high levels in the brain (9 μg/mg protein) and spleen (1.4 μg/mg protein), to a low level in 3T3 fibroblasts (1 ng/mg protein) (Boscá et al. 1989). Immunohistochemical analysis with polyclonal antisera has demonstrated that PKC distribution in tissues varies with cell type. PKC activity has been shown to translocate from the cytosol to the particulate fractions of the cell, the cell membrane (Girard et al. 1987), or the nuclear envelope (Leach et al. 1989). In non-dividing cultured porcine aortic ECs, the majority of PKC activity is found in the cytoplasm, whereas in vigorously proliferating cells, more than half of the total activity is found in the membrane fraction (Uratsuji and Dicorleto 1988).
PKC in cells has been determined by indirect immunofluorescence with antibodies, e.g., the monoclonal antibody MAb 1.3, which binds to the β-isozyme of PKC (Mochly-Rosen et al. 1990). A fairly high level of PKC and a large number of its protein substrates have been found in endothelial cells (Mackie et al. 1986). To determine PKC distribution in HUVECs, we have adapted a video image analysis system to measure the fluorescence intensity (FI) of a crystalline tetramethylrhodamine isothiocyanate (TRITC)-conjugated secondary antibody bound to MAb 1.3 in different cell regions, as well as on the whole cell. Our results indicate that shear stress causes an increase of PKC immunostaining in all regions of HUVECs, especially in the cortical region.
PKC has been shown to associate with cytoskeletal proteins (Murti et al. 1992). In the present study, the effect of shear stress on the topographical relationship between PKC and actin was determined by a double staining technique.
Materials and Methods
Reagents
The mouse anti-PKC monoclonal antibody MAb 1.3, which was prepared and characterized by D. Mochly-Rosen and D.E. Koshland, was purchased from Gibco BRL Life Technologies (Gaithersburg, MD). MAb 1.3 was prepared against highly purified rat brain PKC containing both membrane-associated and cytosolic PKC and was tested to ensure that it was PKC-specific (Mochly-Rosen et al. 1990; Mochly-Rosen and Koshland 1988). That the MAb 1.3 was directed against an isozyme of PKC was derived from the following evidence. The cDNAs for the α-, β-, and γ-isozymes were transiently expressed in RAT1 cells to examine the binding of different PKC MAbs. Binding of MAb 1.3 was observed only in cells expressing the cDNA for the β-isozyme.
Secondary antibodies conjugated with TRITC and fluorescein isothiocyanate (FITC) were purchased from Sigma Chemical (St Louis, MO). Rhodamine-conjugated phalloidin and SlowFade anti-fade reagent were purchased from Molecular Probes (Eugene, OR).
Cell Culture
Primary HUVECs were harvested from human umbilical veins by collagenase treatment and were plated on glass slides (3 × 1 inch) precoated with 2% gelatin (Sigma Chemical). Cells were grown to confluence on glass slides in an EGM medium (Clonetics; San Diego, CA) containing 20% fetal bovine serum and no ATP (Hyclone Laboratories; Logan, UT).
After 1 day the cells were sparse and subconfluent. The medium was changed and cells were allowed to grow for 3–4 additional days to reach confluence. Fluid flow experiments were conducted no more than 2 days after the cultures had reached confluence. The medium was changed 1 day before the experiment. Paired experiments were conducted by placing HUVECs in two flow chambers, with one kept under a static condition (stationary or control group) and the other exposed to a shear stress of 2 N/m2 (N, Newton = 105 dynes) for 30 min (shear group).
Fluid Flow
The shear stress experiments were conducted in a rectangular flow chamber. The chamber, a reservoir, and a circulation circuit were filled with fresh culture medium. The medium was driven by using a constant-head-flow loop, such that the HUVECs were exposed to well-defined shear stress for 30 min. A roller pump was used to return the outflow from the chamber to the feeding reservoir. The medium was kept at a constant temperature of 37C and was equilibrated with a gas mixture of 95% air and 5% CO2. In the control (stationary) group, the HUVECs were kept in the chamber for 30 min without flow.
Indirect Immunofluorescence
After the 30-min experimental period, the HUVECs on the chamber slides were fixed with 1% formaldehyde for 20 min at 37C in PBS. The fixed cells were permeabilized and nonspecific binding was blocked by preincubation with PBS containing 0.3% Triton X-100 and 1% normal goat serum. To visualize PKC, the cells were incubated with anti-PKC MAb 1.3 in PBS containing 0.3% Triton X-100, followed by the TRITC-conjugated secondary antibody. For negative controls, normal goat serum was used and followed by either (a) MAb 1.3 without the secondary antibody or (b) the TRITC-labeled secondary antibody without MAb 1.3. When the cells were double stained to visualize PKC and actin microfilaments, they were stained with an FITC-labeled secondary antibody against MAb 1.3 and rhodamine-conjugated phalloidin, respectively. The slides were mounted with SlowFade anti-fade reagent and viewed with a Nikon microscope (Microphot-FX) with X20, X40, and X100 objectives. The light source was a 75-W Xenon lamp. The rhodamine fluorescence was studied with an excitation filter at 546 nm, a dichroic mirror at 580 nm, and a barrier filter at 580 nm. The FITC fluorescence was studied with an excitation filter at 495 nm, a dichroic mirror at 510 nm, and a barrier filter at 520 nm. Images were recorded on Kodak Ektachrome P800/1600 professional black-and-white film 5020, with exposure times of 20 and 40 sec. Stained specimens were viewed with a Nikon Diaphot microscope equipped with a Bio-Rad MRC 1000 laser scanning confocal imaging system (Bio-Rad; Richmond, CA). A X60 oil immersion objective was used to examine the specimens. By stepping the objective through the depth of the specimen, a z-series (a collection of optical sections) was obtained. Double stained specimens were pseudo-colored separately and merged with CoMos and Confocal Assistant programs. These paired images were transferred to a Power Macintosh 8100/80 computer for further analysis. The paired images were combined with Adobe Photoshop (Adobe System; Mountain View, CA). The resultant RGB images depict each of the F-actin and PKC components as red and green, respectively.
Image Analysis
The fluorescence intensity of the photographic image was measured with an image processing system. The film was backlit by using a light table and scanned with a Panasonic WV-CD camera. The resulting image signal was displayed on a high-resolution color video screen and was also entered via a Gateway 2000 486/33 computer system into a Matrox MVP-AT image processor, where it was digitized into an array of pixels. Intensity values for each pixel ranged from a gray scale of 0 for black to 255 for white. The Image-1 system (Universal Imaging; West Chester, PA) software program was used to analyze the image to derive the intensity profile of the object. The analysis consisted of a standard order of procedures, including spatial calibration, image acquisition, thresholding, and profile extraction.
Measurements were made on 10 microscopic fields evenly spaced along the midline (lengthwise) of the flow chamber, each containing 25 cells. The cell profile features were contoured by using a light pen. For each cell, measurements were made on projection areas (PKC-stained area, whole cell area, and cell regional areas), as well as the fluorescence intensity (gray value of PKC staining). After appropriate corrections for stray light and shading, the image was stored in the computer for further processing.
Statistics
Mean values, together with variances, standard deviations, and standard errors, were calculated for the stationary and shear groups. Analysis of variance was performed on a Power Macintosh computer, using the program SYSTAT Version 5.2 (SYSTAT; Evanston, IL). Student's t-test was performed by using the program SigmaPlot (Jandel Scientific; San Rafael, CA). Statistical graphs were drawn by using the program KaleidaGraph Version 2.0 (Synergy Software; Reading, PA).
Results
Fluorescence Microscopic Examination
Figure 1 shows the MAb 1.3 immunostaining-positive HUVECs as demonstrated by the TRITC-labeled goat anti-mouse secondary antibody. HUVECs treated with normal goat serum (without MAb 1.3) followed by TRITC-labeled secondary antibody were consistently negative for staining (not shown). In addition, no immunostaining was obtained when the TRITC-labeled secondary antibody was omitted (not shown).
In stationary experiments, some of the PKC isozyme immunostaining was in fiber form (Figures 1A and 1C). After 30 min of exposure to shear stress at 2 N/m2 (shear experiments), the cells were still in confluent condition. Stronger immunostaining of anti-PKC MAb 1.3 was observed, and most of the immunostaining of cell components appeared as fibers (Figures 1B and 1D).
Image Analysis
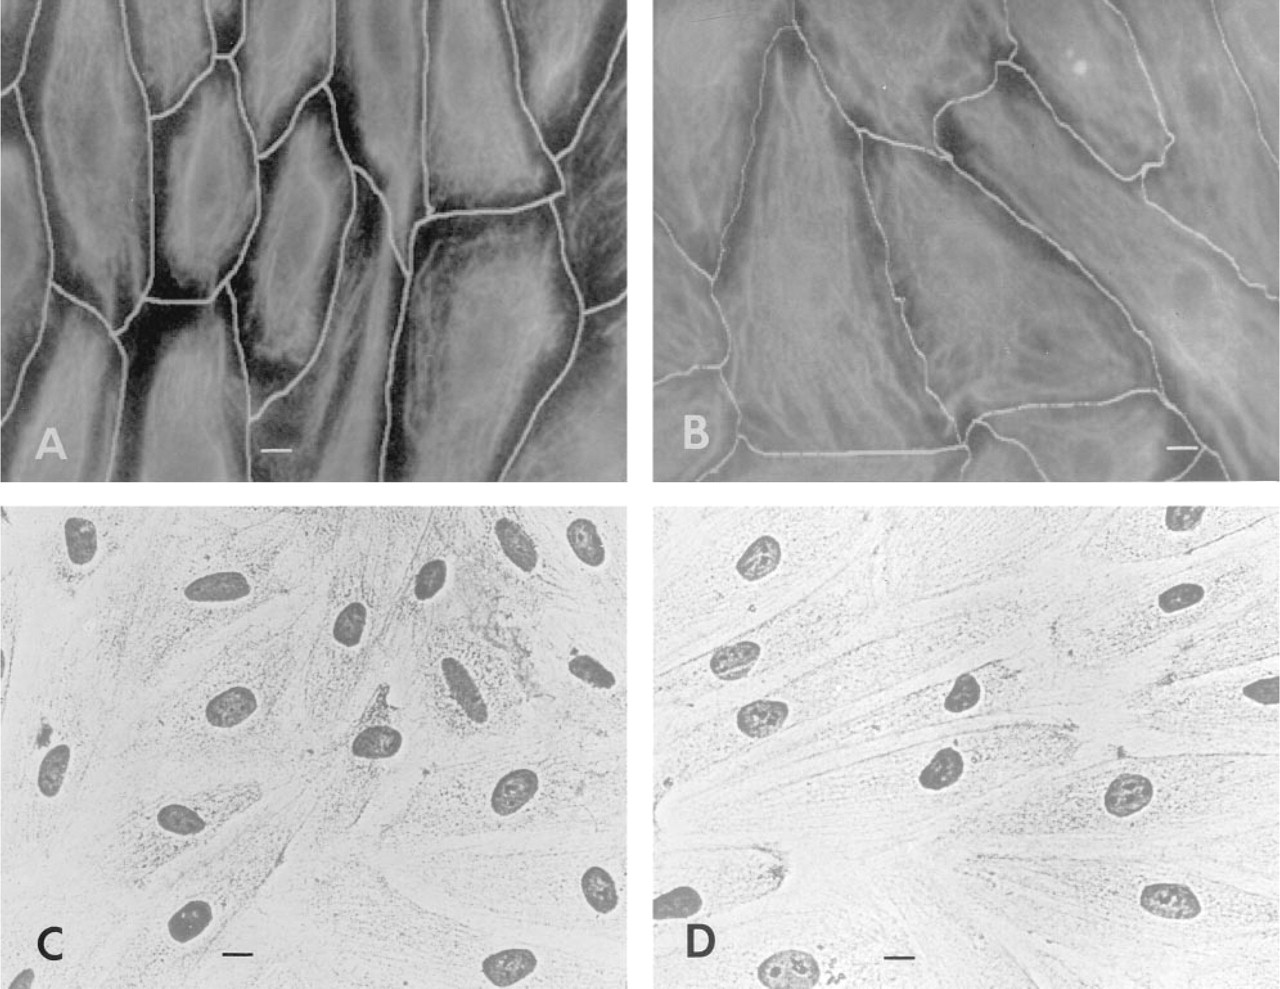
The photomicrographs were subjected to image analysis to provide an estimation of the fluorescence intensity of PKC staining. A light pen was used to outline the profile of individual cells (Figures 2A and 2B). The computer then summed the gray scale values (range 0–255) of all pixels within the selected cell outline for the calculation of FI in the cell profile (Table 1). Hematoxylin staining was used to identify the cell nucleus and cytoplasm of sheared cells and stationary cells in paired experiments (Figures 2C and 2D).
In each shear experiment, 250 cells were randomly chosen for measurement, and a total of 1250 cells were studied in five sheared experiments. The same number of cells were measured in the five paired stationary experiments (Table 1). In each of the five paired experiments, the results obtained on the stationary and sheared cells were normalized by the mean value obtained in the stationary experiment. The normalized values were used to combine the results obtained from the five different paired experiments for the 1250 stationary cells and 1250 sheared cells. The frequency distributions of the normalized values obtained are shown in Figures 3 and 4. The FI was found to be higher in the shear experiments than in the stationary control on either a per cell (Figure 3A) or per unit cell area basis (Figure 3B). The FI per unit PKC-stained area (Figure 4A) and the fractional cell area that shows FI (i.e., PKC-stained area/cell area; Figure 4B) also increased in the sheared cells.
Table 1 lists the raw data on the cell FI for the five experiments. In four of the five paired experiments, the FI was significantly higher in the sheared cells than in the stationary cells. The normalized FI for all 1250 sheared cells (mean ± SEM 1.667 ± 0.022) was significantly higher (p<0.001) than the 1250 stationary cells (1.000 ± 0.014). In all five paired experiments, the FI expressed as per unit cell area (FI/cell area) was higher in the sheared cells (1.604 ± 0.014).
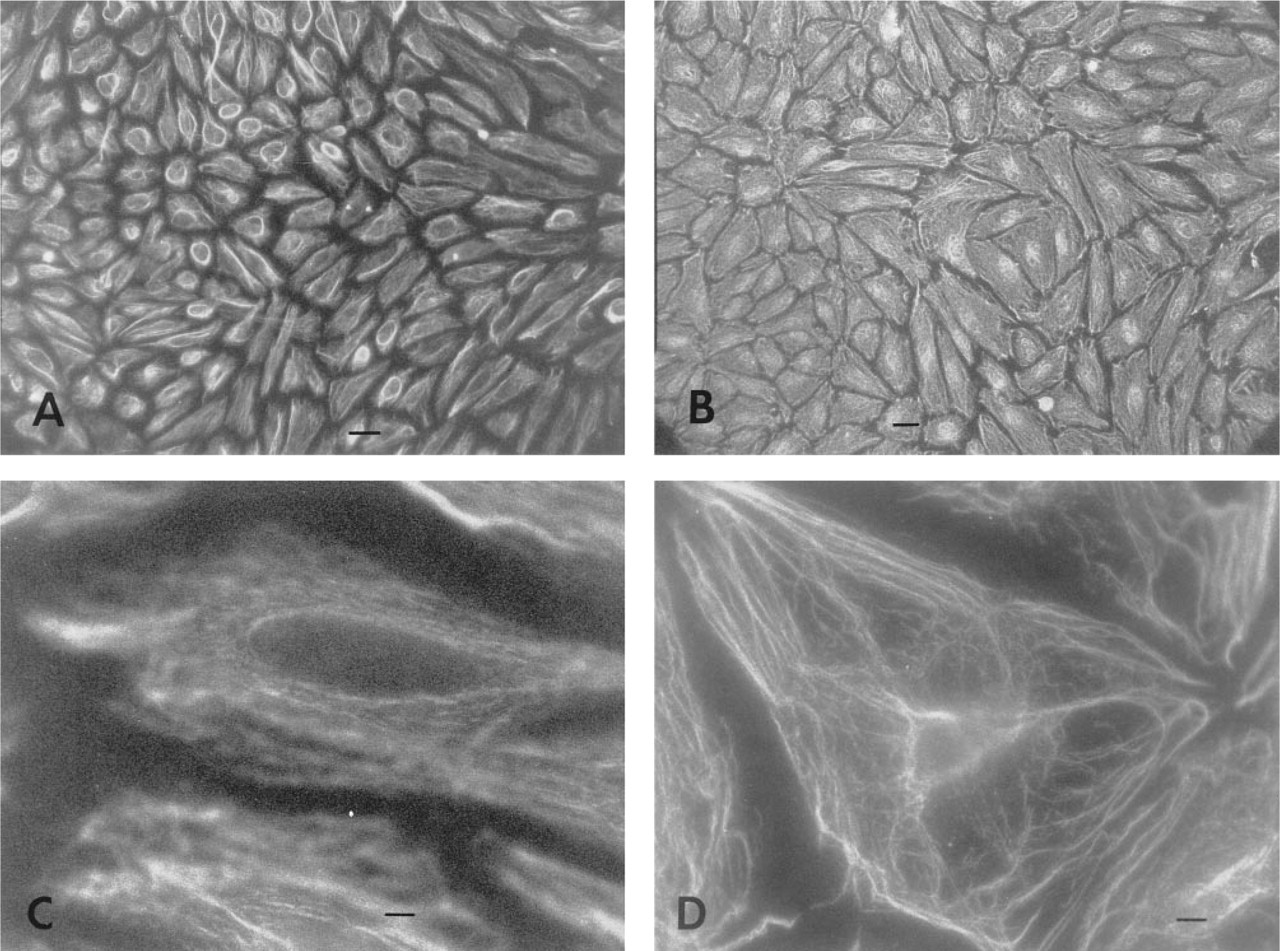
Immunostaining with anti-PKC MAb 1.3 in confluent HUVECs.
The normalized FI per unit PKC-stained area was significantly higher in the sheared cells (1.189 ± 0.004) than in the stationary cells for all five experiments (Table 1; p<0.001). The normalized ratio of PKC-stained area to cell area was also significantly higher in the sheared cells (1.390 ± 0.012) than in stationary cells (Table 1; p<0.001).
The distribution of PKC immunostaining in individual HUVECs was analyzed by dividing each cell into four regions, i.e., cortical, cytoplasmic, perinuclear, and nuclear regions (Figure 5). The area of the cell outside of the nucleus (between the nuclear membrane and the cell membrane) is divided into three regions according to the radial distances as follows: the outer one fifth was denoted as the cortical region, the perinuclear one fifth was designated as the perinuclear region, and the remaining three fifths were called the cytoplasmic region.
Table 2 compares the normalized FI per unit area in these four different regions between 50 cells in the stationary group and 50 cells in the shear group. For cortical, cytoplasmic, perinuclear, and nuclear regions, the mean values of FI per unit area (normalized to the value for the whole cell) in the stationary group were 0.484, 1.123, 1.413, and 1.210, respectively. The corresponding normalized values in the shear group were 1.034, 1.788, 1.676, and 1.612, respectively. The values of all four regions were significantly higher in the sheared cells than in the stationary cells (p<0.001), but the increase was proportionally greatest in the cortical region. Table 3 compares the normalized ratio of PKC-stained area to cell area in the four regions between 50 cells in the stationary group and 50 cells in the shear group. In the stationary group, the mean values (normalized to the value for the whole cell) for cortical, cytoplasmic, perinuclear, and nuclear regions were 0.546, 1.127, 1.366, and 1.245, respectively. The corresponding normalized values for the shear group were 0.992, 1.437, 1.306, and 1.389, respectively. The values for cortical and cytoplasmic regions were significantly higher in the sheared cells than in the stationary cells, and the relative increase was greater in the cortical region (p<0.001).
Video analysis and phase microscopy of confluent HUVECs. In the video monitor images of stationary ECs
Distribution of PKC immunostaining fluorescent intensity (FI) in HUVECs a
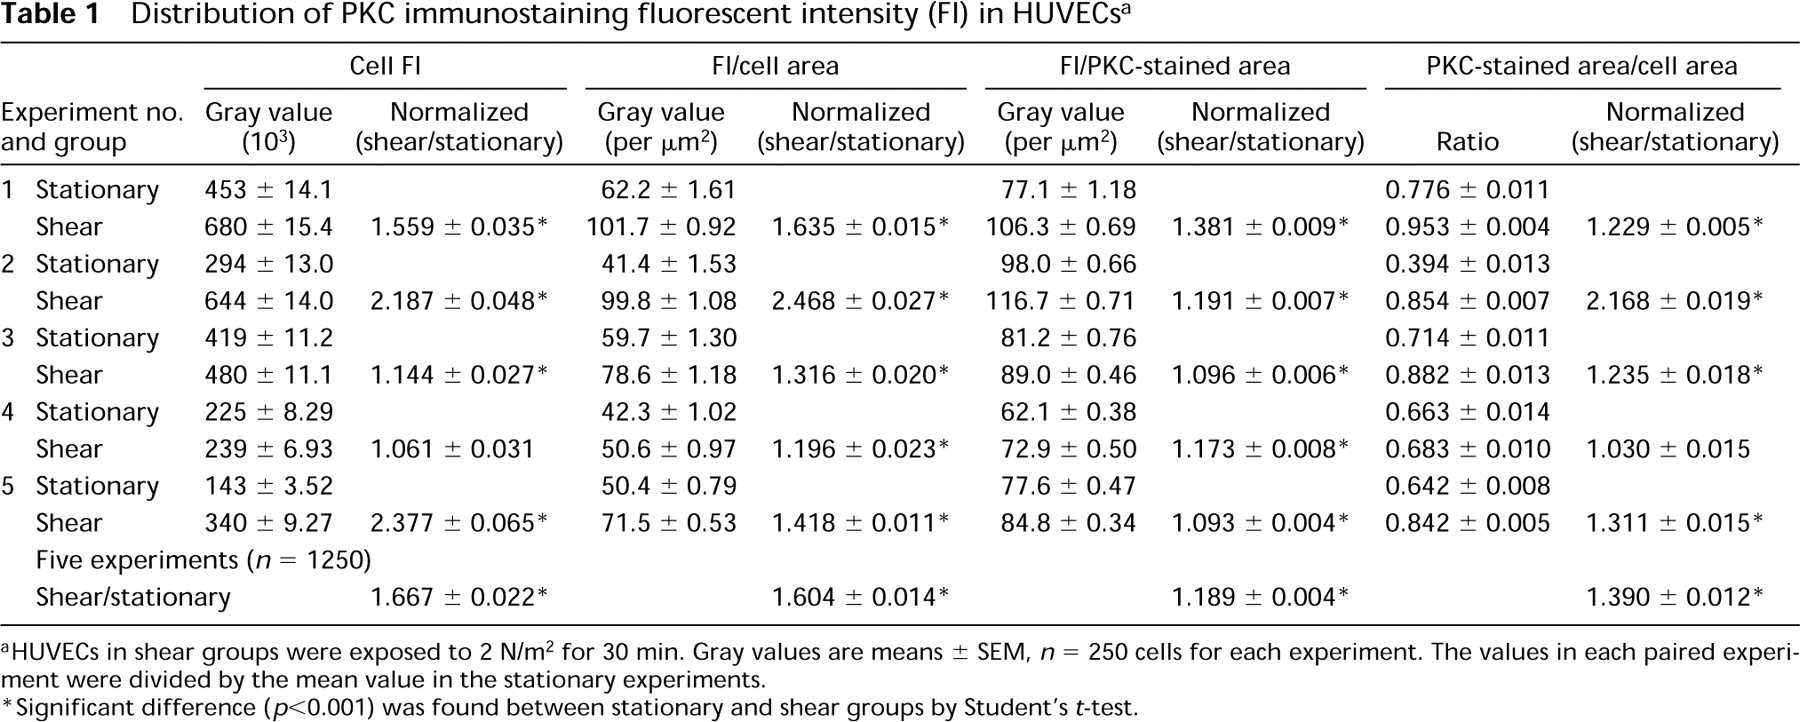
aHUVECs in shear groups were exposed to 2 N/m2 for 30 min. Gray values are means ± SEM, n = 250 cells for each experiment. The values in each paired experiment were divided by the mean value in the stationary experiments.
∗Significant difference (p<0.001) was found between stationary and shear groups by Student's t-test.
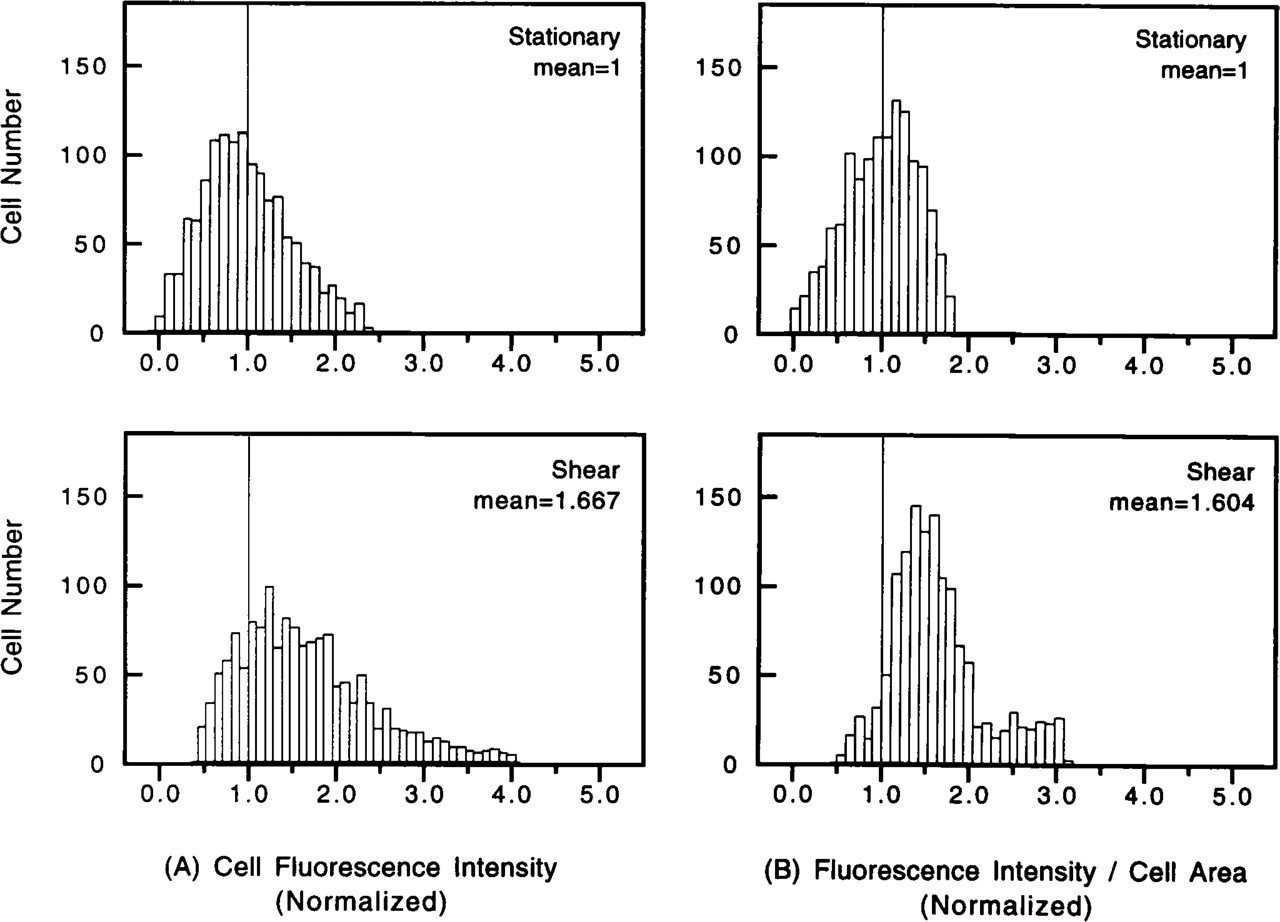
Distributions of normalized PKC-stained fluorescence intensity
These findings indicate that the PKC per unit area of HUVECs, as demonstrated by immunostaining with antibodies to a PKC isozyme, is increased by shear stress in all four regions of the cell, especially in the cortical region.
Confocal Imaging of ECs for PKC
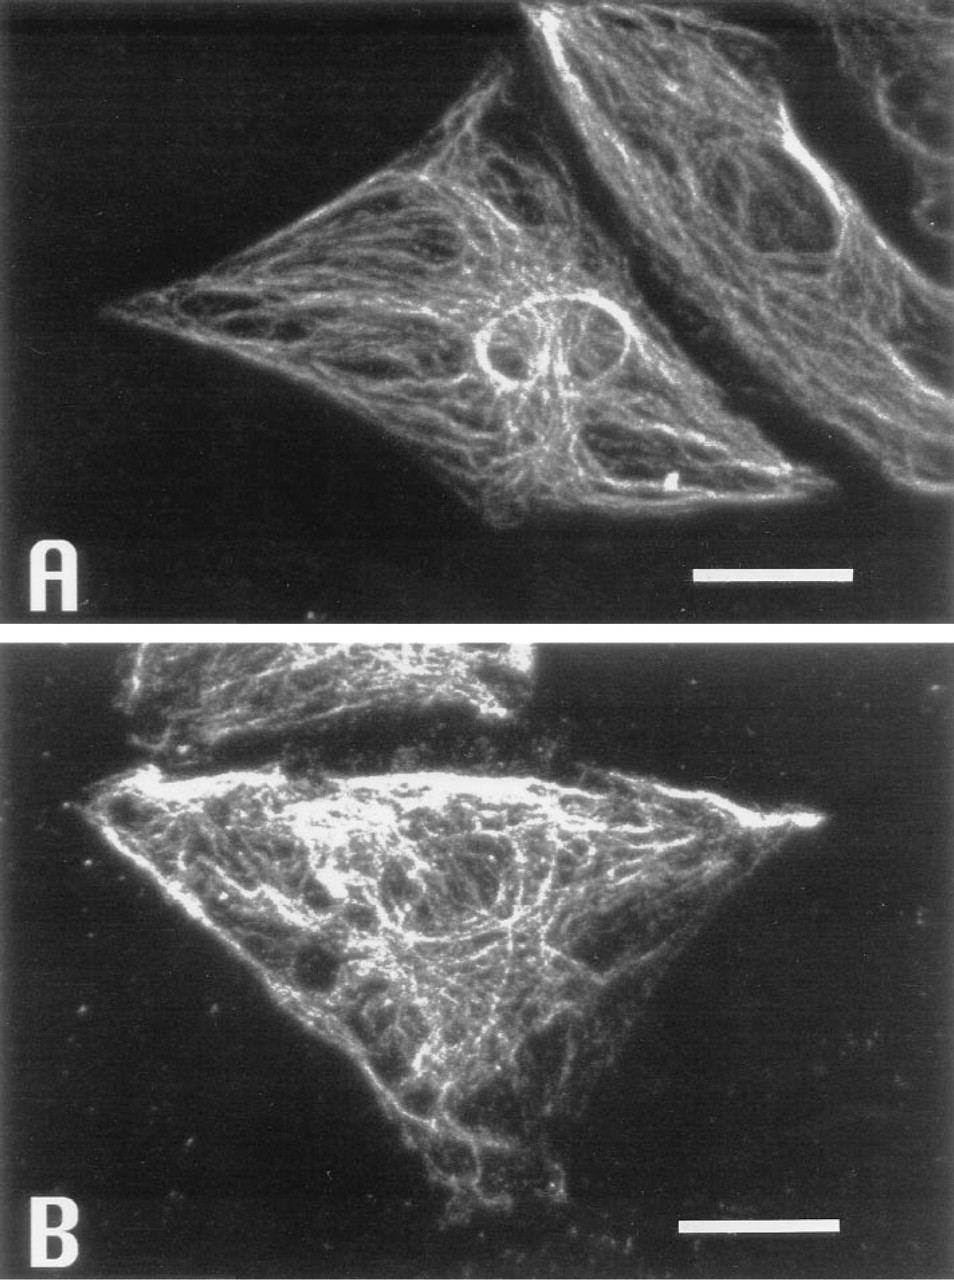
The photographs were taken by a confocal fluorescence microscope system, which enables optical slicing of endothelial cells through their depth by the confocal laser scanning system. Image sets of ECs, including PKC immunostaining, the cross-section of nuclear area, and the cell morphology were collected. The immunostaining of PKC was found to localize at the basolateral portion of the cell. These fibers of immunostaining were stronger in the shear group (Figures 6J-6R) than in the stationary group (Figures 6A-6I). The fraction area stained for PKC was larger in the sheared cells than in the stationary cells. Larger composite pictures for these cells are shown in Figure 7.
Fluorescence intensity (FI) per unit area in different regions of HUVECs a
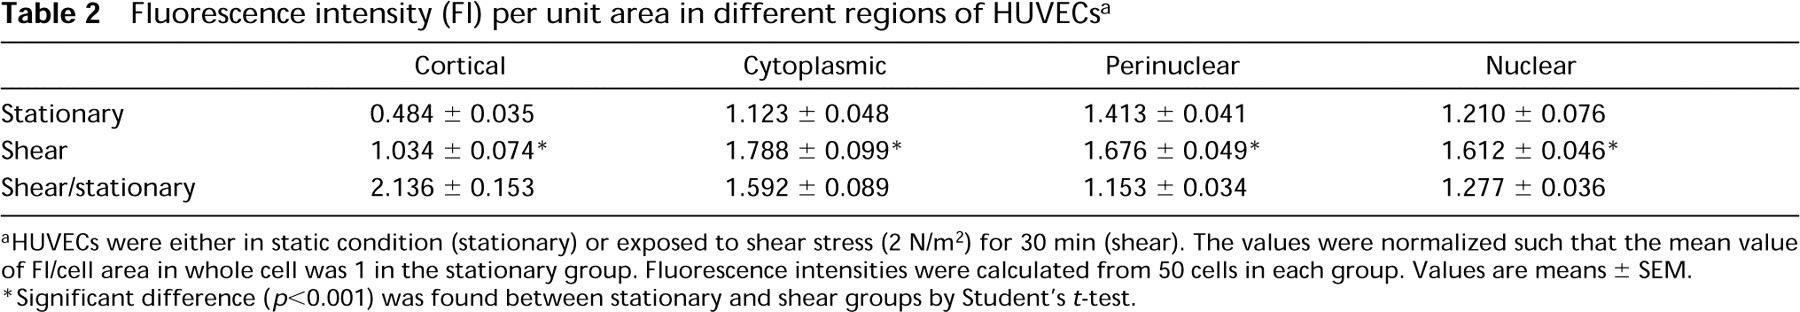
aHUVECs were either in static condition (stationary) or exposed to shear stress (2 N/m2) for 30 min (shear). The values were normalized such that the mean value of FI/cell area in whole cell was 1 in the stationary group. Fluorescence intensities were calculated from 50 cells in each group. Values are means ± SEM.
∗Significant difference (p<0.001) was found between stationary and shear groups by Student's t-test.
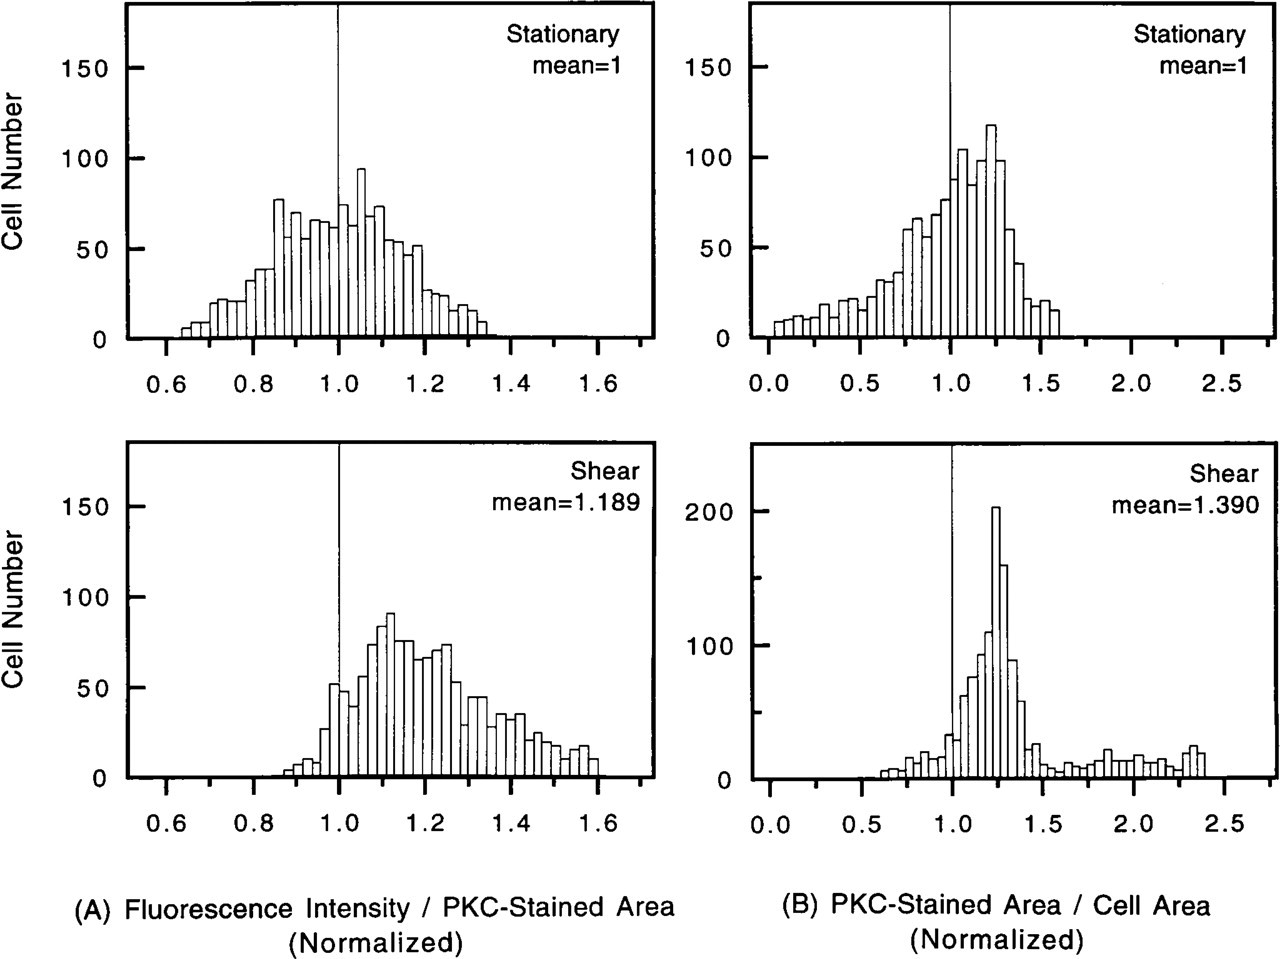
Distributions of normalized fluorescence intensity per unit PKC-stained area
Double Staining for F-actin and PKC
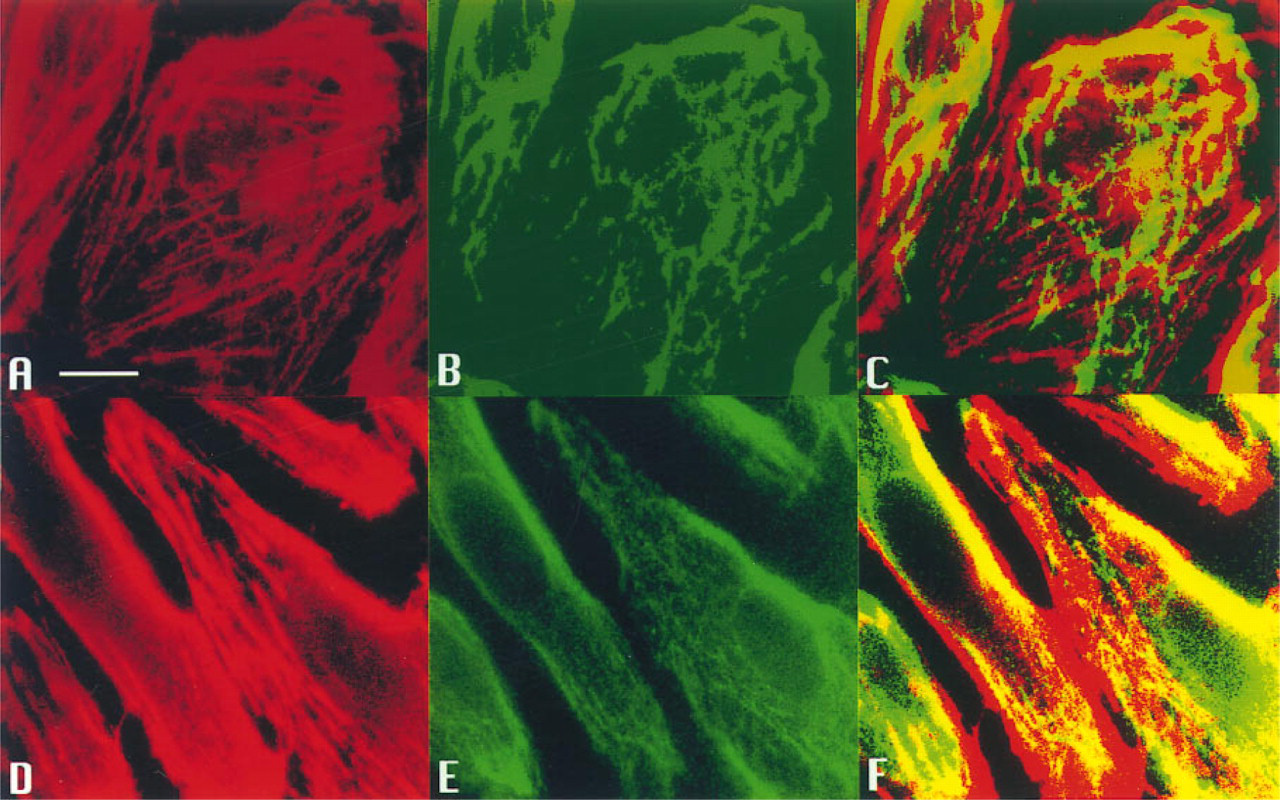
Cytoskeletal proteins undergo reorganization in response to shear stress (Eskin et al. 1985) and may participate in signal transduction (Wang et al. 1993). Furthermore, intermediate filaments and actin microfilaments have been shown to associate with PKC (Mochley-Rosen et al. 1990). To determine the effect of shear stress on the degree of co-localization of PKC and F-actin in the cytoskeletal network, HUVECs were double labeled by immunostaining with anti-PKC MAb 1.3 and rhodamine-phalloidin.
Ratio of PKC-stained area to cell region area in different regions of HUVECs in stationary and shear groups a
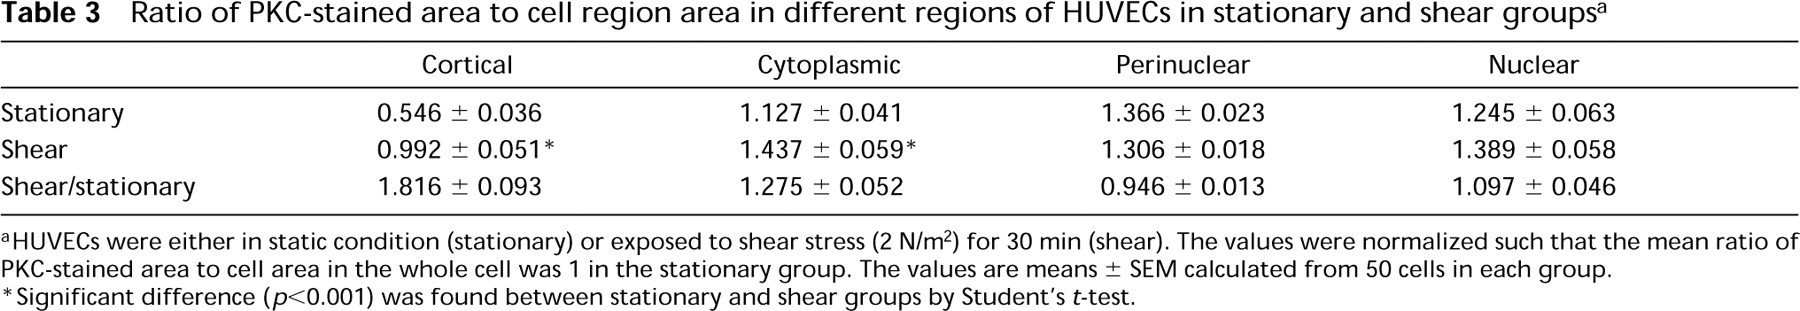
aHUVECs were either in static condition (stationary) or exposed to shear stress (2 N/m2) for 30 min (shear). The values were normalized such that the mean ratio of PKC-stained area to cell area in the whole cell was 1 in the stationary group. The values are means ± SEM calculated from 50 cells in each group.
∗Significant difference (p<0.001) was found between stationary and shear groups by Student's t-test.
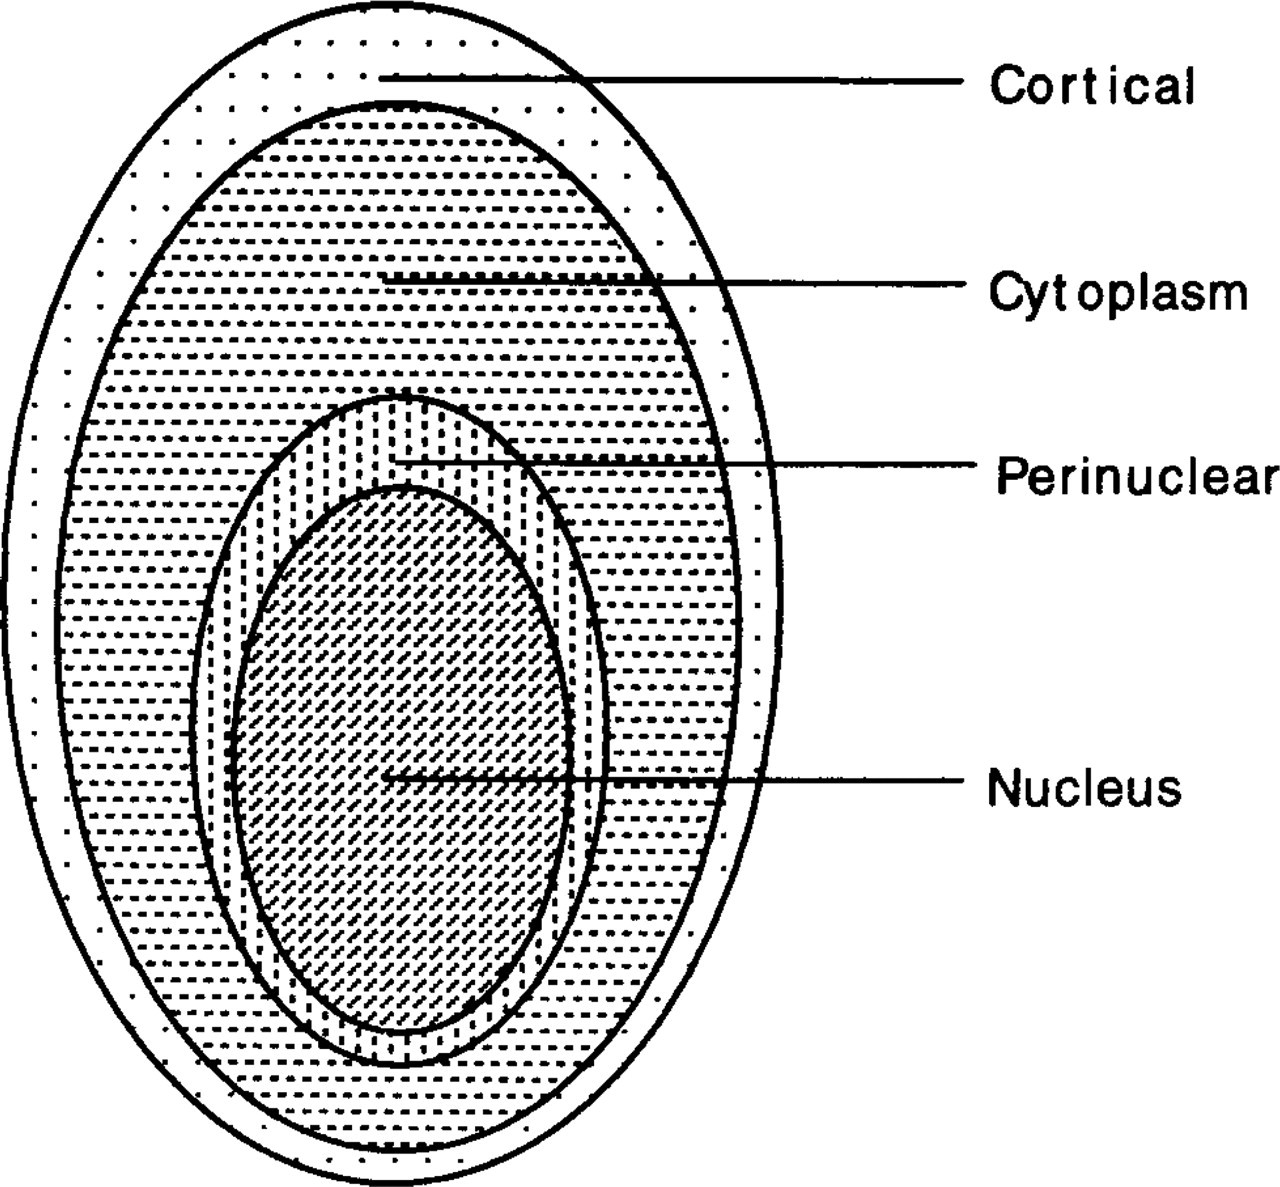
Analysis of distribution of PKC immunostaining in different regions of HUVECs. The whole cell was divided into four regions (cortical, cytoplasmic, perinuclear, and nuclear) as schematized by four concentric ellipsoids. The first three regions were subdivided from the extranuclear area in the following manner: the outer one fifth was denoted the cortical region; the middle three fifths the cytoplasmic region; and the inner one fifth the perinuclear region. Measurements were made in each of the four regions for cells in the stationary group and in the shear group on the fluorescence intensity per unit area of PKC immunostaining (Table 2) and the ratio of PKC-stained area/cell area (Table 3).
Figure 8 shows a set of representative samples from 10 such experiments. As shown in Figure 8A, rhodamine-phalloidin staining of F-actin labeling (pseudo-colored red) for the stationary cells was found in the ruffled membranes of lamellipodia and the stress fibers. The fibers were variable in length and distributed as linear, parallel arrays in various cell regions. After exposure to shear stress, the stress fibers increased and became aligned with the long axis of the cell (Figure 8D). Figures 8B and 8E show the PKC staining (pseudo-colored green) of the stationary and sheared cells, respectively. The co-localization of F-actin and PKC staining (yellow) can be seen in the stationary cells (Figure 8C), but the degree of co-localization was enhanced in the sheared cells (Figure 8F).
Discussion
Hemodynamic shear stress arising from blood flow affects endothelial morphology and function. Shear stress reorganizes actin filaments into stress fibers, alters the shape of endothelial cells, and aligns the cells in the direction of flow in vitro (Dewey et al. 1981) and in vivo (Levesque et al. 1986). These structural changes have been postulated to play a role in leukocyte adhesion and endothelial integrity. Shear stress also influences various functions of endothelial cells, such as arachidonic acid metabolism, protein synthesis, and gene expression (Shyy et al. 1995; Hsieh et al. 1992).
There is evidence that shear stress-induced changes in ECs are mediated by intracellular second messengers. PKC is an important enzyme involved in the regulation of cell morphology, contractility, secretion, growth and differentiation, and signal transduction, and its activation leads to actin polymerization, network assembly, and modulation of membrane-actin linkages (Wong et al. 1990). A large number of PKC substrate proteins have been found in ECs, and it has been hypothesized that shear stress, by activating PKC, may initiate a variety of responses in these cells.
Shear stress has been shown to activate phosphoinositide turnover, possibly via phospholipase C in endothelial cells, resulting in the production of inositol trisphosphate and diacylglycerol (Nollert et al. 1990), and these second messengers can trigger the release of Ca2+ from intracellular pools and activate PKC, respectively (Nishizuka 1986). Frangos and colleagues have demonstrated that PKC mediates the shear stress-induced activation of the platelet-derived growth factor gene (Hsieh et al. 1992) and release of endothelin-1 (Kuchan and Frangos 1993) in cultured endothelial cells. Morita et al. (1994) showed that shear stress can induce actin fiber depolymerization through a Ca2+- and PKC-dependent pathway, followed by an increase in endothelin-1 gene expression in ECs. Therefore, Ca2+- and PKC-dependent changes in actin fiber equilibrium may be important not only for the rearrangement of cell shape in response to shear stress but also for signal transduction leading to gene expression (Morita et al. 1994).
PKC is a family of closely related proteins. It has been shown that the enzyme exists as many isozymes, such as α, β, γ, δ, ∊, ζ, and η (Osada et al. 1990). Each cell may contain more than one isozyme. The different isozymes of PKC may have tissue- and cell-specific localization, and they phosphorylate different substrates to regulate diverse biological functions. The specific functions of these isozymes are not known, but they are believed to exist in different cell compartments, where they phosphorylate specific substrates. Using an MAb that is specific for the PKC β-isozyme, we have demonstrated that the fluorescence intensity of PKC immunostaining in the sheared HUVECs is significantly stronger than that in the stationary cells (Table 1; Figures 3 and 4). Our studies also show that this shear stress-induced increase in PKC isozyme occurs in all regions of the ECs (Tables 2 and 3) and that the effect is particularly pronounced in the cortical region.
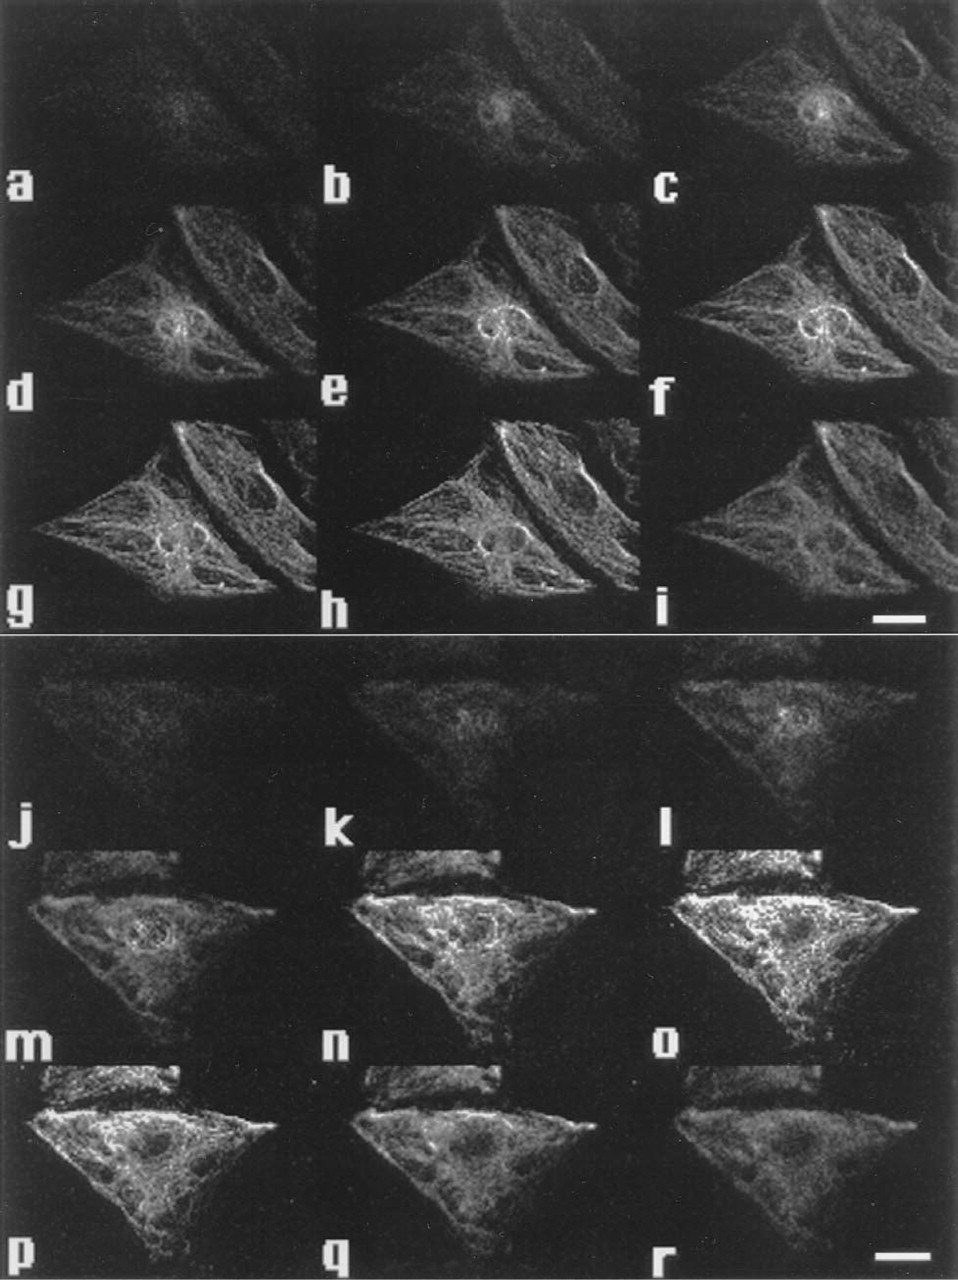
Confocal fluorescence photomicrographs of FITC-stained PKC in static control HUVECs
Composite confocal fluorescence photomicrographs of FITC-stained PKC in static control HUVECs
Previous biochemical studies have shown that PKC phosphorylates substrates in the cytosol, membrane, cytoskeleton, and nucleus (Nishizuka et al. 1984, 1986), and that PKC translocates from the cytosol to the membrane fraction on activation by a number of agents, including phorbol esters, cytokines, and hormones. Immunofluorescence studies have shown that the PKC α-isozyme associates with focal contacts in rat embryo fibroblasts (Jaken et al. 1989), that it exhibits a diffuse cytoplasmic staining pattern in NIH 3T3 cells (Leach et al. 1989), and that the activation of PKC resulted in the translocation of a PKC isozyme (nonspecific for the α-, β-, or γ-isozyme) to myofibrils and microfilaments (Mochly-Rosen et al. 1990). In the NIH 3T3 cell line, the α-isozyme has been shown to associate with the nucleus on activation with phorbol esters (Leach et al. 1989). In the immunocytochemical study by Girard and Nerem (1993) on static cultures of bovine aortic endothelial cells (BAECs), PKC was present in the cytoplasm, with some staining evident at the plasma membrane. After exposure to a shear stress of 3 N/m2 for 30 min, there was a dramatic increase in plasma membrane-associated PKC.
In preliminary experiments, we found that the cells sheared for 15 min were not significantly different in their fluorescence intensity compared to the cells sheared for 30 min. The rapid onset of the PKC response to shear suggests that it is not transcriptional in nature. There are several possible alternative explanations, e.g., increased accessibility of the antibody to PKC-β, release of PKC due to the PKC-binding protein adducins (Dong et al., 1995), and other post-translational modifications of PKC.
Confocal imaging immunofluorescence photomicrographs of stationary HUVECs
Our double staining experiments show the co-localization of PKC and F-actin in some parts of the HUVECs. There is evidence in support of the idea that a PKC isozyme transiently associates with myofibrils and microfilaments after PKC activation (Mochly-Rosen et al. 1990). Two potential mechanisms could explain the association of the activated PKC with cytoskeletal elements. PKC may be activated at the plasma membrane and subsequently translocated to a binding elements in the cytoskeleton (Wolf et al. 1985). Another possibility is that PKC may be activated at the cytoskeletal element, because the lipids required for binding and activation of PKC are associated with cytoskeletal elements (Burn 1988). The β-isozyme-specific antibody anti-PKC MAb 1.3 has been found to bind predominantly to the intermediate filament network and also to stress fibers (Murti et al. 1992).
The changes in cytoskeletal organization are a ubiquitous response to mechanical perturbation and may be involved in the transmission of mechanical forces across the cell surface and the subsequent signal transduction. The transfer of force from integrins to the cytoskeleton may represent a proximal step in an intracellular mechanical signaling cascade that leads to global cytoskeletal rearrangements and mechano-transduction events at multiple locations inside the cell (Wang et al. 1993). The significance of the association of PKC with cytoskeletal components remains to be established. It is possible that this association provides a cell compartment in which PKC is stored; on activation, the enzyme may move to other compartments to phosphorylate substrates at different locations. It is also possible that PKC phosphorylates specific cytoskeletal proteins and regulates their functions. For example, vimentin is known to be an excellent substrate in vitro for PKC (Ando et al. 1989). Stress fibers contain the myosin light chain, which is also a substrate for PKC, and phosphorylation of the myosin light chain by PKC may regulate cell shape and cell attachment (Burridge 1981). Therefore, the subcellular location of the β-isozyme of PKC is consistent with its role in cytoskeletal functions that regulate cell morphology, contractility, and attachment. Cell fractionation studies have shown that PKC exists in cytosol, membranes, and cytoskeletal fractions, and that the relative distribution of PKC changes with its activation (Mochly-Rosen et al. 1990).
The objective of our study was to examine the change in distribution of PKC in HUVECs as a consequence of shear stress. An additional goal was to determine the possible association of PKC with F-actin in the cytoskeletal network. Our results show that shear stress causes an increase in PKC β-isozyme immunostaining in ECs, especially in the cortical region. Association of the isozyme with cytoskeletal elements may explain some of the effects of PKC on cell contractility and morphology. An intact microfilament system, with its capacity to form stress fibers and focal contacts, is a critical necessity for maintaining EC adherence under shear stress. Therefore, it is possible that the PKC isozyme is translocated to different intracellular sites, including the cytoskeletal structure. Furthermore, PKC could be activated on the cytoskeletal elements. These interactions between PKC and the cytoskeleton may play a significant role in the modulation of cell function and the rearrangement of cell shape in response to shear stress.
Footnotes
Acknowledgements
We thank Dr Jeff Price for help in the use of the confocal microscope, Dr John Y. Shyy for valuable advice and discussion, and Mr Gerard Norwich for excellent assistance.
Supported by NIH Research Grants from the National Heart, Lung, and Blood Institute HL 19454, HL 44147, and HL 43026, and by the Whitaker Foundation Development Award.