
Abstract
The monoclonal antibody (MAb) Ki-67 is routinely used in clinical studies to estimate the growth fraction of tumors. However, the role of pKi-67, the protein detected by the Ki-67 MAb, remains elusive, although some biochemical data strongly suggest that it might organize chromatin. To better understand the functional organization of pKi-67, we studied its three-dimensional distribution in interphase cells by confocal microscopy and electron tomography. FluoroNanogold, a single probe combining a dense marker with a fluorescent dye, was used to investigate pKi-67 organization at the optical and ultrastructural levels. Observation by confocal microscopy followed by 3D reconstruction showed that pKi-67 forms a shell around the nucleoli. Double labeling experiments revealed that pKi-67 co-localizes with perinucleolar heterochromatin. Electron microscopy studies confirmed this close association and demonstrated that pKi-67 is located neither in the fibrillar nor in the granular components of the nucleolus. Finally, spatial analyses by electron tomography showed that pKi-67 forms cords 250–300 nm in diameter, which are themselves composed of 30–50-nm-thick fibers. These detailed comparative in situ analyses strongly suggest the involvement of pKi-67 in the higher-order organization of perinucleolar chromatin.
A
As revealed by Western blotting, pKi-67 is a large protein consisting of two main variants. These isoforms (with theoretical molecular masses of 320 and 359 kD) are obtained by alternative splicing of a mRNA precursor encoded by a unique gene (Gerdes et al. 1991; Duchrow et al. 1994). Analysis of the pKi-67 primary sequence has not revealed any significant homology to other known sequences. However, several putative nuclear targeting sequences have been identified, as well as more than a hundred potential phosphorylation sites (Schlüter et al. 1993). In addition, several striking features have been determined. Both variants of the protein contain sixteen repetitive elements (“Ki repeats”), each of which includes a 66-bp motif, the Ki motif, which is highly conserved (Schlüter et al. 1993). Moreover, a forkhead-associated (FHA) domain has been found in the N-terminal portion of pKi-67 (Sueishi et al. 2000). This domain, believed to be a modular phosphopeptide recognition motif that might mediate protein-protein interactions (Henckel et al. 1999; Li et al. 2000), is shared by several proteins involved in cell cycle regulation (Hofmann and Bucher 1995). This finding can be related to previous data, which revealed the role played by pKi-67 in cell cycle progression. Indeed, it has been reported that Ki-67 specific antisense oligonucleotides prevent incorporation of [3H]-thymidine (Schlüter et al. 1993) and that microinjection of antibodies directed against the murine homologue of pKi-67 delays cell cycle progression (Starborg et al. 1996).
Many data suggest that pKi-67 might be involved in the organization of chromatin higher-order structure (Takagi et al. 1999; MacCallum and Hall 2000). This hypothesis is indirectly supported by other evidence. Ki-67 immunolabeling disappears after digestion with DNase I but not after RNase treatment (Sasaki et al. 1987). Moreover, Ki-67 antibodies display a stronger affinity when pKi-67 is bound to DNA (Lopez et al. 1994). In addition, an increase of pKi-67 follows the increase of DNA during S-phase, whereas the global protein content decreases. Finally, recent biochemical data obtained by subcellular fractionation have confirmed that pKi-67 is a chromatin-associated protein, which probably resides in densely packed regions such as heterochromatin (Kreitz et al. 2000). Although many data support an involvement of pKi-67 in chromatin organization, some contradictory studies have localized pKi-67 mainly within the nucleolus, in close association with the nucleolar components that are directly involved in rRNA elongation and maturation (Verheijen et al. 1989; Kill 1996; MacCallum and Hall 2000) or in association with a new nucleolar protein (Takagi et al. 2001). Because most morphological studies published thus far were mostly bi-dimensional, they only partially revealed the complex distribution of pKi-67 and may have led to ambiguous interpretations. In addition, electron and optical microscopy data are very difficult to compare because they are usually obtained with different labeling protocols.
In this present study we used an electron-dense probe linked to a fluorescent dye, FluoroNanogold (FNG) (Robinson et al. 2000), to examine the precise 3D organization of pKi-67 during interphase at the optical and electronic levels. After acquiring a series of optical sections by confocal microscopy or collecting projections at different angles with a scanning and transmission electron microscope (STEM), volume reconstructions and tomographic analyses were performed (Beorchia et al. 1992; Lucas et al. 1996; Héliot et al. 1997; Perkins et al. 1997; Baumeister et al. 1999; Cheutin et al. 2002; Frank et al. 2002). The results reveal both the fine localization and the different levels of organization of pKi-67. pKi-67 co-localizes with certain heterochromatin domains at the periphery of nucleoli, which strongly suggests that this protein is involved in the folding of perinucleolar chromatin.
Materials and Methods
Cell Culture
Human A549 cells were grown in Ham F12 supplemented with 10% fetal calf serum, 100 U/ml penicillin, 100 μg/ml streptomycin, and 2 mM l-glutamine (Sigma; St Louis, MO), at 37C in an atmosphere enriched with 5% CO2. Cells were seeded at 5 × 10⁴ cells/cm2 and grown for 48–72 hr on glass coverslips.
Immunocytochemistry
Cells were simultaneously fixed and permeabilized for 4 min in 3% paraformaldehyde and 1% Triton X-100 diluted in PBS (140 mM NaCl, 6 mM Na2HPO4, 4 mM KH2PO4, pH 7.2) (Sigma). Then they were saturated for 30 min in PBS containing 3% bovine serum albumin (BSA), 1 mM CaCl2, and 0.5 mM MgCl2. Slides were incubated for 30 minutes in the presence of MM1 antibodies against human pKi-67 (Novocastra; LePerray en Yvelines, France) diluted 1:50 in PBS containing 1% BSA, 1 mM CaCl2, and 0.5 mM MgCl2, and rinsed three times for 5 min in PBS. A goat anti-mouse, biotinylated antibody (Jackson ImmunoResearch; Avondale, PA) was applied for 30 min and revealed for 15 minutes with either a streptavidin-FluoroNanogold (diluted 1:20) consisting of streptavidin conjugated both to a fluorescein (FITC) molecule and a 1.4 nm Nanogold particle (Nanoprobes; Yaphank, NY) (Cheutin et al. 2002), or a streptavidin-Texas Red conjugate (diluted 1:50) (Amersham Biosciences; Saclay, France). Staining of DNA was performed for 5 min at room temperature in the presence of 100 μM chromomycin A3 diluted in PBS containing 150 mM MgCl2. For confocal microscopy studies, cells on coverslips were mounted in Citifluor AF1 (Agar Scientific; Saclay, France). For electron microscopy studies, cells immunolabeled with FluoroNanogold were over-fixed for 12 min with 1.6% glutaraldehyde in PBS. After rinsing in de-ionized water, HQ silver enhancement (Nanoprobes) was performed for 8 min. Finally, cells were harvested by scraping, dehydrated in graded alcohols, and embedded in Epikotte 812.
Confocal Microscopy
Observations were made with a Bio-Rad MRC 600 System (Bio-Rad; Hercules, CA), mounted on an Axioplan optical microscope (Carl Zeiss; Oberkochen, Germany), using a planapochromat ×63, 1.4 numerical aperture oil immersion objective. For FITC coupled to FluoroNanogold, the 488-nm line of an argon ion laser was used to perform optical sections. Depending on the cell thickness, 20–30 sections per cell were recorded with a 0.2 μm z step. For double labeling experiments, dual channel acquisitions were performed by alternatively exciting chromomycin A3 with the 457-nm line of an air-cooled argon ion laser and Texas Red with the 543-nm line of an HeNe laser. To avoid misalignment caused by block filter exchange, a special filter set (DC 570, high-pass 560) was used. This enabled the simultaneous excitation and collection of fluorescence from both Texas Red and chromomycin A3. An accurate picture of the co-localization pattern was obtained by using the Bio-Rad 1024ES software. In this procedure, the intensity in the green channel was plotted against that of the red one for each pixel of both images. The scatterplot thus obtained was used to select the pixels that display the highest levels of both green and red. These pixels, which correspond to a significant labeling of both species, were shown in white relative to all the other pixels.
Electron Microscopy
For classical studies, ultrathin sections (80 nm) were counterstained with lead citrate and uranyl acetate. For the specific staining of DNA, ultrathin sections were mounted on gold grids and stained with the Feulgen-like osmiumammine reaction as earlier described (Derenzini et al. 1982). All ultrathin sections were observed with a 200 CX electron microscope at 100 kV (JEOL). Sections 0.5 μm or 2 μm in thickness were observed in a medium voltage CM30 electron microscope working at 250 kV in the STEM mode (Philips), as described previously (Beorchia et al. 1992; Héliot et al. 1997; Cheutin et al. 2002). Before starting a tilt series, the whole-mounted cells were irradiated for 10 min at 100 e−/(Å2 × sec). After correcting the axis alignment of the eucentric goniometer stage, each tilt series was collected from −60° to +60° with a pitch of 2°. Images were directly recorded on a disk-type scintillator-photomultiplier detector system and digitized on line using Orion hardware (ELI; Brussels, Belgium), working on a PC. Images (512 × 512 pixels) with a high signal-to-noise ratio were collected using low-speed scanning, in contrast to the focus, which was realized at high-speed scanning.
Three-dimensional Reconstructions
Files corresponding to z series acquired by confocal microscopy were transferred to a Sun Sparc20 workstation (Sun Microsystems; Tucson, AZ) for processing, which was performed using the Analyze software (CNSoftware; Southwater, UK) (Klein et al. 1998). Volumes were re-sampled to have an identical pixel size in x, y, and z directions and a (3 × 3 × 3)-cubic median filter was applied to decrease the noise within images. For projections acquired by STEM, the contrast of digital images was reversed. Image alignment was achieved by translating images in x and y directions relative to a fiducial marker, using a sinogram technique (Bahr et al. 1979). Due to the parallel imaging system of the STEM, image translation had no consequence on the 3D reconstruction. Next, the 512 × 512 images were converted to 256 × 256 ones, and tomographic reconstruction was performed by using an extended, field-additive algorithmic reconstruction technique on lined-up images, as described (Crowther et al. 1970; Gordon et al. 1970). For each slice of the volume, seven iterations were computed on a Sun Sparc20 workstation.
Three-dimensional Visualization
The same three-dimensional visualization tools were applied to volumes obtained by confocal microscopy or STEM studies. Two visualization processes were used, both based on ray-tracing methods. The first method allows the ray to pass through the whole volume, and the resulting pixel reflects the intensity of the most intense voxel encountered by the ray. By scanning all the volume with the ray, a projection is obtained that allows a volume visualization accounting for differences in signal intensity. This type of 3D visualization was performed with the Analyze Software package. In the second method, the ray is reflected when it meets a voxel that has an intensity superior to a threshold. In contrast to the first method, it leads to a surface visualization that allows a detailed analysis of the surface of the labeling. In this case, Visuvoxel (Lucas et al. 1996), a software package developed in our laboratory, was used on a Sun Sparc20 workstation.
Results
Confocal Microscopy Analyses
The 3D organization of pKi-67 in A549 cells was studied by confocal microscopy with a FluoroNanogold probe through its fluorescent dye (FITC). Series of optical sections (z series) were acquired within the whole nuclear volume. Selected examples are displayed in Figure 1. For distal sections collected at the bottom (Figure 1A) or at the top of the volume (Figure 1E), several clusters of bright spots were seen in the central part of the nucleus. In sections extracted from the middle of the z series, the labeling formed a cord localized around the nucleolus (Figures 1B-1D). At the level of resolution of the confocal microscope (in the range of 200 nm in x and y directions), the cord measures approximately 300 nm. The projection of the volume reconstructed from all the sections of the z series revealed that pKi-67 is mainly distributed around the nucleolus and that discrete spots are located in the nucleoplasm and along the nuclear envelope (Figure 1F). To observe the distribution of pKi-67 within the cell thickness, an orthogonal section was performed along the axis defined by the arrow in Figure 1C (Figure 1G). This view confirmed that the labeling is distributed among several cords (∼300 nm in thickness) surrounding unlabeled zones. A few protrusions emanating either from the top (arrows) or the bottom (arrowheads) of the cords were clearly seen (Figure 1G). Their localization, corresponding to the bright spots observed in the distal sections (Figure 1A and 1E), revealed a point of contact between a part of pKi-67 and the nuclear envelope (arrows and arrowheads, Figure 1G). Orthogonal sections were also performed in the (x, z) plane along the axis indicated by arrowheads in Figure 1G (Figures 1H-1J). Again, pKi-67 was visualized as an almost continuous cord from which some protrusions were directed towards the nuclear envelope (arrows, Figure 1I). The entire volume, displayed as a stereopair with a surfacic rendering mode, revealed the external organization of pKi-67 (Figure 2A). A focus of the area framed in Figure 1C shows a complex and irregular surface composed of many intertwined fibers (Figure 2B). Many protrusions are clearly evidenced. This volume was cut in half and its internal structure appeared as fibers surrounding a large cavity (Figure 2C). The labeling is not homogeneous, as indicated by the presence of several holes in the split view. Overall, these tomographic results show that pKi-67 is arranged in a contorted cord, forming a shell around the nucleoli.
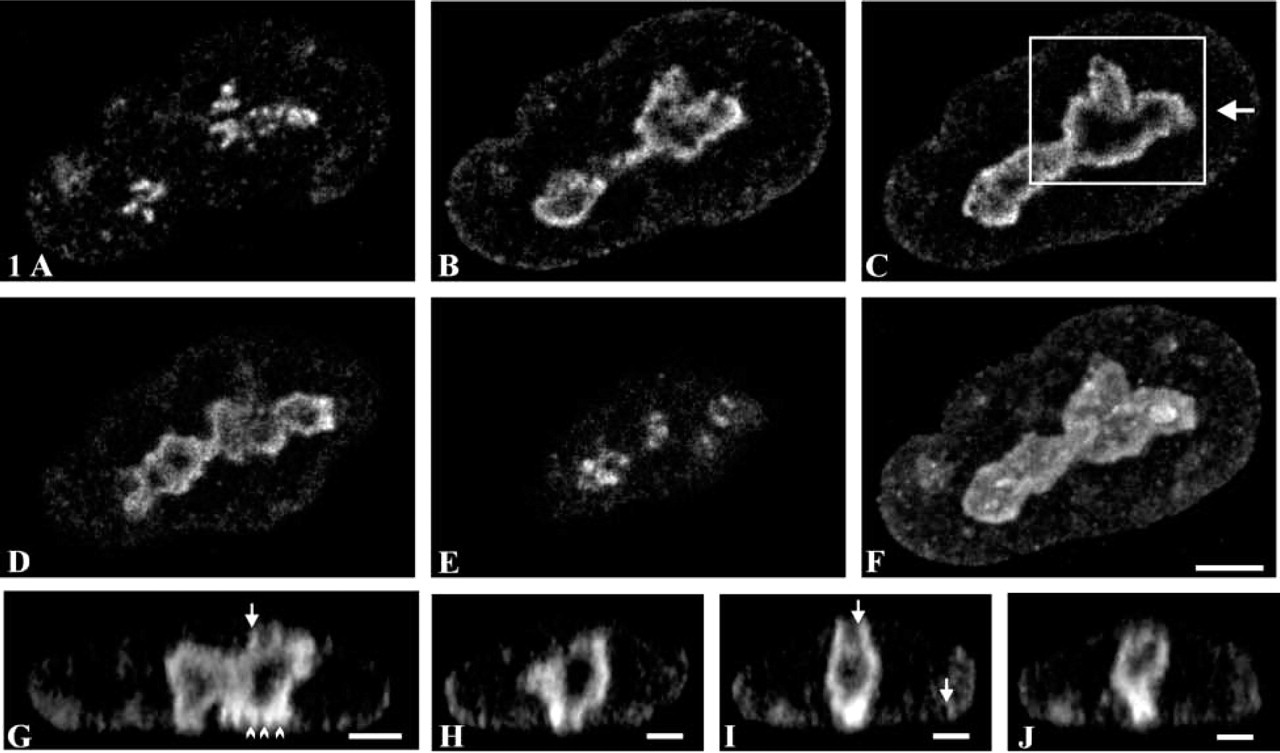
Spatial distribution of the Ki-67 protein observed by confocal microscopy. After fixation of A549 cells, the Ki-67 antigen was detected by immunolabeling with a specific antibody, revealed by steptavidin-FluoroNanogold. The fluorescent dye of the probe (FITC) was visualized with a confocal microscope. (
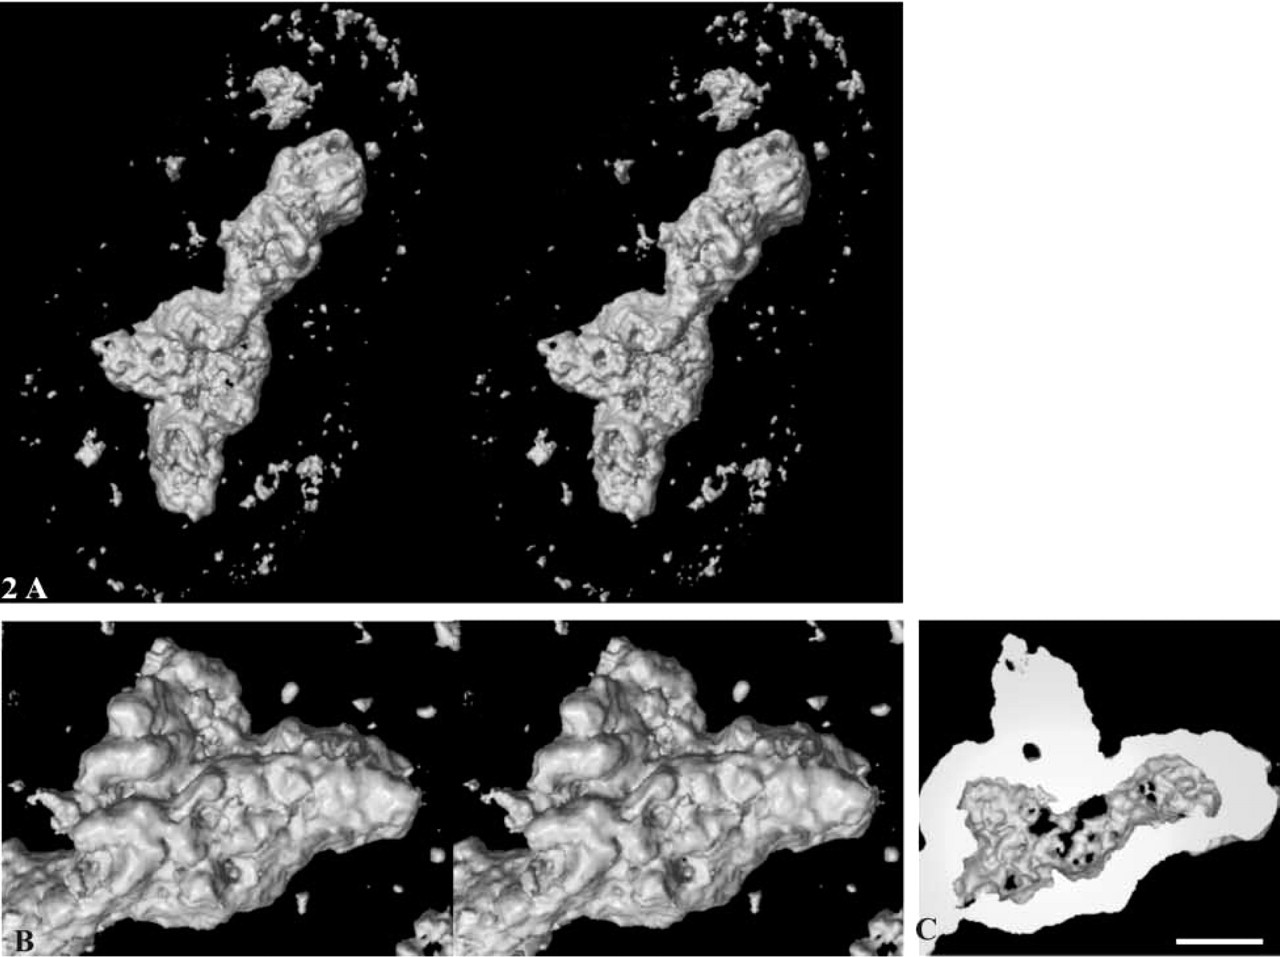
Surface visualization of pKi-67. A surface mode was applied to the volume data shown in Figure 1. (
Simultaneous Localization of pKi-67 and DNA
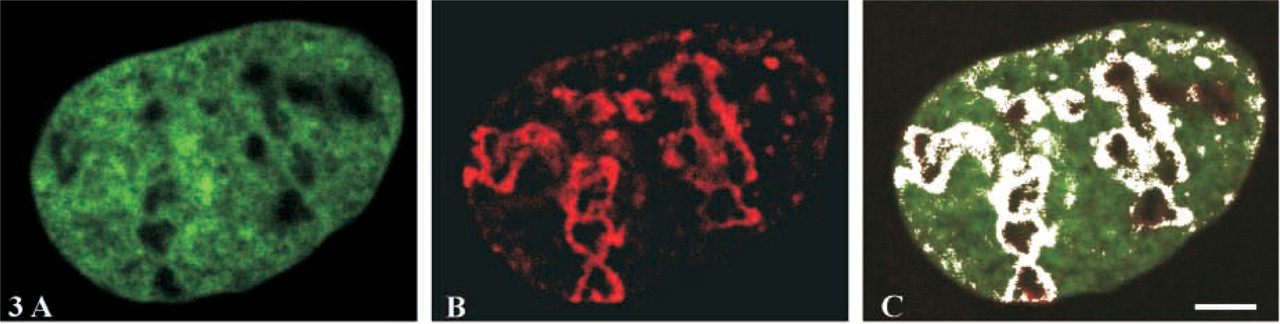
The distribution of pKi-67 (Figure 3B) relative to DNA stained by chromomycin A3 (Figure 3A) was analyzed by confocal microscopy. Single optical sections and an accurate picture of the co-localization pattern (appearing in white on Figure 3C) showed that pKi-67 almost entirely co-localizes with DNA in the nucleolar periphery. Moreover, the two signals also co-localize in small spots along the nuclear envelope.
Ultrastructural Localization of DNA with the Feulgen-like Osmium-ammine Reaction
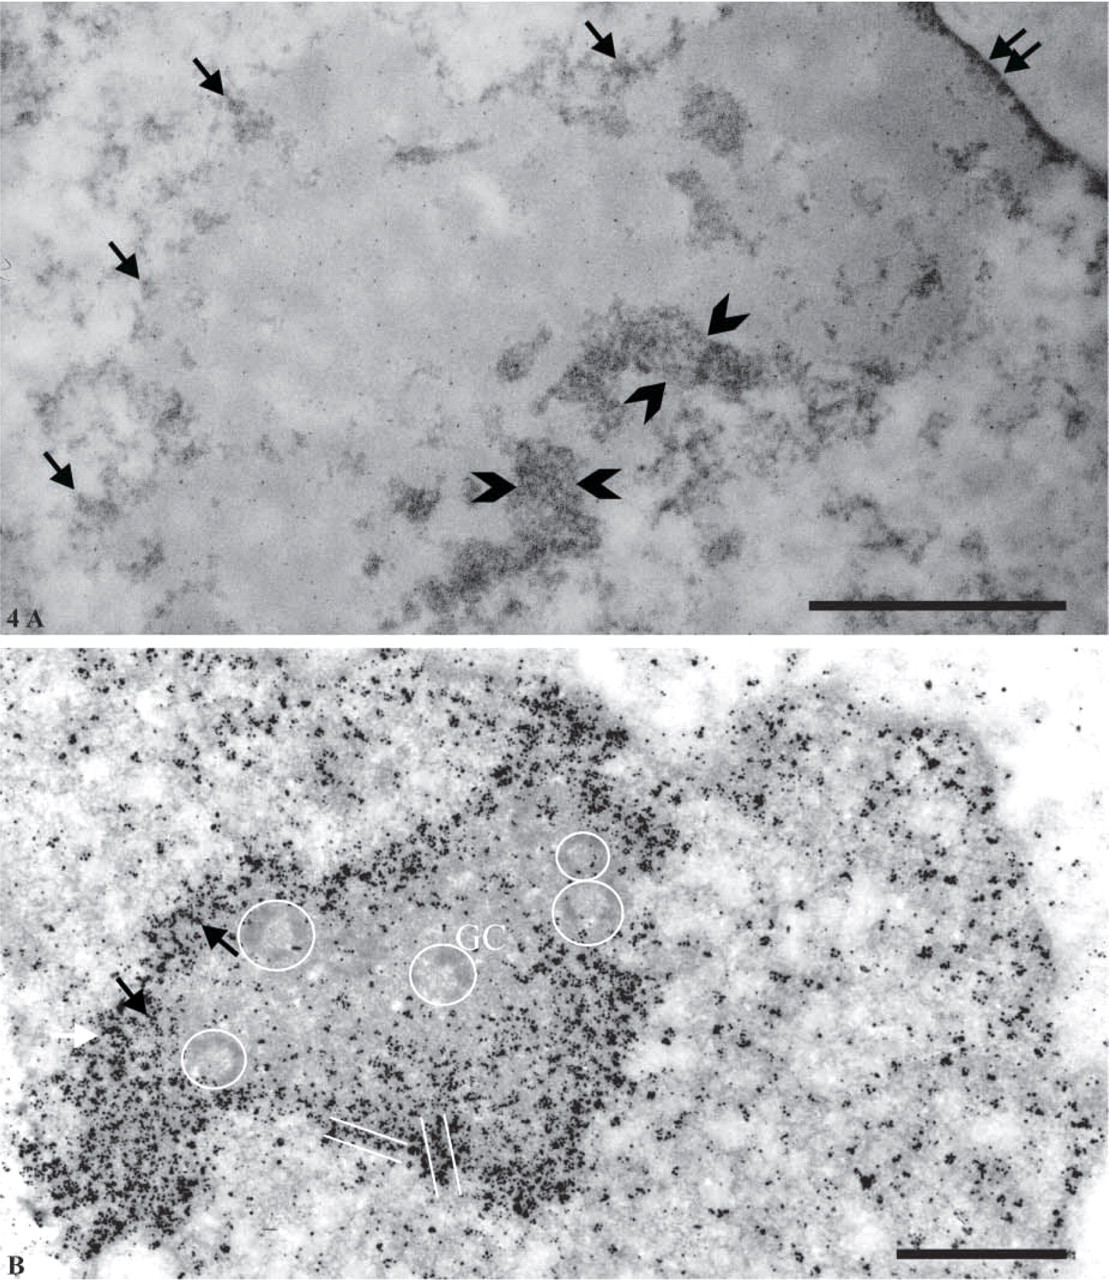
By using this specific staining, DNA molecules were strongly contrasted relatively to the nucleolus (Figure 4A). DNA appeared as small irregular clumps dispersed in the nucleoplasm. Around the nucleolus, a continuous but irregular shell of DNA was clearly evident (arrows). In some areas, perinucleolar DNA clumps were thicker (approximately 250 nm thick; bracketed by arrowheads). A 50-nm-thick layer of DNA separating the nucleolus and the nuclear envelope was also well evidenced (double arrow).
Ultrastructural Localization of pKi-67
The ultrastructural localization of pKi-67 was then investigated. Highly sensitive immunolocalization of pKi-67 was performed before embedding by revealing the primary antibodies with FluoroNanogold complexes further enhanced with silver (Cheutin et al. 2002). Counterstained ultrathin sections allowed clear identification of typical nucleolar components, such as the fibrillar centers (FCs) surrounded by the dense fibrillar component (DFC) (circles associate both components) and the granular component (GC) (Figure 4B). In the nucleolus, FCs, DFC, and GC were almost totally devoid of pKi-67. Most of the labeling was found at the periphery of the nucleoli, where the perinucleolar condensed chromatin is located. Most silver-gold particles were organized in small clusters, which in some places seemed to form short threads ∼50 nm in diameter (arrows and parallel lines). The nucleoplasmic labeling was sparse and was always found in close association with chromatin.
STEM Analysis of pKi-67 in 2-μm-thick Sections
We further investigated the 3D organization of pKi-67 by using a STEM working at 250 kV. Thick sections (2 μm) containing pKi-67-immunolabeled cells before embedding were observed to perform electron tomography on large subvolumes of the nucleolus. In Figures 5A-5E, five projections from a tilt series show the nucleolus from a transverse view (-40°) to a front view (+ 40°), indicating that its whole thickness is visualized during tilting. Clearly, the nucleolar peripheral regions are more intensely stained and show the presence of a cord 250–300 nm in diameter (bracketed by arrowheads, Figures 5A-5D). Some labeled areas were in close proximity to the nuclear envelope (arrows, Figure 5E). A weak perinuclear labeling corresponding to small nucleoplasmic heaps was also observed. The combination of all the projections of a tilt series allowed the generation of a digital volume (i.e., a tomogram) after alignment and tomographic reconstruction. To validate this reconstruction, a projection at 0° was calculated (Figure 5F) and compared to its initial projection (Figure 5C). To study the internal distribution of pKi-67, digital sections were performed in the tomogram (Figures 5G-5I). In these virtual sections, pKi-67 formed cords (bracketed with arrowheads, Figure 5H and 5I) surrounding an unlabeled central area, as already observed in optical sections (Figure 1). The thickness of the cords was relatively constant (250–300 nm) and many protrusions emanating from the cords were in direct contact with the nuclear envelope (arrows). A closer examination of these images revealed that the cords and the protrusions consisted of 30–50-nm-thick fibers, (frame, Figure 5G and 5H). In some areas these fibers appeared as straight segments 500 nm in length (frame, Figure 5G), whereas in others they were twisted (frame, Figure 5H).
Comparative study of the distribution of pKi-67 and DNA. (
Ultrastructural localization of DNA with the Feulgen-like osmium-ammine reaction (
STEM Observation of pKi-67 in 0.5-μm-thick Sections
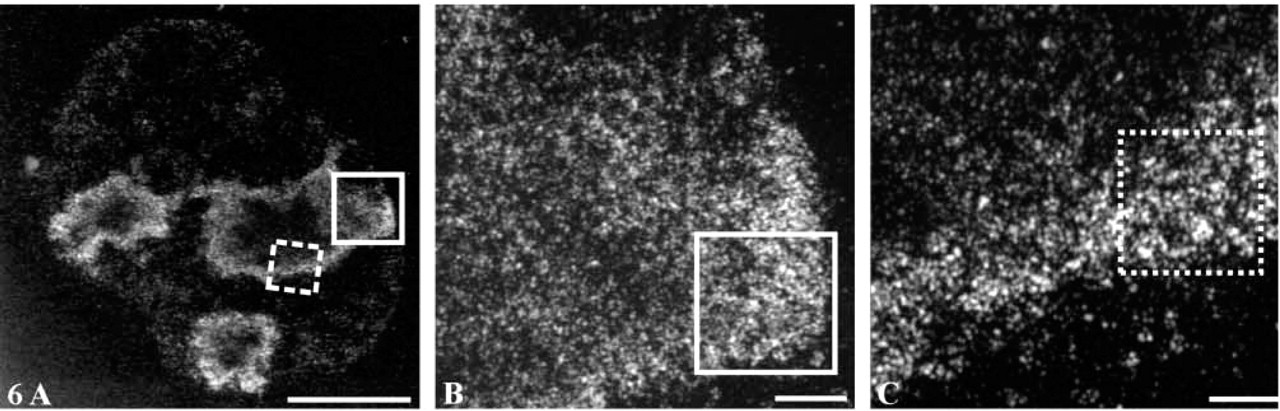
Although the resolution obtained by STEM was higher than that obtained in the optical studies (compare Figure 5 to Figure 1 and 2), the thickness of the sample prevented visualization of the fine structures. To overcome this problem, 0.5-μm-thick sections were observed by STEM and 3D tomograms were reconstructed for 10 different nucleoli. At low magnification the labeling displayed an organization similar to that observed in optical sections and in 2.0 μm-thick-sections (Figure 6A). However, at higher magnification the resolution was greatly improved due to the decrease in thickness. Two typical areas (frames, Figure 6A) are shown at high magnification. They correspond either to a protrusion in the vicinity of the nuclear envelope (Figure 6B) or to a portion of the perinucleolar cord (Figure 6C). In all cases, we observed a clear fibrillar organization, although the network was much denser in the vicinity of the nuclear envelope.
To further increase our comprehension of their structural features and to tentatively individualize the gold-silver particles, two series of projections were extracted from the areas framed in Figure 6B and 6C. The corresponding tomograms were reconstructed and used to perform either projections of the whole volume at different angles (Figures 7A-7E and Figures 8A-8E), digital sections in the (x, y) plane for the projection obtained at 0° (Figures 7F-7H and Figures 8F-8H), or stereopairs calculated with a surfacic visualization mode (Figures 7I and 8I). Although the protrusions in contact with the nuclear envelope (Figure 7) and the perinucleolar areas (Figure 8) were composed of fibers ∼30-50 nm in diameter, their 3D organizations were different. In the protrusions, pKi-67 was distributed within parallel fibers, which were particularly visible at certain view angles (arrows, Figure 7B). Their orientation was perpendicular to the axis of the cord formed by the labeling. Digital sections revealed their internal organization, in which some of the fibers clearly displayed a free extremity directed towards the inner part of the nucleolus (arrows, Figure 7F-7H). By using a surface visualization, the 3D disposition of these fibers was clearly visible (stereopair, Figure 7I). In contrast, the cord located in the perinucleolar area, although still consisting of 30–50-nm-thick fibers, was narrower. The fibers were sometimes difficult to see because they were tangentially disposed with respect to the cord axis (semicircles, Figure 8A). They appeared more clearly on transverse sections (circles, Figures 8E-8H) and on stereopairs using a surface visualization (Figure 8I). These tomographic studies showed that the fibers were homogeneously localized throughout the whole thickness of the labeling and that they were regularly spaced (∼100 nm distance between fibers measured in 10 different nucleoli).
Discussion
Many biochemical studies indicate that pKi-67 not only interacts with chromatin (Endl and Gerdes 2000) but is indeed a chromatin-binding protein that resides in heterochromatic regions (Lopez et al. 1994; Takagi et al. 1999; Kreitz et al. 2000). This is also supported by the finding that pKi-67 binds preferentially to supercoiled chromatin rather than to single- or double-stranded DNA (MacCallum and Hall 2000). Moreover, a recent study has demonstrated that the small non-histone heterochromatin protein 1 (HP1) interacts with the C-terminal portion of pKi-67 (Kametaka et al. 2002; Scholzen et al. 2002). Therefore, pKi-67 appears to be an intrinsic tracer that can be used to localize a well-defined heterochromatin domain in proliferating cells and to study its 3D organization.
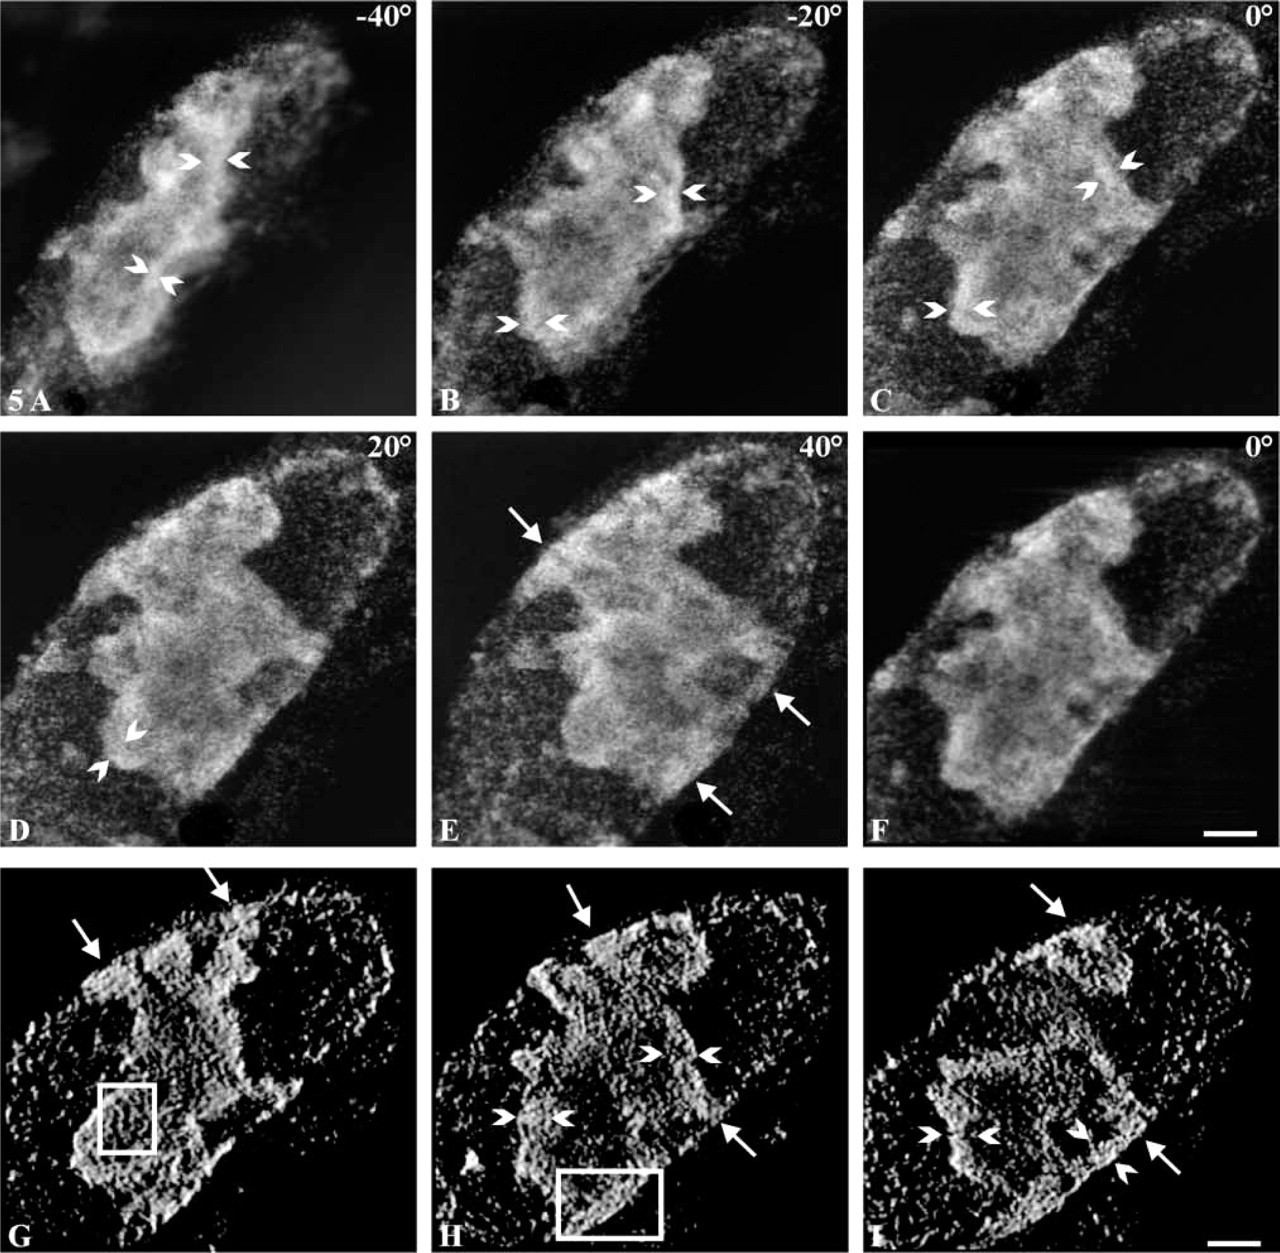
Electron tomography analysis of Ki-67 protein. Thick sections (2 μm) in which pKi-67 molecules were immunodetected before embedding were analyzed with an STEM working at 250 kV. Image contrast was reversed for convenience. (
Electron tomography performed on a 0.5-μm-thick section. (
Light and electron microscopy visualization of higher-order chromatin structures is complicated by their tightly folded and coiled nature (Kornberg and Lorch 2002). However, different strategies, including cryoelectron microscopy of isolated chromatin fibers (Bednar et al. 1998), medium-voltage electron microscopy to investigate thick sections of nuclei (Belmont et al. 1999), and approaches based on both optical sectioning and immunoelectron microscopy (Tumbar et al. 1999), proved to be extremely useful in this field.
In the present study the precise 3D distribution of pKi-67 and its different levels of organization have enabled us to indirectly obtain a detailed structure of a specific heterochromatin domain, as performed previously with other proteins binding these regions (Woodcock and Dimitrov 2001).
To achieve our goal, we used an electron-dense probe linked to a fluorescent dye, FluoroNanogold (FNG). By use of this probe, the same sample can be observed at different resolutions by confocal microscopy (200-nm resolution), electron tomography (10-nm resolution), and conventional electron microscopy (1-nm resolution). The use of streptavidin-FNG before embedding greatly increases the sensitivity of antigen detection compared to classical methods using 5–10-nm gold particles on the surface of ultrathin sections (Hainfeld and Furuya 1992; Hainfeld and Powell 2000), and reveals very precisely the location and size of the structures containing antigens without altering their organization (Robinson and Vandré 1997; Baschong and Stierhof 1998; Robinson et al. 2000). This detection process preserves the nuclear structure (Humbel et al. 1998) and more particularly the nucleolar ultrastructure, as seen on ultrathin sections in our present and previous studies (Cheutin et al. 2002).
Previous optical studies have reported that pKi-67 is found either in the cortex of the nucleoli (Kill 1996) or at the periphery of the nucleolus (O'Donohue et al. 1998; Endl and Gerdes 2000). Moreover, several ultrastructural studies have localized pKi-67 in small nucleoplasmic spots, in the cortex of the nucleoli, in the granular component (GC), or in the dense fibrillar component (DFC) of the nucleolus (van Dierendonck et al. 1989; Verheijen et al. 1989; Isola et al. 1990). In the present study the comparison of double labeling of pKi-67 and DNA observed by confocal microscopy and of pKi-67 observed on ultrathin sections demonstrates that pKi-67 co-localizes with perinucleolar-located DNA and, to a lesser extent, with DNA near the nuclear envelope. These results unequivocally exclude the possibility of pKi-67 localization within the nucleolar components FC, DFC, and GC, which are known as the sites for rRNA synthesis and for early and late processing, respectively (Thiry and Goessens 1996). By using the same experimental conditions, we were recently able to localize GFP-tagged proteins within the FC and DFC (unpublished results). These latter results indicate that the absence of pKI-67 in these nucleolar components is due to the absence of pKi-67 and not to a problem of penetration of reagents.
By using electron tomography on the same specimens, i.e., tilting of thick sections, volume reconstruction, virtual sectioning, and 3D visualization, our study clearly revealed two levels of organization of pKi-67, i.e., 30–50-nm-thick fibers organized as a cord 250–300 nm in diameter. These fibers seem to be polarized because the side of the cord directed toward the nucleolus is less densely organized than the nucleoplasmic side. This polarization is also suggested by the presence of fibers with free extremities in the inner part of the cord and by their parallel alignment in some places, which correlates with various levels of compaction within the cord itself.
These data strongly suggest that pKi-67 is involved in the higher-order organization of perinucleolar chromatin. Indeed, the 30–50-nm thick fibers are reminiscent of the first level of chromatin packaging, in which adjacent nucleosomes fold into a 30-nm structure that has been described both as a solenoid (Belmont et al. 1999) and as a zigzag conformation (Bednar et al. 1998). On the other hand, the 250–300-nm cord is similar to a level of chromatin folding found in both late-replicating heterochromatic homogeneously staining regions (HSRs), which are several hundreds of mega-base pairs in size (Belmont et al. 1999), and in living cells (Sadoni et al. 2001).
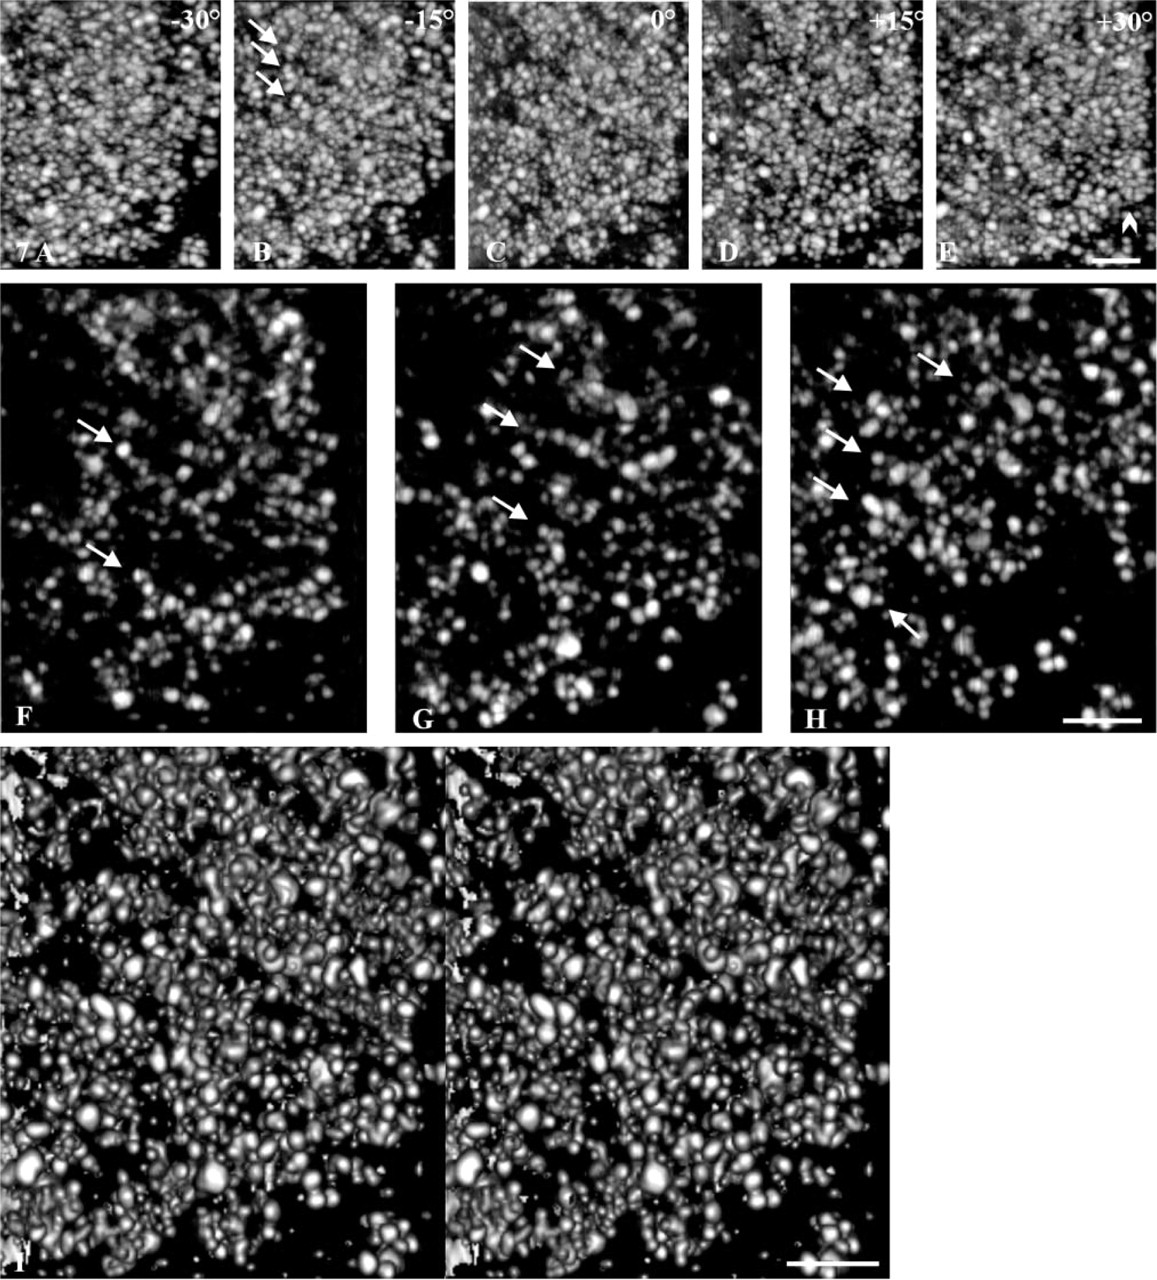
Internal organization of a protrusion revealed by electron tomography. (
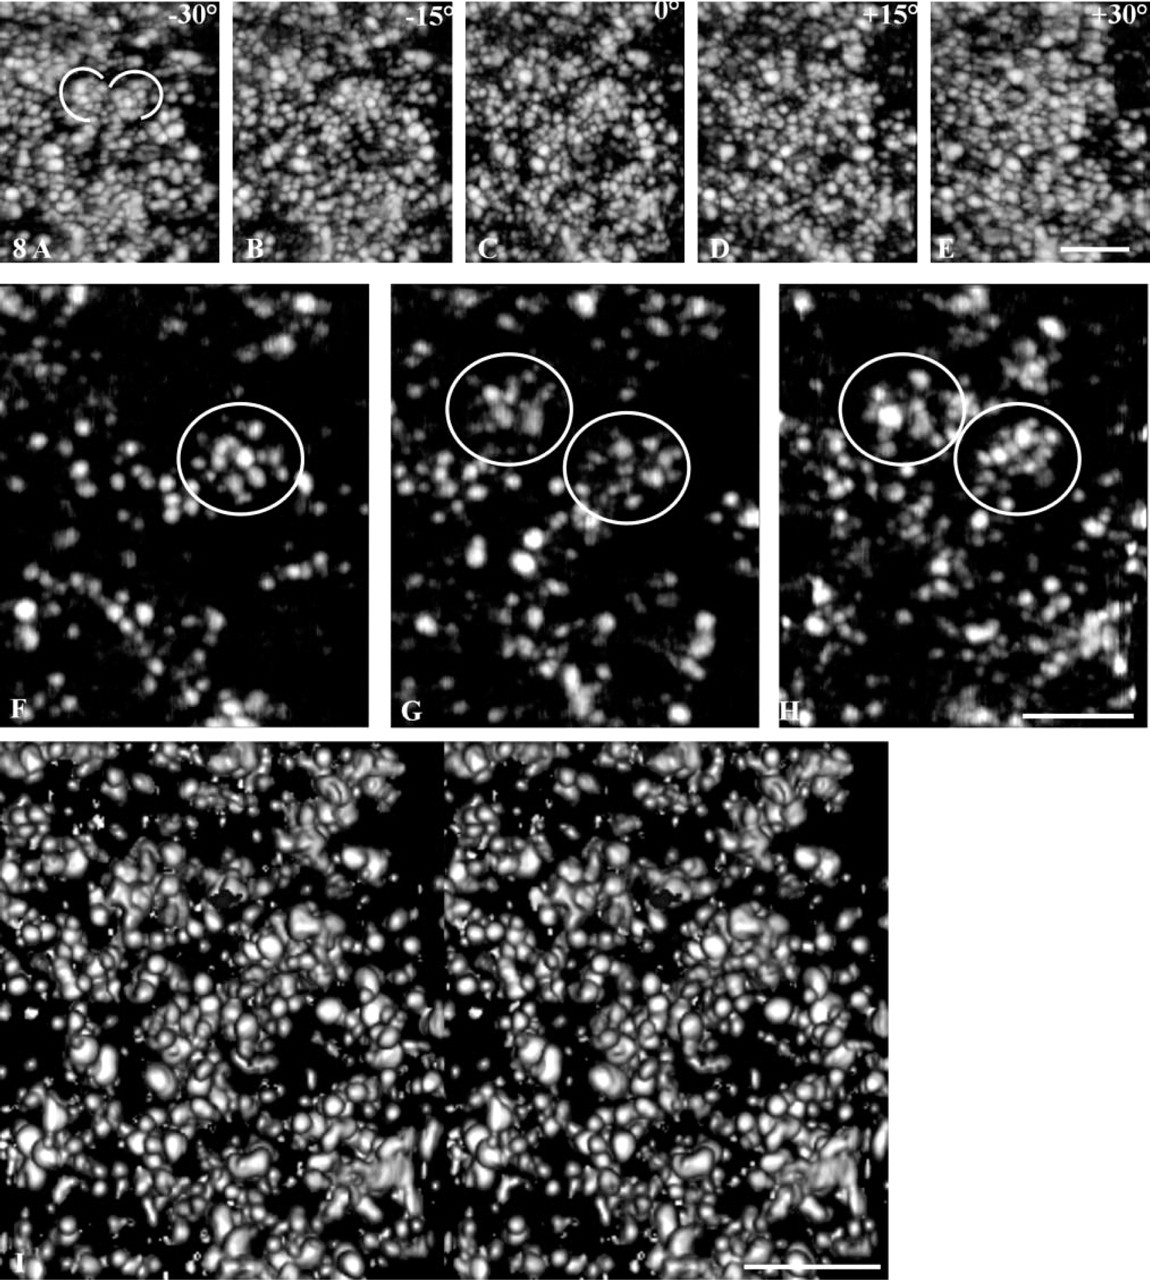
Internal organization of the perinucleolar cord revealed by electron tomography. (
In addition, we found some fibers in close proximity to the nuclear envelope, suggesting an intimate association with pKi-67, which is also supported by structural data. Indeed, the Ki-67 consensus motif is believed to adopt an α-helical structure with a typical amphophilic arrangement, which may favor its association with membranes such as the nuclear envelope (Duchrow et al. 1994; Kourmouli et al. 2000). To specify the link between pKi-67 and HP1, Scholzen et al. (2002) have shown that overexpression of HP1 leads to a relocation of endogenous pKi-67 from the periphery of the nucleolus to sites containing HP1. However, this had no consequence on the nucleolar organization. Interestingly, this result confirms that pKi-67 is not directly involved in the synthesis and processing of rRNAs, because G0 cells do not express pKi-67 although the nucleoli are active (Bridger et al. 1998; Endl and Gerdes 2000). However, when cells re-engaged within the cell cycle, nucleoli and heterochromatin undergo a complete reorganization (Derenzini et al. 1990), which is concomitant with the reactivation of pKi-67 expression. In addition, it has been demonstrated that in S and G2 cells pKi-67 co-localizes only with centromeres of acrocentric chromosomes, i.e., chromosomes bearing potentially active rRNA genes segregated in the nucleolar organizer regions (NORs) and actively transcribed within the nucleolus after mitosis (Bridger et al. 1998). Taken together, these findings suggest that pKi-67 may be involved in the organization of heterochromatin surrounding rRNA genes that are actively transcribed within the nucleolus after G0 exit (Lopez et al. 1991; Landberg and Roos 1993), or more generally when the cell is cycling (Endl and Gerdes 2000; Traut et al. 2002).
Here we demonstrated that by using the same marker, FluoroNanogold, it is possible to perform a comparative 3D confocal and electron tomography study of a very abundant nuclear protein such as pKi-67. This work confirmed the usefulness of such an approach to study the volume organization of the nucleus and more particularly of the nucleolus (Cheutin et al. 2002). Finally, preliminary studies (unpublished results) demonstrated that electron tomography of GFP-tagged nucleolar proteins is possible and could be correlated to spatiotemporal studies of proteins in living cells.
Footnotes
Acknowledgements
Supported by grants from ARERS, ARC (contract no. 4497), Ligue Régionale de l'Aube Contre le Cancer and Ligue Régionale de la Marne Contre le Cancer to D.P.
We are grateful to Dr Tom Misteli and Dr Mike O'Donohue for their critical reading of the manuscript.