
Abstract
We previously demonstrated that quantitative immunohistochemistry (Q-IHC) performed by measuring the cumulative signal strength of the digital file encoding an image can be used to determine the absolute amount of chromogen present per pixel. We now show that Q-IHC so performed can be used to accurately determine the amount of peptide hormone receptor of interest in archived tissues. To do this we transfected Balb 3T3 fibroblasts with the cDNA encoding the human receptor for gastrin-releasing peptide (GRP), and selected six cell lines stably expressing between 102 and 106 receptors/cell. These cell lines were fixed in formalin, embedded in paraffin, and treated with antipeptide antibodies against the GRP receptor, followed by DAB chromogen to identify bound antibody. Images were acquired using a 4.9 million pixel digital scanning 24-bit RGB camera, saved in TIFF format, and used for subsequent analysis. Q-IHC was performed after digitally dissecting out the relevant portion of the image for analysis, and processing using a program written in C (available at http://www.uic.edu/com/dom/gastro/Freedownloads.html). Under the conditions defined here, chromogen quantity as determined by Q-IHC tightly correlated with GRP receptor number (r2=0.867) in these cell lines. Using the conversion factor identified as a result of these studies, we then determined GRP receptor number on eight randomly selected, archived human colon cancers. Overall GRP receptor expression in colon cancer depended on the degree to which cells within any particular tumor were differentiated, with well-differentiated cells expressing the greatest numbers of receptors (∼55,000 ± 10,000 sites/cell). These studies indicate that Q-IHC can be used to determine receptor quantity in archived tissues and other samples of limited quantity.
D
Although our previously published algorithm for Q-IHC provided the basis for quantifying the absolute amount of chromogen present per pixel (Matkowskyj et al. 2000), the initial description of this technique suffered from a number of limitations that minimized its general utility. Specifically, our initial description of Q-IHC was restricted to evaluating small and perfectly square regions (generally 100 × 100 pixels in size) within any particular image. The requirement that such small regions be evaluated resulted in a situation in which it was not possible to evaluate structures such as nuclei, and in which the decision as to what regions were selected for analysis introduced the possibility of observer bias. Most importantly, however, no data were provided as to whether the amount of chromogen, as determined using our algorithm, correlated with the amount of receptor detected immunohistochemically.
Here we provide an improved algorithm for performing Q-IHC. Similar to what we previously demonstrated, this technique relies on calculating the cumulative signal strength [or mathematical energy, E
Materials and Methods
Reagents
We contracted with Research Genetics (Huntsville, AL) to generate a rabbit antipeptide antibody to the gastrin-releasing peptide receptor using the same epitope as previously described (Kusui et al. 1994). This was done so that a portion of this antibody could be affinity-purified and directly conjugated to horseradish peroxidase (HRP-conjugated) by Research Genetics. This allowed us to eliminate signal amplification as occurs when secondary antibodies and the avidinbiotin complex (ABC) are used. Immunohistochemical reagents including Antigen Retrieval Buffer, Large Volume DAKO LSAB(R)2 Kit, and DAKO Liquid DAB Substrate-Chromogen System were purchased from DAKO (Carpinteria, CA). Balb 3T3 cells were obtained from ATCC (Rockville, MD), and all tissue culture reagents were purchased from Fisher Scientific (Hanover Park, IL). The vector pcDNA2.1 was purchased from Invitrogen (Carlsbad, CA), and radionucleotides were obtained from Amersham (Arlington Heights, IL). All other reagents were obtained from Sigma (St Louis, MO) and were reagent grade purity.
Creation of Stable Cell Lines Expressing GRP-R
BALB 3T3 fibroblast cells were stably transfected using a full-length human GRP receptor cDNA. The receptor was subcloned into a modified version of the pcDNA2.1 plasmid using Lipofectamine (Sigma) according to the manufacturer's instructions. Stable transfectants were isolated in the presence of 800 μg/ml aminoglycoside G-418 and ultimately selected by binding studies. Stable cell lines were maintained in DMEM containing 10% fetal bovine serum and 270 μg/ml G-418.
Binding Studies
[125I-Tyr4]-bombesin (2000 Ci/mmol) was prepared using IODO-GEN and purified using high pressure liquid chromatography as previously described (Benya et al. 1995). Binding studies were performed by suspending 3 × 10⁶ of disaggregated cells/ml in binding buffer containing [125I-Tyr4]-bombesin for 30 min at 22C. Nonsaturable binding of radiolabeled peptide was defined as the amount of radioactivity associated with cells incubated with 1 μM bombesin. Nonsaturable binding was <10% of total binding in all experiments. Receptor number was determined by Scatchard analysis of the binding data using the least squares regression program LIGAND (Muson and Robard 1980).
Immunohistochemical Technique
Immunohistochemistry was performed using two different methods on six cell lines and eight resected colon cancers that were obtained between 1985 and 1997. In the first method, a three-stage indirect immunoperoxidase technique was performed on 5-μm-thick paraffin-embedded sections that were hydrated in graded alcohols and rinsed in a running water bath. Slides were incubated for 15 min at 100C in antigen retrieval buffer, followed by incubation for 5 min in a 3% hydrogen peroxide solution to quench endogenous peroxidase activity. Slides were washed in Tris-buffered saline (TBS) and the sections incubated for 1 hr with a 1:750 dilution of the primary GRP-R antibody. After rinsing with TBS, the slides were incubated with biotinylated IgG for 15 min, rinsed, and then incubated with streptavidin conjugated to horseradish peroxidase (i.e., ABC complex; DAKO) for 15 min. Sections were rinsed and incubated with Liquid DAB Substrate-Chromogen System for 5 min to identify bound antibody. After a final wash in TBS and distilled water, the slides were counterstained with a 50% dilution of Gills’ hematoxylin for 1 min, dehydrated in alcohol, and mounted with a coverslip using Permount.
To evaluate the effect of direct conjugation, we eliminated any signal amplification as occurs in using the ABC complex, by using a GRP receptor primary antibody that was directly conjugated to horseradish peroxidase (HRP). In this approach, slides from cells and resected tissue were treated with a 1:800 dilution of the HRP-conjugated GRP-R antibody. The biotinylated anti-rabbit IgG and streptavidin steps were omitted and the bound antibody was directly visualized after a 5-min incubation with Liquid DAB Substrate. Sections were stained using a 50% dilution of Gills’ hematoxylin for 1 min, dehydrated in alcohol, and mounted with a coverslip. As before, control tissues were processed simultaneously as the treated slides, with the exception that primary antibody was not applied.
Digital Image Capture
All photomicrographs were obtained using a SPOT RT Digital Scanning Camera from Diagnostic Instruments (Sterling Heights, MI) at X1000 magnification. Files were saved in uncompressed TIFF format so that their sizes ranged between 20 and 25 MB. When a portion of the original image file was selected for further evaluation, the size of the modified file ranged from 1 to 20 MB, depending on the amount of image being evaluated by Q-IHC. This camera captured light with a high signal-to-noise ratio (60 dB), significant temperature stability (±1C per 8-hr period), and minimal dark current (0.15e/p/s at −12C). These specifications indicate that there was minimal background noise over time and in the absence of light.
Quantification of Immunohistochemical Chromogen
The amount of antibody staining was quantified by calculating the mathematical energy (E
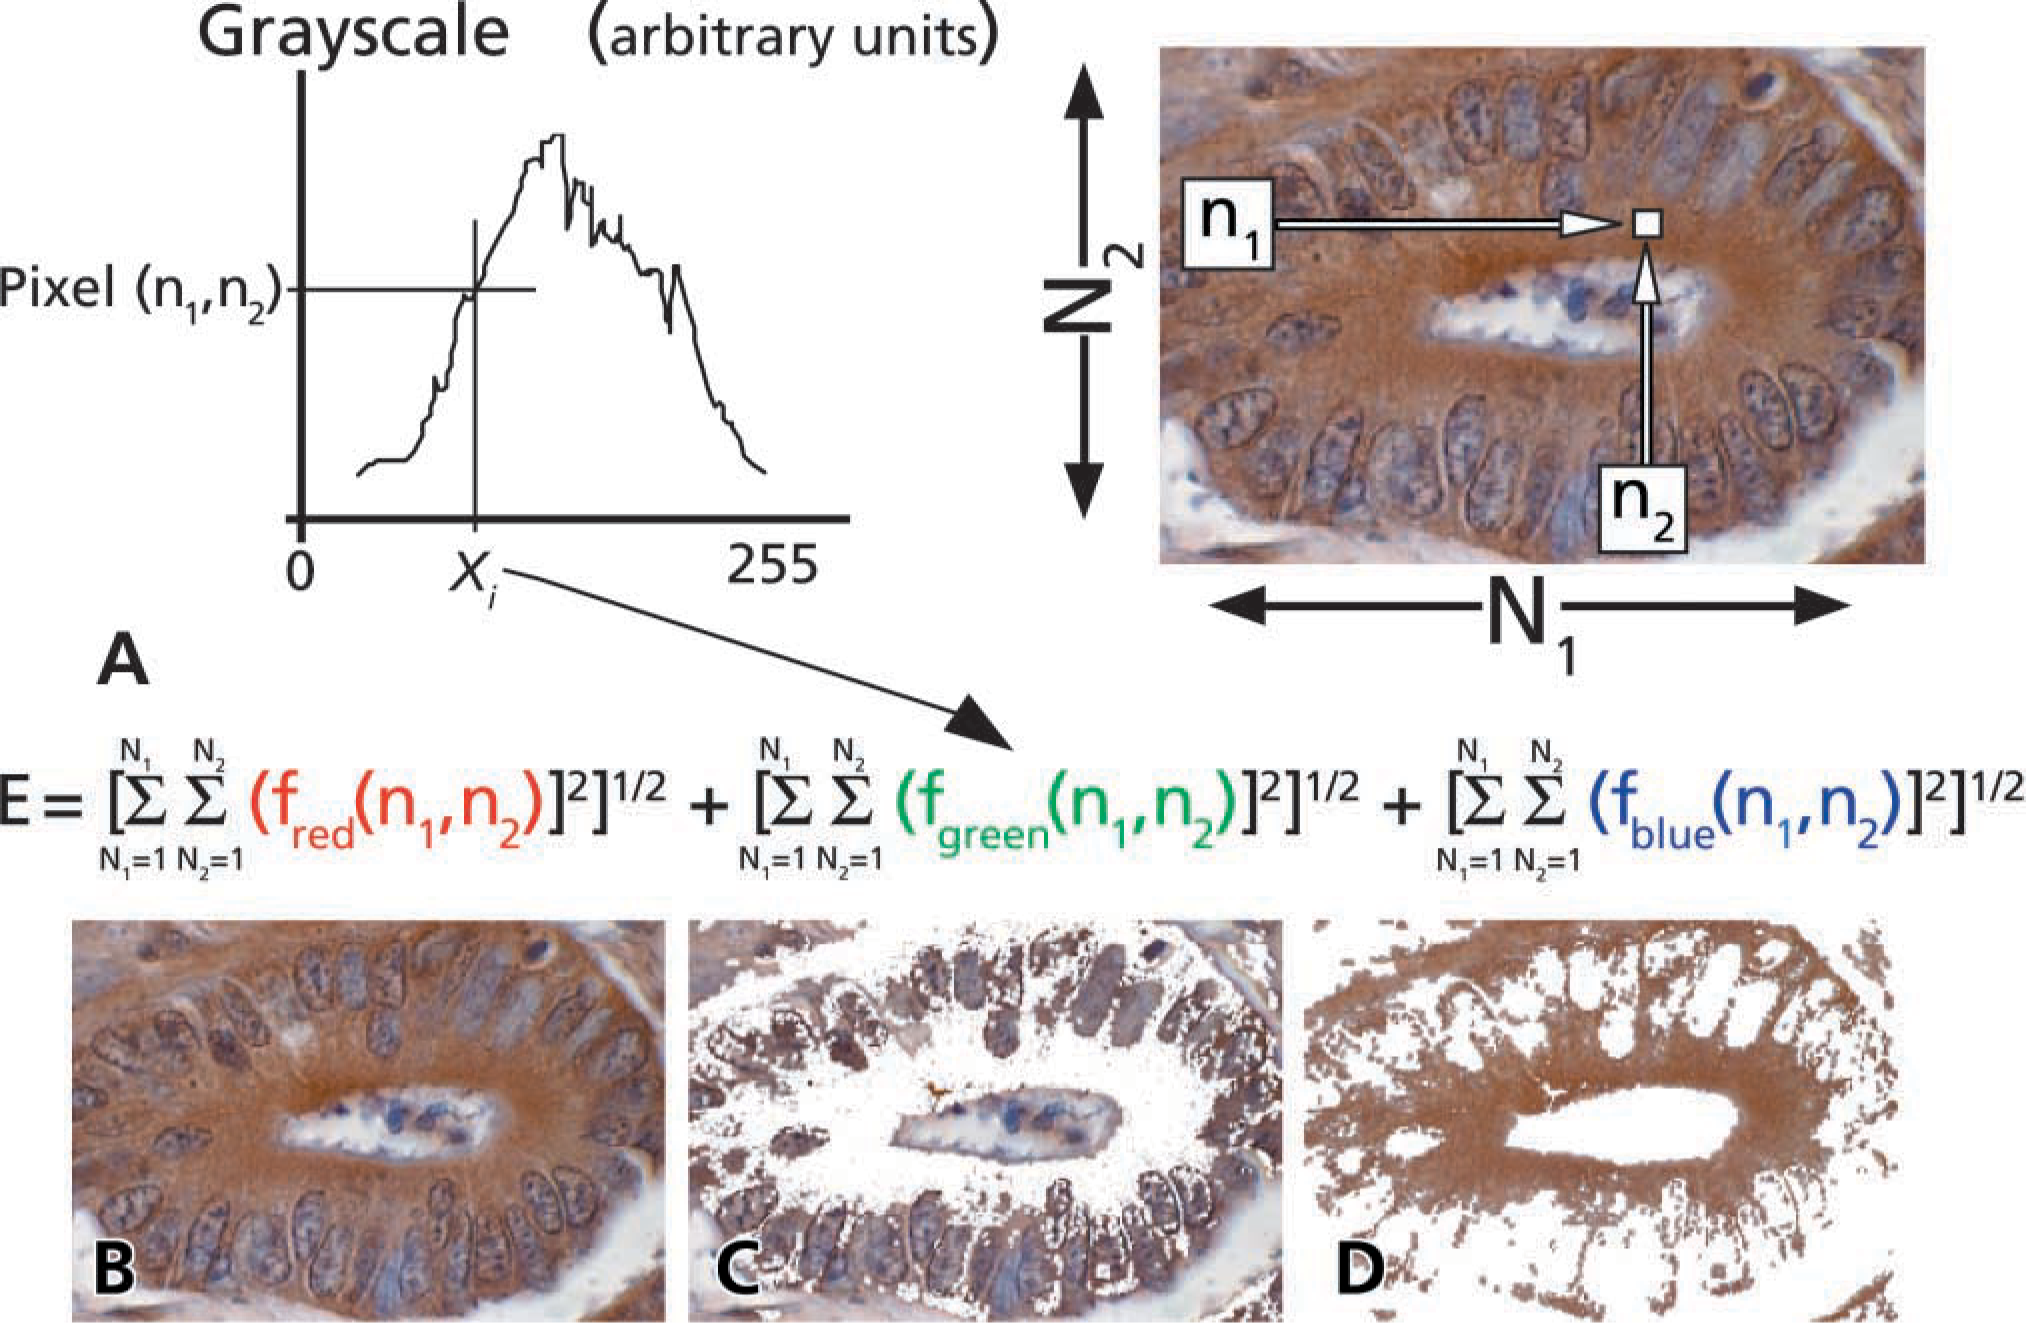
(
After acquisition with a digital camera, the experimental image file was opened in Photoshop (Adobe; San Jose, CA) using a Macintosh twin 1-GHz G4 workstation (15 gigaflop processor; Apple Computers, Cupertino, CA). The image was then analyzed using two distinct algorithms. The first algorithm exactly recreated our previous approach (Matkowskyj et al. 2000) and was limited to evaluating small 100 × 100 pixel regions. Using this approach, the relevant regions of interest were identified in both the GRP-R-treated and negative control slides using the “Marquee tool” in Photoshop. The selected regions were then digitally removed and saved as new TIFF files. These smaller files were opened in Matlab and the E
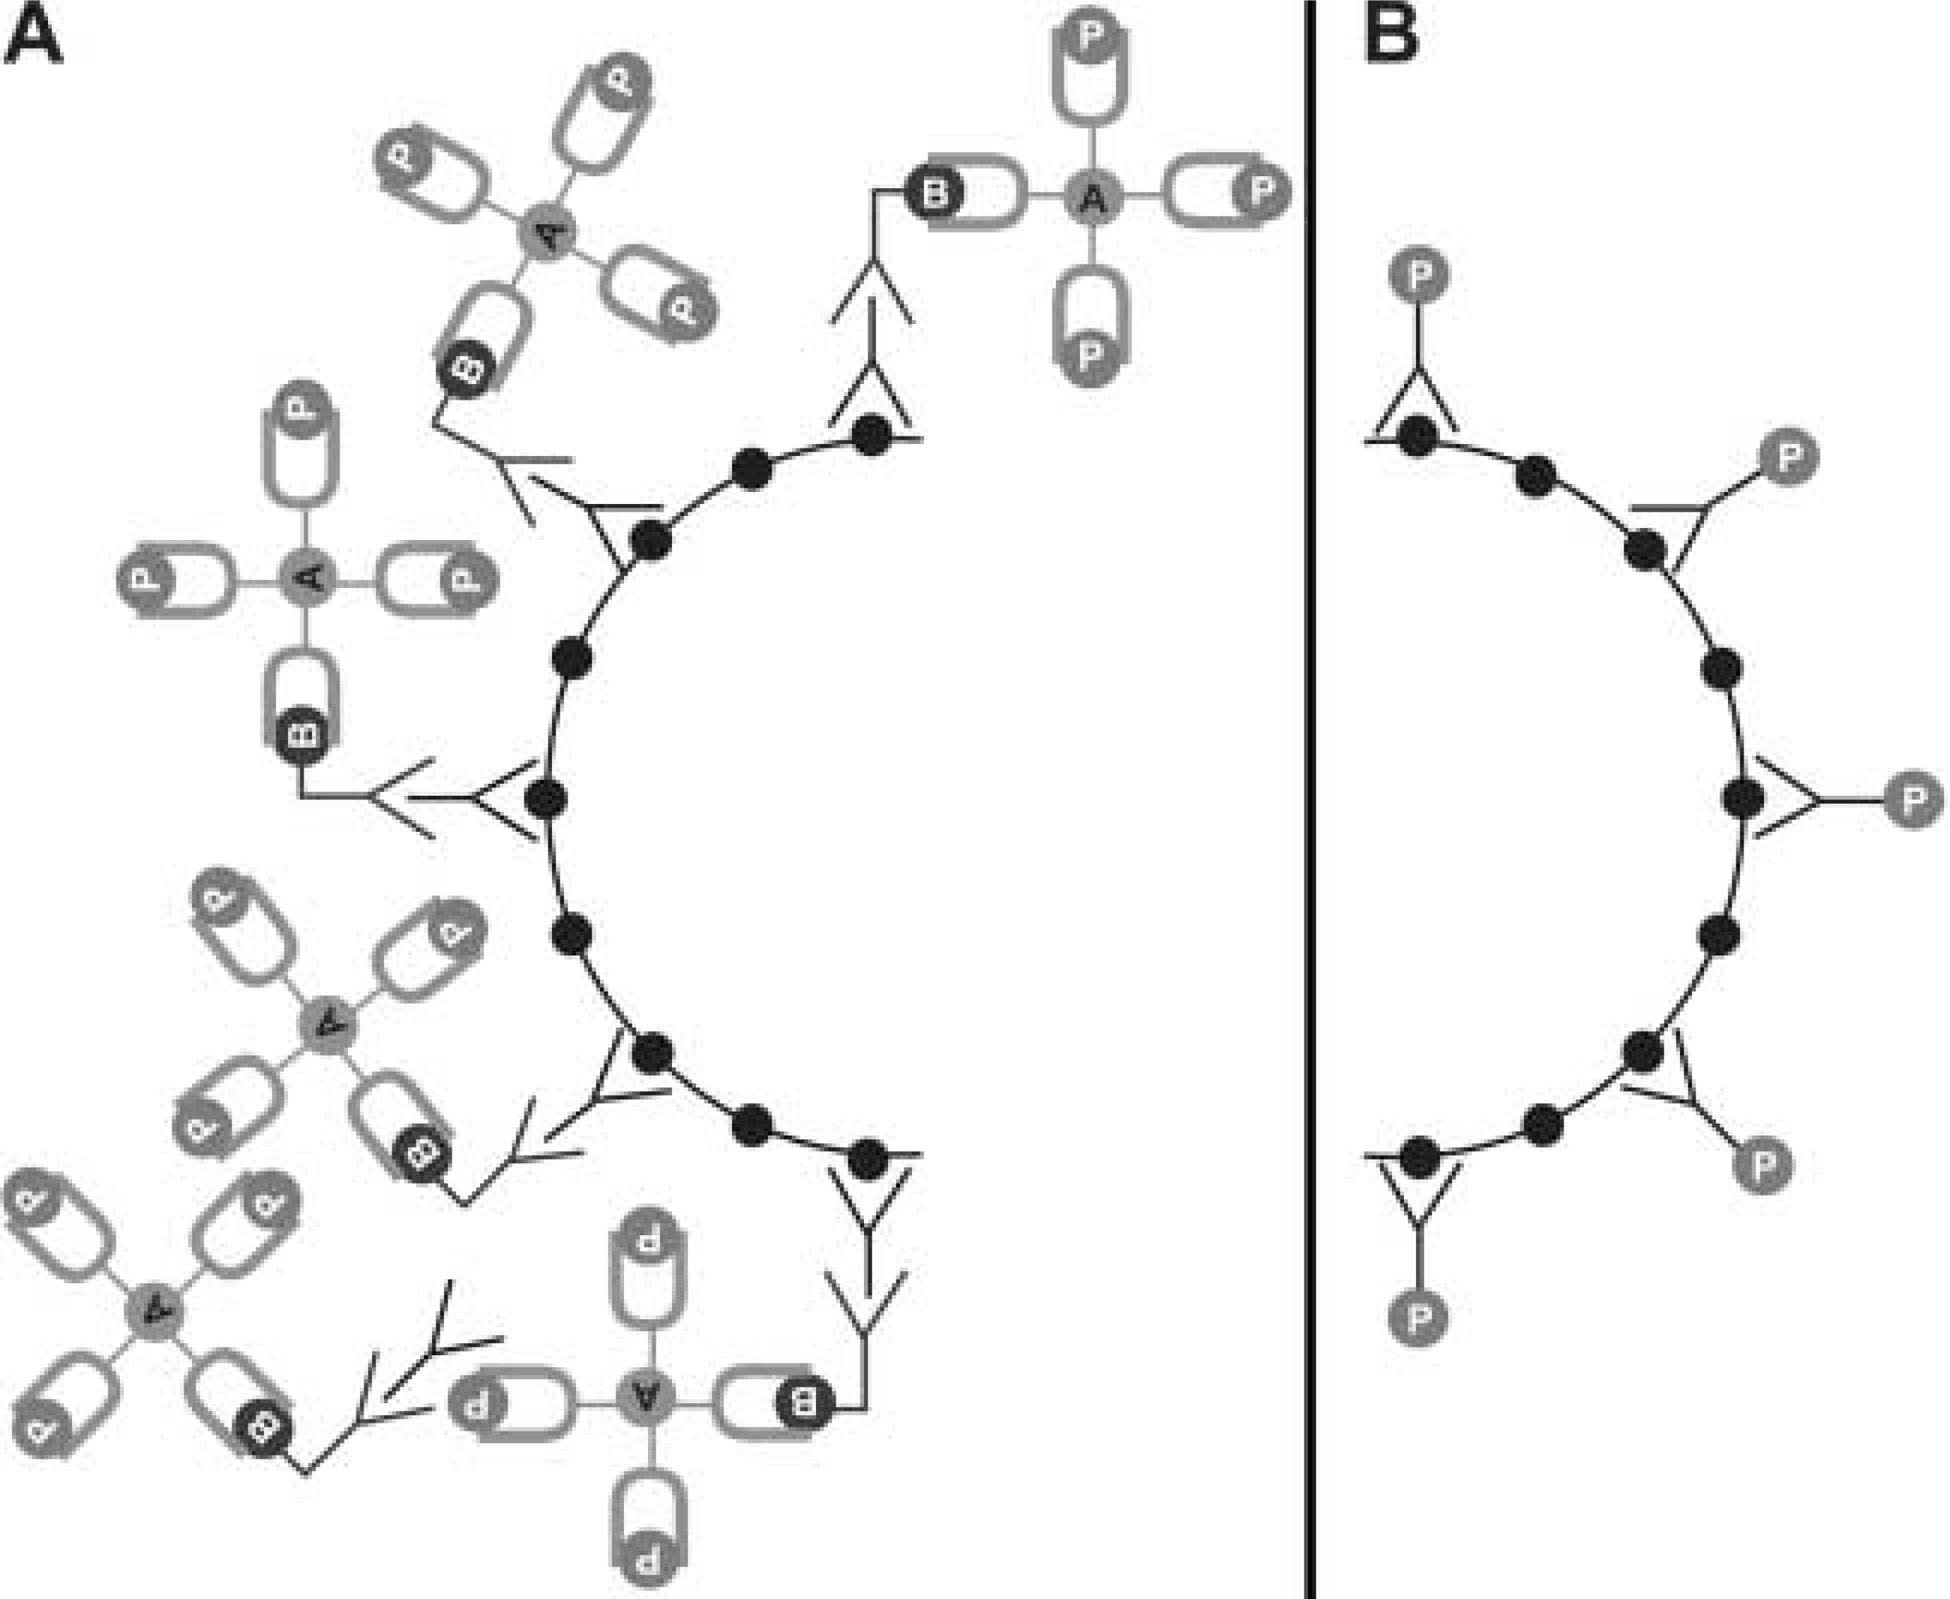
In our new and improved algorithm, the “Magic Wand tool” in Photoshop was used to select the entire histological region of interest contained within the original image file in a manner analogous to that described by others (Lehr et al. 1997,1999). Briefly, the “Magic Wand tool” was double-clicked to display the “Options” palette, which allows tolerance values between 0 and 255 to be selected. Lower values identify “colors” similar in grayscale to the index pixel, whereas higher values select a broader range of “colors.” We used the default tolerance value of 30. Also within the “Options” palette, the “anti-aliasing” was selected but the “contiguous” parameter was deselected. This allows pixels of similar “color” not immediately adjacent to the index pixel to be included for analysis. The region to be analyzed is then identified by touching the “Magic Wand” to one discrete point on the image (Figure 1B), all pixels falling within the threshold parameters selected, and removed from the original image (Figure 1C). The digitally dissected image is then stored in a new file, labeled “EXP,” and saved in noncompressed TIFF format (Figure 1D).
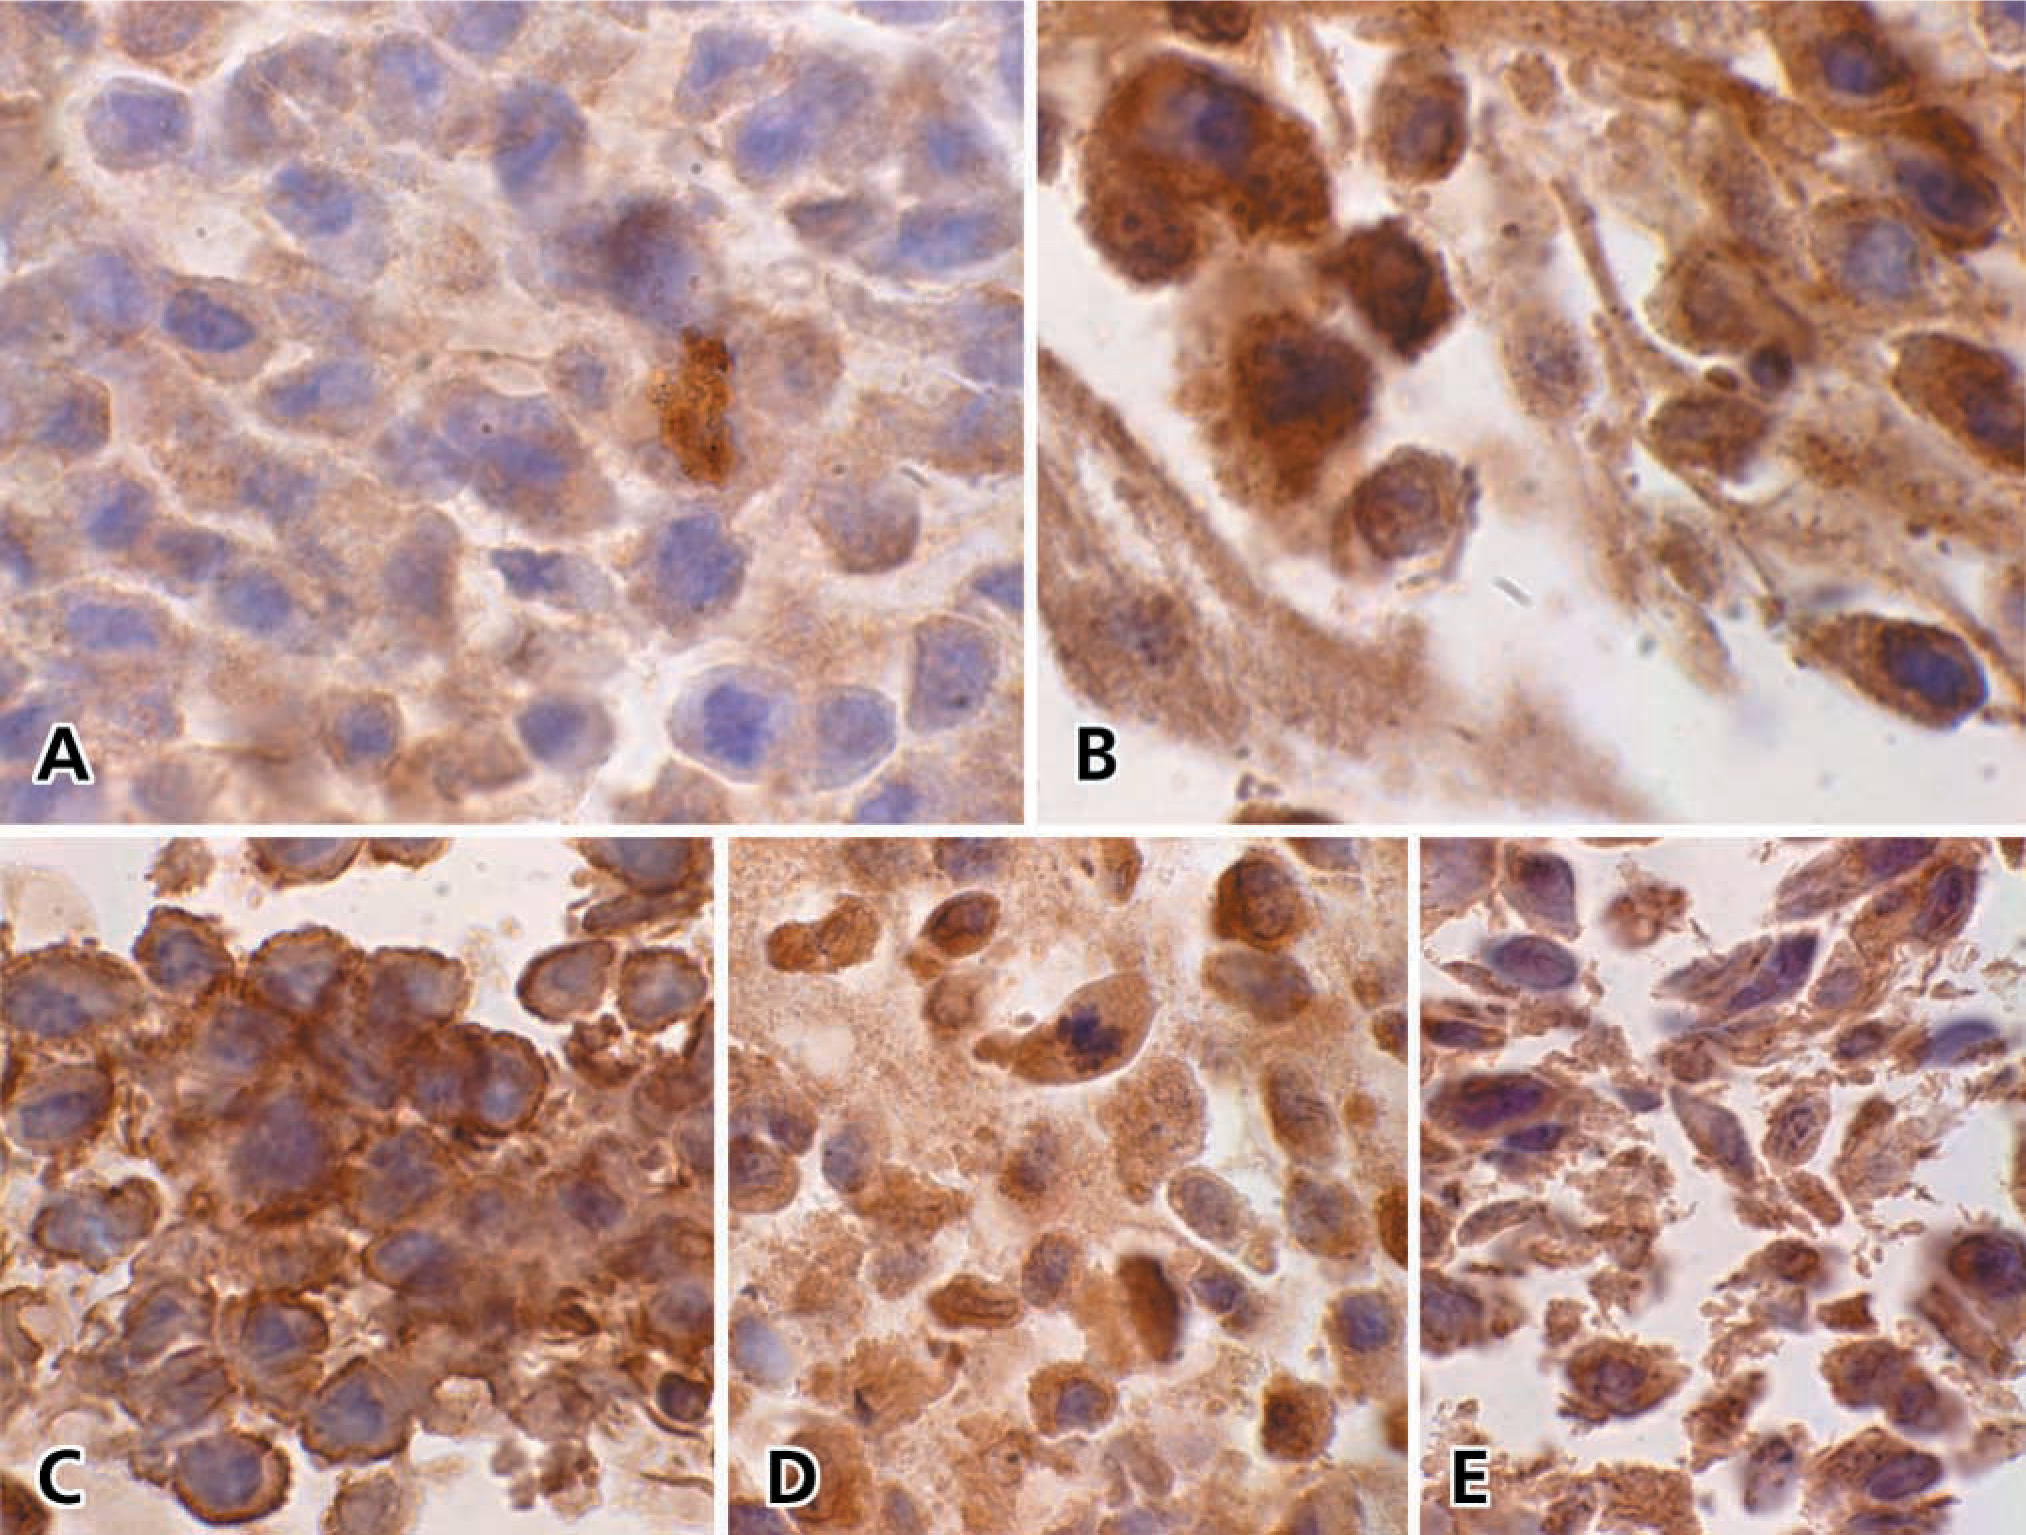
Immunohistochemistry performed using a polyclonal antibody to GRP-R against Balb 3T3 fibroblasts stably transfected to express known numbers of GRP-R binding sites. Gross differences of chromogen quantity can be detected between BALB 3T3 cells expressing 5670 (
The file for the control image is generated similarly. The control slide is acquired from a sequential 5-μm tissue section and treated identically as the experimental slide except that it is not exposed to primary antibody. The same parameters as defined for the experimental slide are used for the control image. As above, the selected region is stored in a new file in TIFF format. This new image is referred to as “CONTROL.” Each image is processed by clicking and dragging the icon for the appropriate image onto the icon for our software program TIFFalyzer. The TIFFalyzer program outputs the result for the file E
The mathematical principles underlying this algorithm have been previously reviewed (Matkowskyj et al. 2000). The TIFFalyzer program can be downloaded as freeware at our website (http://www.uic.edu/com/dom/gastro/Freedownloads.html). After obtaining the E
Statistical Analysis
All data reported here are valueless, and are reported as energy units per pixel (eu/pix). Statistical analysis was performed using StatView (Abacus Concepts; Berkeley, CA), with differences between tissue regions evaluated by ANOVA. In all instances, data are expressed as means ± SE.
Results
The primary goal of this study was to determine if our algorithm for Q-IHC could be used to measure peptide hormone receptor number. To assess this, we created a number of cell lines stably transfected with the human GRP-R cDNA. The number of GRP-R binding sites present in each cell line was determined by competitively displacing [125I-Tyr4]-bombesin with increasing concentrations of unlabeled ligand as previously described (Benya et al. 1995). Immunohistochemistry was performed on each cell line by growing cells to confluence, embedding in paraffin, and treating the sections identically as performed for tumor sections. Although alterations in chromogen intensity could be appreciated between the cell lines with the highest and lowest number of binding sites (Figures 2A and 2B), alterations in chromogen intensity reflecting small differences in GRP-R were difficult to appreciate (Figures 2C-2E). However, the amount of chromogen present as determined by Q-IHC tightly correlated with the amount of GRP-R present in each cell line.
Using our old algorithm for Q-IHC we were restricted to selecting 100 × 100 pixel regions for evaluation. When this approach was used on the cell lines, a significantly higher coefficient of variation was observed, as might be expected when such small regions were studied (Table 1). In contrast, the coefficient of variance was extremely low when the larger areas studied in our new algorithm, were evaluated (Table 1). In large part, this low coefficient of variance is due to the fact that well over 2 million pixels were subject to evaluation using our new algorithm, whereas only 60,000 pixels were evaluated using our original approach (i.e., 100 × 100 pixels is 104 pixels each for three regions selected from the “EXP” along with three from “CONTROL”).
Irrespective of the algorithm used, we found that the correlation between GRP receptor number and E
Comparing determination of cumulative signal strength (E
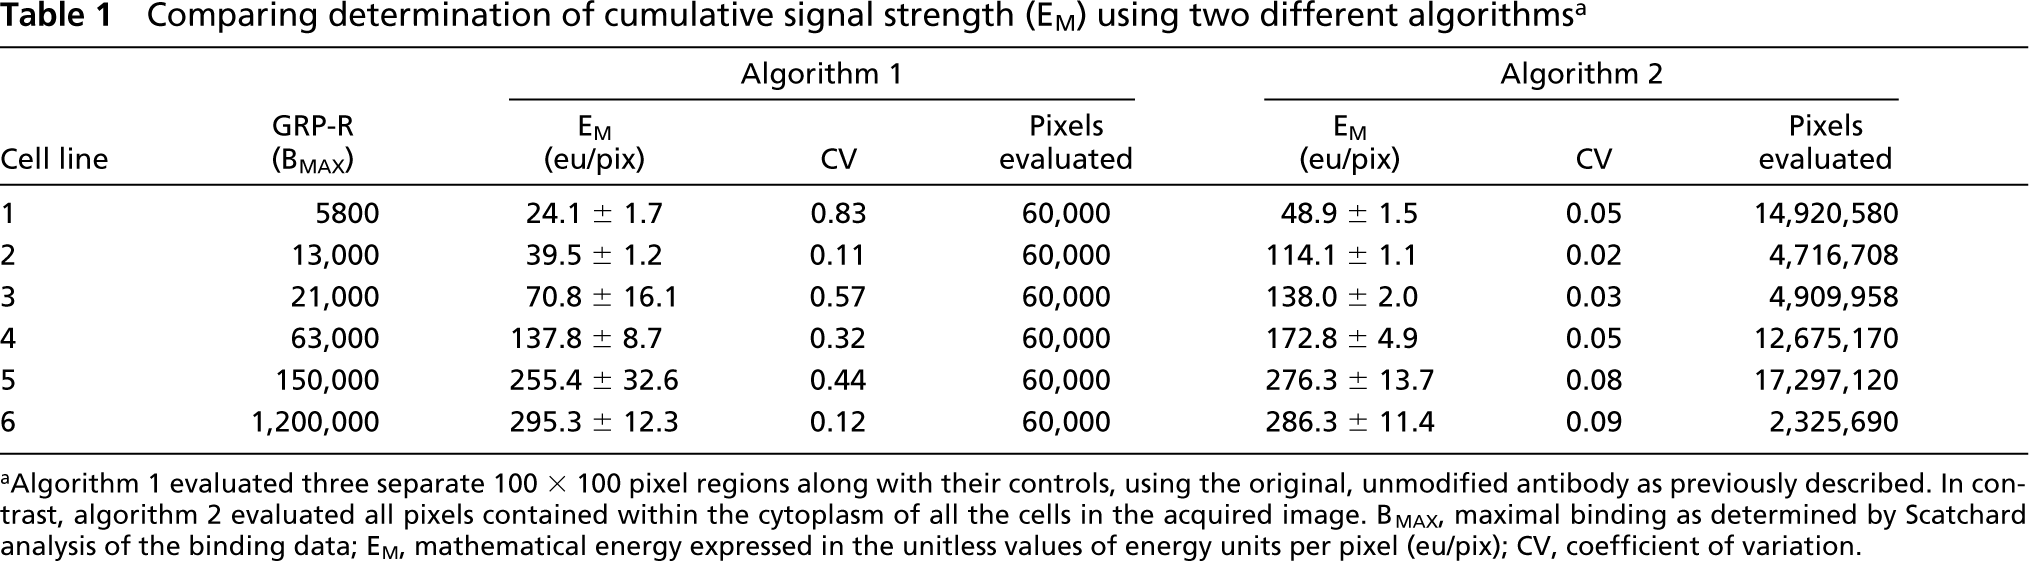
aAlgorithm 1 evaluated three separate 100 × 100 pixel regions along with their controls, using the original, unmodified antibody as previously described. In contrast, algorithm 2 evaluated all pixels contained within the cytoplasm of all the cells in the acquired image. B
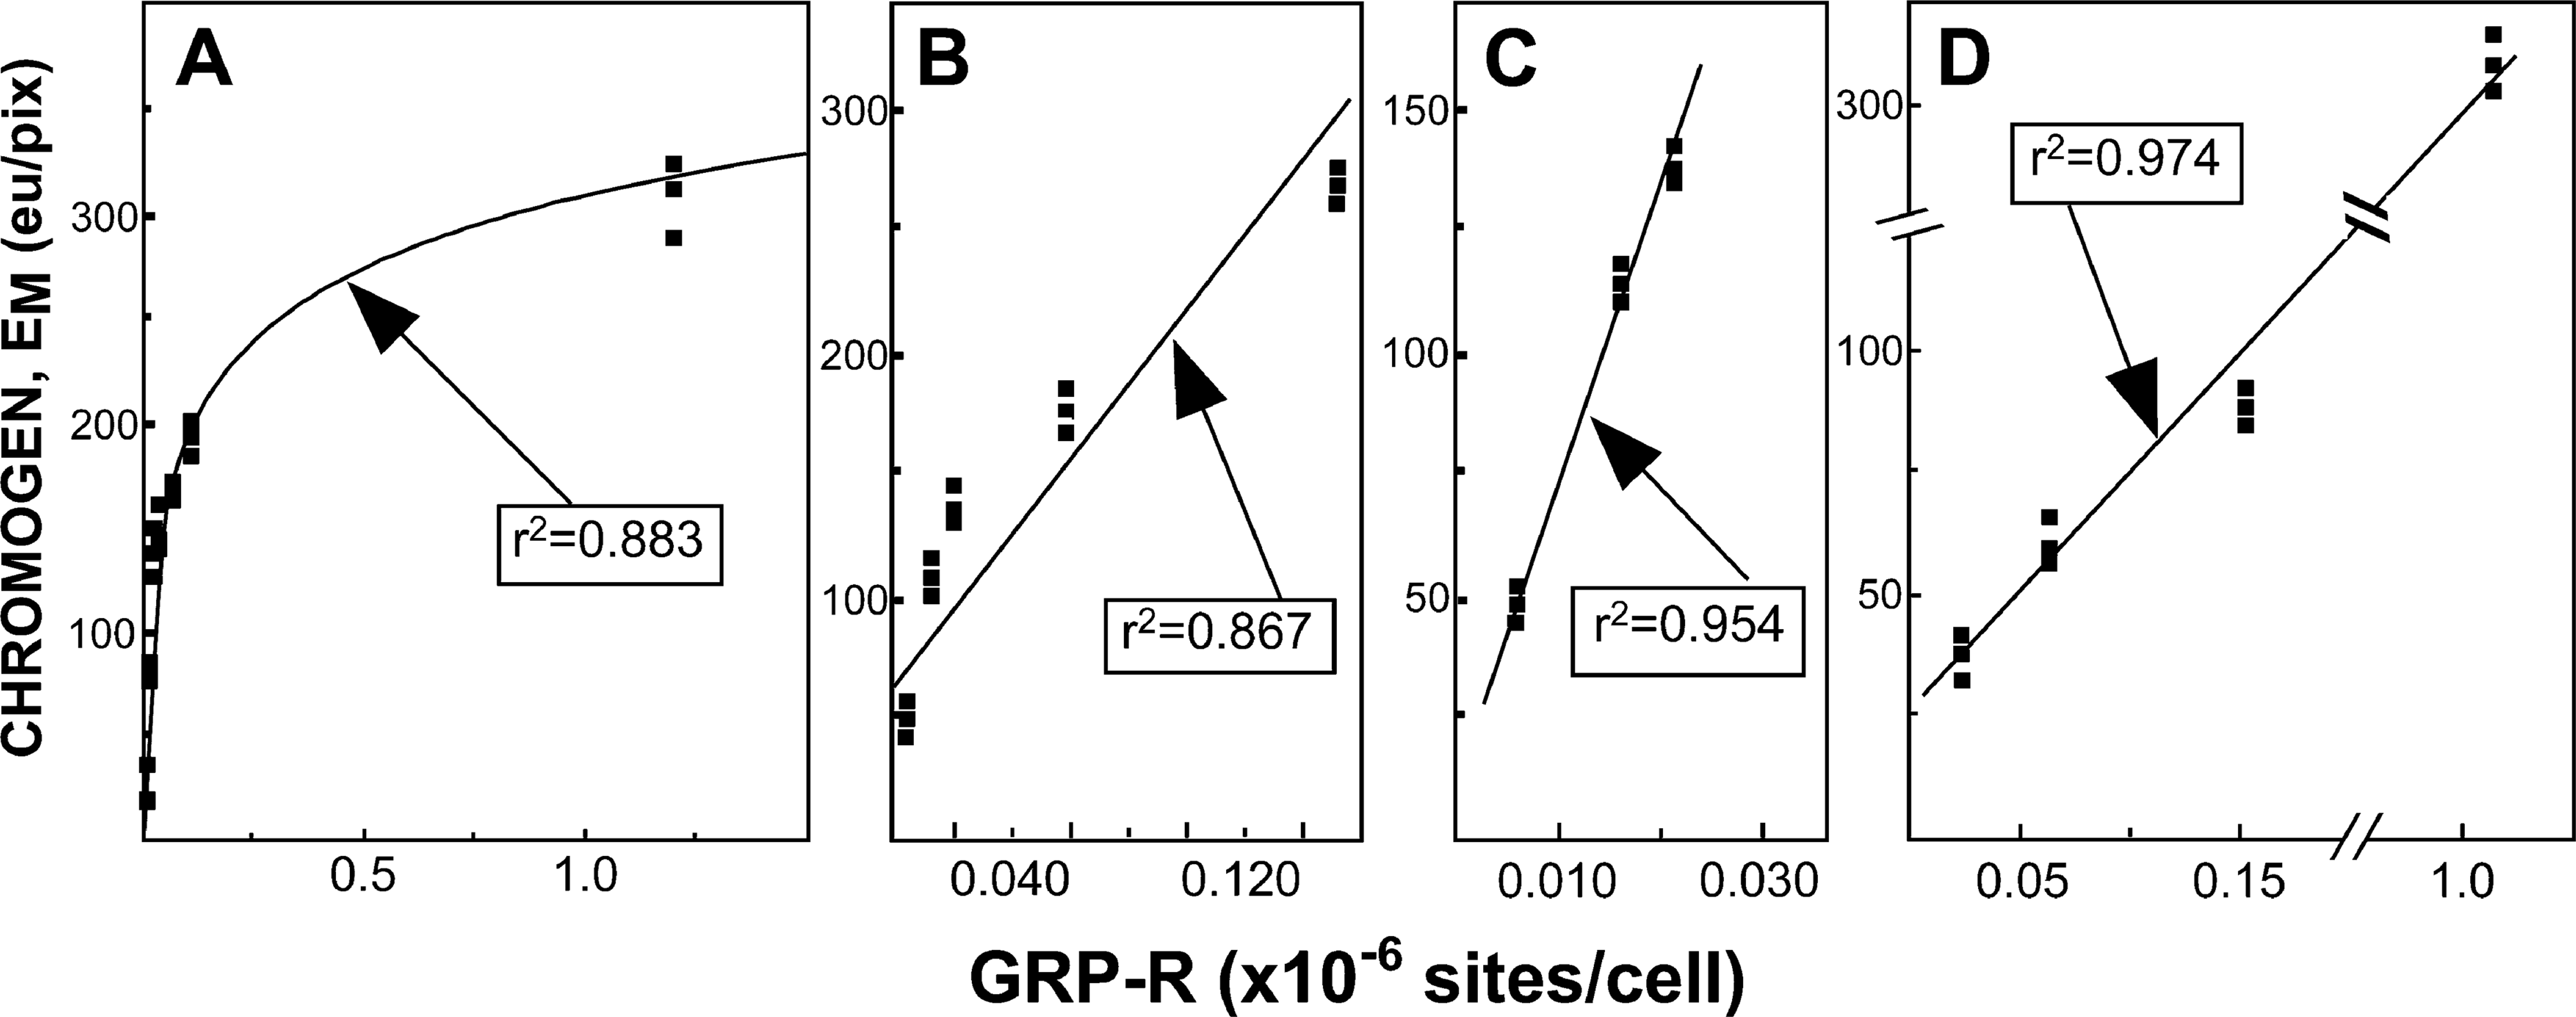
Chromogen quantity (E
To evaluate whether reagent saturation could be contributing to the logarithmic portion of the curve as seen in Figure 3A, we created a smaller enzymatic complex by directly conjugating horseradish peroxidase (HRP) to our primary antibody. By so doing we eliminated the need for the avidin-biotin complex in the DAB reaction, for biotinylated anti-rabbit IgG, as well as streptavidin. Therefore, the primary antibody could be directly visualized after incubating with Liquid DAB Substrate (shown in Figure 4B). Using this modified antibody, cell lines expressing low amounts of GRP-R generated negligible amounts of chromogen (data not shown). However, this modified primary antibody allowed us to observe a tight linear relationship (r
2=0.974) between cell lines expressing very large amounts of GRP-R and E
Given our finding that chromogen quantity correlates linearly with receptor number, we proceeded to determine the number of GRP-R binding sites in archived human colon cancers. Because colon cancers are heterogeneously differentiated (Steinberg et al. 1986; Shepherd et al. 1989; Carroll et al. 1999), our approach for Q-IHC allows receptor quantification as a function of the differentiation of individual cancer cells within a particular tumor. We therefore studied GRP-R expression in eight randomly selected colon cancers of all four Dukes’ stages in regions that were well, moderately-well, moderately, moderately-poor, and poorly-differentiated (Figures 5A-5F). Whereas normal, nonmalignant epithelial cells lining the human colon do not express GRP-R, over 55,000 ± 10,000 GRP-R binding sites are present in well-differentiated colon cancer cells. With decreasing differentiation, a corresponding decrease in GRP-R expression could be appreciated such that essentially no binding sites are detected in poorly differentiated tumor cells.
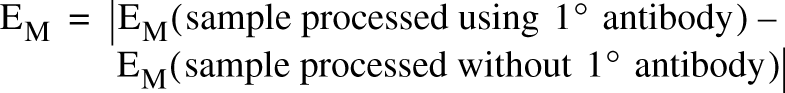
The nature of tissue processing, including the fixative used, the duration of fixation, and the size of the tissue originally fixed, all potentially alter the immunohistochemical signal. Although a complete evaluation of these parameters is beyond the scope of this article, our archived tissues nevertheless permit some of these issues to be addressed. Specifically, we evaluated inter- and intraspecimen variation for detecting GRP-R using our algorithm for performing Q-IHC. Our eight colon cancers had been resected and fixed between 1985 and 1997 and contained 24 separate regions of distinct differentiation. When these specimens were immunohistochemically processed, the amount of GRP-R chromogen (E
(
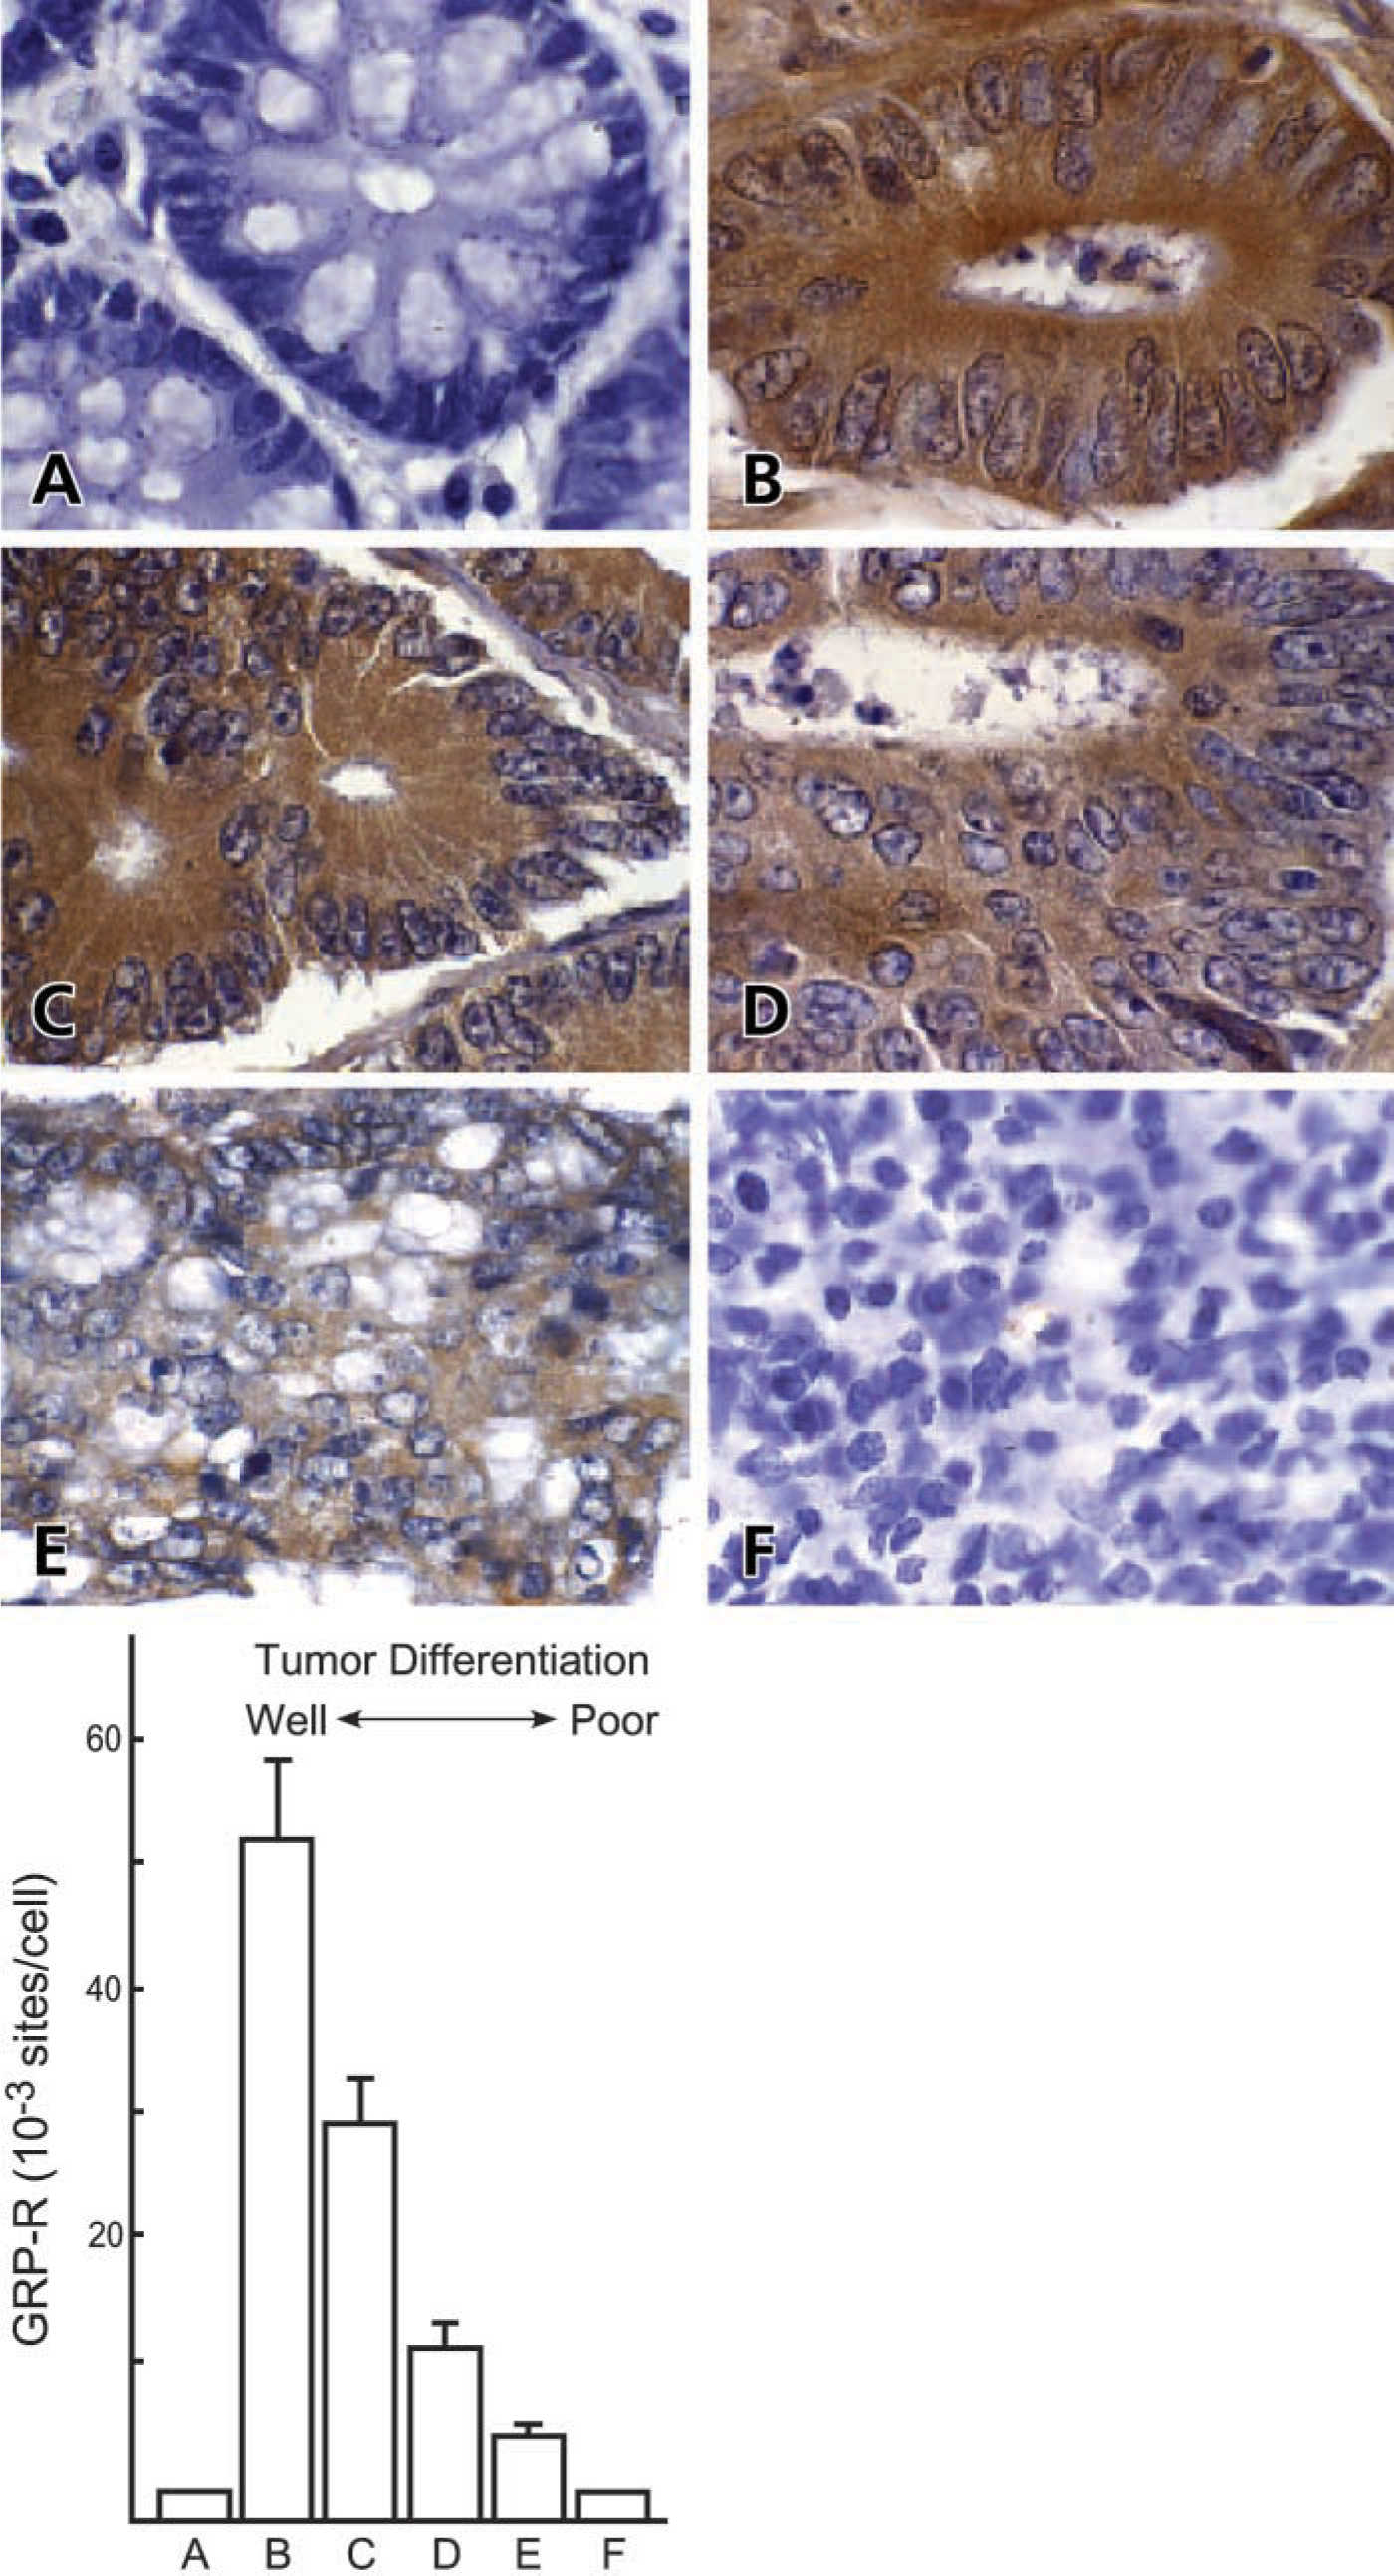
GRP-R expression in archived human colon cancers. Immunohistochemistry was performed using a 1:750 dilution of the unmodified GRP-R antibody as described in Materials and Methods. Chromogen quantity (E
Discussion
With the advent of high-resolution digital photomicroscopy, a number of algorithms for quantifying the amount of chromogen generated during immunohistochemistry have been proposed. Previous efforts, however, primarily relied on counting the number of pixels present within an image of defined “color” range. Using this technique, the number of pixels of defined color are simply counted (Kohlberger et al. 1996; Kuyatt et al. 1993) and expressed relative to the total number of pixels under consideration (Ruifrok 1997), or are used to measure the area occupied (Goldlust et al. 1996). More recently, some studies have used color-to-grayscale conversion to predict protein concentrations (Lehr et al. 1997,1999).
These previous approaches suffer from two major limitations. First, any algorithm even partially dependent on pixel counting is inappropriate because such an approach is limited to providing information about the proportion of the image occupied by a particular chromogen and cannot determine the absolute amount of chromogen present. For example, it is conceivable that a particular specimen may have a very small amount of chromogen spread over a large area, whereas another specimen may have a large amount of chromogen concentrated to a particular region (i.e., limited to nuclei). In such cases, pixel counting methods would yield results that are inconsistent with the experimental results. Pixel counting allows the investigator only to determine the number of pixels within a predetermined spectral range relative to the total number of pixels comprising the picture. Pixels have dimension and therefore are unit measures of area. Hence, pixel counting algorithms can only provide information about the proportion of the image within a predefined color range.
Second, previously published techniques are not mathematically valid because they are not based on the basic principles of color theory. For example the “brown” generated using DAB, as perceived by the viewer, is due to the simultaneous receipt of red, green, and blue images of varying grayscale and is influenced by different α-coefficients for each of these three primary color channels. Thus color-separated images require a priori knowledge of the exact color spectrum generated by the chromogen. Although it may be evident that the chromogen appears “brown” in a particular experiment, the actual color spectrum of the chromogen spans a wide range of wavelengths. The color spectrum of the chromogen is generally unknown to the observer. Even in the unlikely event that the color spectrum of the chromogen is precisely known to the observer, it is usually not isolated from the color spectrum of the original image specimen. Therefore, identification of the specific color of the chromogen is not sufficient to isolate those pixels in which the chromogen is present. Consequently, the pixels identified and enumerated using such an approach represent pixels containing the specific color spectrum specified by the chromogen (desired) as well as the original image spectrum (not desired). Once again, then, pixel counting algorithms provide semiquantitative information.
We previously described an algorithm for accurately quantifying the amount of color generated during DAB-based immunohistochemistry that was centered on determining the norm of the matrix files encoding a particular image (Matkowskyj et al. 2000). The choice of the form of the norm is based on the existence of a class of functions that must satisfy several mathematical properties (i.e., Hilbert Spaces). The motivation for using this particular energy function (i.e., norm), and for most investigators in the field of signal and image processing, is due to its simplicity as well as its relation to the notion of “energy” as used in the physics literature (Jain 1989). In our previous report we demonstrated that we could accurately express immunohistochemically generated chromogen in terms of the amount of mathematical energy (E
Predicted number of GRPR-binding sites based on the amount of cytoplasmic GRP-R chromogen present in human colon cancers of various degrees of differentiation a
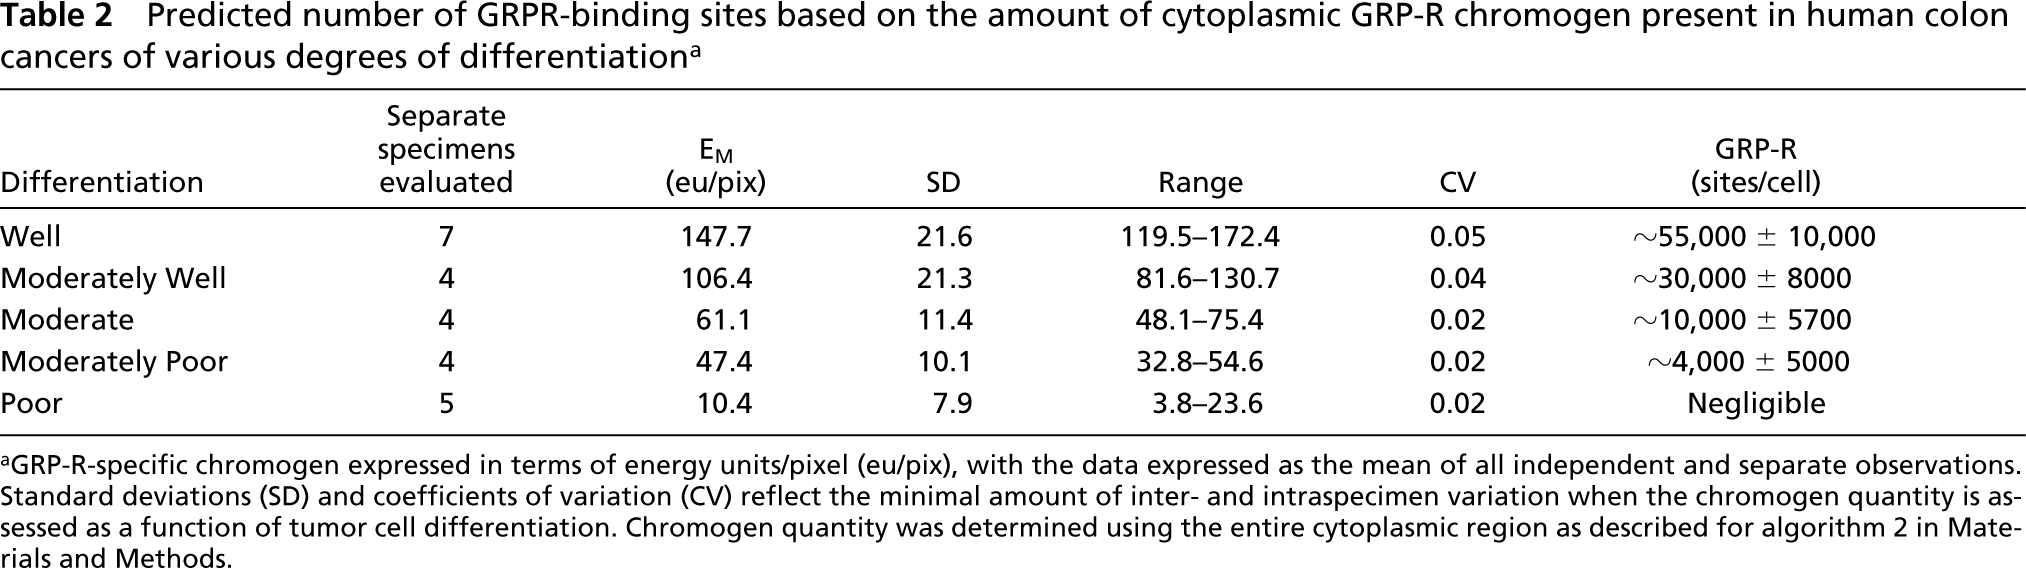
aGRP-R-specific chromogen expressed in terms of energy units/pixel (eu/pix), with the data expressed as the mean of all independent and separate observations. Standard deviations (SD) and coefficients of variation (CV) reflect the minimal amount of inter- and intraspecimen variation when the chromogen quantity is assessed as a function of tumor cell differentiation. Chromogen quantity was determined using the entire cytoplasmic region as described for algorithm 2 in Materials and Methods.
Our previous report describing Q-IHC was flawed insofar as it did not demonstrate whether this technique could be used to determine the number of receptors to which the primary antibody is directed, and was limited to providing E
In this report we also demonstrate that our algorithm can be modified to detect small or large concentrations of receptor as necessary. An intriguing observation is that the ABC complex, commonly used to amplify the signal otherwise generated by small amounts of antigen being detected by the primary antibody, causes E
We used this technique to quantify GRP receptor expression in archived human colon cancer specimens. We originally showed that GRP receptors were highly expressed in well-differentiated human colon cancers but were not expressed by poorly differentiated tumor cells (Carroll et al. 1999). We previously demonstrated a functional role for this protein in regulating the differentiation of murine colon cancers (Carroll et al. 2000) and in regulating the expression of villi lining the mouse small intestine (Carroll et al. 2002). In contrast, nothing was known until now about how many GRP receptors were actually expressed in human colon cancers as a function of tumor cell differentiation. In this report we demonstrate that well-differentiated tumor cells within any particular human colon aberrantly express ∼55,000 GRP receptors per cell. With tumor cell de-differentiation, progressively lower amounts of GRP receptors can be detected (Figure 5).
It could be argued that, because fixation techniques vary within and among laboratories, antigen bioavailability in archived specimens makes our results difficult to interpret. However, we showed little inter- or intraspecimen variability for GRP-R expression in tissues prepared over a 12-year time span (Table 2). At the very least, this observation indicates that one antigen (the GRP-R) at one institution (ours) can be consistently and replicably quantified. Whether or not other antigens at different institutions can be similarly quantified is beyond the scope of this report and awaits further study.
Regardless, nonsubjective quantification of immunohistochemically generated chromogen will only become ever more important. For example, grading HER2/neu immunopositivity in breast cancer specimens has therapeutic implications: patients whose tumors are ≥2+ immunopositive are eligible for trastuzumab (Herceptin) treatment, whereas those with less staining are not (Nunes and Harris 2002; Spigel and Burstein 2002). However, a recent study indicated that almost one in five community performed immunohistochemical assays were over-interpreted compared to the same test performed at a central facility using a gold standard (Paik et al. 2002). This study suggested that large centralized laboratories benefit from “recently introduced image analysis systems” not affordable to smaller facilities. With algorithms such as the one described here now available as freeware, replacing subjective “grading” of immunohistochemically generated chromogen with true Q-IHC is now readily achievable.
Footnotes
Acknowledgements
Supported by an ADHF Student Research Fellowship (to KAM) and by NIH grants DK51168 and DK54777 and a VA Merit Review (to RVB).