
Abstract
We describe a novel system that permits simultaneous confocal imaging of protein interactions and measurement of cell mechanical properties during passive loading. A mechanical apparatus was designed to replace the stage of a confocal microscope, enabling cell manipulation, force transduction, and imaging. In addition, image processing algorithms were developed to quantify the degree of connectivity between subcellular structures. Using this system, we examined the interactions among three cellular structures thought to be linked by the muscle's intermediate filament system: Z-disks, nuclei, and the costamere protein complexes located at the muscle cell surface. Fast Fourier transforms (FFTs) and autocorrelations (ACs) were implemented to quantify image periodicity and relative phase shifts among structures. We demonstrated in sample wild-type muscle cells that there was significant connectivity among Z-disks in the same fiber at various sarcomere lengths, as well as between Z-disks and the costamere complexes. This approach can be applied to any cell system in which structural periodicity and mechanical connectivity are of interest.
U
In striated muscle, passive mechanical properties have been measured in whole muscle (Magid and Law, 1985), single cells (Edman 1966; Gordon et al. 1966), and even single myofibrils (Magid and Law 1985; Horowits et al. 1986; Linke et al. 1994; Bartoo et al. 1997). Using a combination of mechanical, structural, and molecular methods, a number of research groups have demonstrated conclusively that titin is responsible for muscle cell passive viscoelasticity (Wang and Ramirez-Mitchell 1983; Granzier and Irving 1995; Labeit and Kolmerer 1995; Bartoo et al. 1997). Subsequent experiments elucidated the molecular basis of the mechanical properties measured, even at the level of the individual molecule (Rief et al. 1997; Oberhauser et al. 2001). Scaling the mechanical properties of individual molecules and sarcomeres to those of an entire cell requires an understanding of the interactions among cellular structures. We introduce in this study a system that permits simultaneous confocal imaging of protein interactions and measurement of mechanical properties during passive loading of muscle cells. In addition, we developed image processing algorithms to quantify connectivity between subcellular structures. Such quantitative structural data permit the development of mathematical and structural models to predict cell behavior more accurately.
Materials and Methods
Experimental Model and Design
Experiments were performed on cells from the fifth toe muscle of the extensor digitorum longus muscle in wild-type (n=4, 10–14 weeks; Taconic Farms, Germantown, NY) and desmin-null (n=1, aged 14 weeks; generously contributed by Yassemi Capetanaki, Baylor University) 129/Sv adult mice. The EDL fifth toe was chosen on the basis of its fiber length homogeneity and because it contains a single fiber type (Burkholder et al. 1994; Chleboun et al. 1997).
All procedures were performed in accordance with the NIH Guide for the Use and Care of Laboratory Animals and were approved by the University of California and Department of Veteran's Affairs Committees on the Use of Animal Subjects in Research. Each mouse was anesthetized with a cocktail composed of (mg/kg): ketamine 10, rompum 5, and acepromazine 1. Hindlimbs were transected proximal to the knee and immediately placed for further dissection into a mammalian Ringer's solution composed of (mM): NaCl 137, KCl 5, NaH2PO4 1, NaHCO3 24, CaCl2 2, MgSO4 1, and glucose 11 with 10 mg/liter curare. The mouse was then sacrificed by direct intracardiac injection of sodium pentobarbital.
Dissection of Single Fiber Segments and Attachment to Mechanical Apparatus
All dissection was performed under a dissecting microscope (Wild M-8; Heerbrugg, Switzerland). The EDL was quickly removed from each hindlimb and immersed for 60 min in a relaxing solution at pCa 8.0 and pH 7.1 consisting of (mM): imidazole 59.4, KCH4O3S 86.0, Ca(KCH4O3S)2 0.13, Mg(KCH4O3S)2 10.8, K3EGTA 5.5, KH2PO4 1.0, Na2ATP 5.1, and 50.0 μM of the protease inhibitor leupeptin (Sosnicki et al. 1989). After relaxation, two to three small bundles were taken from each fifth toe muscle, tied to a glass capillary tube, and stored at −20C for no more than 3 weeks in storage solution (Eastwood et al. 1979), consisting of (mM): KPropionate 170.0, K3EGTA 5.0, MgCl2 5.3, imidazole 10.0, Na2ATP 21.2, NaN3 1.0, glutathione 2.5, 50 μM leupeptin, and 50% (v/v) glycerol. Before experimentation, bundles were removed from storage solution and placed in relaxing solution for further dissection. Single intact fiber segments (3–4 mm in length) were carefully dissected in relaxing solution and transferred to a chamber housed in a custom-made mechanical apparatus (Figure 1). Segments displaying obvious abnormal discoloration, localized swelling, or experiencing abrasion during dissection, fiber transfer, or mechanical experiments were discarded.
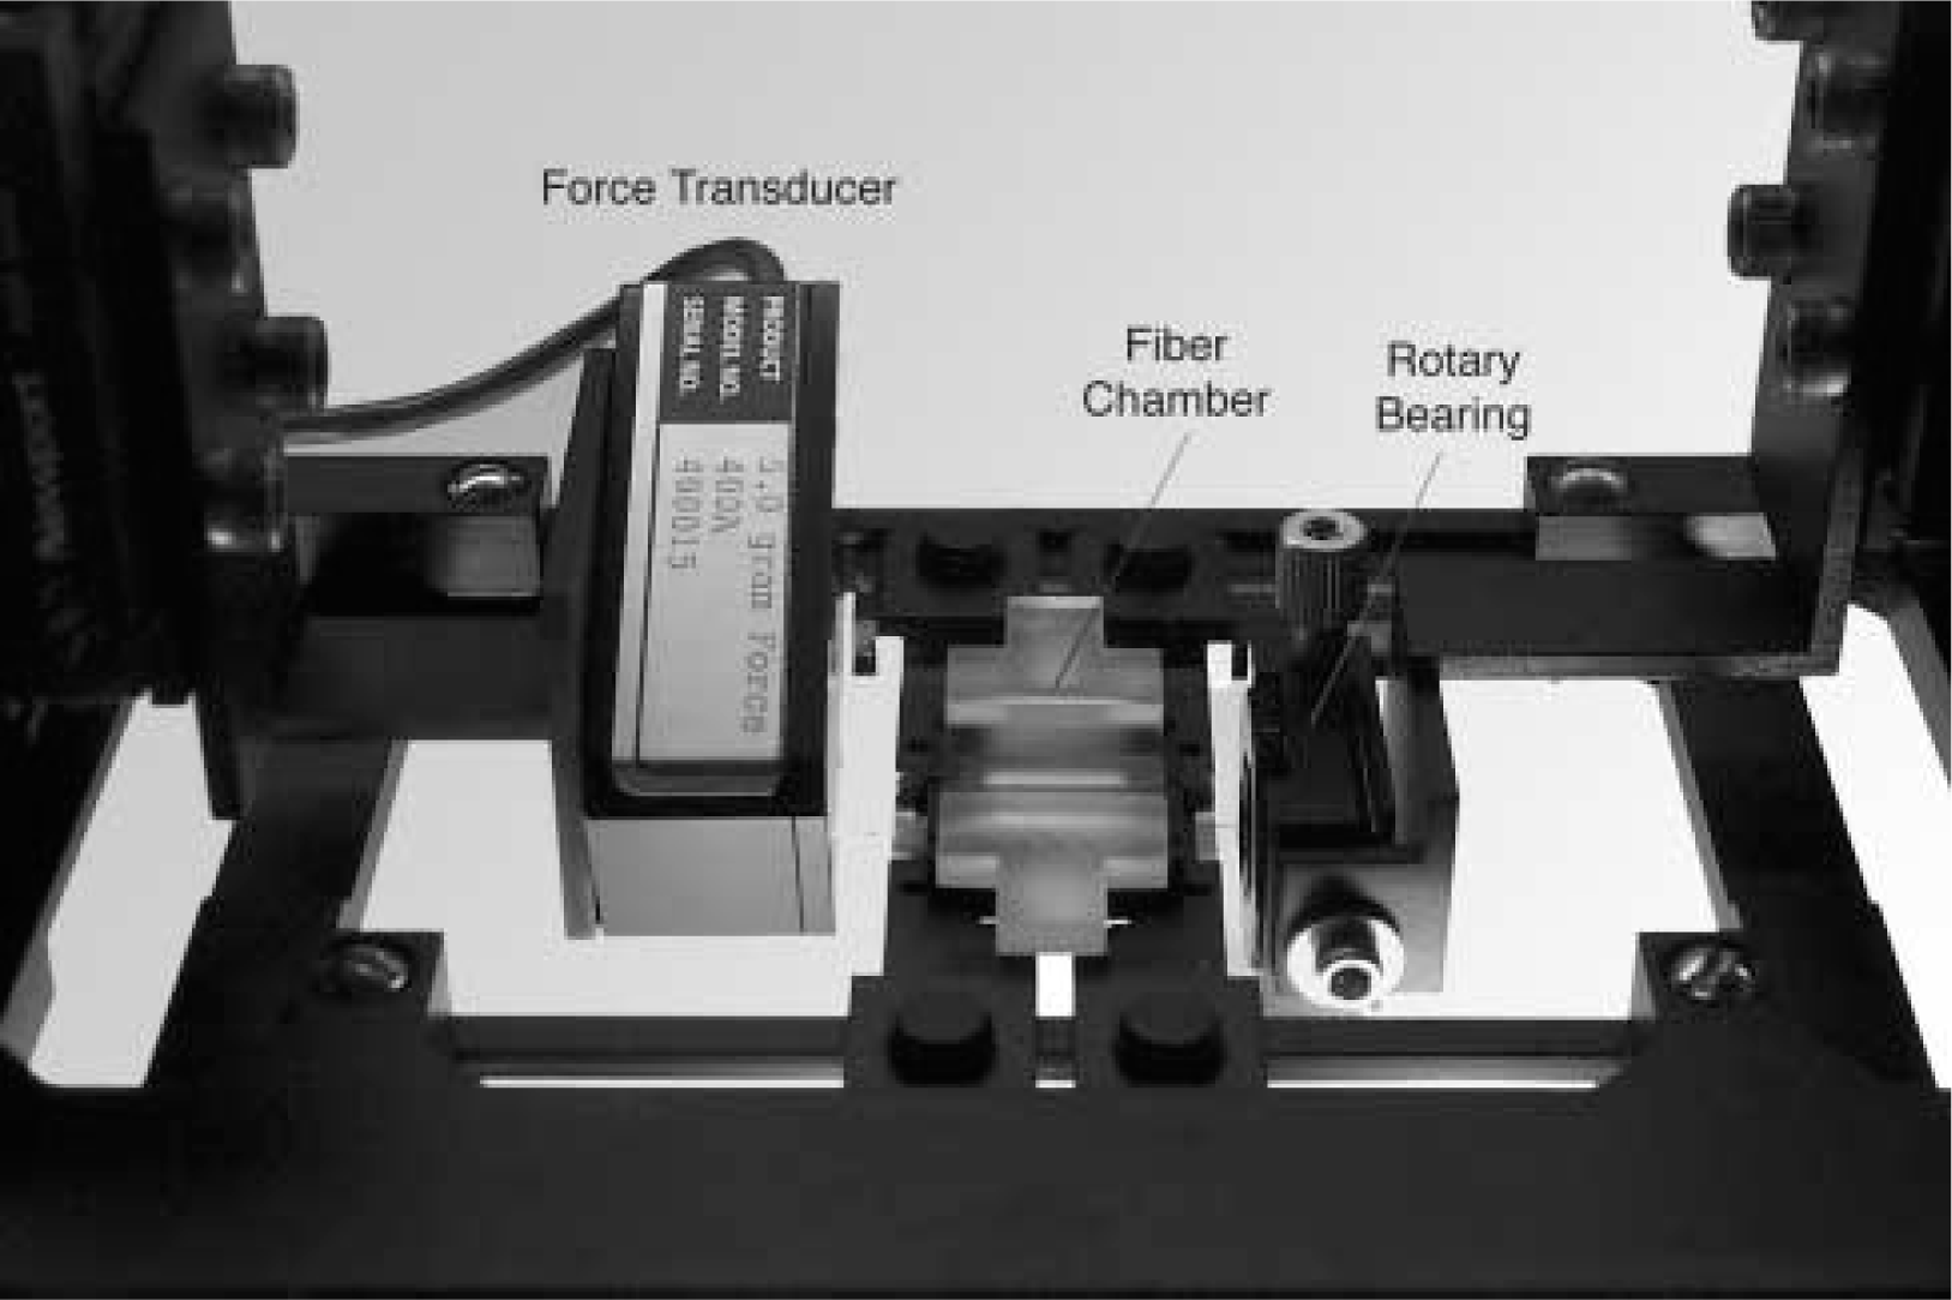
The muscle fiber and cell mechanics apparatus. Muscle fiber is tied between a force transducer and a rotary bearing using 10–0 silk suture.
The mechanical apparatus was designed to replace the stage of an inverted laser scanning confocal microscope (Axiovert 100M; Zeiss, Thornwood, NY; Figure 1). One end of the fiber segment was tied to a titanium wire (Aldrich Chemical Corporation 26601–9; Milwaukee, WI) which was rigidly attached to a force transducer (Aurora Scientific 405A; Aurora, Ontario, Canada), and the other end to a titanium wire rigidly attached to a rotational bearing (Newport MT-RS; Irvine, CA) using 10–0 monofilament nylon suture. The positions of both the force transducer and rotational bearing were controlled in three dimensions using micrometer-controlled XYZ-translational stages (Newport, 460A), permitting alignment of the fiber segment with the microscope's optical axes. The rotational bearing was used to remove any fiber segment torsion that occurred during attachment. Fiber alignment was verified based on the maintenance of microscope focus at the same depth across the entire length of the fiber.
Labeling of α-actinin, Talin, and Nuclei
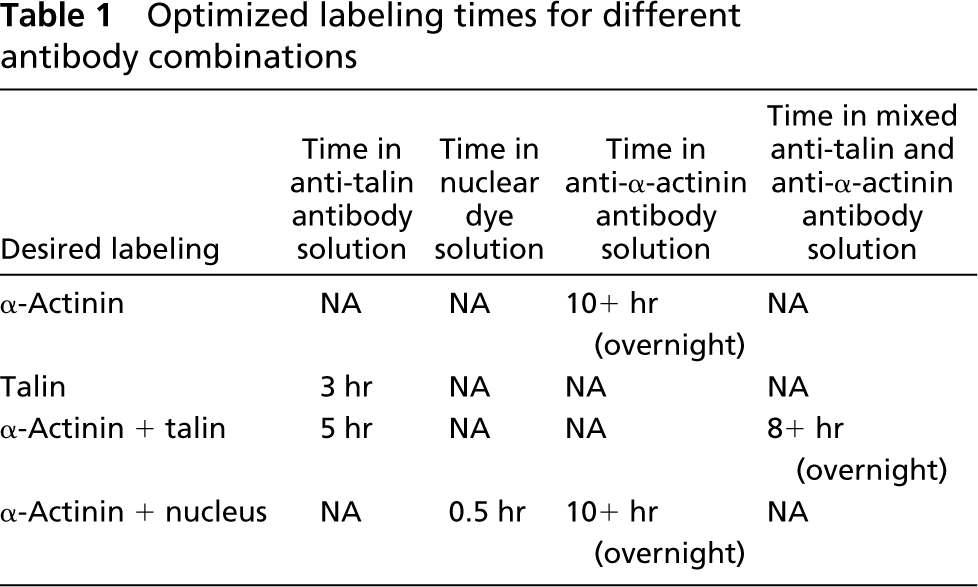
Primary antibodies preconjugated to fluorescent secondary antibodies were used to reduce background signal from unconjugated secondary antibody and to minimize incubation time. Primary antibodies specific for the Z-disk protein α-actinin (Sigma A7811; St Louis, MO) and the costamere protein talin (Santa Cruz Technology sc-7534; Santa Cruz, CA) were preconjugated to Alexa-Fluor 488 (Molecular Probes A-10235, Eugene, OR; emission Λ=488 nm) or Alexa-Fluor 594 (Molecular Probes A-10239; emission Λ=594 nm) secondary antibodies, respectively. Modifications were made per the product literature to compensate for various levels of antibody purity and protein concentration. The fiber segment was rinsed three times using relaxing solution with 1% bovine serum albumin (BSA), followed by incubation at 4–8C with gentle agitation in 15 μl/ml normal horse serum (Vector Laboratories S-2000; Burlingame, CA) in 0.1% BSA (15 min), 100 μl/ml normal mouse serum (Sigma M5905) in 0.1% BSA (15 min), and 0.1% BSA (three washes of 5 min each). After this series of blocking steps and washes, the fiber segment was incubated in either a 1:2000 dilution of DNA-binding (nuclear) dye (Molecular Probes, TOTO-3; Λ = 660 nm) followed by 0.1% BSA (three washes of 15 min each) or in an antibody-dye solution at 4C for various periods of time, depending on the desired labeling combination (Table 1). Preconjugated antibodies for talin and α-actinin were diluted in 0.1% BSA to concentrations of 50 μl/ml and 2 μl/ml of solution, respectively. After overnight antibody incubation, the fiber was washed three times for 15 min at room temperature to remove any unbound antibody.
Optimized labeling times for different antibody combinations
Control experiments were performed to determine the effect (if any) of antibody labeling on fiber passive mechanical properties. Muscle fiber segments were elongated from resting sarcomere length to ∼75% strain in 250 μm increments and permitted to stress-relax for 2 min between elongations. LaGrangian stress was calculated at each strain and elastic modulus computed for each fiber across the entire deformation range. No significant difference between labeled (82.64 ± 6.4 kPa) vs unlabeled fibers (80.02 ± 8.5 kPa) was observed (p>0.8).
Confocal Microscopy
Samples were excited using an Ar-Kr laser with beam splitters and filter sets appropriate for excitation of the AF-488 and AF-594 dyes, and an He-Ne laser for excitation of TOTO-3 dye. These dyes allowed simultaneous imaging of AF-488 and either AF-594 or TOTO-3 with no bleed-through across channels. A X32/0.4 Achroplan objective (#440851; Zeiss) was used with a correction cap (#44491; Zeiss), to compensate for the small gap between coverslip and fiber segment (necessary to prevent fiber contact with the coverslip).
Lateral resolution (x-y plane, perpendicular to the z-axis of the laser), based on the radius of the Airy disk (rAIRY), was determined according to Rayleigh's criterion (Born and Wolf 1965):

where Λ=wavelength of emitted fluorescence and NA is the numerical aperture of the objective lens. A frame of 512 × 512 pixels was captured at an electronic zoom (decrease of imaging field size) of 4.0, for a pixel-to-pixel spacing of 140 nm. Each row of pixels was scanned twice and averaged for improved accuracy, and the pinhole size was set between 0.4–0.5 Airy units, resulting in increased axial (z-axis) resolution (2.5–3 μm). These imaging conditions do not allow the measurement of absolute structure dimensions beyond the lateral resolution (∼Λ, from Eq. 1). However, they do allow very accurate measurement of the relative position of structures with respect to one another.
Susceptibility of the TOTO-3 label to photobleaching was a potentially confounding variable in the determination of nuclear dimensions. Positive controls confirmed that nuclear aspect ratio (defined as length:width) was unchanged despite slight variations in absolute dimensions. In the first control, a nucleus was exposed to continuous excitation for 60 sec at 75% of maximal intensity. In the second control, a nucleus was exposed to 20 alternating cycles of excitation at 15% and 70% of maximal power for 15 and 2 sec, respectively (simulating the experimental protocol). Aspect ratio fluctuated from an initial value of 3.11 to no more than 3.25 (4.5% increase) during the first control experiment and from an initial value of 3.72 to a minimum of 3.64 (decrease of 1.8%), and a maximum of 3.87 (increase of 4.1%) during the second control. For both controls, there was no significant relationship between aspect ratio and exposure time (m=0.017 and 0.019; r 2=0.73 and 0.63, respectively).
Passive Mechanical Protocols and Analysis
To minimize effects of the temperature sensitivity of the force transducer head, the confocal mechanical apparatus was equilibrated to room temperature before initiation of mechanical experiments. To reduce lingering effects of temperature-related drift, drift voltage (estimated based on a linear function of drift voltage vs time, as observed in control experiments) was subtracted from recorded voltage. This reduced the effect of drift on recorded forces to less than 3 mV (0.3 mg) over ∼1 hr. The temperature of the solution was verified to remain at 22–24C throughout the course of an experiment by use of a thermocouple (Model 73ATA; Yellow Springs Instruments, Yellow Springs, OH).
The fiber segment was brought to its resting length, determined as the knot-to-knot fiber segment length at which passive tension was just discernable. To standardize starting conditions, each segment was preconditioned by three loading cycles of 25% stretch, resulting in a change in resting length of less than 1% from the pre-preconditioned resting length. The segment was then loaded in increments of 10% of the segment length at a rate of ∼0.1–0.3 segment lengths/sec. At each length, after 2 min, a stack of confocal images with 2.1–2.3 μm slice thickness was captured and steady-state force (within 5% of final force value) recorded. During the 2 min of relaxation, force was recorded via a laptop computer running the LABVIEW software (National Instruments; Austin, TX), and the confocal stage was manipulated to keep the selected region of the fiber in the imaging field. Stress was calculated by dividing force by either initial cross-sectional area (LaGrangian stress) or current cross-sectional area (Cauchy stress). Cross-sectional areas were calculated using an elliptical approximation based on major and minor diameters of the imaged segment. Strain was calculated by dividing sarcomere length at a given length by initial sarcomere length. For stress-relaxation experiments, the fiber segment was rapidly loaded (<l sec) and a grid of 256 × 10 μm was imaged continuously (delay between capture of ∼0.23 msec), to observe structural changes along the longitudinal axis of the fiber segment. This grid size was selected to balance a rapid capture time with minimal distortion of images due to artifacts of fiber motion and scanning artifacts.
Connectivity analyses for images in Figures 7A and 7B
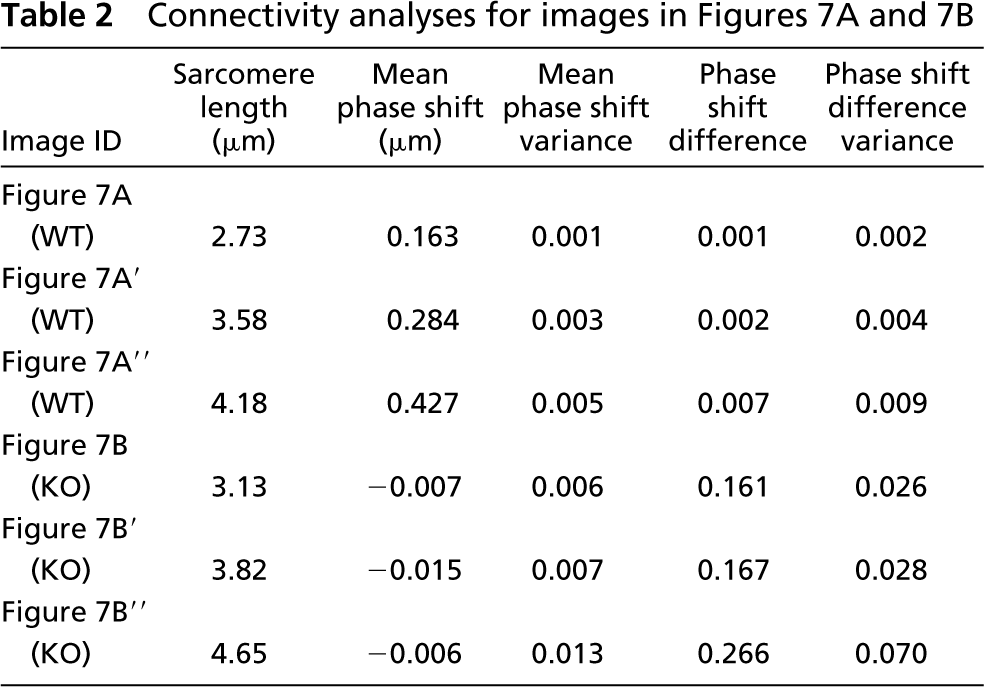
Image Processing
Sarcomere length was determined using two signal processing techniques. The first technique applied a fast Fourier transform (FFT) to the intensity profile for each row across the fiber width:
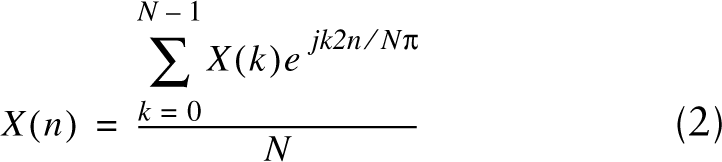
where X is the intensity profile, n is pixel number along a row n=(0, 1, …, N−1), N is the row width, and j is the square root of −1. Sarcomere length was then calculated as the reciprocal of the peak frequency of the FFT power spectrum. The second technique calculated the autocorrelation function AF, a special case of the cross-correlation function CFG, of the intensity profile for each row along the fiber width. The unbiased cross-relation function at a point i over a window of size (2W + 1) is given by:
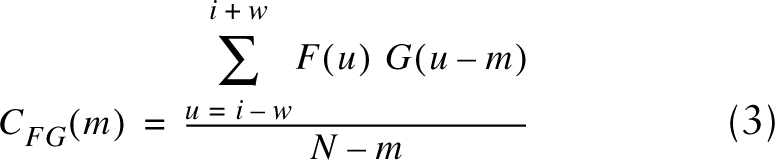
for -w≤m≤w pixel lags. G(u)=F(u) for the autocorrelation function. Because this function generated a peak at pixel lags in phase with the periodicity of the intensity profile, sarcomere length equaled the periodicity of the autocorrelation function, again calculated using an FFT.
“Connectivity” between α-actinin and talin was defined as the phase shift between the peaks of the α-actinin and talin autocorrelated intensity profiles, as determined by cross-correlation. Connectivity between myofibrils within the sarcomere lattice was quantified by first calculating the phase shift between peaks of autocorrelated α-actinin intensity profiles of rows ∼0.6 μm apart (approximating the myofibrillar diameter). Then the variance of the mean phase shift for all myofibrils across the fiber diameter was defined as connectivity (a sarcomere lattice with high connectivity yields a low variance). Calculations and basic statistics were performed using MATLAB (MATLAB 6.0 Professional version; MathWorks, Natick, MA).
(
Results
Single- and Double-labeled Images
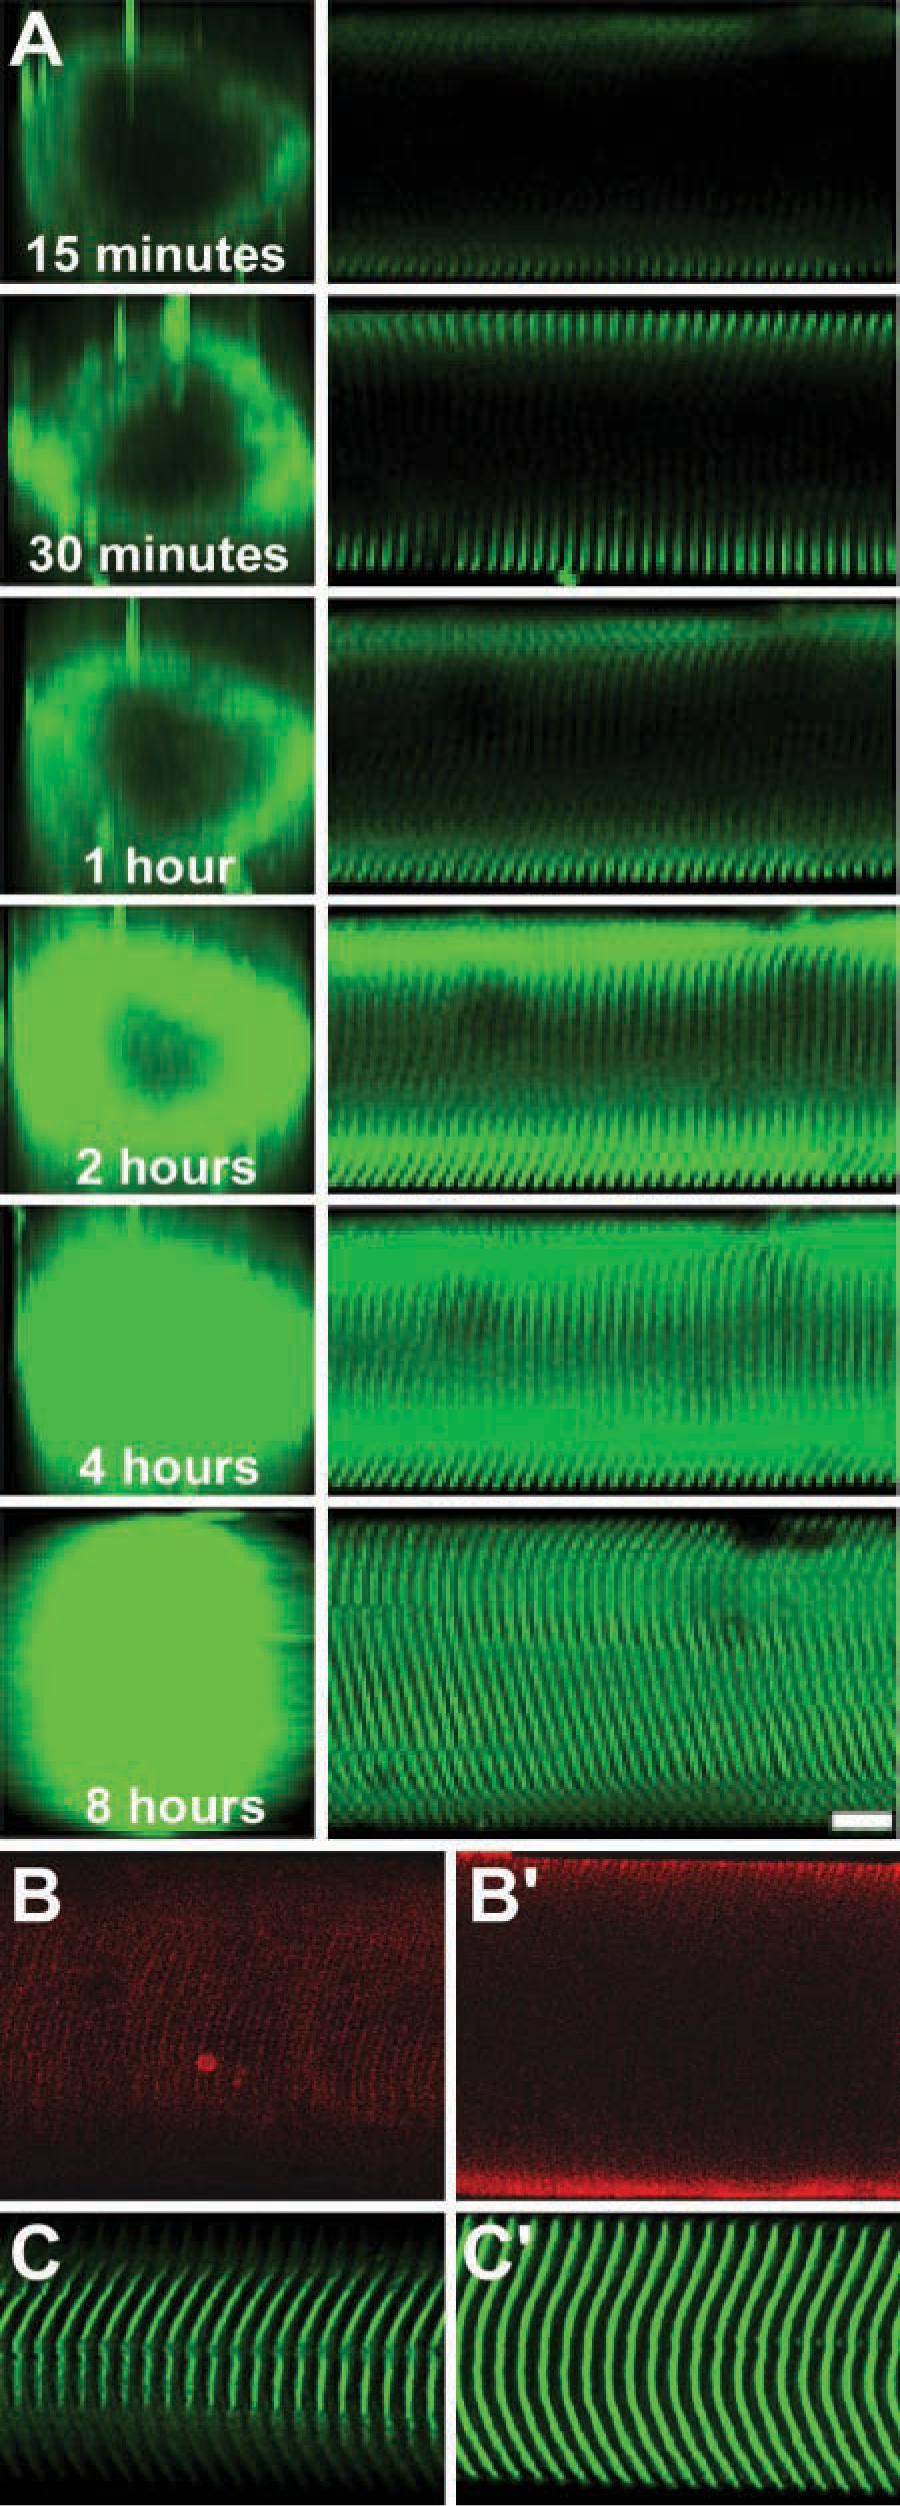
At least 8 hr of incubation with gentle agitation was required for complete labeling of α-actinin through the fiber lattice (Figure 2A). α-Actinin single labeling resulted in the expected striation pattern with striations overlapping the Z-bands when observed under phase microscopy (not shown) and extending across the entire fiber diameter (Figure 2B). In contrast to the α-actinin labeling, talin labeling reached steady state after only 3 hr (Table 1) and resulted in striations restricted to the cell membrane (Figure 2C). Autofluorescence was never observed in the absence of antibody incubation.
The relative positions of α-actinin and talin were tracked at various strains in double-labeled fibers (Figure 3A–3D). At all strains, talin co-localized with α-actinin at the Z-band periphery (Table 3). Another talin striation, of lower intensity, was observed between α-actinin striations, presumably at the M-line. A decrease in cell diameter was apparent with increasing strain (compare diameters, Figures 3A–3D). In addition, Z-bands spanning the fiber width maintained similar shear-induced curvature along the fiber axis at a given stretch, a feature exaggerated with increasing strain (compare Z-disk label, Figures 3A–3D). Shear was probably a result of the boundary conditions imposed by fiber attachment with suture.
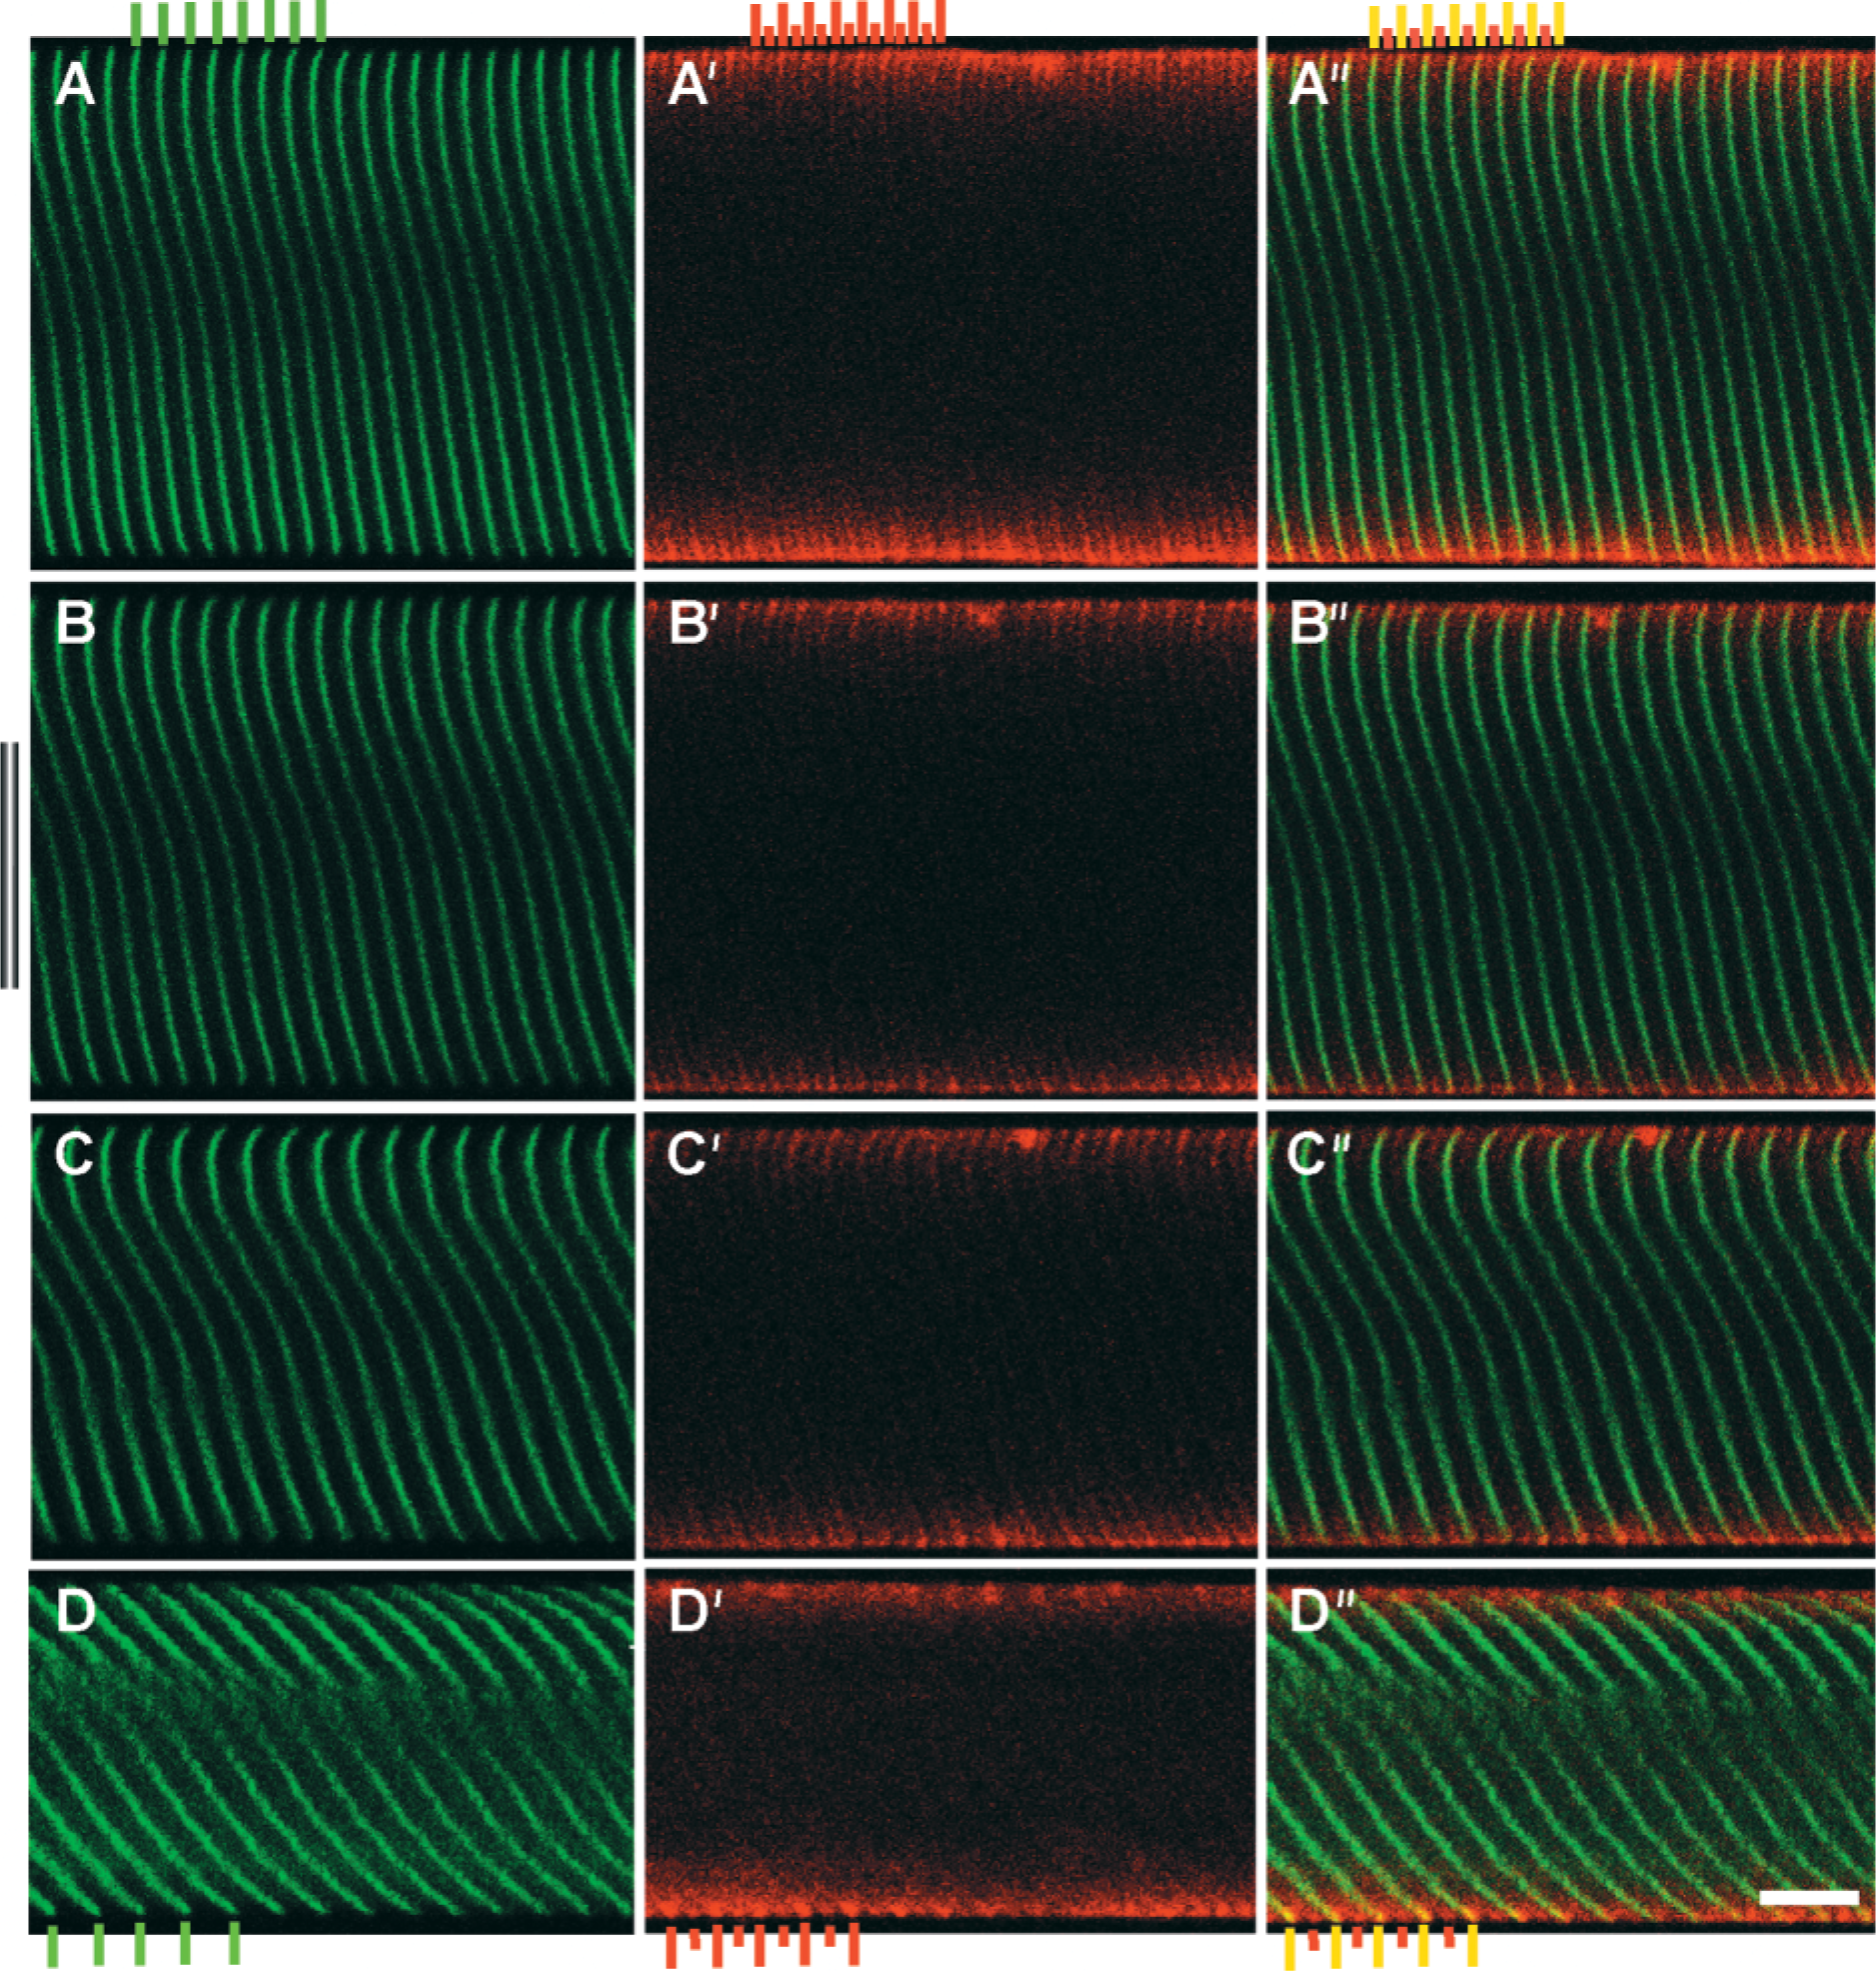
Fibers double-labeled for α-actinin and talin are displayed at increasing degrees of strain. Left frames (
Nuclear labeling occurred predominantly at the cell surface and displayed the expected ellipitical shape (Figure 4). Nuclear aspect ratio increased with strain, indicating a coupling of nuclear geometry to fiber geometry. Furthermore, the nucleus maintained a constant relative position with respect to Z-disks at various fiber strains.
Stress-Relaxation
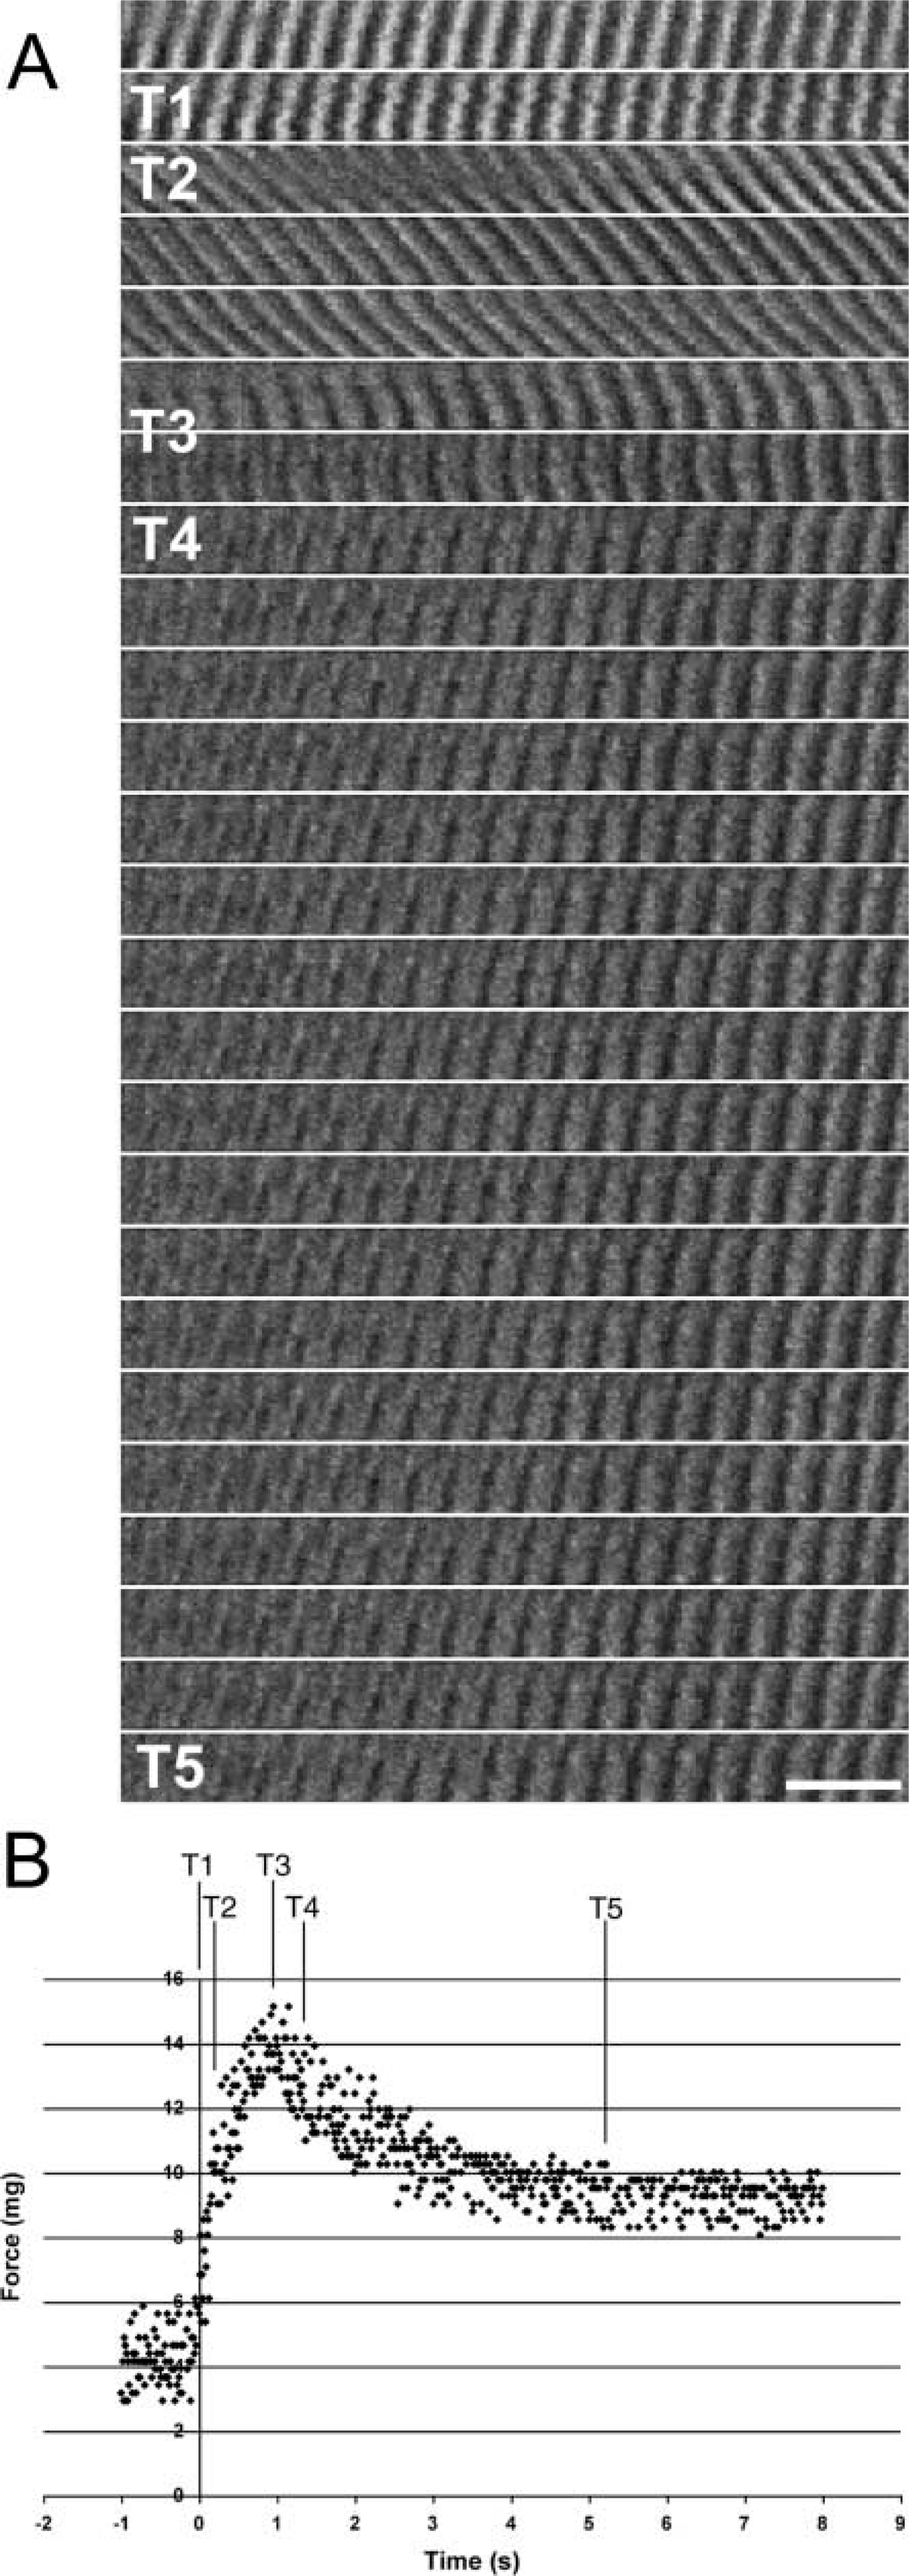
Five distinct mechanical phases were noted during the stress-relaxation experiment (Figure 5). During the initial phase of stretch (T1–T2), as a result of fiber movement through the field of view, distorted images (presumably imaging artifacts) were observed as the fiber rapidly translated from its resting position. Between T2 and T3, although force was still increasing, dramatic changes in Z-band orientation were observed. Surprisingly, even after stress had peaked (T3), changes in Z-disk orientation were still observed during the rapid relaxation phase (T3–T4). Finally, during slower relaxation (T4–T5), minor structural differences were observed. A trivial explanation for the changes in Z-band orientation observed between T2 and T4 was simply that different regions/optical planes of the fiber were moving into and out of the imaging field during stretch or relaxation. However, regions of the fiber segment corresponding to the initial and final regions imaged during stress-relation were also imaged in three dimensions before and after the stretch. Regions of similar Z-disk orientation to those seen during stress-relaxation were not found, suggesting that the significant changes in Z-band shearing within the region imaged were a real phenomenon during stress-relaxation.
Periodicities measured for sample wild-type images
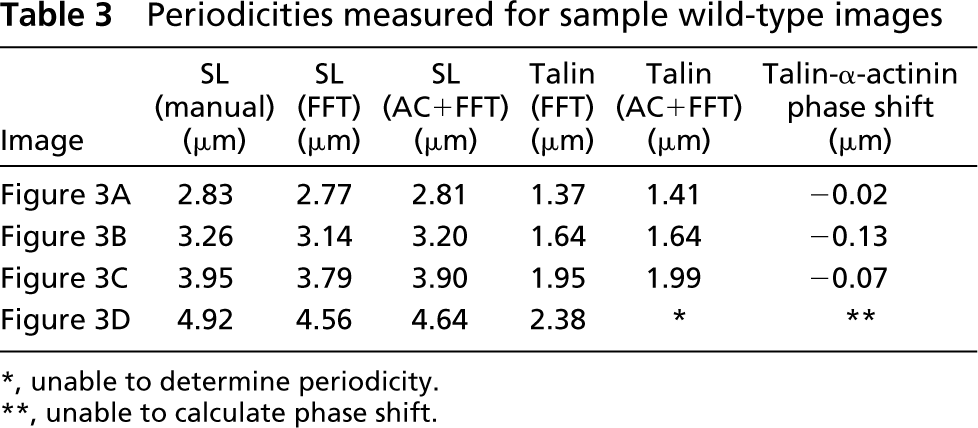
∗, unable to determine periodicity.
∗∗, unable to calculate phase shift.
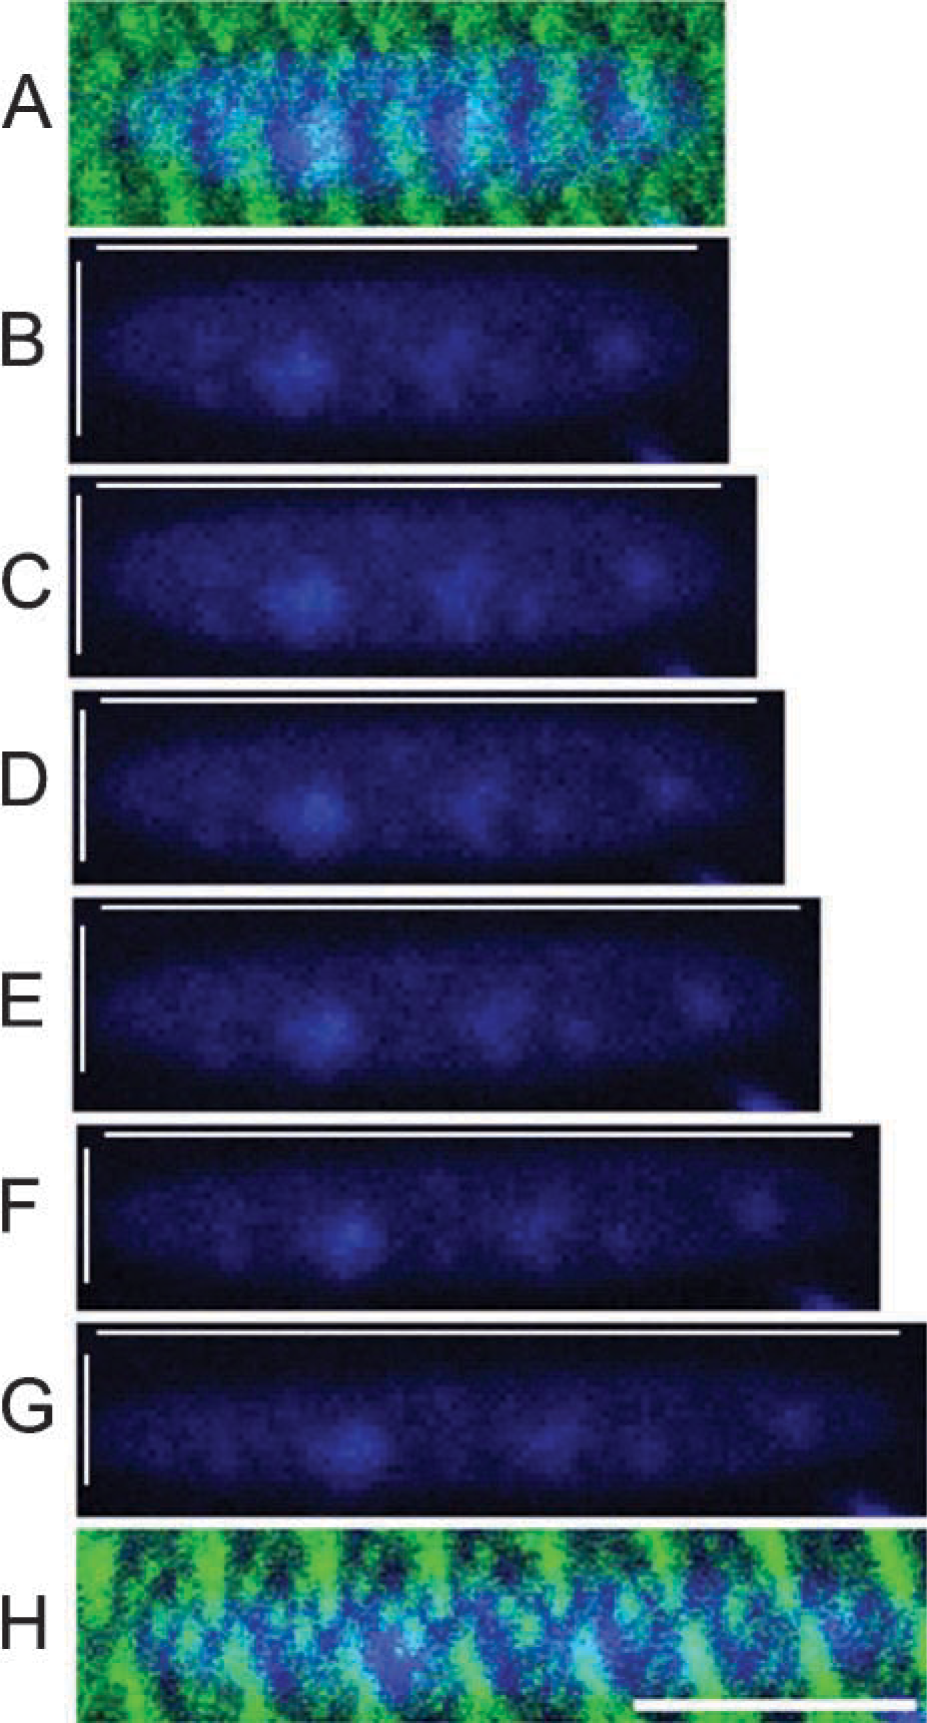
Nuclear labeling at increasing fiber strain. (
(
Image Processing
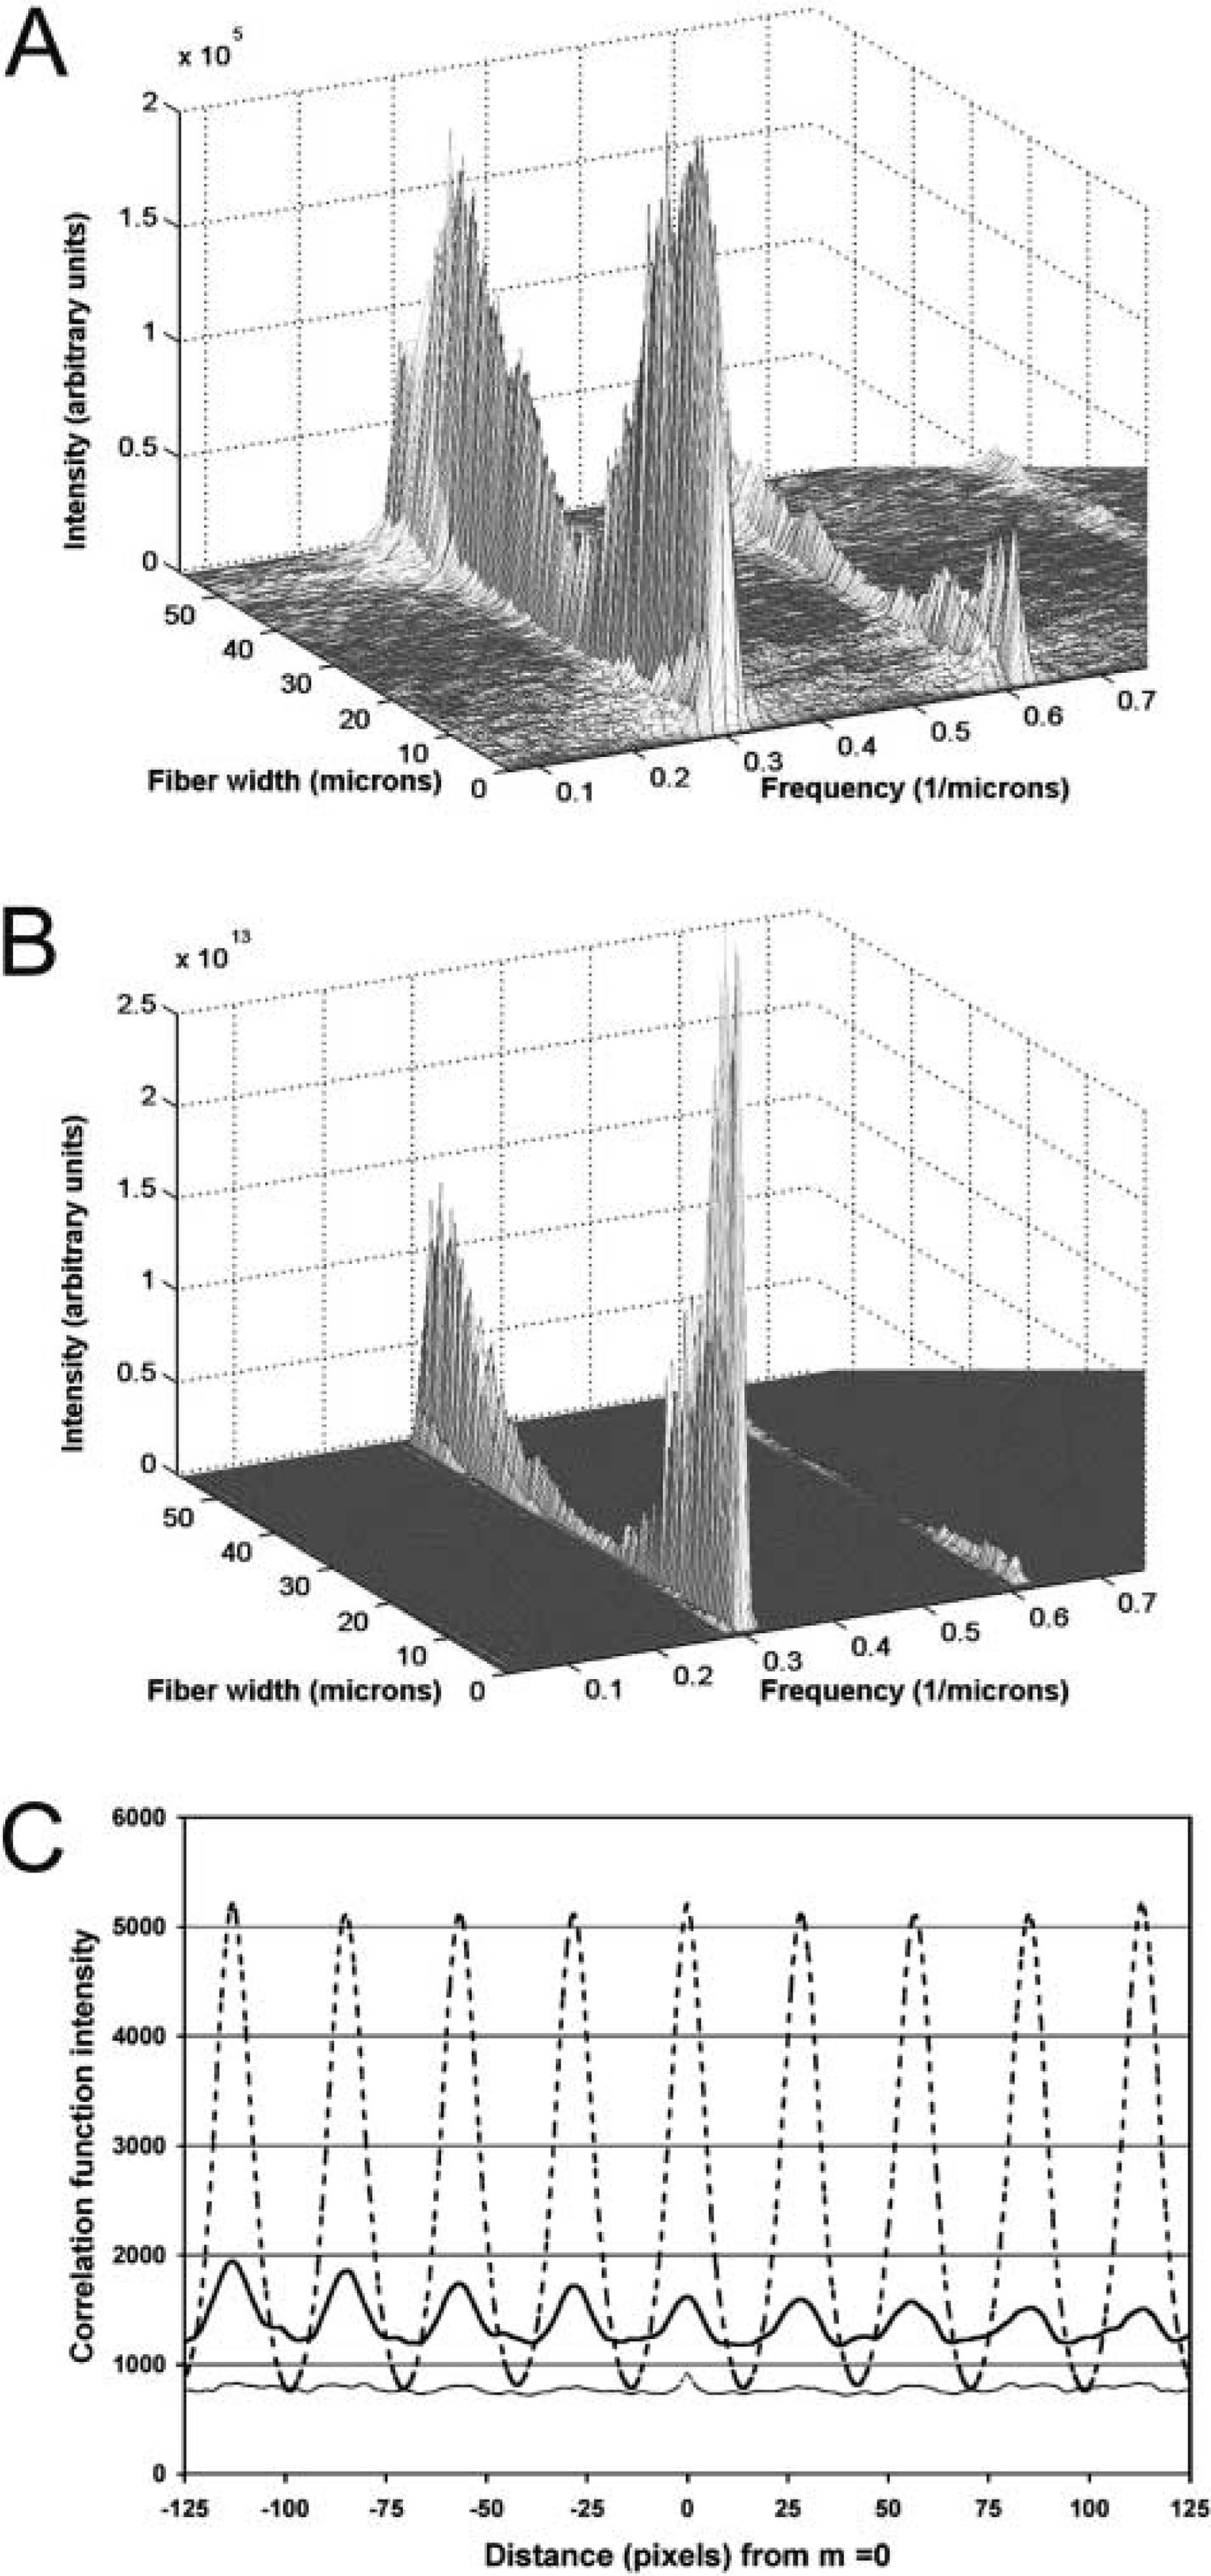
For the images shown in Figures 3A–3D, both functions returned similar periodicity values that were consistent with sarcomere lengths measured manually on 10–15 Z-disks (Table 3). Both techniques were also sensitive to the relative fluorescence intensity of individual rows. Towards the middle of the fiber width, where a slight decrease in fluorescence was seen (marked by double lines to the left of Figure 3B), there was a corresponding decrease in power spectrum intensity. Each technique was nevertheless sensitive enough to detect a dominant periodicity. The power spectrum for an FFT applied to the AC function (Figure 6B) was eight orders of magnitude higher than the spectrum for an FFT applied to a raw intensity profile, resulting in a greater signal-to-noise ratio. We noted that, at higher sarcomere lengths, when the talin label became less distinct, the FFT approach still yielded a periodicity, whereas the autocorrelation approach failed. Both approaches yielded similar periodicities for multiple processed images (t-test for 60 images at various sarcomere lengths from eight fibers: α-actinin, p>0.5; talin, p>0.75), confirming that the findings were not dependent on the analytical method. Mean periodicities for AC were 3.653 ± 0.097 and 1.854 ± 0.05 for α-actinin and talin, respectively, and for FFT, 3.563 ± 0.094 and 1.832 ± 0.047.
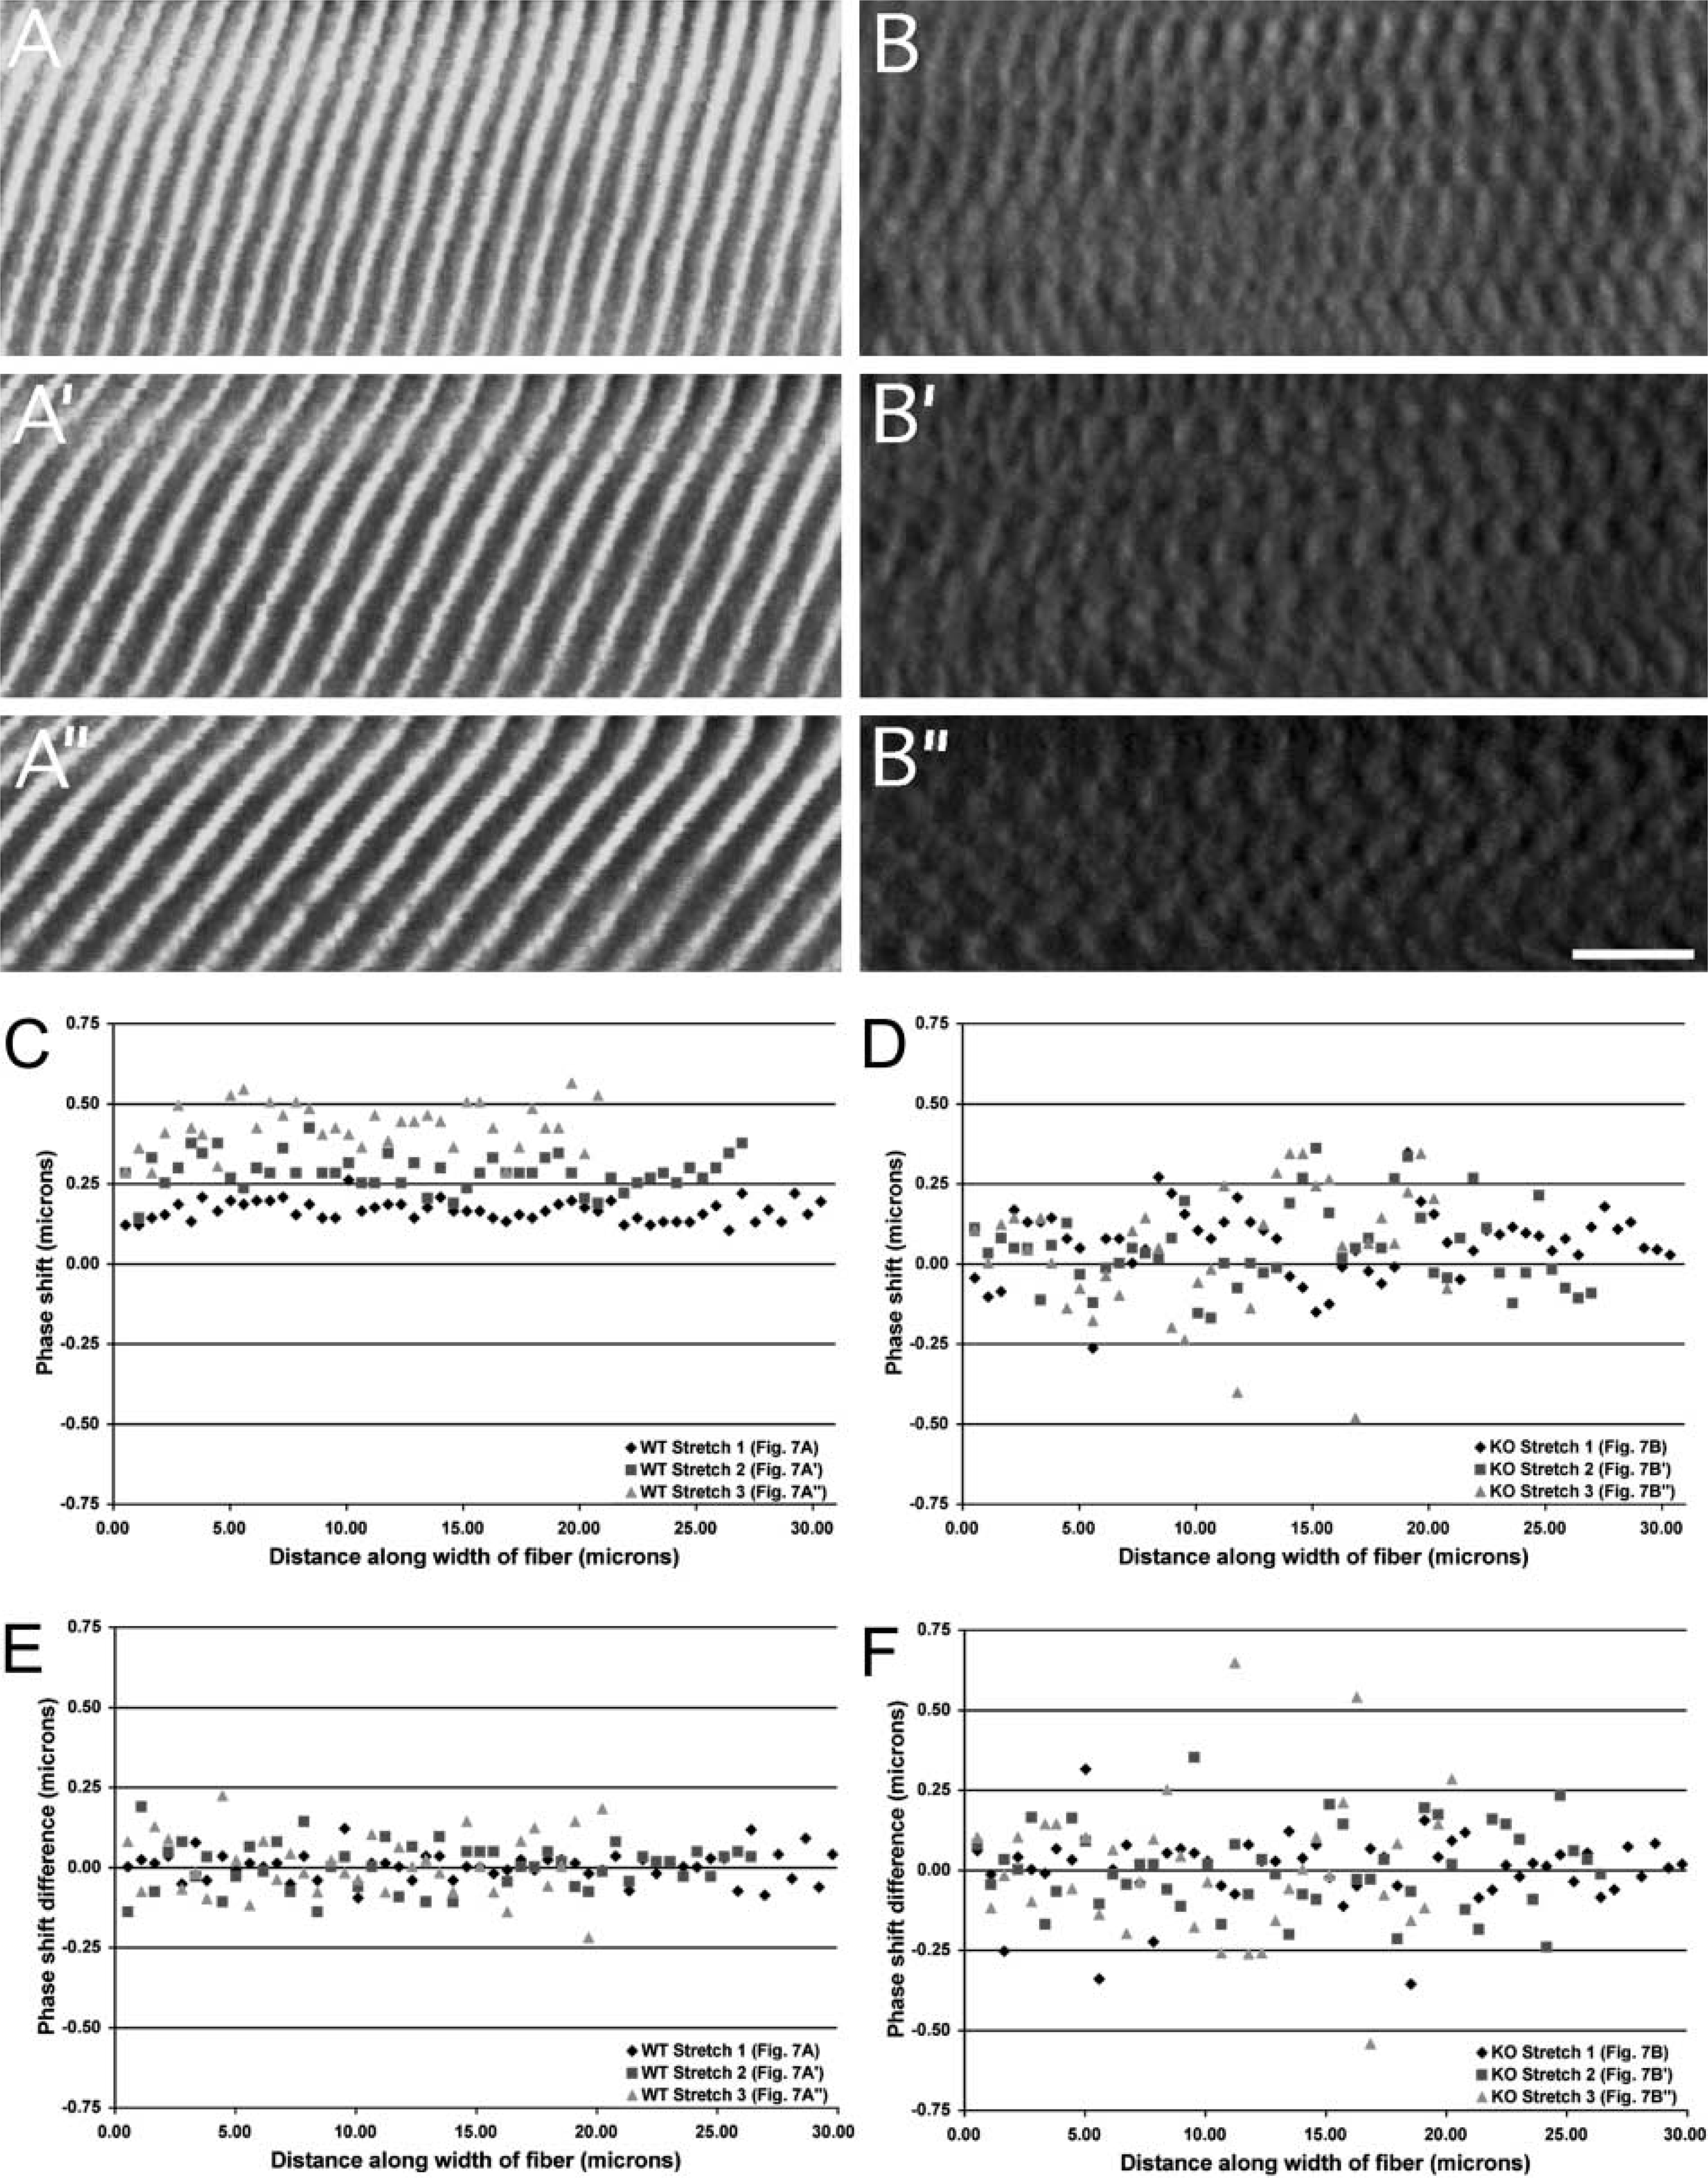
The intensity profile for talin was in phase with the profile for α-actinin at all sarcomere lengths (Figure 7C; Table 3), confirming tight connectivity between the two proteins. To determine whether our image processing techniques could distinguish among muscles whose images varied dramatically, sample images from a wild-type fiber (Figure 7A) and a fiber lacking the intermediate filament desmin (Figure 7B) were analyzed at three different strains. In wild-type fibers, phase shifts measured along the fiber width successfully reflected the curvature of the Z-disks across the fiber width (Figure 7C and 7D). Phase shifts increased with stretch, a result of the increasing shear shown in Figure 7A. However, the variance for each stretch remained low, suggesting that the fiber exhibited a high degree of myofibrillar connectivity even at high strains. On the other hand, images from the knockout fiber, although displaying clear periodicity along the length of the fiber, exhibited a low degree of connectivity, demonstrated by the higher variance (Figures 7B and 7D; Table 2).
(
An alternate indicator of connectivity was obtained by plotting the difference in the phase shift between consecutive myofibrils against position across the fiber width (Figures 7E and 7F; Table 2). A mean close to zero and low variance implied that consecutive myofibrils across the fiber behaved in a similar fashion, whereas a mean differing from zero or a mean equal to zero with a high variance implied a lack of connectivity among myofibrils. This measure differed from the previous measure of connectivity in one critical aspect: whereas variance in the phase shift along the fiber measured the average connectivity across the entire fiber width, the phase shift difference measured connectivity locally, or between consecutive myofibrils. Although the wild-type images all displayed a mean close to zero, implying a well-connected network across the entire fiber width, the knockout images displayed a mean close to zero but with a high variance, implying low connectivity (Figures 7E and 7F).
Discussion
Here we report a novel experimental system that permits simultaneous confocal imaging of cell structure and measurement of cell segment mechanical properties. The system offers tremendous potential in muscle to characterize the functional connections among proteins within the cell. Specifically, we are now able to quantify the degree to which loads borne by the fiber affect fiber geometry and myofibrillar strain fields, and vice versa, information previously unavailable from either immunolocalization or biochemical studies. In addition, we have exploited the periodicity existing in skeletal muscle to develop analytical tools that quantify the relative position of structures within the cell.
We initially employed this system to examine the interactions among three structures believed to be linked by the intermediate filament system: Z-disks, nuclei, and the costamere protein complexes located at the cell surface (Lazarides 1980,1982; Pardo et al. 1983a,b; Price and Sanger 1983). We demonstrated quantitatively in a sample wild-type fiber that there was significant connectivity among Z-disks in the same fiber at various sarcomere lengths, as well as between Z-disks and the costamere complexes, even in the presence of significant shear within the fiber (Figures 3 and 7). This finding is consistent with stereological findings at the EM level (Shah et al. 2002). Connectivity among myofibrils suggests a structural basis for the coupling of axial elongation and radial compression that occurs during muscle loading, even when the osmotic barrier is lost (Godt and Maughan 1977). The ability to track nuclear deformation with fiber deformation is particularly powerful from the perspective of understanding mechanisms of cell signaling. By observing nuclear deformation after the depolymerization of the intermediate filament network, Maniotis et al. (1997) proposed the possibility of a mechano-transduction signaling pathway in endothelial cells, mediated by intermediate filament-nuclear interactions. Using our system, we confirmed a physical coupling between nuclear deformation and fiber deformation in muscle cells, as evidenced by an increase in nuclear aspect ratio with fiber strain (Figure 4).
Wild-type (
In addition to imaging of steady-state passive mechanical properties of fiber segments, we also attempted to observe structural changes dynamically during stress-relaxation. We observed shifts in cytoskeletal orientation both during stretch and during the rapid stress-relaxation phase, and we speculate that, in addition to titin-mediated longitudinal reorganization of the sarcomere lattice, stress decreases immediately after stretch in part due to viscous energy lost during cytoskeletal reorganization.
Finally, we have attempted to introduce analytical tools to characterize images in a more systematic fashion, potentially aiding in the development of more accurate structural computational models for muscle mechanics or providing quantitative definitions of muscle pathology. The FFT has been used by muscle biologists to calculate sarcomere lengths (Gannier et al. 1993; Helmes et al. 1999; Weiwad et al. 2000; Ockleford et al. 2002). To date, however, relative positions between periodic structures have not been quantified. The use of the autocorrelation function to amplify the intensity profile of a row of image data (i.e., AC function peaks are the square of intensity profile peaks) before the use of the FFT offers an eight order of magnitude increase in signal-to-noise ratio, thereby enhancing the accuracy of the FFT. In addition, by comparing autocorrelation functions to cross-correlation functions across the width of the fiber, valuable phase data are also obtained. Despite the tremendous advantages of the auto- and cross-correlation functions for extremely noisy data, we observed that correlation functions were not always robust, as seen by the ability of the FFT, but not the AC followed by FFT, to generate reasonable periodicities for talin at extremely high sarcomere lengths. The decision as to which tool to use must therefore be weighed according to an image- or study-dependent basis.
Our system is particularly powerful when used in combination with appropriate combinations of antibody labels and animal models. The impact of specific variables on fiber performance, such as presence, absence, or modification of a protein, can be readily assayed. We are encouraged by the demonstrated differences in connectivity between the wild-type and desmin-null fiber tested using this system (Figures 7B, 7D, and 7F). A separate study using complete data sets, outside of the scope of the methodology reported here, will provide a more complete comparison between these genotypes.
Footnotes
Acknowledgements
Supported by National Institutes of Health grants AR40050 and AR40539 and by the Department of Veterans Affairs Rehabilitation Research and Development Service.
We thank Dr Jan Fridén, Dr Gordon Lutz, Pat Reid, and Jennifer Davis for helpful discussions, and Dr Yassemi Capetanaki (Baylor University) for providing the desminnull mouse used in this study.