
Abstract
Examination of repaired spinal cord tracts has usually required separate groups of animals for anterograde and retrograde tracing owing to the incompatibility of techniques such as tissue fixation. However, anterograde and retrograde labeling of different animals subjected to the same repair may not allow accurate examination of that repair strategy because widely variable results can occur in animals subjected to the same strategy. We have developed a reliable method of labeling spinal cord motor tracts bidirectionally in the same animal using DiI, a lipophilic dye, to anterogradely label the corticospinal tract and Fluoro-Gold (FG) to retrogradely label cortical and brainstem neurons of several spinal cord motor tracts in normal and injured adult rats. Other tracer combinations (lipophilic dyes or fluorescent dextrans) were also investigated but were less effective. We also developed methods to minimize autofluorescence with the DiI/FG technique, and found that the DiI/FG technique is compatible with decalcification and immunohistochemistry for several markers relevant for studies of spinal cord regeneration. Thus, the use of anterograde DiI and retrograde FG is a novel technique for bidirectional labeling of the motor tracts of the adult spinal cord with fluorescent tracers and should be useful for demonstrating neurite regeneration in studies of spinal cord repair. (
Keywords
R
In reports of improved spinal cord function, not all the animals in a given experimental repair group had successful repair (Cheng et al. 1996; Ramon–Cueto et al. 2000; Schnell et al. 1994). Therefore, relying on only unidirectional labeling or bidirectional labeling in different animals may be inaccurate because the extent of axon regeneration and function of the animal that has undergone anterograde tracing may not be the same as in the animal that underwent retrograde tracing. The anterograde or retrograde tracer may not allow visualization of axons that have regenerated only part of the way across the injury site, or the animal with anterograde tracing may have shown regeneration while the animal with retrograde tracing did not. Variability in response of animals subjected to the same strategy has not been well studied, and the availability of a simultaneous bidirectional technique would allow a more complete examination to determine the cause and to reduce the number of animals required for spinal cord repair studies.
The study of post-traumatic spinal cord regeneration also requires different axon tracing techniques than those used to demonstrate the anatomy or development of the central nervous system or regeneration within the brain. Many available axon tracing techniques lack one or more of the following essential features for spinal cord regeneration studies: demonstration of regeneration by both anterograde and retrograde techniques in the same animal; use of tracers that reliably label the majority of the axons of the spinal cord; ease of simultaneous application and visualization of the tracers; and compatibility with immunohistochemistry or decalcification.
The ideal axon tracing methodology after spinal cord repair would allow identification and differentiation in the same animal of axons regenerating in a rostral or caudal direction through the lesion. Furthermore, techniques for labeling of tracts in the repaired spinal cord should be highly sensitive and should unequivocally label a large proportion of regenerating axons, because the extent of regeneration may not be robust. After spinal cord repair, animals are often frail, and therefore the optimal tracing technique should be uncomplicated and require only a minimal period of surgery. For example, insertion of both tracers should be accomplished at a single surgery to decrease the mortality and morbidity of multiple surgical procedures. Processing of the tissue should be rapid, uncomplicated, and reliable. Spinal cord tissue after a repair strategy is often easily torn and may contain many cystic cavities. Consequently, a tracing technique compatible with decalcification would be desirable to facilitate harvesting of this friable tissue from the bony spinal column without disruption of tissue architecture. Processing of the tissue to visualize the tracers should also be compatible with additional procedures such as immunohistochemistry.
Our goal was to develop optimal methods for axonal tracing to study axon regeneration in the spinal cord. Several tracers were investigated singly and in combination, including 1,1′-dioctadecyl-3,3,3′,3′-tetramethylindocarbocyanine perchlorate (DiI), 4-(4-(dilinoleylamino)styryl)-N-methylpyridinium, 4-chlorobenzenesulfonate (DiA), 3,3′-dilinoleyloxacarbocyanine perchlorate (DiO), rhodamine green–dextran (RGD) 10,000 molecular weight (MW), rhodamine green–lysine fixable dextran (RGLD) 10,000 MW, fluoroscein green–dextran (FnGD) 3000 MW, and Fluoro-Gold (FG). Tracers frequently used for investigating axon regeneration, such as wheat germ agglutinin–horseradish peroxidase (WGA–HRP) and biotinylated dextran amine (BDA) were not included in this study because of their major shortcomings that we and others have experienced, such as the requirement of additional more complicated immunohistochemical reactions required to visualize the tracers (Ramon–Cueto et al. 2000; Romero et al. 1999), significant tracer artifact (Romero et al. 1999), and unreliable labeling (Vercelli et al. 2000).
We found that the ideal combination was DiI to label the corticospinal tract (CST) in an anterograde direction and Fluoro-Gold to label the CST and other spinal motor tracts in a retrograde direction. Therefore, we have developed a novel method in which anterograde and retrograde fluorescent tracers are used simultaneously in the same animal to examine axon regeneration in the adult mammalian spinal cord. This method is reliable, sensitive, and compatible with subsequent tissue processing, and is also compatible with autofluorescence elimination strategies, decalcification, and immunohistochemistry. We report our results with these tracers in normal and injured rats.
Materials and Methods
Animals and Tracer Materials
Adult female Sprague–Dawley or Lewis rats (Charles River; St Constant, PQ, Canada) (n = 60, 200–500 g) were used for this investigation. Two strains of rats were chosen because we planned to examine strain differences in recovery after spinal cord repair. Fast DiI (D-7756), Fast DiA (D-7758), Fast DiO (D-3898), RGD (D-7152), RGLD (D-7153), and FnGD (D-3305) were obtained from Molecular Probes (Eugene, OR), and FG was obtained from Fluorochrome (Denver, CO). The animal protocols were approved by the Animal Care Committee of the Research Institute of the University Health Network in accordance with policies established by the Canadian Council of Animal Care.
Anterograde Labeling of the CST
Rats were anesthetized with 2% halothane with 1:2 N2O and oxygen. For DiI labeling, rats underwent a unilateral craniotomy centered at a point 2 mm lateral to the bregma. With an 11 scalpel blade, a stab incision was made incising the dura and the sensorimotor cortex to a depth of approximately 1.5 mm to label the motor cortex neurons projecting to the hindlimb. If cortical vessels were encountered at the intended incision site, the site was moved immediately rostral or caudal to the cortical vessel. Using forceps (Dumont Biologie tip; Fine Science Tools, North Vancouver, BC, Canada), one to four DiI crystals (total diameter of approximately 1 mm) were then inserted into the depth of the cortical incision with forceps such that the cortical edges became approximated and covered the crystals. Gelfoam (Pharmacia & Upjohn; Mississauga, ONT, Canada) was then placed over the craniotomy site and the scalp closed with 3–0 Vicryl sutures (Johnson & Johnson; Peterborough, ONT, Canada). Animals with anterograde CST labeling were sacrificed at 3 (n = 7), 5 (n = 2), 7 (n = 5), 14 (n = 3), 21 (n = 7), or 144 (n = 1) days. The entire brain and spinal cord were prepared as described below, except that the spinal cord was transected into 1-cm-long blocks with a razor blade from the first cervical level to the conus medullaris to determine the extent and rate at which DiI traveled in vivo. Six to eight serial cryostat cross-sections (60 μm) from the rostral end of each 1-cm block were examined for DiI labeling.
Retrograde Tracing
A successful retrograde tracer was defined as a tracer that would label at 14 to 21 days the sensorimotor cortex and brainstem nuclei of the spinal motor tracts (red nucleus, raphe nucleus, reticulospinal nucleus, and vestibular nucleus) and could be clearly distinguished from the DiI fluorescent signal. For retrograde labeling, the following tracers were used: DiA (n = 2), DiO (n = 3), RGD (n = 3), RGLD (n = 4), FnGD (n = 2), and FG (n = 8). DiI was also examined for its characteristics as a retrograde tracer alone (n = 5). For insertion of the retrograde tracers, rats underwent laminectomy at T13 and complete spinal cord transection with microscissors. For DiI, DiA, and DiO labeling, crystals (diameter 0.1–0.5 mm) were placed against the rostral stump of the transected cord such that the transected surface was covered and the gap between crystals was no more than 0.1 mm. Gelfoam was then placed into the transection site to hold the crystals in place and the wound was closed in layers as described below. For RGD, RGLD, FnGD, and FG retrograde labeling, pledgets of Gelfoam (0.5 mm2) were soaked in a solution of the tracers in normal saline (10% for RGD, RGLD, and FnGD; 4% for FG) and then placed in the transection site. Petroleum jelly (Sherwood Medical; St Louis, MO) was then placed over the spinal cord at the laminectomy site, the muscles closed with 3–0 Vicryl (Johnson & Johnson), and the skin closed with Michel suture clips (Fine Science Tools). After 14 or 21 days, the tissue was prepared as described below and the cord and brain sections were examined for evidence of retrograde labeling.
Tissue Preparation
All animals were sacrificed by IP injection of 0.7–1.0 ml of sodium pentobarbital (65 mg/ml). After thoracotomy, they received an intracardiac injection of 1 ml of 1000 U/ml heparin and then perfusion with 500 ml of 4% paraformaldehyde in 0.1 M phosphate buffer (PB). The brain and spinal cord were removed, cryoprotected with 30% sucrose in PB (24 hr, 4C), and then frozen and embedded in Frozen Section Medium (FSM) compound (Stephens Scientific; Riverdale, NJ). Coronal sections of the entire brain were cut in a cryostat at 40 μm, and cross- or parasagittal sections of the spinal cord blocks were cut at 20 μm and mounted on cold (–20C) Superfrosted Plus slides (Fisher Scientific; Markham, ONT, Canada). Brain sections were left to dry and selected sections treated for autofluorescence (see below). Spinal cord sections were examined for DiI and FG using a fluorescent microscope and filter blocks as described below. Sections for immunohistochemistry were kept frozen at −80C and processed for immunohistochemistry at a later date, or were kept hydrated with 0.1 M PBS, photographed, and then processed for immunohistochemistry.
Investigation of Nonspecific Tracer Labeling
As described above, only the combination of DiI and FG provided optimal labeling, defined as labeling of the axons and cell bodies, respectively, at 14 to 21 days without overlap of the fluorescent emission signals when viewed with the specific filter blocks used. To examine whether the tracers would travel across a complete spinal cord transection site without any axon connection and thereby cause nonspecific tracer labeling, control animals (n = 4) had a complete spinal cord transection at T8 and then underwent spinal cord labeling with DiI and FG at 8–12 weeks after transection. At 21 days after placement of the tracers, the animals were sacrificed and the transection site and brain were examined for evidence of nonspecific tracer labeling. Parasagittal sections of the T8 transection site were examined for DiI or FG rostral or caudal to the transection site. Coronal sections of the brain were also examined for Fluoro-Gold and DiI labeling. Autofluorescent cells were distinguished from true tracer-labeled cells, as described below.
Elimination of Autofluorescence
Animals with spinal cord transection showed significant autofluorescence of cortical, brainstem, and spinal neurons, which interfered with identification of labeling. It is known that axotomy increases lipofuscin pigment in the trigeminal ganglion (Lee et al. 1988). Although we have not studied this in detail, it is our impression that autofluorescence is increased after spinal cord transection. Three strategies were employed to eliminate autofluorescence interference: (a) the multiple filter block (MFB) strategy: neurons were examined with three different filter blocks and a neuron was considered labeled if it fluoresced with only one of the three filter blocks; (b) the Sudan Black B (SBB) strategy: a modification of Romijn's technique (Romijn et al. 1999) was used. After the sections were cut and dried on slides they were dipped in Tris buffer (TB; Fisher Scientific, Markham, ONT, Canada; pH 8.0), and then 70% ethanol. Sections were then stained with 0.3% SBB (BDH; Toronto, ONT, Canada) in 70% ethanol for 10 min (RT), and washed in TB; (c) cupric sulfate (CuS) strategy as described by Schnell et al. (1999). Dried sections were washed in 0.1 M PBS, dipped in distilled water, and treated with 0.5% CuSO4 (Sigma) in ammonium acetate buffer (50 mM, pH 5.0; Sigma) for 10 or 90 min, washed with distilled water or 0.1 M PBS, and then visualized hydrated. If sections dried out before viewing, they were rehydrated with 0.1 M PBS.
To determine the effectiveness of these strategies to eliminate autofluorescence, photographs of brainstem nuclei of normal animals and animals with complete cord transection labeled with the FG and DiI technique were taken before and after staining with SBB and CuS. The photographs were then compared side by side to determine if autofluorescence had been suppressed and whether DiI and FG labeling were retained and/or diminished. Sections were also examined several days after the autofluorescence suppression strategies to determine whether the SBB or CuS had any long-term effects on labeled or autofluorescent cells.
Decalcification
Using one animal with no spinal cord injury and three animals with complete spinal cord transection, we examined three decalcification protocols with the aim of obtaining optimal preservation of antigen sites and of DiI and FG signals: (a) formic acid (Sigma; 57 ml of 88% solution in 500 ml of distilled H2O); (b) 10% ethylenediamine tetraacetic acid (EDTA; Fisher Scientific); and (c) 1 part 4% paraformaldehyde to 9 parts EDTA solution (100 g EDTA, 600 ml DDH2O, and 280 ml 1 N NaOH, cleared with NaOH, pH 7.4) as described by von Bartheld et al. (1990). The tissues were perfused as detailed above and 2.5-cm segments of the vertebral column containing the spinal cord were placed in one of the above three decalcification solutions on a shaker table.
The end point for decalcification was checked daily with 5% ammonium hydroxide and 5% ammonium oxalate until there was no evidence of a precipitate. The tissue was placed in fresh 4% paraformaldehyde for 8 hr and then cryoprotected in 30% SPB for at least 24 hr at 4C, frozen, embedded in FSM, and parasagittally sectioned at 20 μm on a cryostat at −20C. Sections were mounted on cold (–20C) Superfrost Plus slides and examined for FG and DiI.
Immunohistochemistry
All antibodies described below were examined for compatibility with DiI-FG-labeled tissue and DiI–FG-labeled decalcified tissue. The following primary monoclonal antibodies were used for immunohistochemistry: mouse anti-neurofilament 200, phosphorylated and non-phosphorylated clone N52 (NF200; 1:500, Sigma) (Schumacher et al. 1999); mouse anti-glial fibrillary acidic protein [GFAP, 1:200; Boehringer-Mannheim, Mannheim, Germany; (Agrawal et al. 1998)]; MAS 370 mouse anti-rat CD11b/c equivalent clone OX 42 [OX42 1:1000; Harlen Sera-Lab, Loughborough, UK (Brook et al. 1998; Popovich et al. 1997)]; mouse anti-rat monocytes/macrophages [ED1;1:200, Chemicon, Temecula, CA; (Fitch et al. 1999; Popovich et al. 1997)]; and mouse anti-chondroitin sulfate clone CS-56 [CS56, 1:100; Sigma; (Fitch et al. 1999, #36)]. Polyclonal antibodies included rabbit anti-calcitonin gene-related peptide [CGRP 1:3000; DiaSorin, Stillwater, MN (Brook et al. 1998)], rabbit anti-serotonin [5-HT; 1:10 000, DiaSorin, Stillwater, MN; (Brook et al. 1998)], and rabbit anti-NG2 chondroitin sulfate proteoglycan [NG2 1:800; Chemicon, Temecula, CA (Levine and Nishiyama 1996)].
All sections were washed three times with PBS for 10 min, and then blocked for endogenous peroxidase and/or for nonspecific antibody binding. Endogenous peroxidases were blocked with 1% H2O2 for 30 min for GFAP, OX42, and NG2, and for 10 min for 5HT and CGRP. Nonspecific antibody binding was blocked at room temperature (RT) for 1 hr with the following: 10% heat-inactivated goat serum (HIGS) in PBS containing 0.3% Triton X-100 for NF200 and GFAP; 20% HIGS in PBS for NG2, 4% normal goat serum (NGS) in PBS containing 0.1% Triton X-100 for ED-1 and CS56; and 3% NGS in 1% bovine serum albumin in PBS containing 0.5% Triton X-100 for OX42. The primary antibodies were then applied to the sections and incubated overnight at 4C. All primary antibodies were diluted in blocking solutions with the exception of the following: 5HT and CGRP were diluted in 0.3% Triton X-100 in PBS and OX42 and NG2 were diluted in PBS. Sections were then washed three times in PBS and incubated with the secondary antibody, Alexa Fluor 488 goat anti-mouse and goat anti-rabbit IgG (H + L) conjugate highly cross-adsorbed (1:500 dilution in PBS; Molecular Probes) applied for 1 hr at RT. Although both the Alexa Fluor 350 (1:500 dilution in PBS; Molecular Probes) and the Alexa Fluor 488 were used as the secondary antibody for the NF200 stain, the Alexa Fluor 488 was found to be superior because it had a very intense signal and was more easily distinguished from the DiI and FG signals. Therefore, Alexa Fluor 488 was the secondary antibody used for all the other immunohistochemical stains. The appropriate negative controls were made with the omission of the primary antibodies. In the early stages, some sections were coverslipped with Mowiol (Calbiochem Hoechst; La Jolla, CA), but this was discontinued because of nonspecific spread of DiI within hours. Therefore, sections were mounted without coverslipping or were coverslipped with PBS.
A fluorescent microscope (Nikon Eclipse TE300) was used for fluorescence histological examination with the following filter blocks: Tx Red (excitation filter 540–580 nm, dichroic mirror DM 595, barrier filter BA 600-660); G-2A (excitation filter 510–560, dichroic mirror DM575, barrier filter BA590); B-2E (excitation filter 450–490, dichroic mirror DM 505, emission 520–560); and UV-2A (excitation filter 330–380, dichroic mirror DM 400, barrier filter BA420). Images were captured using a Nikon camera or an Optronics digital camera and the Bioquant Image Analysis system. Composite figures were made using Corel Photo-Paint 8 (version 8.232).
Confocal images were obtained with a BioRad 600 confocal inverted microscope. In two normal and two transected rats, the spinal cord was examined before sectioning with the confocal to look for DiI labeling of the corticospinal tract by hydrating the cord with PBS and placing it between two coverslips. Cords that had been sectioned and that underwent immunocytochemistry (n = 4) were also examined with the confocal.
Results
Anterograde DiI Labeling of the CST
Examination of serial sections of the brain and spinal cord of animals sacrificed at 3, 5, 7, 14, 21, or 144 days after placement of the DiI in the sensorimotor cortex revealed that the DiI signal could not be visualized in the spinal cord at 3 days. At 5, 7, or 144 days, DiI-labeled axons were seen throughout the entire length of the CST to the conus medullaris with an Optronics camera. However, the optimal time for DiI visualization was at 14 and 21 days after placement, at which time the DiI signal was strikingly intense and could be visualized throughout the entire corticospinal tract without the cumulative exposure afforded by the Optronics camera. In contrast to DiI in postmortem spinal cord labeling, where the signal appears to travel down the cord in a wave (Lukas et al. 1998), DiI in vivo labeled the entire CST after 5 days and the signal became significantly more intense after 14 days.
Histological examination of the brain after labeling revealed a diffuse red haze confined to the ipsilateral cerebral hemisphere in which individual neurons were not distinguishable. However, the internal capsule and the CST in the cerebral peduncle and medullary pyramid were heavily and discretely labeled, and their individual axons could be distinguished (see Figures 1B, 1D, 1G, 1H, and 1I). With progression caudally, DiI labeling was confined to the unilateral CST located at the ventral aspect of the dorsal columns in the cord (Figures 1J and 1K). Parasagittal sections of the cord revealed markedly dense labeling of the axons of the CST, and individual axons could be easily distinguished against the low background signal (Figures 1I, 1L, 2A, 2C, 2E, and 2F). The DiI signal was observed in 100% of animals labeled. Therefore, DiI labeled the axons of the CST in the brain and the entire spinal cord selectively, densely, and reliably.
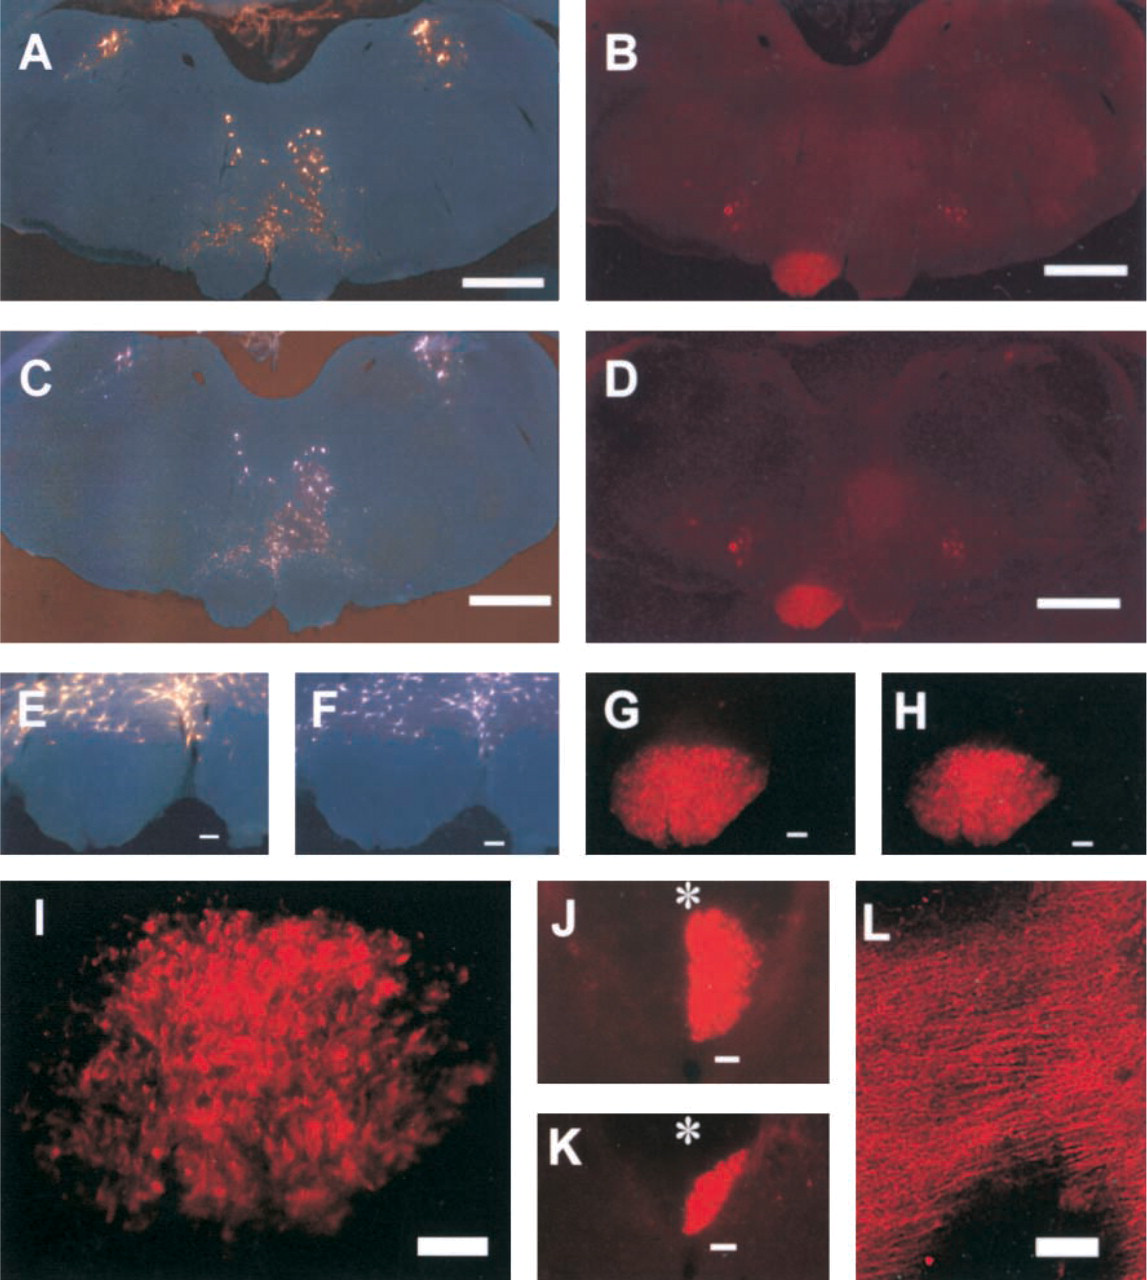
Anterograde and retrograde brainstem labeling before and after CuS staining in an uninjured rat, and CST labeling in the spinal cord. The same coronal section showing retrograde FG labeling of raphe, reticulospinal, and vestibulospinal neurons viewed with the UV-2A filter block (
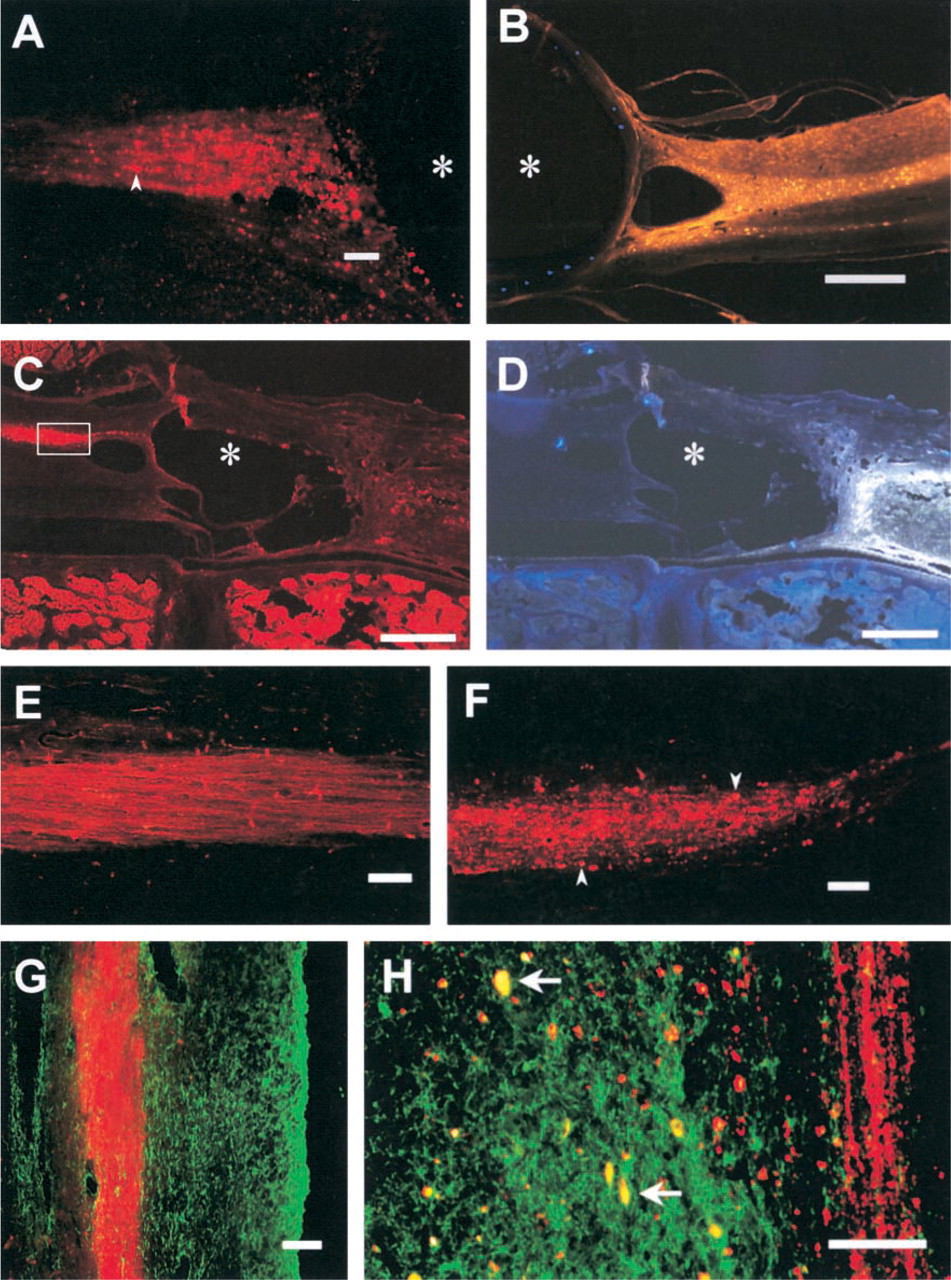
The DiI-FG technique is compatible with decalcification and immunohistochemistry. (
The optimal time for examination of DiI-labeled axons was within 24 hr of sectioning. After this time the axons were less distinct and the signal was weaker. Uncut tissue blocks could still show brightly labeled axons for at least 1 year without losing the distinct labeling of the membrane and without nonspecific spread of the DiI. The blurring of the signal after sectioning may be due to disruption of the cell membrane, causing the DiI to leach out of the membrane. Axons may appear faintly labeled at the cut surface of the section because DiI may leak out of the sectioned axon. In contrast, the brightly labeled axons do not blur because they are within the plane of the section and are intact. Tissue blocks can be kept for at least 1 year without sectioning, and when subsequently sectioned distinct axons could be visualized. There were no strain differences between the Sprague–Dawley and Lewis rats in the extent or speed of DiI labeling of the corticospinal tract.
Retrograde Tracing
Because DiI was found to densely label the entire CST 14–21 days after implantation, other tracers, including DiA, DiO, RGD, RGLD, FnGD, and FG, were investigated as possible retrograde tracers alone and in combination with DiI at the 21-day interval. FnGD-labeled axons and cell bodies were difficult to distinguish from background. Although DiO-labeled axons were easily distinguishable from background and from DiI-labeled axons when the appropriate filter blocks were used, DiO labeled only axons or neuronal cell bodies up to 1 cm distal to the implantation site. With the filter blocks described below, DiA, RGD, and RGLD were difficult to differentiate from the DiI tracer signal, and therefore it was difficult to determine unequivocally whether the axon or neuronal cell body was labeled with DiI or the other tracer. In contrast, FG showed no overlap in signal with DiI and intensely labeled the cortical and brainstem motor nuclei at 14 and 21 days (Figures 1A–1H). However, not all cortical neurons retrogradely labeled by FG ipsilateral to DiI implantation were visualized because of the artifact from the surgical implantation of DiI. Both DiI and FG labeling could be well visualized in sections prepared up to 1 year previously.
Although occasional brightly labeled FG labeled neurites could be visualized in the spinal cord, more commonly individual FG neurites could not be distinguished. This may be because so many neurites are labeled with FG that individual neurites could not be distinguished. There were no strain differences between the Sprague–Dawley and Lewis rats in the extent or speed of FG retrograde labeling.
DiI alone was also examined as a retrograde tracer. At 21 days after placement in the transected cord at T13, retrograde labeling of the neurons of the sensorimotor cortex, red nucleus, raphe nucleus, vestibular nucleus, and reticulospinal nucleus was detected. In one animal there was no labeling of the motor nuclei, although there was labeling of the nucleus gracilis. This may have been due to dislodgement of the DiI crystals after placement in vivo. As was the case with FG, attempts to visualize individual retrogradely labeled DiI axons in the spinal cord were not successful. Therefore, DiI is effective as both an anterograde tracer to visualize distal projecting axons, but not neuronal cell bodies, in the brain, and is effective as a retrograde tracer to visualize cell bodies in the cortex and brainstem but not individual axons in the spinal cord.
Investigation of Nonspecific Tracer Labeling and Autofluorescence
Anterograde DiI and retrograde Fluoro-Gold labeling were examined in three animals after a complete spinal cord transection at T8 (in addition to the transection at T13 required for FG labeling). Individual axons and even retraction bulbs were well delineated with DiI in the CST rostral to T8 (see Figures 2A and 2F) but DiI did not label axons caudal to the transection site.
Confocal examination of the unsectioned spinal cord in both normal rats and in one rat with spinal cord transection showed discrete DiI labeling of the axons of the CST (Figure 1L). In one of the rats that had undergone transection of the spinal cord, we were unable to visualize the CST tract because there was an extensive mass of scar tissue adherent to the dorsal surface of the spinal cord at the transection site, which prevented the cord from being within the confocal's range of optical sectioning. After cryostat sectioning, however, discrete DiI labeling of the axons of the CST was visualized.
After complete transection at T8 and placement of FG at T13, no FG was visualized in the spinal cord rostral to the transection (Figure 2D). However, examination of the brainstem motor nuclei revealed many autofluorescent cells that made interpretation of FG labeling difficult. Our strategies of the MFB, SBB, or CuS for 10 min successfully diminished the autofluorescence signal and allowed definitive identification of FG-labeled cortical and brainstem neurons in intact animals. CuS for 90 min, however, diminished the FG signal of labeled cells. Therefore, sections stained with CuS for 10 min were re-examined after 1 week and again after 1 month to determine whether there was continued decay of the FG signal. At both times there was no decrease in the fluorescence signal. Moreover, the CuS method for 10 min eliminated autofluorescence in tissue that had been sectioned as long as 11 months previously. There was no FG labeling of cortical and brainstem motor neurons examined in any of the T8 transected animals, reducing the possibility of nonspecific tracer labeling.
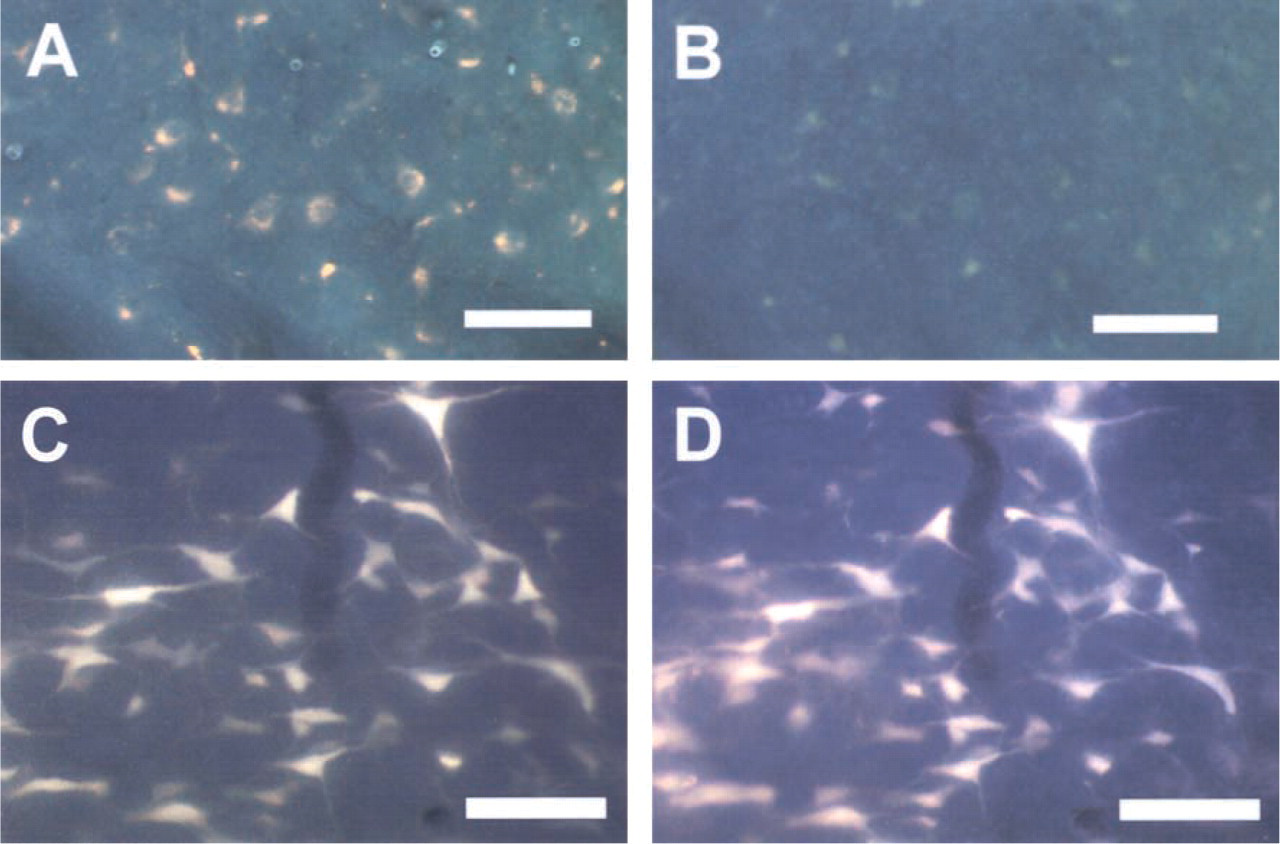
Elimination of autofluorescence. The same section showing autofluorescent reticulospinal neurons before (
Although both SBB and CuS for 10 min were equally effective at eliminating autofluorescent cells and retaining the FG signal (Figures 3A–3D), only the CuS for 10 min also allowed visualization of DiI labeled axons and neuronal processes and cell bodies (Figure 1). SBB removed the DiI signal, probably due to leaching of the DiI by ethanol, which is required in the SBB staining technique.
After staining with CuS, sections had to be examined hydrated (with PBS or H2O), because in dry sections the FG signal could not be distinguished from background. All three strategies could be applied to tissue sectioned as long as 1 year previously.
Decalcification
Decalcification by either formic acid or EDTA alone leached the DiI signal and caused the FG-labeled cells to be ill defined. However, with 1 part 4% paraformaldehyde and 9 parts EDTA, the signal from both FG- and DiI-labeled axons was preserved. The decalcified sections allowed excellent visualization of injured spinal cord and preserved the thin walled cysts (Figures 2C and 2D).
Immunohistochemistry
The combination of DiI and FG in non-decalcified tissue was compatible with all immunohistochemical markers examined in this study, including axon markers NF200, CGRP, and 5HT. Several immunohistochemical markers associated with inhibition of axonal regeneration were also visualized in combination with DiI and FG (Figure 2G), including GFAP and two different types of chondroitin sulfate proteoglycans, CS56 and NG2 (Fitch et al. 1999) (Figure 2H). The relationship between spinal cord injury and the immune system can also be studied because DiI/FG axonal labeling was seen in combination with the marker for microglia and macrophages, OX42, and for activated microglia and macrophages, ED1.
Discussion
DiI as an Anterograde Tracer in Spinal Cord Regeneration Studies
The high fluorescence intensity, resistance to photobleaching (Perrin and Stoeckli 2000), and non-toxicity (Honig and Hume 1989) of DiI make it an excellent anterograde tracer for spinal cord regeneration studies. Because the fluorescent yield of DiI is increased compared to the fluorescent dextrans (Fritzsch and Wilm 1990), more regenerating axons can be identified with DiI. Indeed, whereas HRP and fluorescent dextran amines were unable to produce satisfactory tracing of regenerating fibers, DiI labeled fibers as early as 5 days and as late as 60 days after a nerve crush (Wilm and Fritzsch 1992).
Studies suggesting that DiI may be unable to label long tracts report the labeling distance of DiI to plateau at 2–3 cm after 4 days in vivo (O'Leary and Terashima 1988). With long survival times, it is postulated that DiI may change from a membranous to a granular cytoplasmic labeling and, consequently, labeled axons may not be labeled to their terminals and may be difficult to visualize (Honig and Hume 1989). Although granular cytoplasmic labeling may be significant in the evaluation of cortical axons, we and others (Kuang and Kalil 1994; Terashima et al. 1995), have shown that, in vivo, axon labeling in the cord is distinct and the CST axons can be labeled to the conus medullaris, a distance in rats of at least 9 cm from the site of tracer placement in the cerebral cortex. It is highly likely that long tracts other than the CST can also be anterogradely labeled with DiI. Although we have shown that DiI crystals can also retrogradely label spinal cord tracts, precise labeling may be unreliable because of crystal dislodgement and the small area of the tracts in the cord.
Labeling of a cell that was not in direct contact with the administered tracer, or transcellular labeling artifact, is a significant consideration when the usefulness of DiI as a tracer for examining anterograde axon tracing in axon regeneration models is assessed. Although transcellular labeling has been identified in several models (Godement et al. 1987; Finger and Bottger 1990), we did not find that DiI had traversed a transection lesion in the adult rat spinal cord.
Transcellular labeling may explain the difficulty in identifying individual cortical neurons after DiI insertion into the sensorimotor cortex. The approach of early removal of the DiI to limit duration of contact and suppress transcellular labeling is not favored, because the additional surgical procedure required to remove the DiI would increase the morbidity and mortality of the already fragile spinal cord-injured animals. We favored the approach of examining the tissue as soon as the dye had diffused far enough to label the region of interest (Fritzsch and Wilm 1992). Using this approach, no transcellular labeling of CST axons across a transection site was found as long as 21 days after DiI insertion. Transcellular labeling from the CST to other cells is also unlikely because discrete, selective CST tract labeling was maintained from the internal capsule to the lumbar cord. Other tracts in close proximity to the CST, such as the reticulospinal tract in the brainstem and the propriospinal tracts of the dorsal columns, did not show DiI labeling, which would have occurred had there been nonspecific transcellular spread of the DiI.
DiI is superior to tracers usually used for anterograde tracing of long motor tracts such as HRP, biotin dextran amine (BDA) and Phaseolus vulgaris (PHA-L) in many aspects. HRP with chromogens 3,3′-diaminobenzidine tetrahydrochloride (Mesulam 1978; Morrell et al. 1981) or nickel–glucose oxidase (Li and Raisman 1994) is not sensitive enough to label regenerating axons in the spinal cord after cortical injection, whereas DiI can. HRP can be injected closer to the spinal cord lesion. However, cortical labeling is more precise for labeling specific tracts such as the CST, and injected axons yield unpredictable results (Richmond et al. 1994). Use of the chromogen 3,3′,5,5′-tetramethlylbenzidine (TMB), although more sensitive for spinal tract labeling (Schnell and Schwab 1990), is incompatible with immunohistochemistry, and the crystal artifact of the TMB method obscures details of axon arborizations (Li and Raisman 1994). Even though immunocytochemical methods for HRP detection have been developed (Romero et al. 1999), the additional processing required beyond tissue sectioning risks lack of visualization of the tracer. Because axons appear as “dotted lines” rather than continuous linear fibers and because there is significant crystal artifact with TMB, most authors prefer to demonstrate HRP in axons with camera lucida drawings of composite sections. DiI, however, delineates axons as continuous linear structures and even shows retraction bulbs of transected axons.
Although BDA and PHA-L can label axons more continuously, they require complicated processing and produce unreliable labeling (Guest et al. 1997; Vercelli et al. 2000). PHA-L is less effective in older animals (Vercelli et al. 2000) and deteriorates with the long survival times (Wouterlood et al. 1990) required for the evaluation of spinal cord regeneration. Unlike HRP, BDA, and PHA-L, DiI is consistent, reliable (Holmqvist et al. 1992), and does not require additional processing for tissue visualization.
Although DiI can be used to label fixed tissue, the distance DiI travels in the fixed spinal cord plateaus at around 2.9 cm after 12–15 weeks in humans and guinea pigs (Lukas et al. 1998). We have confirmed that DiI is an excellent postmortem tracer in rat spinal cord. However, we prefer DiI use in vivo for the following reasons. Because postmortem DiI diffuses only 2.9 cm, long tract tracing to precisely locate the regenerating tracts is limited. There is a relatively large risk for tracer contamination (Eide et al. 1999), and the time required for DiI labeling is months longer than required in vivo.
Although detergents such as Triton X-100 saponin, or dimethylsulfoxide used in immunocytochemistry can fade the DiI signal (Elberger and Honig 1990; Holmqvist et al. 1992; Papadopoulos and Dori 1993), we have demonstrated that DiI is compatible with immunocytochemistry for several markers used in spinal cord injury. We have shown that our modified decalcification protocol of von Bartheld et al. (1990) can be applied to the spinal cord and that DiI is compatible with the CuS strategy for autofluorescence elimination. Although we have not examined this in detail ourselves, DiI can also be converted to a permanent signal and visualized with light or electron microscopy (von Bartheld et al. 1990; Papadopoulos and Dori 1993).
FG as a Retrograde Tracer in Spinal Cord Regeneration Studies
Although many retrograde tracers have been used for studying spinal cord injury (Sieradzan and Vrbova 1993; Theriault and Tator 1994; Cheng et al. 1996; Ding et al. 1997; Guest et al. 1997; Novikova et al. 1997; Houle and Ye 1999), we found FG to be optimal for use in combination with DiI. The FG signal did not overlap with DiI, is intensely fluorescent and reliable, resists fading, does not diffuse from labeled cells, and is compatible with longer survival times and immunocytochemistry (Schmued and Fallon 1986). FG can also be photoconverted or immunostained to form a stable electron-dense reaction product suitable for light or electron microscopy (Bentivoglio and Su 1990; Naumann et al. 2000). FG, like DiI, is easy to apply, does not require additional tissue processing for visualization, and is compatible with decalcification.
FG has frequently been used as a retrograde tracer for spinal motor tracts (Akintunde and Buxton 1992; Theriault and Tator 1994; Fernandes et al. 1999) and retrogradely labels brain neurons more brightly than True Blue or Fast Blue (Zhang and McClellan 1998). It labels more neurons than the fluorescent dextrans Mini Ruby, Fluoro Ruby, and Fluoro-Emerald (Novikova et al. 1997), and we and others find it superior to retrograde HRP in labeling axotomized corticospinal and rubrospinal neurons (McBride et al. 1990; Theriault and Tator 1994). Although autofluorescence associated with lipofuscin may lead to uncertainty of neuronal labeling with FG (Sims and Gilmore 1994), this autofluorescence was eliminated using the CuS (10-min) strategy which allowed retention of both DiI and FG labeled neural elements.
DiI–FG Technique in Spinal Cord Regeneration Studies
Although we are the first to show successful simultaneous anterograde and retrograde tracing of the traumatized spinal cord using fluorescent tracers, there has been one other report using the nonfluorescent tracer BDA and Fluororuby anterogradely and Fast Blue retrogradely (Guest et al. 1997) for simultaneous anterograde and retrograde tracing of the spinal cord in the same animal. This technique required multiple surgical procedures for tracer administration and additional processing to visualize BDA. DiI and FG have many advantages over BDA and Fast Blue for the reasons detailed above. Furthermore, Fluororuby labeling of endothelial cells obscured visualization of the regenerating fibers. Visualization of labeled axons in relation to immunocytochemical markers required the outlining of axons and then overlaying the outlined image over the fluorescent image. In contrast, our technique does not require multiple surgical procedures for tracer administration, additional tissue processing to visualize the tracer, or labor-intensive outlining of axons.
The DiI–FG method allows more detailed study of normal and injured spinal cord tissue by allowing examination of both the ascending and descending regenerating tracts of a spinal cord repair or transection. We have shown that autofluorescence can be eliminated to allow unequivocal identification of labeled axons and neurons. Axon morphology at the lesion site can be examined and the inhibiting agents in the environment of the regenerating axon, as well as the quantity and types of neurons required to produce motor recovery in a previously spinal cord-injured animal, can be determined. The method is technically simple, both in tracer application and tissue processing, and flexible, in that it is compatible with immunohistochemistry, decalcification, and potentially with electron microscopy. Our goal was to develop a simple method that could be applied widely with the use of a regular fluorescent microscope. However, we have examined our tissue with a confocal microscope and the fine details of the axons can be visualized. In addition, tissue blocks can be optically sectioned as opposed to physically sectioned, thereby preserving the tissue structure that may be damaged with physical sectioning.
We have shown that the DiI-FG method is compatible with many techniques, easy to apply, and provides information on axons rostral and caudal to a spinal cord lesion. Ongoing studies are proceeding using the DiI–FG method to study surgical strategies for spinal cord repair.
Footnotes
Acknowledgments
Supported by a grant from the Ontario Neurotrauma Foundation and the Joint Section for Peripheral Nerve and Spinal Disorders Grant (to ECT) and awards from the Ontario Neurotrauma Foundation, Ontario March of Dimes, Samuel Lunenfeld Charitable Foundation, and the Canadian Paraplegic Association (to CHT).
We wish to thank Kara Marshall and Dr Linda Mills for their assistance with this paper.