
Abstract
Tartrate-resistant purple acid phosphatase (TRAP) of osteoclasts and certain cells of the monocyte–macrophage lineage belongs to the family of purple acid phosphatases (PAPs). We provide here evidence for TRAP/PAP expression in the central and peripheral nervous systems in the rat. TRAP/PAP protein was partially purified and characterized from the trigeminal ganglion, brain, and spinal cord. The TRAP activity (U/mg tissue) in these tissues was about 10–20 times lower than in bone. Reducing agents, e.g. ascorbate and ferric iron, increased the TRAP activity from the neural tissues (nTRAP) and addition of oxidizing agents completely inactivated both bone and nTRAP. The IC50 for three known oxyanion inhibitors of TRAP/PAP was similar for bone and nTRAP with the same rank order of potency (molybdate > tungstate > phosphate). This indicates that the redox-sensitive binuclear iron center characteristic of mammalian PAPs is present also in nTRAP. Western blots of partially purified nTRAP revealed a band with the expected size of 35 kD. The expression of TRAP in the trigeminal ganglion, brain, and spinal cord was confirmed at the mRNA level by RT-PCR. In situ hybridization histochemistry demonstrated TRAP mRNA expression in small ganglion cells of the trigeminal ganglion, in α-motor neurons of the ventral spinal cord, and in Purkinje cells of the cerebellum. TRAP-like immunoreactivity was encountered in the cytoplasm of neuronal cell bodies in specific areas of both the central and the peripheral nervous system. Together, the data demonstrate that active TRAP/PAP is expressed in certain parts of the rat nervous system.
P
Mammalian PAPs exist in two interconvertible states: pink, reduced and enzymatically active, with a mixedvalent Fe(II)-Fe(III) cluster, and purple, oxidized and catalytically inactive, with the dinuclear pair as Fe(III)-Fe(III). The mammalian serine/threonine protein phosphatases calcineurin (Type 2B) (Griffith et al. 1995) and protein phosphatase Type 1 (PP-1) (Goldberg et al. 1995) also contain a di-nuclear metal center and reveal a striking similarity to the mammalian PAP enzyme in the coordination environment of the active site (Uppenberg et al. 1999).
In humans and rats, TRAP has been detected in a wide variety of tissues as a minor acid phosphatase isoenzyme. However, it is highly expressed in certain activated macrophages and bone-resorbing osteoclasts (Andersson and Marks 1989; Ek-Rylander et al. 1991; Yaziji et al. 1995). A role for TRAP in the resorption of bone and in cartilage breakdown in vivo is indicated by the skeletal alterations observed in TRAP knockout mice (Hayman et al. 1996). TRAP is a phosphoprotein phosphatase acting on phosphoproteins such as bone sialoprotein, osteopontin and osteonectin present in the bone matrix (Ek-Rylander et al. 1994; Andersson and Ek-Rylander 1995; Ljusberg et al. 1999). The role of PAP in other tissues is less well understood. The localization of splenic PAP to macrophage lysosomes (Schindelmeiser et al. 1987) and the catalytic generation of hydroxyl radicals by the enzyme (Hayman and Cox 1994) may point to a role in oxygen-dependent degradation of phagocytosed material. A co-localization of PAP with nitric oxide synthase-1 (NOS-1) in human urothelial cells may support the view that the PAP enzyme participates in free radical metabolism (Schindelmeiser et al. 1997).
Calcineurin, protein phosphatase-1 (PP-1) (Sim 1991), and fluoride-resistant acid phosphatase (FRAP) (Silverman and Kruger 1988) are some of the phosphatases that have been demonstrated in mouse brain. Recently, the TRAP/PAP isoenzyme was also detected by enzyme activity (Hayman et al. 2000) and at the mRNA level (Angel et al. 2000). In addition, histochemical TRAP activity was demonstrated in nerve cells of the olfactory bulb in the rat (Krizbai et al. 1997). In this report we provide evidence, based on the biochemical and histochemical expression of its mRNA, protein, and enzyme activity, that PAP is expressed in selected neurons and ganglion cells. The widespread, but not generalized, distribution of the PAP enzyme in the nervous system suggests participation of this enzyme in specific neuronal functions.
Materials and Methods
Experimental Animals
Five 3-week-old Sprague–Dawley rats of unspecified gender were used in each experiment. Rats were kept under controlled light/dark conditions with food and water available ad libitum. The rats were decapitated and tissues were dissected out for partial purification of TRAP and for RNA preparation, as described in the following sections.
Tissues for immunohistochemistry and in situ hybridization histochemistry were dissected out after perfusion via the ascending aorta with 4% paraformaldehyde in 0.1 M Sörensen's phosphate buffer, pH 7.4, immersed in the same fixative for 24 hr, and then embedded in paraffin. Sections (4.5 μm thick) were adhered to slides (SuperFrost; Menzel-Gläser, Braunschweig, Germany) and processed for immunohistochemistry or ISH histochemistry (see below). Before perfusion the animals were anesthetized with a lethal dose of sodium pentobarbital (60 mg/ml).
The use of animals in this study was approved by the local ethical committee of the Karolinska Institute (S 170/98).
Partial Purification of TRAP from Rat Neural Tissues and Bone
TRAP was purified from the rat brain, spinal cord, trigeminal ganglion, and bone essentially as described previously (Ek-Rylander et al. 1997). The dissected tissues were homogenized in 0.15 M KCl containing 0.1% Triton X-100. The homogenates were centrifuged at 3200 × g for 15 min. Protaminsulfate (5%; Sigma, St Louis, MO) was added drop-wise to the supernatants under continuous stirring, to a final concentration of 0.5%. The pH was adjusted to 6.5 with acetic acid, and insoluble material was allowed to precipitate for 30 min. The samples were then centrifuged as above. All procedures up to this point were carried out at 4C. The supernatants were loaded on a CM-cellulose column (4 ml) (CM-52; Whatman, Maidstone, UK) previously equilibrated with 0.1 M sodium acetate buffer, pH 6.5. The column was washed with three bed volumes of 0.15 M sodium acetate, pH 6.5, and the TRAP enzyme was then eluted with 0.4 M sodium acetate, pH 6.5. All steps were performed in the presence of the protease inhibitors E-64 (10 μg/ml), Pefabloc (1 mg/ml), pepstatin A (10 μg/ml) (Boehringer Mannheim; Mannheim, Germany), and EDTA (5 mM). Further purification of the samples was performed for electrophoresis and immunoblotting analysis. The samples were loaded on a phenyl–Sepharose column (Pharmacia Biotech; Uppsala, Sweden) previously calibrated with 0.05 M sodium acetate, pH 5.0, and 144 g/liter ammonium sulfate. Protein was eluted with a gradient from 0.05 M sodium acetate, pH 5.0, containing 144 g/liter ammonium sulfate, to 0.05 M sodium acetate, pH 5.0.
Assay Procedures
The TRAP enzyme activity in each purified sample was assayed in 96-well plates using p-nitrophenylphosphate (pNPP) as substrate in an incubation medium (200 μl) containing (final concentrations): 2.5 mM pNPP (ditris salt; Sigma), 0.1 M sodium acetate buffer, pH 5.8, 0.2 M KCl, 0.1% Triton X-100, 10 mM sodium tartrate, and the reducing agents ascorbic acid (1 mM) and FeCl3 (100 μM). The p-nitrophenol liberated after 1-hr incubation at 37C was converted into p-nitrophenolate by the addition of 50 μl of 0.9 M NaOH, and the absorbance was measured at 405 nm using a Spectramax250 spectrophotometer (Molecular Devices; Sunnyvale, CA). One unit (U) of TRAP activity corresponds to 1 μmol of p-nitrophenol liberated per minute at 37C. To oxidize the reduced enzyme, 10 mM hydrogen peroxide (H2O2) was added, and after incubation for 10 min at room temperature (RT), the substrate (pNPP) was added. The concentration of inhibitor required to reduce enzyme activity to 50% of the activity in the absence of inhibitor (IC50) for the oxyanions molybdate, tungstate, and phosphate was calculated using linear regression analysis. Km for pNPP was calculated using the method of Lineweaver–Burke.
Electrophoresis and Immunoblotting Analysis
Partially purified TRAP (30 mU) from each tissue was subjected to SDS-PAGE in 12% slab minigels according to the procedure described by Laemmli (1970). Proteins were transferred to immuno-PVDF membranes (Bio-Rad; Hercules, CA) using 150 mA for 2 hr. The membranes were rinsed in 20 mM Tris-HCl, pH 7.5, containing 500 mM NaCl and 0.05% Tween-20 (TBST) and then incubated overnight at 4C in 10% dried non-fat milk in TBST. The membranes were then incubated with polyclonal rabbit antirat TRAP antibodies (Ek-Rylander et al. 1997) diluted 1:100 in TBST containing 0.5% dried non-fat milk for 1 hr at RT. After three washes for 10 min each in TBST, the membranes were incubated with goat anti-rabbit IgG conjugated with horseradish peroxidase (HRP) (Jackson Immunoresearch Laboratories, West Grove, PA). The membranes were washed six times for 10 min in TBST and developed for 1 min with Western Blot Chemiluminescence Reagent Plus (NEN Life Science; Boston, MA) according to the manufacturer's protocol. The membranes were then exposed to HyperfilmECL (Amersham Life Science; Poole, UK) using intensifying screens.
Total RNA Preparation and Reverse Transcriptase-Polymerase Chain Reaction (RT-PCR)
Total RNA was extracted according to the method of Chomczynski and Sacchi (1987). For RT-PCR analysis, tissues were dissected under aseptic conditions and immediately frozen in liquid nitrogen and then stored at −70C. mRNA was purified using an Oligotex mRNA Mini Kit (QIAGEN; Hilden, Germany). For nested PCR, total RNA was extracted using an RNeasy Mini Kit (QIAGEN).
The RT reaction was performed on 1 μg of mRNA or 5 μg of total RNA (for nested PCR) with 200 U Superscript II RNase H– Reverse Transcriptase (Gibco; Paisley, UK) at 37C, using oligo d(T)12–18 (Gibco) as primer, according to the manufacturer's protocol. Negative controls included reactions in which the reverse transcriptase was excluded from the reaction mixture.
PCR amplification was performed on aliquots of cDNA corresponding to 200 ng mRNA or 800 ng total RNA (for nested PCR) using 2.5 U Taq polymerase in the presence of 1.5 mM MgCl2 and 1 × Q-Solution according to the manufacturer's protocol (QIAGEN). The 5′- TRAP primer (positions 32–47; 5′-TTCTGTTCCAGGAGCTT-3′) and 3′-TRAP primer (positions 600–616; 3′-CAGTCGGTCGTCGGACT-5′) were added (150 ng/reaction) (positions calculated from the rat TRAP cDNA sequence available at GenBank/EMBL Data Bank accession no. M76110). The expected size of the TRAP cDNA fragment is 586 bp.
For nested PCR, the 5′-TRAP primer 5′-CGCCAGAACCGTGCAGA-3′ (positions 160–176) was included in the second amplification, generating a band with a predicted size of 356 bp. The cDNA was amplified in a Perkin–Elmer Cetus Instruments DNA ThermalCycler, running 25, 30, 35, or 40 cycles under the following conditions: 94C, 1 min; 56C, 1 min; 72C, 1 min. In the nested PCR, cDNA was amplified in a Perkin–Elmer Cetus Instruments DNA GeneAmp PCR system 9700 running 40 cycles twice under the following conditions: 94C, 30 sec; 56C, 30 sec; 72C, 30 sec. The PCR products were electrophoresed on a 1.5% agarose gel containing ethidium bromide, 0.15 μg/ml.
PCR analysis for glyceraldehyde-3-phosphate dehydrogenase (GAPDH) mRNA was performed on all of the samples as an internal control for amplification of equal amounts of RNA. The primers 5′-CTGAACGGGAAGCTCACTGG-3′ and 3′-TGAGGTCCACCACCCTGTTG-5′corresponding to positions 664–683 and 976–957 in the rat GAPDH cDNA sequence (Fort et al. 1985) were used to generate a fragment of the predicted size of 312 bp.
Sequencing of TRAP cDNA PCR Product
Twenty ng of PCR product from the trigeminal ganglion RT-PCR reaction using 5′-TRAP primer (positions 34–49; 5′-TTCTGTTCCAGGAGCTT-3′) and 3′-TRAP primer (positions 602–618; 3′-CAGTCGGTCGTCGGACT-5′) was ligated into a pCR 2.1 vector and then transformed into TOP 10 F′ cells using a TA Cloning Kit (Invitrogen; Leek, The Netherlands) according to the manufacturer's protocol. Cells were plated onto Luria-Bertani-41 (LB) plates containing ampicillin (50 g/ml) and 5-bromo-4-chloro-3-indolyl · β-
Plasmids from selected colonies were miniprepared according to the protocol of Maniatis (Fritsch et al. 1989), with the exceptions that 400 μg lysozyme was added in the first step and that the plasmid DNA was precipitated twice in isopropanol. The accuracy of the insert was confirmed using PCR with the same primers as for nested PCR, and then sequenced at Cybergene (Huddinge, Sweden).
Immunohistochemistry
Paraffin sections of brain, spinal cord, spinal ganglia, trigeminal ganglion, celiac–superior mesenteric ganglion complex, superior cervical ganglion, and long bones were deparaffinized and rehydrated, and then incubated in a microwave oven in citrate buffer, pH 6.0 (1.8 mM citric acid, 9.8 mM sodium citrate) at 1100 W for 3 min and then at 160 W for another 12 min. After cooling to RT, immunostaining was achieved using 200 μl polyclonal antiserum, diluted 1:500, against TRAP as previously described (Ek-Rylander et al. 1997; Nordahl et al. 1998). After washing with 50 mM Tris-HCl, pH 7.6, 150 mM NaCl (TBS) three times for 10 min, the sections were exposed to 200 μl biotinylated goat anti-rabbit IgG (E0432; DAKO, Copenhagen, Denmark) diluted 1:300 for 30 min at RT and then washed as above. To amplify the signal, the sections were incubated with Strept-ABComplex/HRP (K0355; DAKO) according to the manufacturer's protocol for 30 min at RT. After washing, the sections were incubated for 5 min at RT with the substrate diaminobenzidine (DAB; Sigma) (600 μg/ml) in TBS containing 0.03% H2O2.
Incubation of parallel sections with primary antibodies preabsorbed with 1 μg purified PAP antigen or with normal swine serum (X0901; DAKO) diluted 1:500 served as controls.
Some of the sections were counterstained with Ehrlich hematoxylin before dehydration and mounting.
The localization of TRAP immunoreactivity and the anatomic structures were identified by using a stereotaxic atlas (Paxinos and Watson 1986; Paxinos et al. 1999a, b).
DIG Labeling of RNA Probe
The plasmid pT7T3 19U (Pharmacia) containing rat TRAP cDNA fragment of 832 bp (Ek-Rylander et al. 1991) was linearized with HindIII (for the sense probe) or with EcoRI (for the antisense probe). The labeling was performed with digoxygenin-UTP (DIG RNA Labeling Kit; Boehringer Mannheim) according to the manufacturer's protocol, with the exception that T3 RNA polymerase was used instead of SP6 polymerase.
In Situ Hybridization Histochemistry
Paraffin sections prepared as described above were heated overnight at 55C. After deparaffinization and rehydration, the sections were washed in PBS (0.145 M NaCl, 0.01 M Na2PO4). After treatment with pepsin (1.5 mg/ml) (Boehringer Mannheim) in 0.02 M HCl at 37C for 20 min and washing in PBS, the sections were postfixed in 2% paraformaldehyde in PBS for 5 min at RT and then washed in PBS. The sections were prehybridized in 2 × SSC (1 × SSC = 150 mM NaCl, 15 mM sodium citrate)/50% formamide at 42C for 2 hr. Hybridization was performed in 30 μl of a solution containing 2 × SSC, 2 × Denhardt's, 1 mM EDTA, 0.25 mg/ml tRNA, 100 mg/ml dextran sulfate, 50% formamide, and 2.5 ng/ml probe at 42C overnight. The sections were washed twice in 2 × SSC for 10 min and then three times in 0.1 × SSC for 15 min at RT. The detection was performed using the DIG Nucleic Acid Detection Kit (Boehringer Mannheim) according to the manufacturer's protocol. After counterstaining with Ehrlich hematoxylin, the sections were dehydrated and mounted. Sections exposed to DIG-labeled sense probes served as negative controls.
Results
Partial Purification and Characterization of TRAP Activity from Rat Neural Tissue
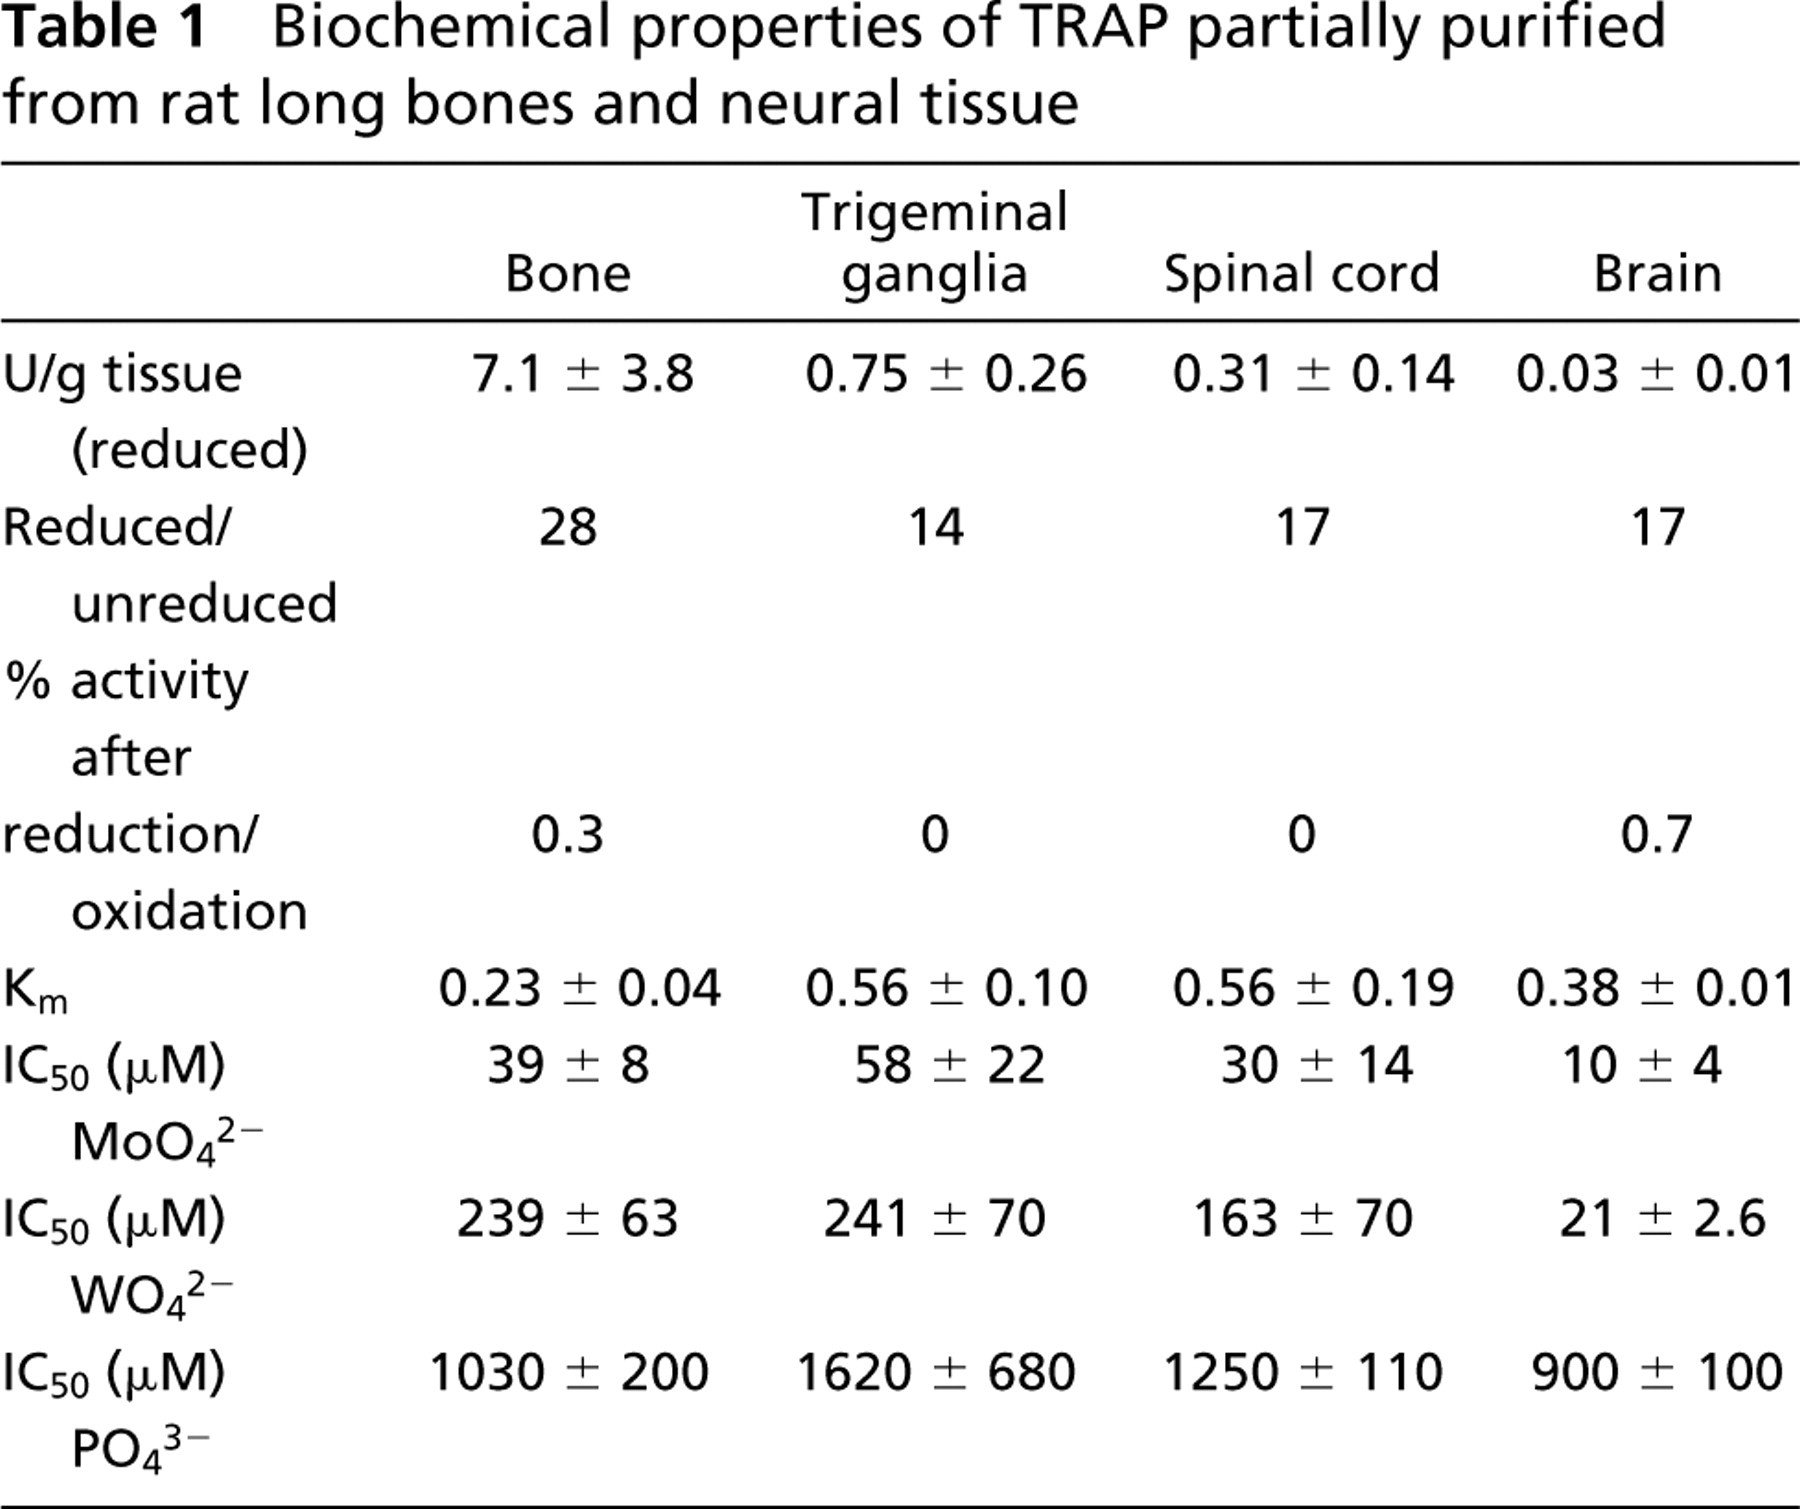
TRAP was partially purified from trigeminal ganglion, spinal cord, brain and, as a comparison, from rat bone, according to an established procedure (Ek-Rylander et al. 1997). Addition of reducing agents, such as 1 mM sodium ascorbate and 0.1 mM FeCl3, converts the inactive enzyme to the active Fe(III)Fe(II) mixed-valent form. The yields of activated TRAP enzyme activity (U/g tissue) varied significantly among the tissues (Table 1). The recoveries from trigeminal ganglia, spinal cord, and brain amounted to 10, 4, and 0.4%, respectively, compared to the recovery of TRAP activity from bone. After oxidation with H2O2, virtually no TRAP activity was detectable in any of the enzyme preparations analyzed (Table 1). The Km of the isolated TRAP enzyme for hydrolysis of the substrate, pNPP, was in the range of 0.23–0.56 mM and was not significantly different between the various tissues. These values are similar to those previously determined for highly purified preparations of recombinant rat TRAP (Ek-Rylander et al. 1997).
To examine the sensitivity to different oxyanion inhibitors of TRAP from the trigeminal ganglion, spinal cord, brain, and bone, the IC50 values for the known PAP/TRAP inhibitors molybdate, tungstate, and phosphate were determined (Table 1). The IC50 values were derived from linear regression analysis. The sensitivity of TRAP enzyme activity for these inhibitors was similar in the different tissues, and the rank order of potency was molybdate>tungstate>phosphate.
Biochemical properties of TRAP partially purified from rat long bones and neural tissue
Identification of TRAP Protein and mRNA in Neural Tissue
Immunoblotting analysis of partially purified TRAP (30 mU) from the trigeminal ganglion, spinal cord, and brain showed the appearance of a protein band with the expected size of 35–37 kD in the absence of β-mercaptoethanol as the disulfide reductant (Figure 1). Recombinant rat TRAP (100 ng) expressed from a Baculovirus vector was used as a positive control (Ek-Rylander et al. 1997). To show the presence and relative abundance of TRAP mRNA in bone, trigeminal ganglion, spinal cord and brain, RT-PCR was performed and aliquots were analyzed after 25, 30, 35, and 40 cycles (Figure 2A). A PCR product of 586 bp, corresponding to the theoretical size, was detected, and the relative expression levels were consistent with those observed for enzymatic activity in the different tissues (Table 1). Sequencing of the 586-bp product obtained from the trigeminal ganglion showed complete identity with the bone TRAP cDNA sequence. A larger fragment, 1078 bp, was detected after amplification of cDNA from spinal cord and brain. The levels of GAPDH mRNA was similar in the different samples, ensuring that amplification of equal amounts of RNA had been achieved (Figure 2B). No product was amplified when reverse transcriptase had been omitted, demonstrating the absence of DNA contamination of the different RNA preparations.
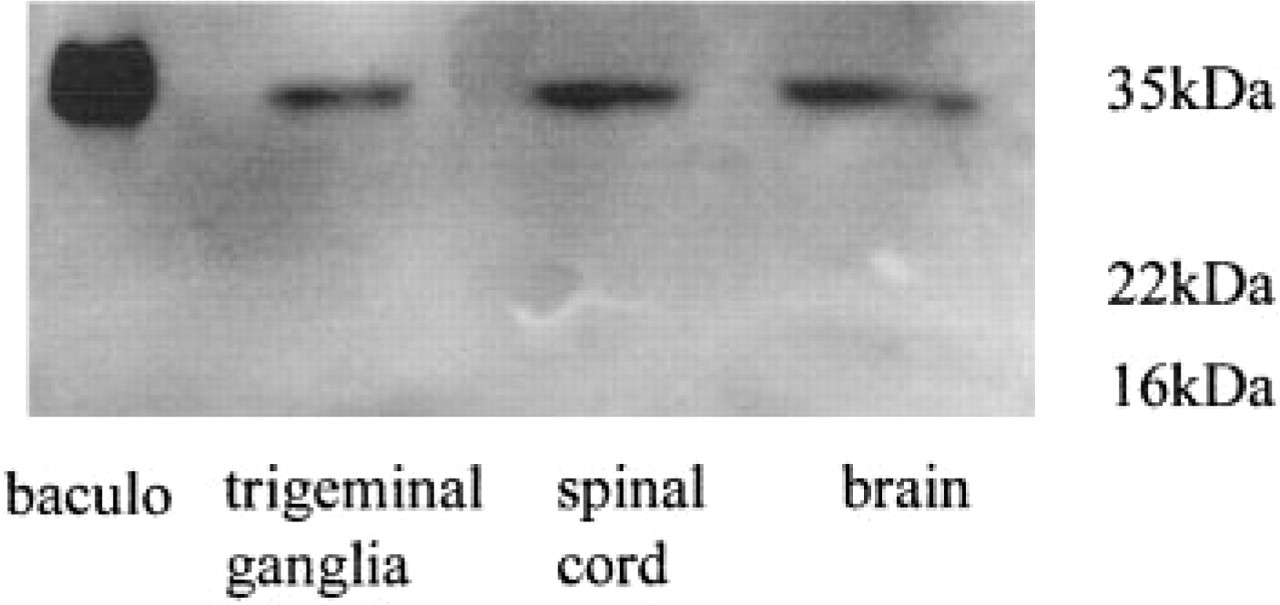
Western blotting analysis of TRAP purified from neural tissue and bone in the absence of reducing agents. Thirty mU of purified TRAP enzyme activity from trigeminal ganglia, spinal cord, and brain was applied to a 12% non-reducing SDS-PAGE, blotted to PVDF, and incubated with polyclonal rabbit antibodies to TRAP. Baculovirus-expressed rat TRAP (100 ng) was used as a positive control. Pre-stained SDS-PAGE standards were electrophoresed in separate lanes.
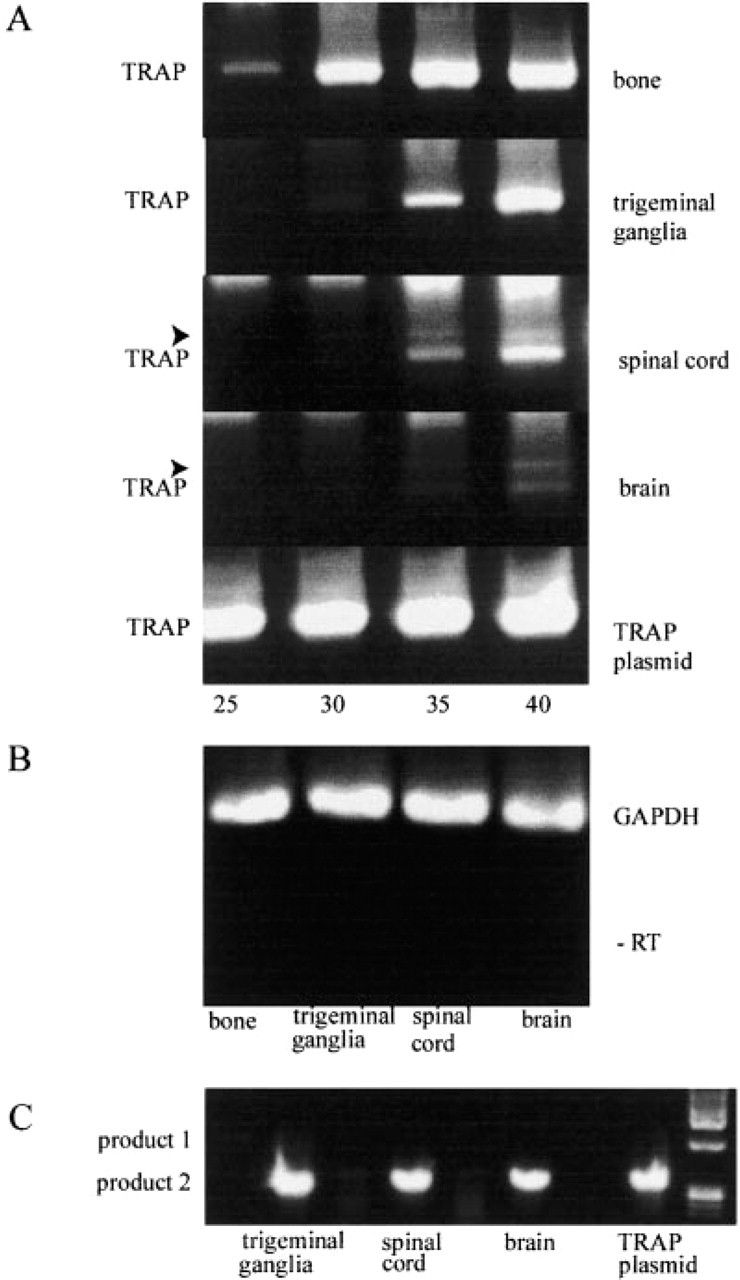
RT-PCR analysis of TRAP mRNA expression in neural tissue and bone. (
Nested RT-PCR of cDNA from bone, trigeminal ganglion, spinal cord, and brain was performed with 40 cycles, resulting in a PCR product of 356 bp corresponding to the theoretical size (Figure 2C).
Immunohistochemical Localization of TRAP
TRAP-like immunoreactivity was encountered in neuronal cell bodies in both the central (Figures 3–7) and peripheral (Figures 8 and 9) nervous systems of untreated rats. The signal was seen in the cytoplasm of the cells but was not uniformly distributed. Instead, the signal appeared in aggregated structures (see Figures 5 and 7–9). Immunoreactive material could also be seen in neuronal processes close to the cell soma (Figure 5A). A very weak immunoreactive signal was observed in nerve fibers in the dorsal horn of the spinal cord. TRAP-immunoreactive material was also seen in glial cells, e.g., in the white matter of corpus callosum (Figures 3A–3C).
Central Nervous System. Wide distribution of TRAP-like immunoreactivity was observed in neurons in the rat brain and spinal cord. A large number of neuron populations were labeled but with a signal of variable intensity. The overall distribution is shown in the set of color micrographs (Figures 3A–3C) representing different levels of the brain. A strong signal was noted in the neurons in the septum and diagonal bands (Figure 3A), ventral pallidum, cerebral cortex, and piriform cortex (Figures 3A–3C). Intensely stained cells were also observed in the triangular septal nucleus. In the cerebral cortex, the most intense staining was seen in neurons in Layers V and VIb, somewhat less intense in Layer VIa, less in Layers II and III, and very weak in Layer I (Figures 3A–3C). All of the pyramidal cells in hippocampal fields CA3 and CA4 (Figures 3B–3C, 6, and 7B) were intensely immunoreactive, whereas in the CA1 (Figures 6 and 7A) and CA2 (Figure 6) fields a strong signal was limited to scattered neurons. A strong signal could be demonstrated in neurons in the hilar region of the hippocampus, whereas the majority of the granule cells of the dentate gyrus exhibited a weaker signal (Figures 6 and 7B). A few scattered granule cells in the dentate gyrus had a stronger TRAP immunoreactivity (Figure 7B). Strong TRAP-like immunoreactivity could be seen in neurons in the exterior globus pallidus (Figures 3B and 8D) and the caudate nucleus (Figures 3B and 8B), particularly in larger cells (Figure 8B), and in the interior globus pallidus (Figures 3B and 8A) and medial habenula (Figure 3B). Neurons in the thalamus and hypothalamus were intensely stained, with particularly strong labeling in the reticular, rhomboid, anterodorsal, and ventral posterolateral thalamic nuclei (Figure 3B). Moderate staining was observed in the dorsal nucleus of the hippocampal commissure, ventromedial hypothalamic nucleus, and basolateral amygdaloid nucleus. Weak labeling was observed in the dorsomedial and ventrolateral laterodorsal thalamic nuclei. There was intense TRAP-like immunoreactivity in neurons of the substantia nigra pars compacta and reticulata (Figures 3C and 8C), neurons of the Darkschewitsch nucleus, the lateral mammillary nucleus, the magnocellular red nucleus, and the postcommissurial magnocellular nucleus (Figure 3C).
In the pons and medulla oblongata, intensely stained neurons were present, e.g., in the dorsal part of the central gray and the deep gray layer of the superior colliculus (Figure 5A), the spinal trigeminal nucleus, the inferior olive, and the parvocellular reticular nucleus alpha (Figure 4B). A strong signal was seen in the neurons in the spinal cord (Figure 4C), particularly within α-motor neurons in the ventral spinal cord (Figures 4C and 5B). A very weak signal was noted in nerve fibers in the dorsal horn of the spinal cord. In the olfactory bulb, intense staining of nerve cells was observed in the mitral cell layer and external plexiform layer (Figure 4A). Scattered cells were also detected in the internal plexiform and granular layers and in the glomerular layer. Medium immunoreactivity could be seen in the mammillary nucleus. In the cerebellum, intense labeling was observed in the Purkinje cells, and in scattered neurons in the molecular and granular layer (Figures 4B, 9A, and 9B).
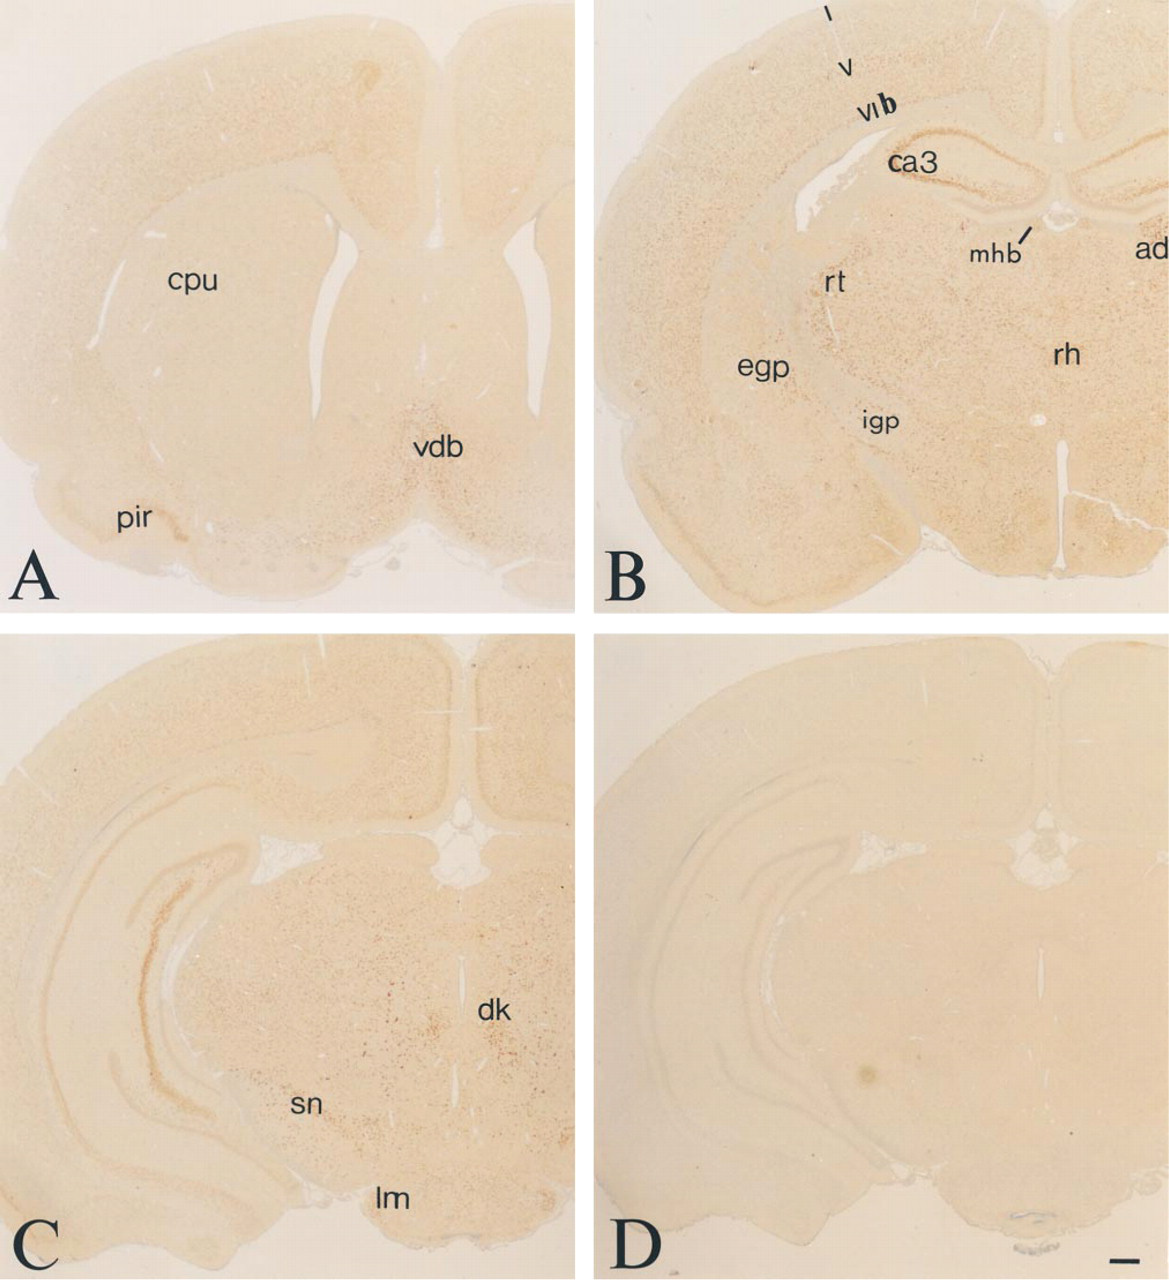
Micrographs of frontal sections of the rat brain at 0.7 mm anterior bregma (
Micrographs of sections of the rat olfactory bulb (
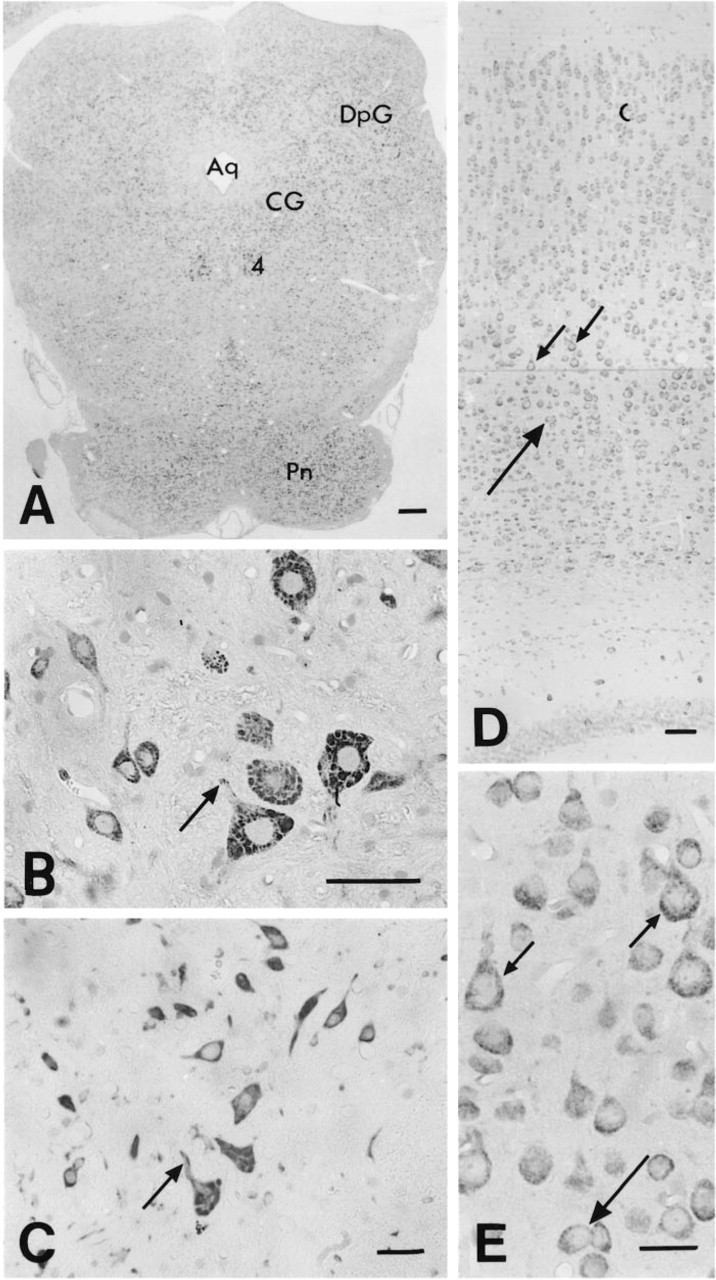
Micrographs of sections of rat brain stem (
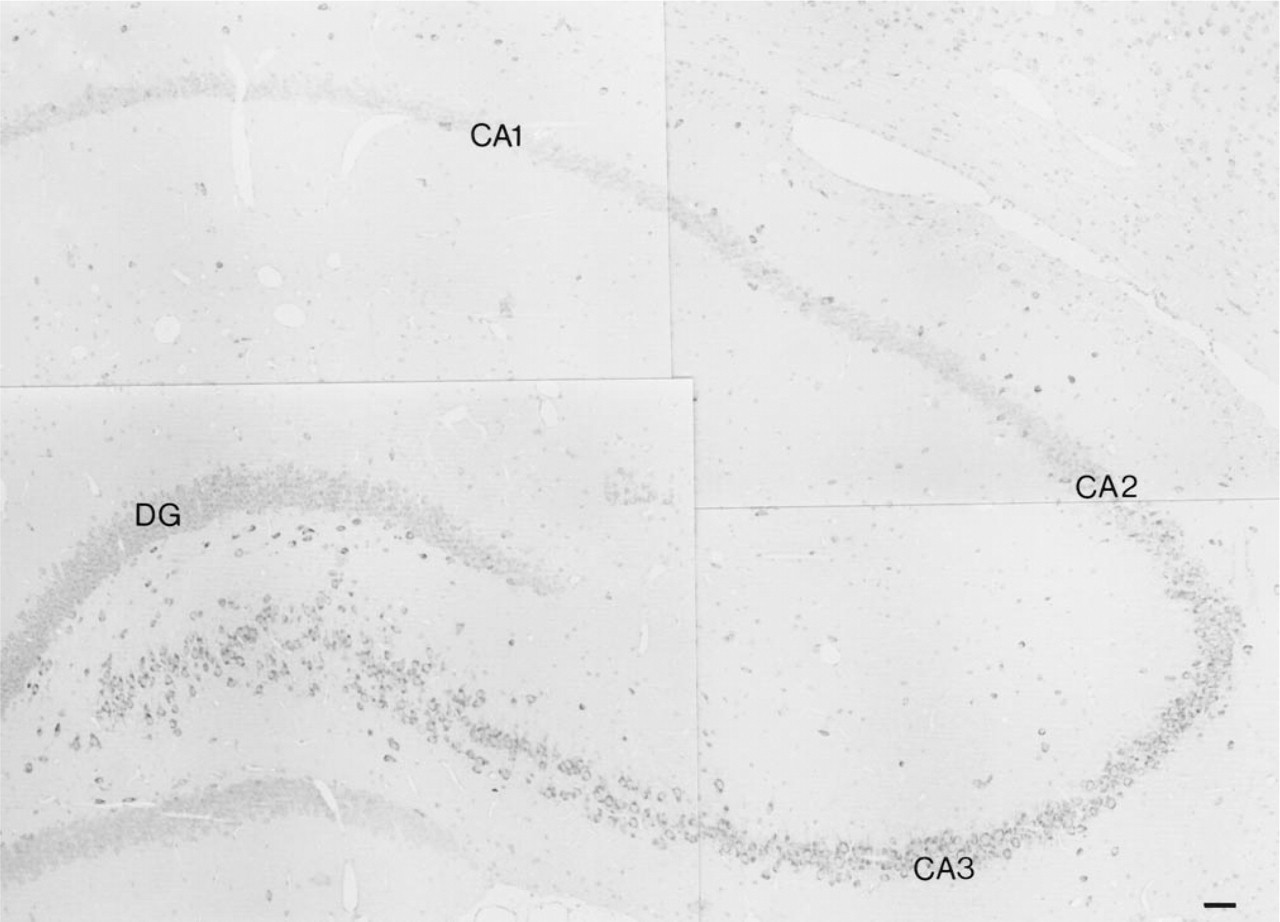
Micrograph montage of a frontal section of the rat hippocampus after incubation with antiserum against TRAP. Intense TRAP-like immunoreactivity can be seen in pyramidal cells of the hippocampal fields CA3 and CA4, in scattered pyramidal cells in the CA1 and CA2 fields, and in neurons in the hilar region. Weaker staining is seen in the majority of pyramidal cells in the CA1 and CA2 fields and in the granule cells in the dentate gyrus. Scattered TRAP-positive cells can also be seen in the hippocampal fields stratum oriens and radiatum and the molecular layer of the dentate gyrus. CA1, CA2, and CA3, pyramidal cell layers of the CA1, CA2, and CA3 fields of the hippocampus; DG, dentate gyrus of the hippocampus. Bar = 50 μm.
Peripheral Nervous System. TRAP-like immunoreactivity was observed in all neuronal cell bodies in both sensory ganglia, and paravertebral and prevertebral sympathetic ganglia (Figures 10 and 11). Medium to large nerve cells in sensory ganglia, including the trigeminal ganglion (Figures 10A and 10C) and dorsal root ganglia (Figures 11C and 11F), were intensely labeled, whereas smaller neurons exhibited a weaker staining intensity. Similarly, in the superior cervical ganglion (Figures 11A and 11D) and the celiac ganglion (Figures 11B and 11E), larger neurons were more intensely stained than smaller nerve cells, although the difference in cell size was not as marked as in the sensory ganglia.
Controls. No signal could be seen in sections incubated with primary antiserum preabsorbed with the antigen (see Figures 3D, 9C, and 10D) or after omission of the primary antiserum (not shown).
Histochemical Localization of TRAP mRNA by In Situ Hybridization
Central Nervous System. The distribution of TRAP mRNA expression closely resembled that of the TRAP-like immunoreactivity in the spinal cord (Figures 4D and 5C). In the cerebellum, a strong signal was seen in Purkinje cells (Figures 9D and 9E), and intense labeling was also observed in some cells in the molecular layer (Figures 9D and 9E).
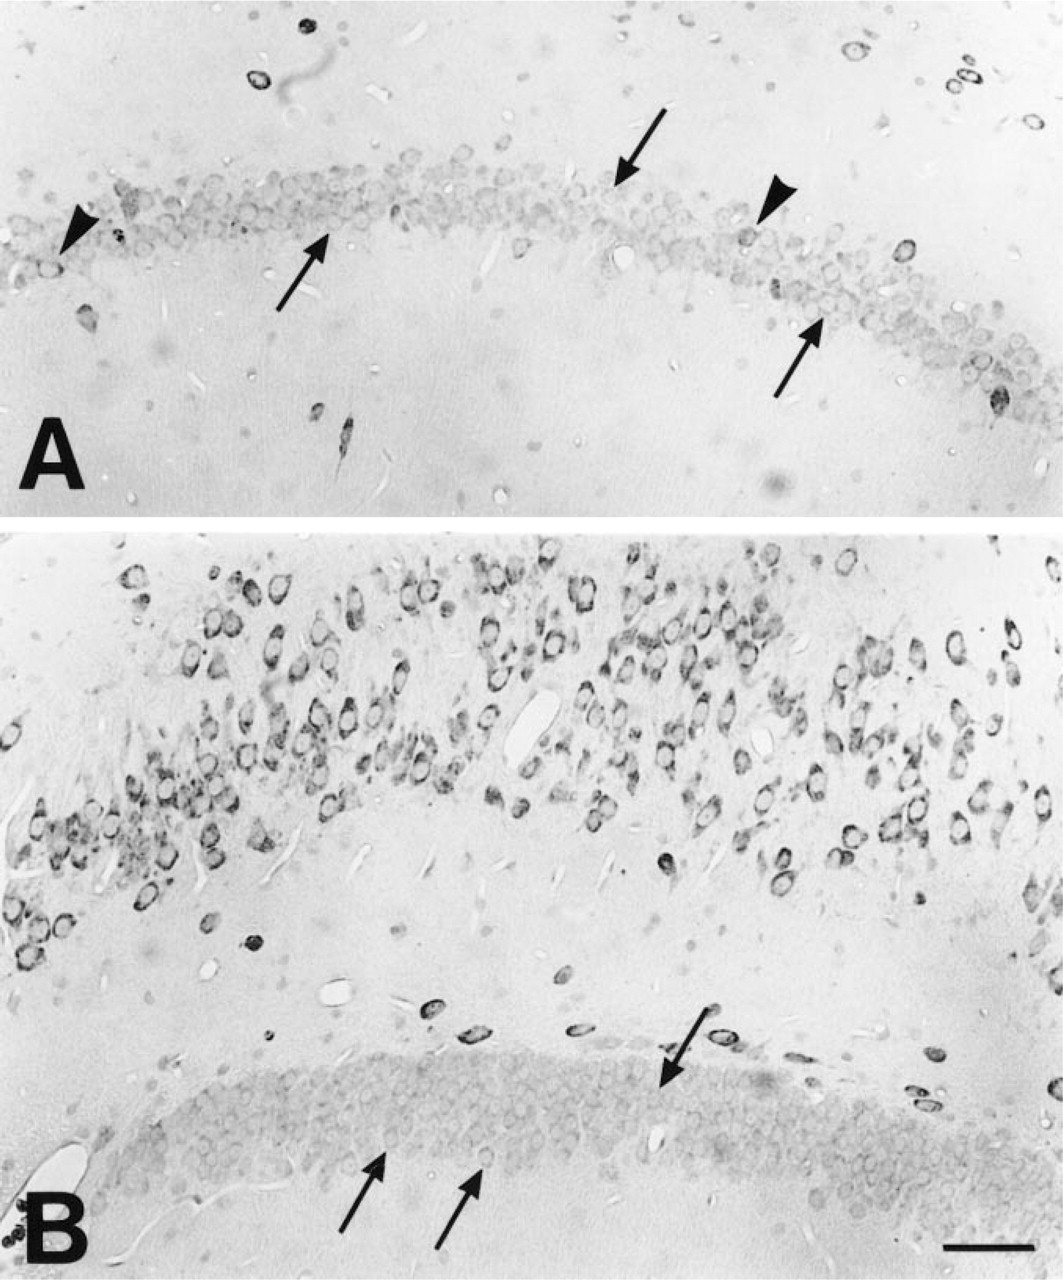
Micrographs of sections of the CA1 field (
Peripheral Nervous System. In the trigeminal ganglion, TRAP mRNA expression was most marked in small to medium-sized neurons, whereas the larger neurons were weakly labeled (Figure 10B and 10E).
Controls. No signal could be seen after hybridization with labeled sense probe (Figure 9F) or after treatment with RNase before the hybridization (not shown).
Discussion
This article describes the characterization and distribution of TRAP (or PAP) in the central and peripheral nervous systems of the rat. The TRAP enzyme is commonly isolated as the purple and catalytically inactive Fe(III)Fe(III) variant (Andersson and Gräslund 1995). TRAP is activated in the presence of reducing agents, forming the mixed-valent Fe(II)-Fe(III) variant, and oxidation of the reduced enzyme with H2O2 leads to a transition of the active mixed-valent enzyme to an inactive Fe(III)Fe(III) species. These properties are rather unique for the di-iron PAPs (Averill et al. 1987; Vincent and Averill 1990) and can therefore serve as useful specificity criteria for this class of acid phosphatases. Another characteristic property of the PAP enzymes is their sensitivity to tetrahedral oxyanion inhibitors, such as molybdate, arsenate, and tungstate (David and Que 1990). On the basis of the specific redox properties and the sensitivity to these inhibitors, the enzymatic data together strongly suggest that a diiron form of PAPs is expressed in the rat nervous system.
After the demonstration of TRAP enzymatic activity, it was of interest to investigate whether the TRAP enzyme could be demonstrated at the protein and mRNA levels, to ascertain that the TRAP enzyme activity indeed reflects the presence of TRAP protein. Furthermore, the levels of TRAP enzyme activity and TRAP mRNA, respectively, were compared among different tissues using a TRAP assay and RT-PCR. The results from these experiments show that TRAP enzyme activity and mRNA levels correlate well. In the morphological studies there was some discrepancy with regard to the granular layer of the cerebellar cortex. The granule cells showed TRAP-like immunoreactivity but no or very weak signal for TRAP mRNA. This could represent low sensitivity of the ISH histochemical method used or a fast turnover of the TRAP mRNA in these cells.
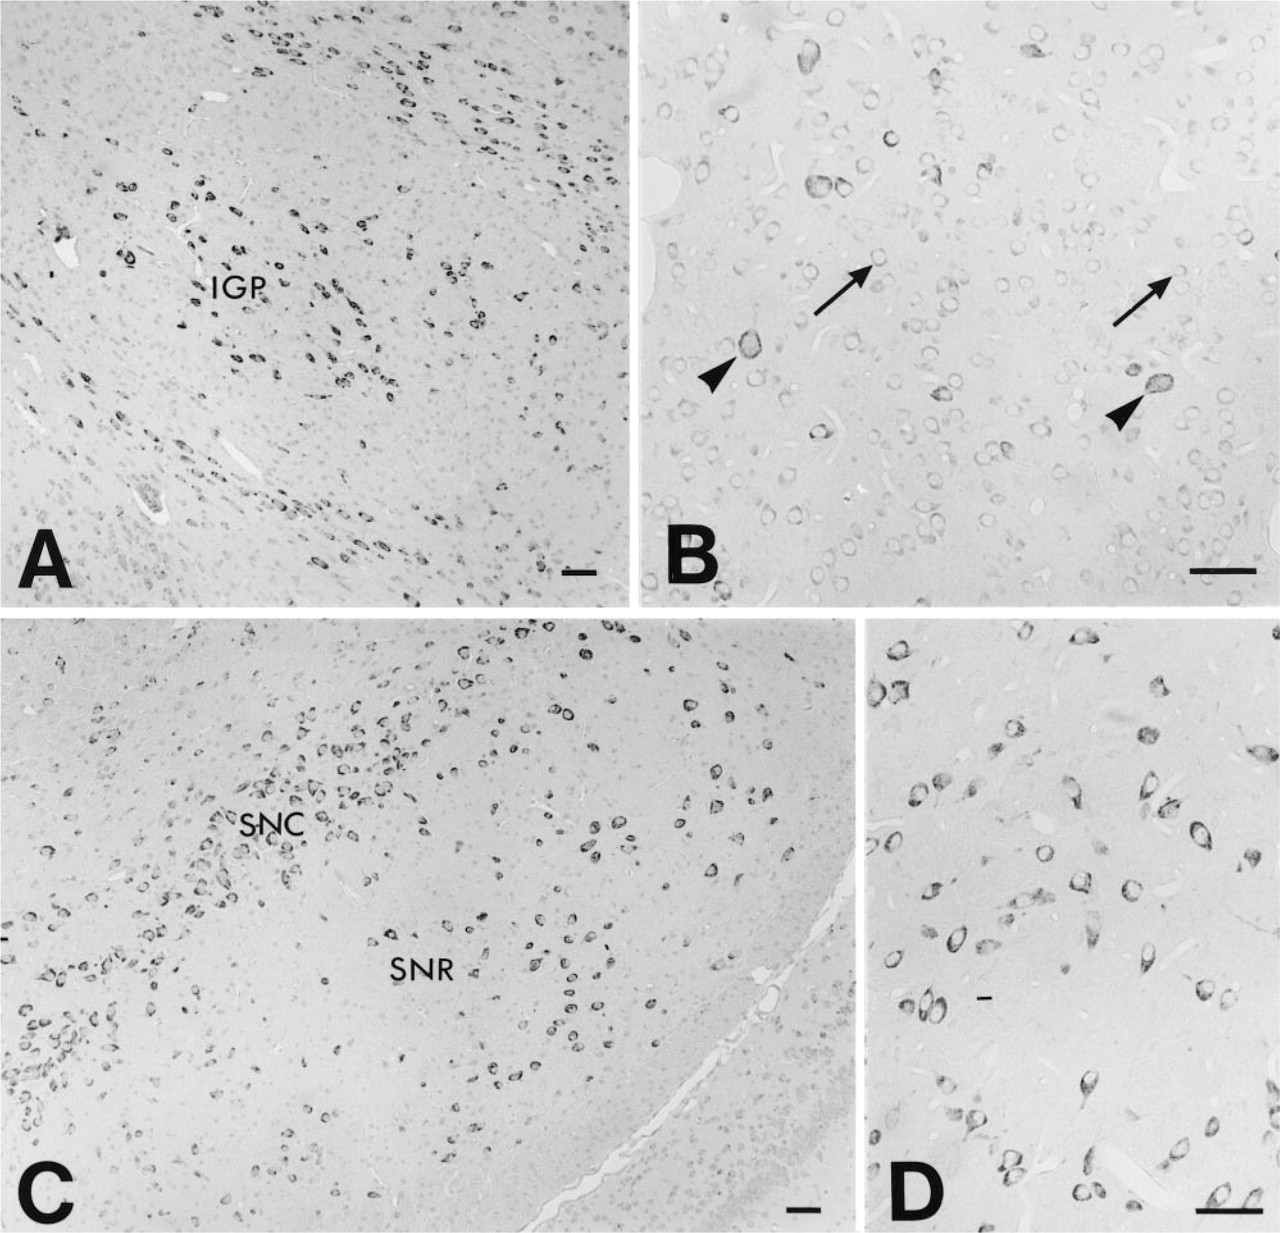
Micrographs of sections of the rat globus pallidus (
The PAP enzymes expressed in bone and spleen are monomeric proteins ranging in size between 34 and 37 kD, depending largely on differences in the post-translational modifications (Baumbach et al. 1984, 1991; Saunders et al. 1985). PAP variants with this characteristic molecular weight were detected by Western blotting analysis in the partially purified extracts from the trigeminal ganglion, spinal cord, and brain. Moreover, the demonstration of a longer mRNA transcript from the spinal cord and brain may indicate that part of the 35-kD TRAP protein originates from a different transcript, due to alternative promoter usage (Reddy et al. 1995).
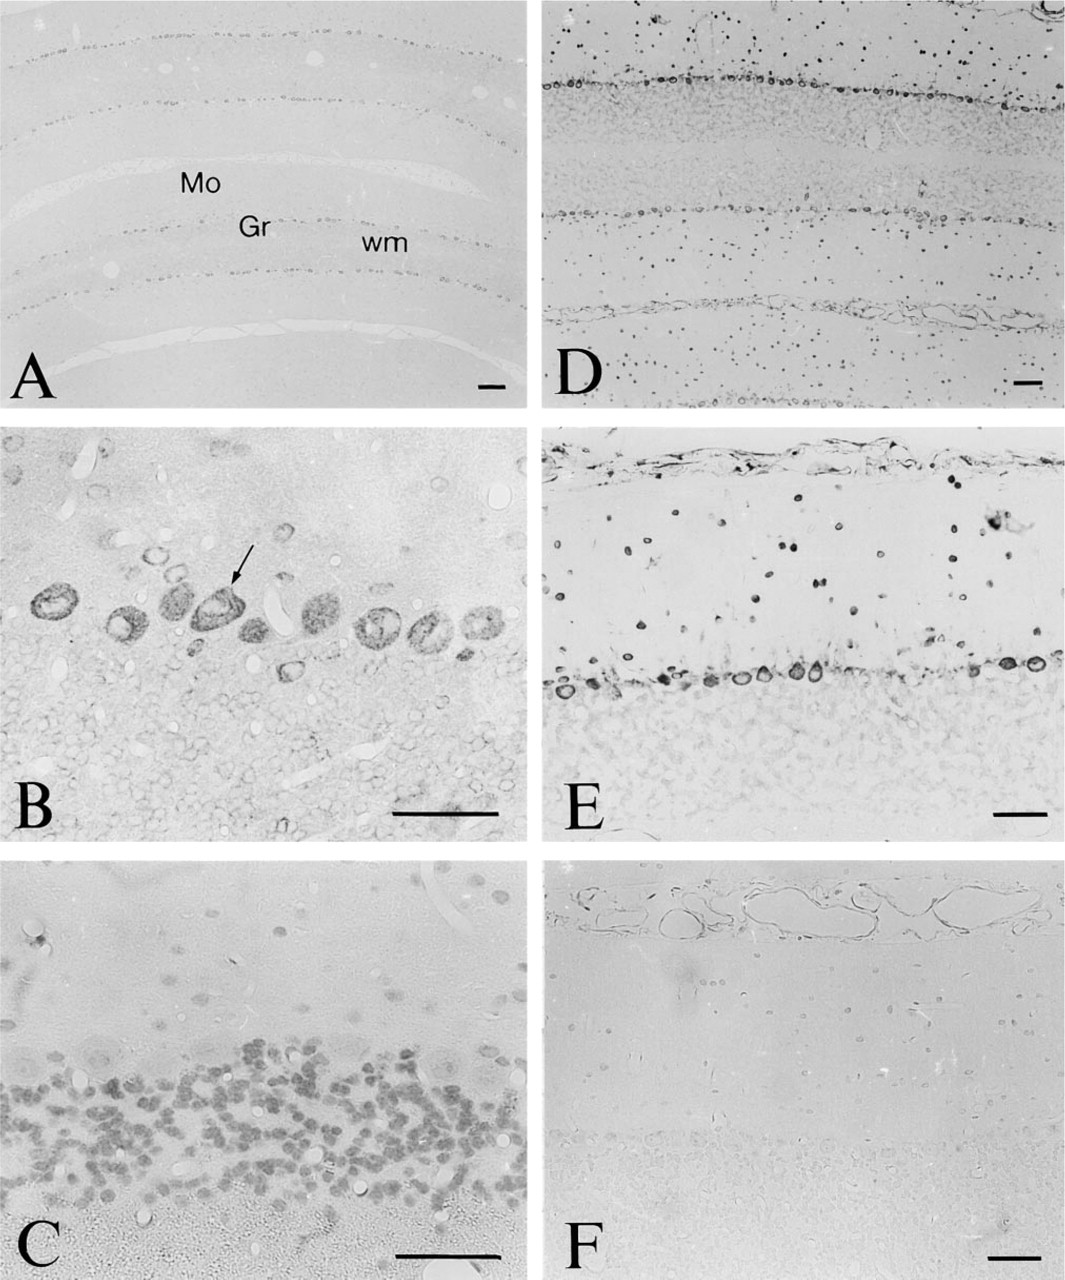
Micrographs of sections of the rat cerebellum after incubation with antiserum to TRAP (
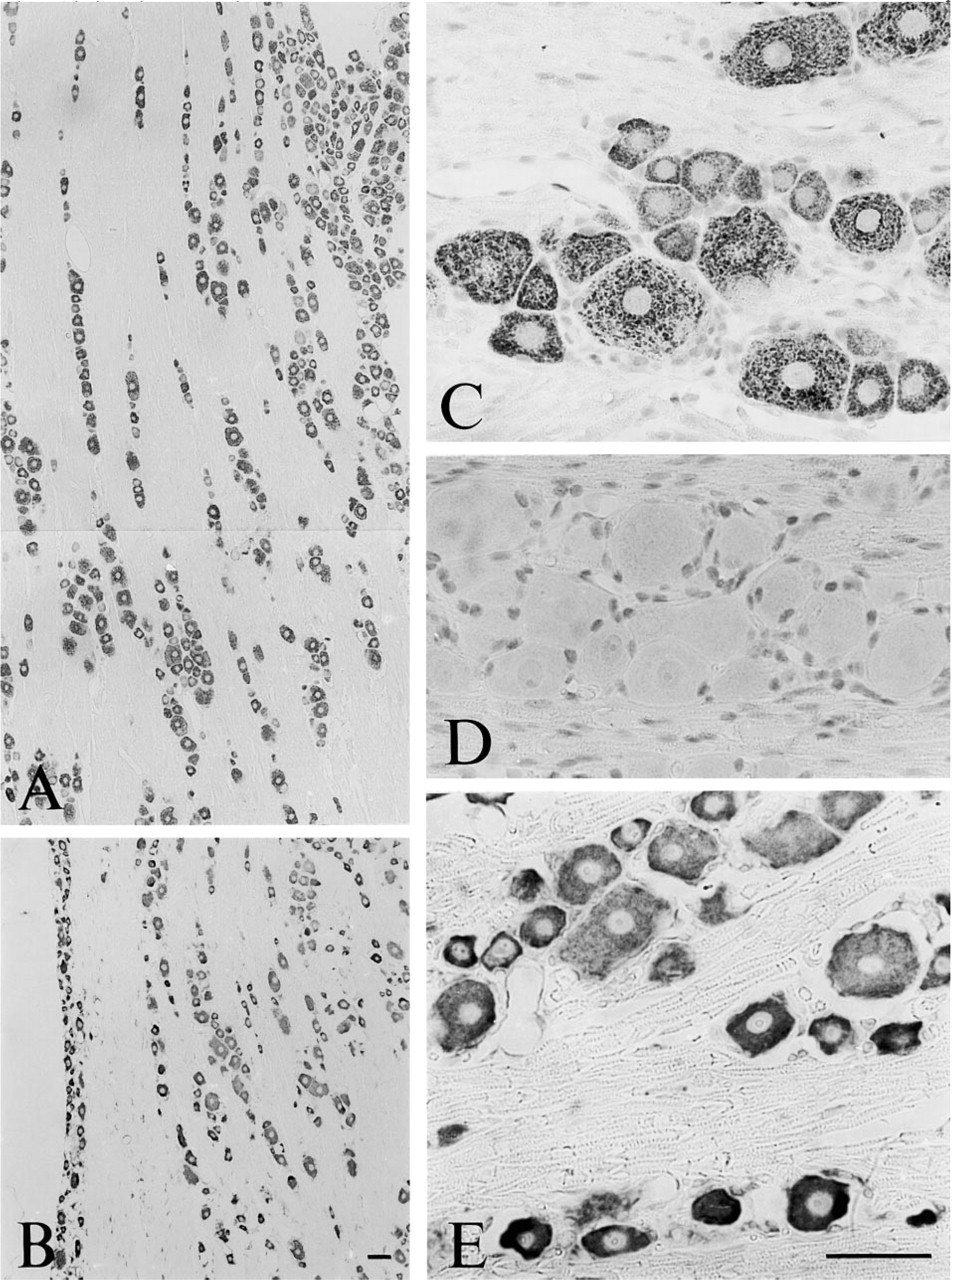
Micrographs of sections of the rat trigeminal ganglion after incubation with antiserum to TRAP (
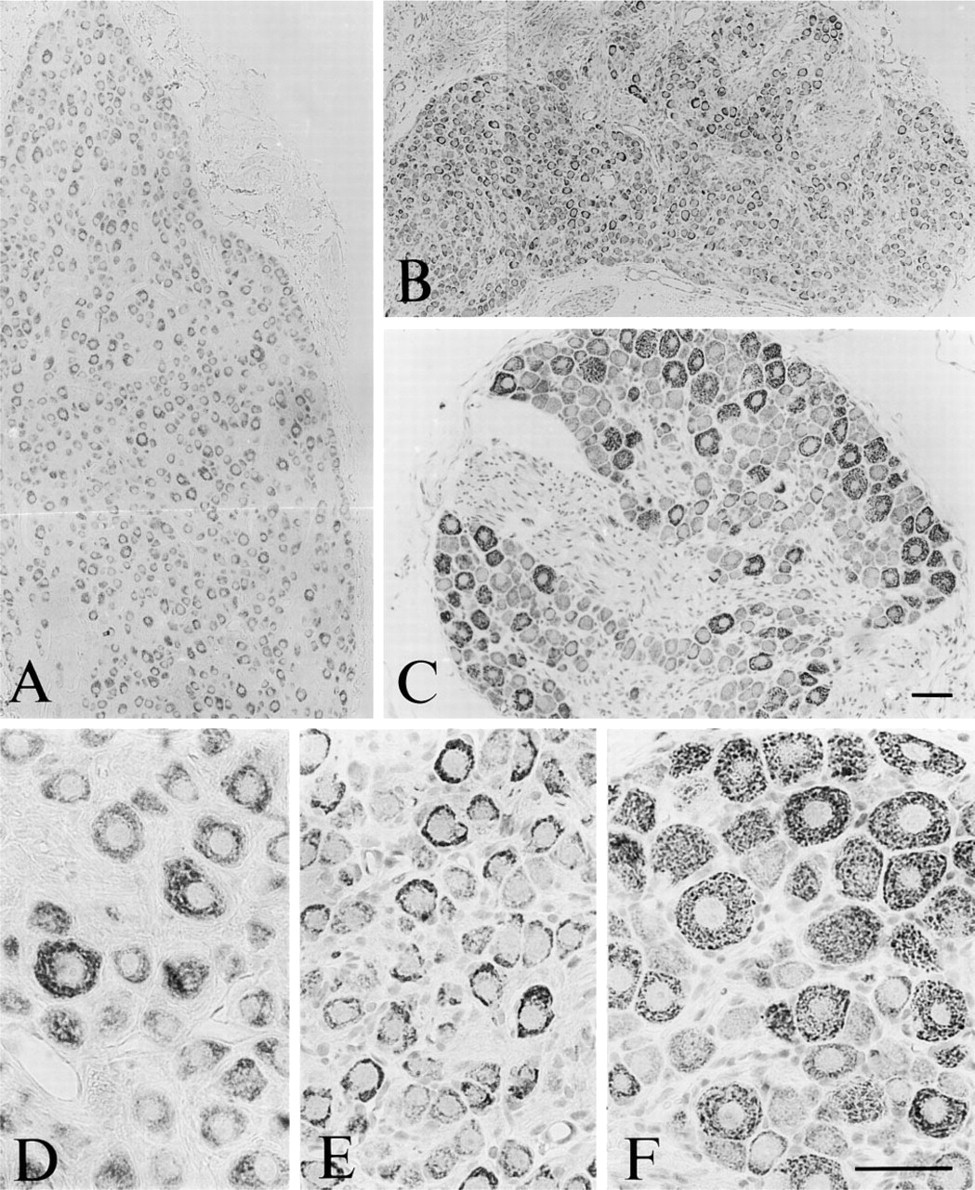
Micrographs of sections of the rat superior cervical ganglion (
Immunohistochemical analysis showed a widespread distribution of TRAP-like immunoreactivity in both the central and peripheral nervous systems. In view of the suggested close evolutionary relationship between the PAP/TRAPs and the protein phosphatases PP1, PP2A, and PP2B (or calcineurin) (Barford et al. 1998), it was of interest to compare the distribution of TRAP-like immunoreactivity with previously published data on the distribution of these protein phosphatases. Calcineurin has a widespread distribution, with several similarities to that of the TRAP-like immunoreactivity, e.g., a strong labeling of cortical Layers V and VIb (Goto et al. 1986). It was noted (Goto et al. 1986) that large cells in the cerebral cortex are more strongly stained for calcineurin than small cells, which is also a hallmark for TRAP-like immunoreactivity. Such a pattern was particularly obvious in the dorsal root ganglia, where large neurons were more intensely stained than the small-sized neurons (see also below). Differences in the distribution of calcineurin and TRAP immunoreactivities include, e.g., that neuronal cell bodies in the globus pallidus and substantia nigra were TRAP-positive but calcineurin-negative, and that calcineurin was detected in neuronal somata, dendrites, and axons, whereas TRAP was predominantly localized to somata.
The isoforms of PP-1 are also extensively distributed in the brain (da Cruz e Silva et al. 1995; Ouimet et al. 1995), with the highest expression of mRNA in the hippocampal pyramidal neurons of CA1–CA4 and in the granule cells of the dentate gyrus. Relatively high levels were also found in the thalamus and medial habenula, red nucleus, occulomotor nucleus, and in the granular layer of the cerebellum. The distribution patterns of the PP-1 isoforms therefore show considerable similarities to the distribution of TRAP immunoreactivity, but there are also notable differences. The globus pallidus, which showed high levels of TRAP immunoreactivity, is virtually devoid of PP-1α and PP-1γ1 and contains small amounts of PP-1β mRNA (da Cruz e Silva et al. 1995). Furthermore, unlike TRAP, a specific concentration of PP-1α and PP-1γ1 immunoreactivity to dendritic spines has been observed in the caudate nucleus and hippocampus (Ouimet et al. 1995).
The distribution of PP-2A in the rat brain (Saitoh et al. 1989) shows several similarities to the distribution of TRAP, exemplified by a strong immunoreactivity in the neocortex and caudate nucleus. However, unlike TRAP, PP-2A-like immunoreactivity is as abundant in dendrites as in neuronal cell somata.
FRAP enzyme activity has been shown to occur in the nervous system, and the localization of TRAP to neurons of sensory ganglia coincides with that of FRAP. However, FRAP is restricted to small sensory neurons (see Knyihar–Csillik and Csillik 1981), whereas TRAP immunoreactivity occurs in all ganglion cells, with the strongest signal in the large sensory ganglion cells. However, the signal for TRAP mRNA was found to be stronger in smaller neurons in the trigeminal ganglion.
The TRAP-immunoreactive material had a very distinct pattern, particularly in the large motor neurons in the spinal cord and in sensory ganglia, where the immunoreactive material was seen as aggregated round structures all over the cytoplasm. Electron microscopic analysis will be necessary to identify these structures, but it is possible that, similarly to the subcellular localization in osteoclasts, the TRAP-immunoreactive material may reside in lysosome-like structures (Reinholt et al. 1990a, b). However, it may also occur in large vesicles.
A role for TRAP/PAP enzymes in the formation of oxygen-derived free radicals has been indicated by several studies (Sibille et al. 1987; Hayman and Cox 1994). In particular, TRAP/PAP enzyme activity has been shown to generate hydroxyl radicals from super-oxide by an iron-catalyzed Fenton reaction under certain in vitro conditions (Sibille et al. 1987). In addition, a role for TRAP in nitric oxide (NO) metabolism has recently been indicated (Collin–Osdoby et al. 1998). Thioglycollate-elicited peritoneal macrophages from mice with a null mutation in the TRAP gene have significantly elevated production of both super-oxide and NO, corroborating an involvement of TRAP in the formation of reactive oxygen species (ROS) (Hayman et al. 1998). A co-localization of TRAP with nitric oxide synthase-1 (NOS-1) in human urothelial cells may also support the view that the TRAP enzyme participates in free radical metabolism (Schindelmeiser et al. 1997). NOS is abundantly expressed in the nervous system (Vincent and Kimura 1992). The distribution pattern of cells immunoreactive for NOS in the pyramidal cell layer of the hippocampus (Valtschanoff et al. 1993) suggests co-localization with TRAP. Thus, both NOS and TRAP are mainly found in pyramidal cells of the CA3 field, and both NOS- and TRAP-positive neurons are sparser in the CA1 region. The fact that NOS immunoreactivity, unlike TRAP, is abundant in dendrites and axons emanating from these neurons does not exclude a co-localization, but may merely reflect that TRAP is not transported to the neuronal processes. Whether or not NOS and TRAP are synthesized by the same cells, there may still be an interaction of NO with the TRAP enzyme. NO is known to diffuse into the target cells and bind to iron, a major target being the soluble guanylate cyclase, on stimulation of which the levels of cGMP are increased (Arnold et al. 1977; Ignarro 1990). Conceivably, NO could also bind to the binuclear Fe3+/Fe2+ center of the TRAP active site and modulate TRAP enzyme activity.
Copper–zinc superoxide dismutase (Cu–Zn SOD), an enzyme that may function both as a free radical scavenger and as a generator of ROS, has a widespread distribution in the rat brain (Moreno et al. 1997) and, similarly to TRAP, occurs in many nerve cell populations, but at varying levels. The localization of Cu–Zn SOD in, e.g., the dopaminergic neurons of the substantia nigra, suggests a role in removing superoxide anion generated by dopamine metabolism (Zhang et al. 1993). The significance of a putative co-localization between Cu–Zn SOD and TRAP is unknown but may indicate that both enzymes are involved in and, depending on the stimulus, may shift the balance in generation of ROS.
In bone, TRAP has been ascribed a role in bone resorption on the basis of its localization to osteoclasts (Andersson and Marks 1989; Ek-Rylander et al. 1991; Yaziji et al. 1995) and its ability to dephosphorylate bone matrix phosphoproteins such as bone sialoprotein and osteopontin (OPN) (Ek-Rylander et al. 1994). OPN is known as an anchor for the binding of osteoclasts to the bone via integrin receptors (Reinholt et al. 1990a, b; Flores et al. 1992), suggesting that one potential physiological function of TRAP is to regulate osteoclast attachment to or mobility on bone.
Interestingly, OPN mRNA expression was recently demonstrated in neurons in the rat brain (Shin et al. 1999; Ichikawa et al. 2000; Ju et al. 2000), with a distribution pattern partly overlapping that of TRAP. OPN mRNA expression was observed in nerve cell bodies mainly in the olfactory bulb, brainstem, and cerebellum, i.e., in areas where TRAP is found. The lack of signal for OPN in the diencephalon and part of the telecephalon (Shin et al. 1999), areas where TRAP is abundant may reflect that the levels of OPN expression are too low for detection by the ISH histochemistry technique. The possibility exists that OPN is a substrate for dephosphorylation by TRAP also in neuronal cells, although the function of OPN in brain neurons is thus far unknown.
Notably, there was an induction of OPN mRNA in the rat striatum and hippocampus after global forebrain ischemia (Lee et al. 1999) and in association with ischemic axonal death in periventricular leukomalacia (Tanaka et al. 2000). The induction appears to occur mainly in microglial cells in the rat brain and in foam cells in the human brain. Whether TRAP synthesis is also induced after brain ischemia needs further analysis. However, the fact that TRAP is expressed by macrophages and osteoclasts appears to indicate that TRAP is inducible in cells of similar ontogenic origin, i.e., microglia, and we have yet to provide evidence that neuronal TRAP is inducible.
In conclusion, the present data demonstrate that an enzymatically active TRAP protein occurs in the rat nervous system. Whether or not there are specific molecular forms of TRAP in the nervous system awaits further analysis. The distribution of TRAP within the nervous system appears to indicate that a large number of neuronal cell types have the capacity to synthesize this enzyme but, depending on the levels, that it may contribute differentially to neuronal survival and response to oxidative stress. Co-localization studies to identify, by neurotransmitter content or glial markers, which populations of cells express different levels of TRAP will be the starting point for understanding whether TRAP may be involved in pathological processes such as Alzheimer's disease.
Footnotes
Acknowledgements
Supported by grants from the Swedish Medical Research Council (10363), the Research Funds of Karolinska Institutet, and EC Biotechnology Program 6.1 (contract B104-CT-98-0385).
We are grateful for the expert technical assistance of Maria Norgård.