
Abstract
Ribosomal RNA synthesis is a key molecular process for understanding the mechanisms that drive cell proliferation. In this process, the upstream binding factor (UBF) is involved in regulating rDNA transcription at the nucleolus, together with RNA polymerase I. Recently, UBF was demonstrated to be a substrate for selective cleavage by specific proteases during apoptosis. Here we studied the expression of UBF in several cases of Hodgkin's disease (HD) by immunostaining and found it to be absent or clearly diminished in a high proportion of Reed–Sternberg cells and Hodgkin cells compared to small reactive lymphocytes. This result contrasted with labeling of those cells by the AgNOR technique, a marker of cell proliferation dependent on increased amounts of several proteins related to ribosome assembly. Disappearance of UBF and preservation of other NOR proteins is consistent with the pattern of selective proteolysis by caspases described in early stages of apoptosis. This correlates well with our results observed on induction of apoptosis in Jurkat cells treated with anti-FAS/APO-1 serum and with those in aged germinal center B-cells, in which UBF was no longer seen although the staining signal of other NOR proteins was maintained. These results support the concept that the rate of apoptosis is higher in neoplastic cells of HD than in the benign reactive lymphocyte population. Differential proteolysis of NOR proteins, as revealed by double staining of UBF and AgNOR, may prove valuable for identification of early stages of apoptosis in cytological and histopathological samples.
C
Proportionality between the intensity of AgNOR staining and the amount of these proteins has been demonstrated (Roussel et al 1994). Another NOR-associated protein, UBF (upstream binding factor), does not appear to contribute significantly to AgNOR staining of interphase cells because it is present in lesser amounts and its silver affinity is not well established. UBF participates in the first step of rDNA transcription as a co-factor of RNA pol I. It binds to the upstream control element of the rDNA promoter, forming with other co-factors protein–DNA complexes that are recognized by RNA pol I (Schnapp and Grummt 1991). In vitro, UBF raises the rRNA transcriptional level by several orders of magnitude, suggesting that UBF is the main regulatory element of rDNA transcription (Kuhn and Grummt 1992; Hannan et al. 1996). Increased content of UBF protein and UBF mRNA or increased phosphorylation and nucleolar localization have been detected in several systems on stimulation of rRNA transcription (Hannan and Rothblum 1995; Hershey et al. 1995; Hannan et al. 1996; Kihm et al. 1998).
The inference that UBF and AgNOR counts should vary in a coordinate way led us to propose immunodetection of UBF in cytohistological samples as an alternative to AgNOR staining (Torres–Montaner et al. 1998b). We have compared both methods in a wide array of cytohistological samples, with special emphasis on lymphoid tissue, and have repeatedly confirmed this contention. We describe here the first exception to this generalization which was encountered in neoplastic cells of Hodgkin's disease (HD) in which a high AgNOR content was often associated with undetectable or very low UBF signal. Dissociation of UBF and AgNOR expression can be obtained in vitro on induction of apoptosis. This staining pattern is consistent with differential proteolysis induced by caspases and might be useful for detecting apoptotic events in pathological samples.
Materials and Methods
Pathological Samples
These were taken as touch imprints from lymph nodes received fresh in the laboratory. Sections from the same area were embedded in paraffin and stained with hematoxylin and eosin for diagnosis and to confirm that they were representative of the neoplastic population.
Silver Staining
AgNOR staining was carried out on cytological preparations by the method of Plotton et al. (1986), with the following modifications. Preparations were fixed in 80% ethanol for 5–24 hr. Then they were briefly washed in distilled water and laid upside down in a grooved crystal plate over a heated plate at 37C. The staining solution consisted of a 1:1 mixture of 1% formic acid and 50% silver nitrate. After 10 min, the slides were thoroughly washed in distilled water, dehydrated, and mounted. Counterstaining was done either with methyl green or by adding to the first 95% ethanol a few drops of eosin solution.
Anti-UBF Staining
For immunostaining, an anti-recombinant UBF serum described previously was used (Bolivar et al. 1999). Briefly, truncated hamster UBF protein (220–764 amino-acid residues) was expressed in the pET-3a system under the T7 RNA polymerase promoter and used for production of specific rabbit anti-UBF antibody. This serum recognizes the typical 94–97-kD polypeptide doublet corresponding to UBF1 and UBF2 in Western blots of human cell extracts.
Cytological samples in polylysine- or silane-coated slides were fixed in acetone for 1–3 hr. Slides were incubated for 45 min at 37C with polyclonal rabbit anti-UBF serum diluted 1:300 in PBS in a humidified chamber. After washing in PBS, a second fluorescein-labeled anti-rabbit antibody was applied for 45 min at 37C. The preparations were washed in PBS and mounted in PBS–glycerol 1:9 (v/v) containing 1 μg/ml Hoechst 33342. The dye attaches to DNA, allowing easy recognition of the nucleus.
For the immunoperoxidase technique a second anti-rabbit antibody labeled with peroxidase and a Vectastain kit were used. Development was with aminoethyl carbazole (AEC; Biomeda, Foster City, CA).
Evaluation of AgNOR and UBF Counts
For assessment of AgNOR and UBF dots in HD, we used eye counting because the small number of Reed–Sternberg and Hodgkin cells do not justify computerized quantification and because eye counting affords good interobserver reproducibility (Aubele et al. 1994), as in our case. In addition, our aim was not to evaluate cell proliferation but to interpret a dissociation between two staining methods. In cultured Jurkat cells we resorted to computer-aided analysis of AgNOR dots to compare anti-Fas treated and untreated cultures. For UBF evaluation, only eye counting was used because this study is concerned only with cells showing disappearance or very obvious diminution of UBF. Slides were examined by two independent evaluators.
Analysis of Apoptosis by Annexin V and Flow Cytometry
Human germinal center (GC) B-cells were obtained from tonsils as previously described (Rodriguez et al. 1992). The purity of these cells was established by using fluorochromelabeled monoclonal antibodies and flow cytometric analysis. GC B-cells were defined as CD38+ CD20-high cells. GC B-cells (106 cells/ml) were cultured at 37C in 5% CO2 in a medium consisting of RPMI 1640 supplemented with 10% FCS,
Western Blotting and AgNOR Staining on Western Blots
Jurkat cells cultured as before and incubated with or without anti-FAS antibody (400 ng/ml) for the indicated periods of time were lysed in sample buffer and loaded at equal number of cells (300,000) per well. Cell extracts were electrophoresed in 10% SDS-PAGE and electrotransferred to nitrocellulose membranes (BA-S83) (Schleicher & Schuell; Dassel, Germany). For UBF detection, membranes were blocked in TBS (Tris-buffered saline) containing 5% dried milk and 0.05% Tween-20 for 1 hr. Then they were incubated for 16 hr in anti-UBF antibody. After several washes in TBS–Tween-20, a peroxidase-labeled secondary antibody was added for 2 hr. Finally the membranes were developed with chloronaphthol. AgNOR staining was performed as described (Roussel et al. 1994). Briefly, membranes were pretreated with 20% ethanol for 10 min and incubated with a 2:1 (v:v) ratio of Solution A (50% AgNO3 in deionized water) and Solution B (1% gelatin, 1% formic acid in deionized water). [AgNO3 and formic acid were from Merck (Darmstadt, Germany) and gelatin was from Bio-Rad Laboratories (Richmond, CA)]. After 9–12 min, membranes were throughly rinsed in distilled water.
Results
Discordant Expression of AgNOR Proteins and UBF in Neoplastic Cells of Hodgkin's Disease
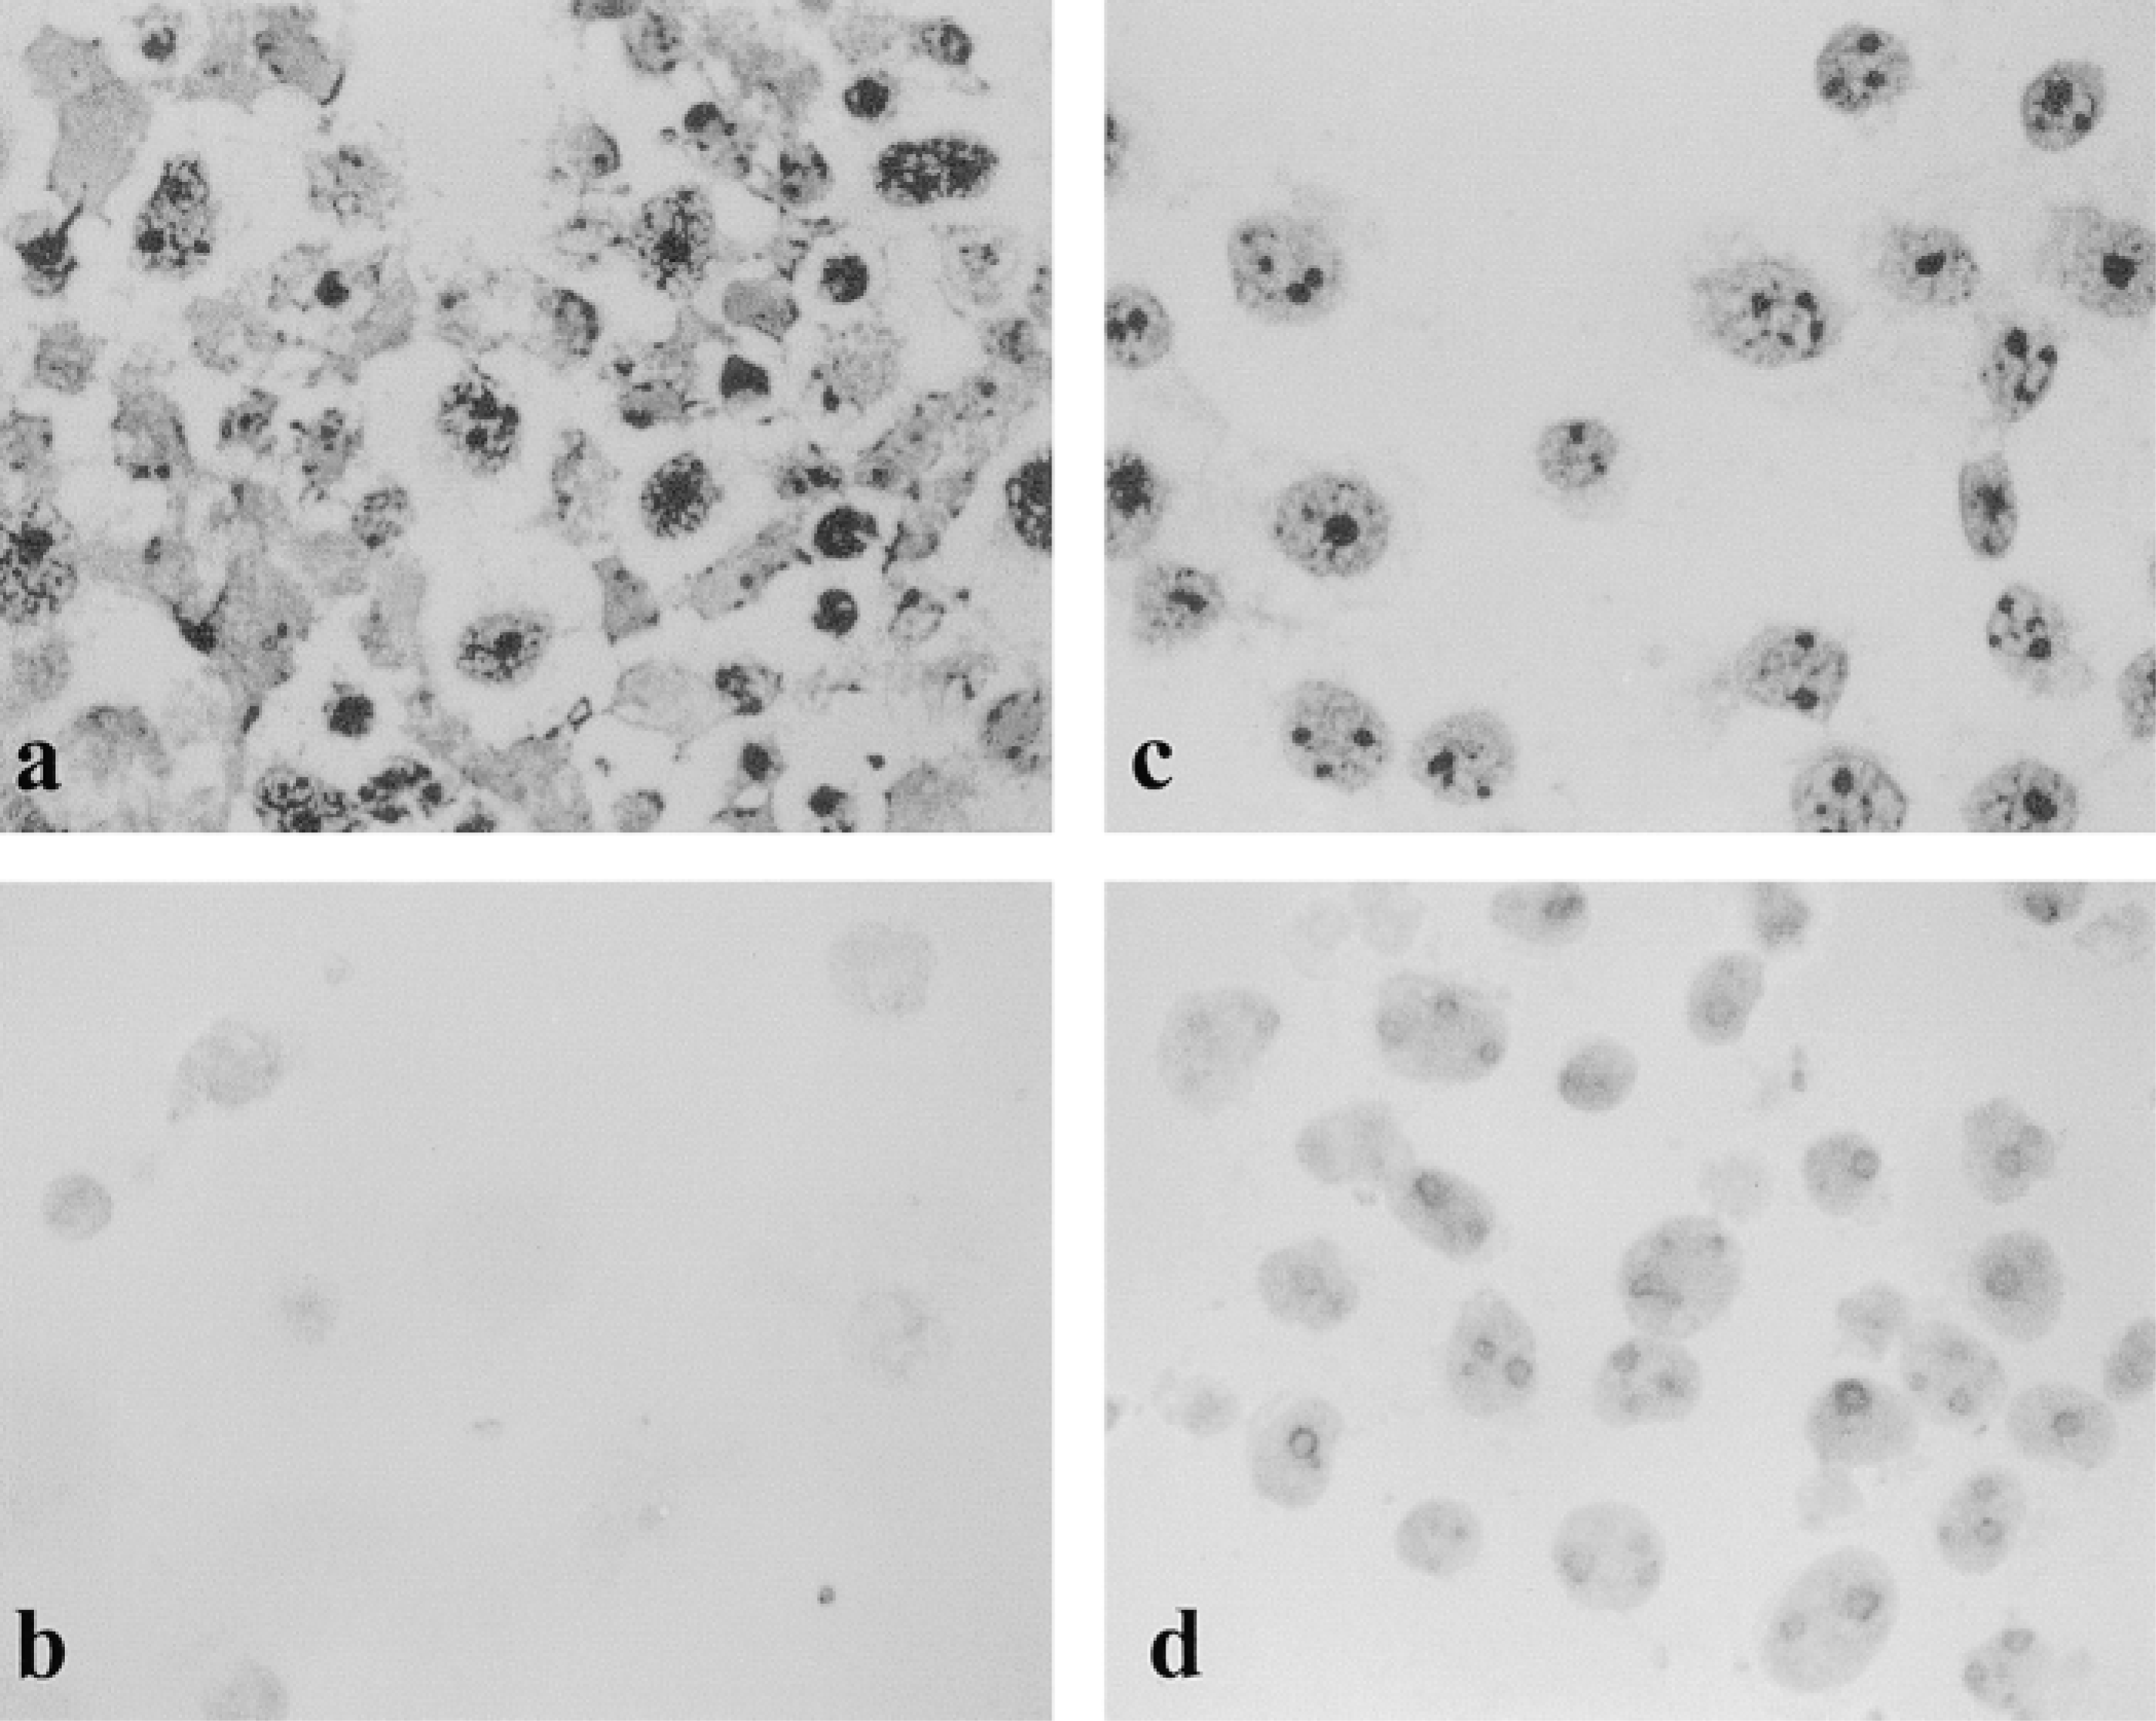
Immunohistochemical detection of UBF was performed in parallel with AgNOR staining in four cases of HD diagnosed during the past few months. Two or three slides were taken for every biopsied lymph node and for each technique. This was sufficient in four cases to detect at least a few Reed–Sternberg cells. By using UBF immunofluorescence in HD, we first noted that some neoplastic cells did not exhibit the expected increase in UBF-labeled dots that is seen regularly in other high-grade lymphomas. This was surprising because we did not note a similar decrease in AgNOR dots, which were quite high, as usual, in malignant lymphoid cells, and because previously we had always found parallelism between these parameters. Very often, the UBF fluorescence signal was absent or a diffuse and weak nuclear fluorescence was seen. This was in contrast to the unequivocal localization of UBF in nearby small lymphocytes that exhibited brightly stained round dots in the nucleus (Figure 1). Although neoplastic and reactive lymphocytes are not always clearly discerned by immunofluorescence, double staining with fluorescein and Hoechst 33342 shows nuclear size and usually enables us to ascribe a given cell to the neoplastic or reactive population. In some instances, identification was facilitated by the typical ring of small lymphocytes around a central cell with a large nucleus (Figure 1).
With a peroxidase-labeled secondary antibody, Reed–Sternberg and Hodgkin cells can be clearly discerned. For the purpose of evaluating dissociation of AgNOR and UBF staining, we considered only cells with complete or nearly complete absence of UBF signal. Although AgNOR staining was not performed in the same preparations, we assume that they are positive for AgNOR because, in fact, no cells negative for AgNOR were detected or only marginally and after extensive search. Reed–Sternberg cells were frequently negative for UBF (Figures 2a and 2c) or contained residual positivity (Figure 3). In addition, a Reed–Sternberg cell of the “popcorn” type was seen (Figure 2b), with clearly diminished dots in relation to small nearby lymphocytes In mononuclear neoplastic cells (Hodgkin cells), the level of UBF varies widely. Some of them exhibit multiple positive UBF dots, up to 8–12, higher than the usual number of dots in small lymphocytes, consistent with the correlation established in previous studies (Torres–Montaner et al. 1998b) between proliferative activity (histologically malignant high grade) and UBF expression, but some of them were negative or displayed weak positivity. (Figures 2 and 3 show, in addition to negative Reed–Sternberg cells, some Hodgkin cells with absent or multiple dots of UBF positivity in the same viewing field.) In small lymphocytes, dot number varies from one to four or five. The latter, which seems somewhat high for small lymphocytes, is probably related to the fact that they are reactive, activated lymphocytes. Only in the neoplastic compartment were there UBF-negative cells, either Hodgkin or Reed–Sternberg cells. However, there was a great variation in the frequency of negative cells from case to case as well as in the proportion between positive and negative cells in each case. In Case 3, we detected only one Reed–Sternberg cell and one Hodgkin cell negative for UBF of 14 neoplastic cells recorded. Another Reed–Sternberg cell found was positive. In Cases 1 and 2 there were two Reed–Sternberg cells in every case, all with absent or residual positivity, and five and seven Hodgkin cells negative for UBF of 13 and 19 neoplastic cells identified. These low figures precluded a statistical analysis of this phenomenon. However, in Case 4 we counted 50 negative cells (five Reed–Sternberg, 45 Hodgkin cells) and only five positive cells. Case 4, diagnosed as nodular sclerosis, (cellular phase), was very significant because it had a large neoplastic population as seen by H & E staining. There were frequent mummified cells, suggesting a high rate of apoptosis.
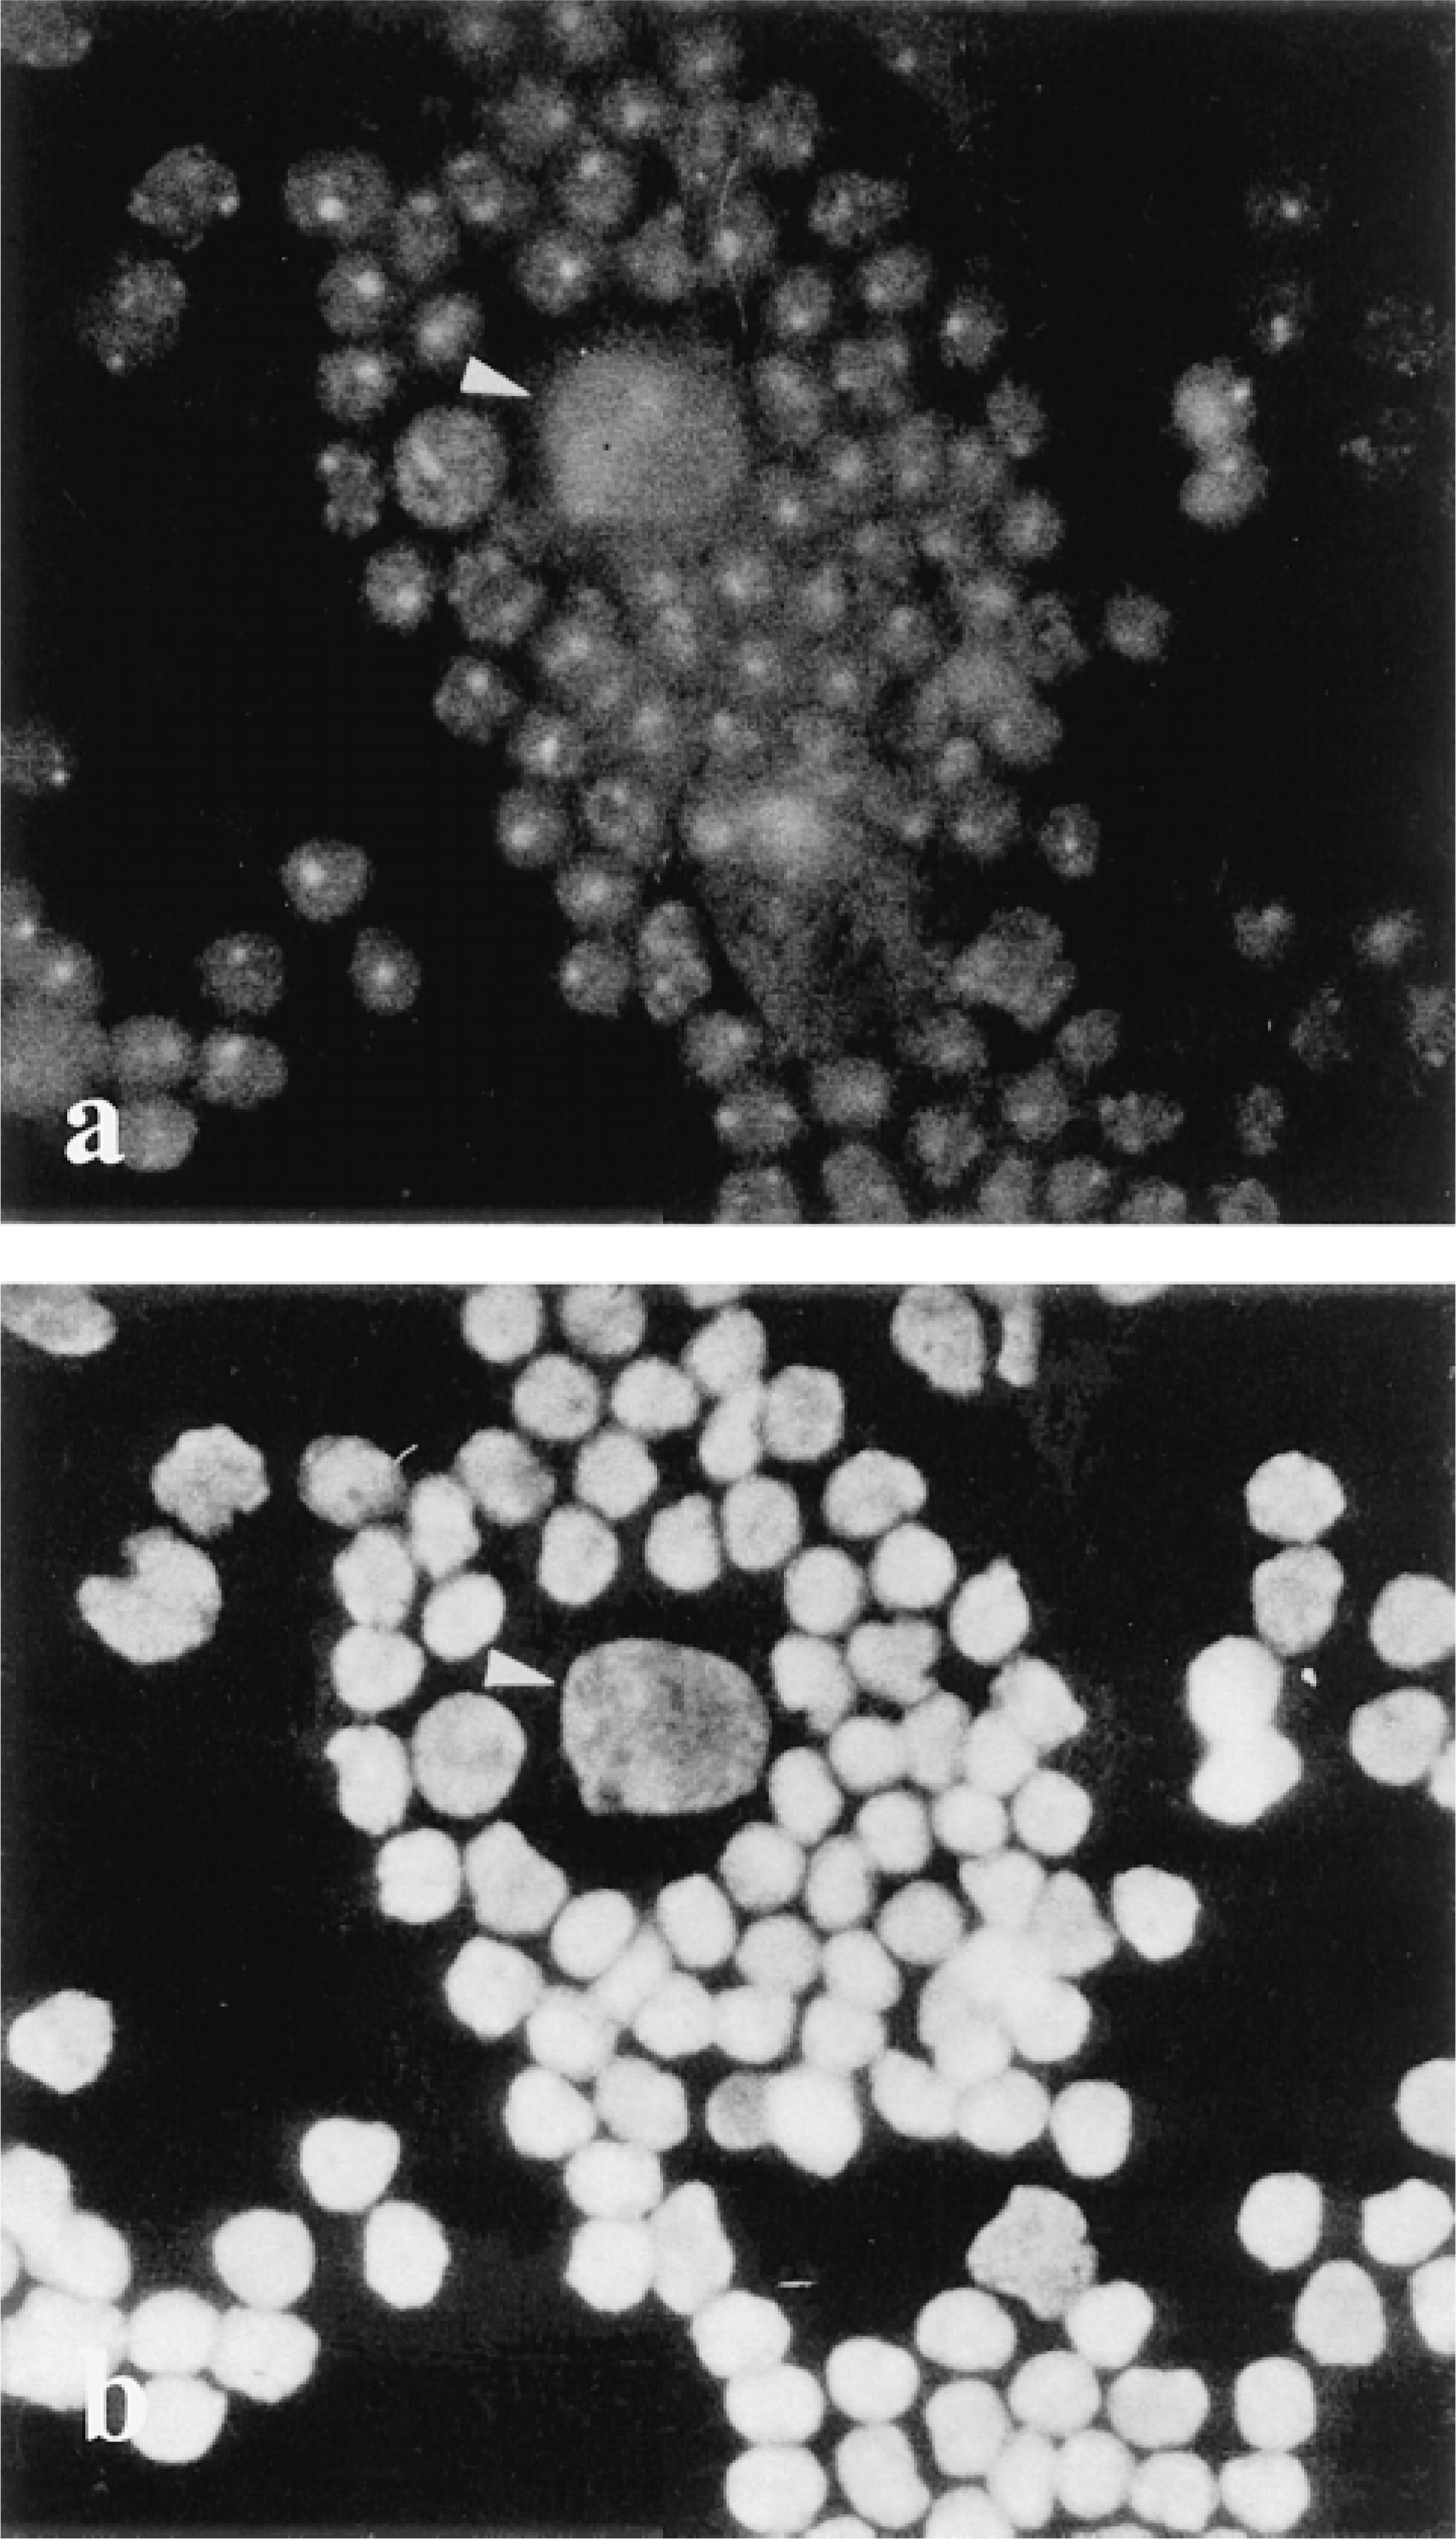
Immunofluorescence staining of a neoplastic cell from Hodgkin's disease with monospecific anti-UBF antiserum. Nucleoli of small lymphocytes are stained as bright dots (
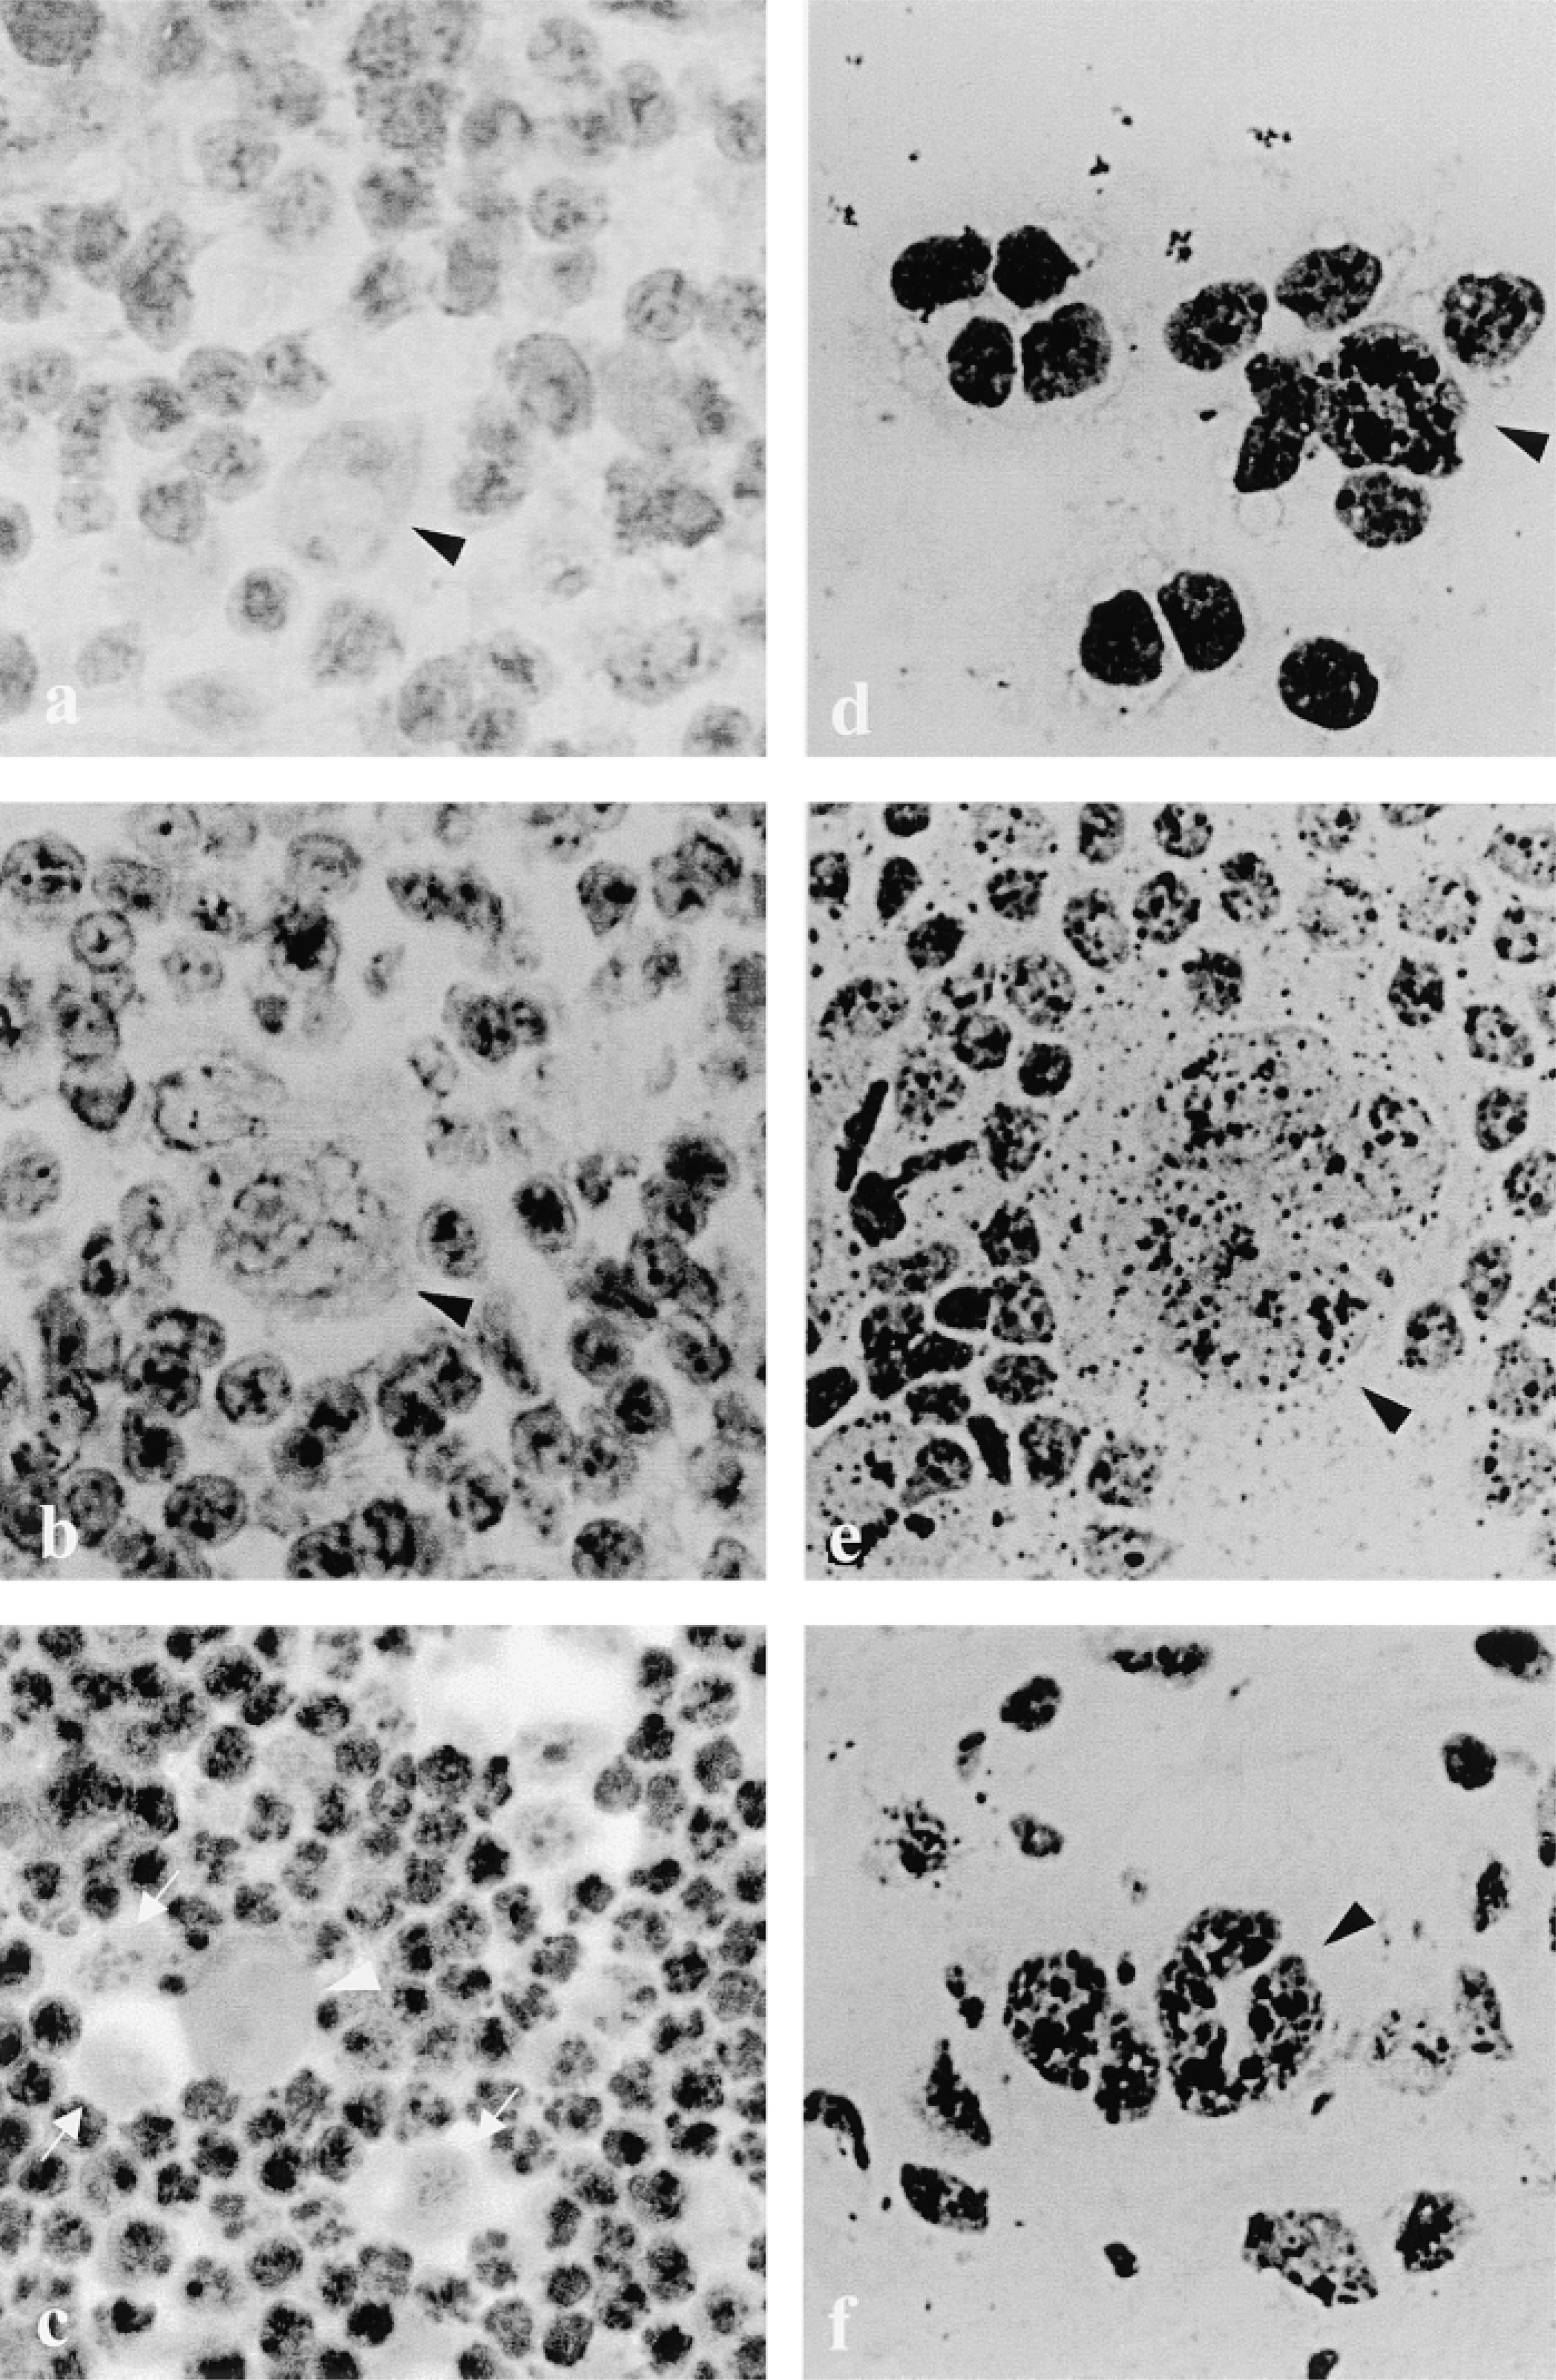
Immunostaining of UBF in Hodgkin's disease cells by peroxidase labeling and AgNOR staining. Reed–Sternberg cells (arrowheads in
Immunoperoxidase staining of UBF in Hodgkin's disease. One Reed–Sternberg cell (arrow) has large nucleoli stained by methyl green with a residual small positive dot for UBF and no positivity inside nucleoli, and several Hodgkin cells with different amounts of UBF vary from negative to multiple dots (arrowheads). Original magnification ×100.
The AgNOR technique was performed in parallel in all cases. Neoplastic cells could be distinguished easily from small lymphocytes and other accompanying cells. Neutrophils and eosinophils showed weak or no positivity both for silver and for UBF. No cells negative for silver, whether small lymphocytes or neoplastic lymphoid cells, were detected, or only marginally. AgNOR amount estimated by eye counting showed the typical pattern: many dots in the neoplastic population and fewer dots in the non-neoplastic compartment (Figures 2d–2f). Computerized quantitation of AgNOR was not done because we did not try to study cell proliferation in HD but rather tried to interpret a dissociation between two staining methods. For the same reason, and also because of the under-representation of the neoplastic compartment in HD, we did not try a precise quantitation of the phenomenon of dissociation, which must await enrichment procedures of neoplastic cells.
UBF–AgNOR-dissociated Expression Is Obtained In Vitro on Induction of Apoptosis
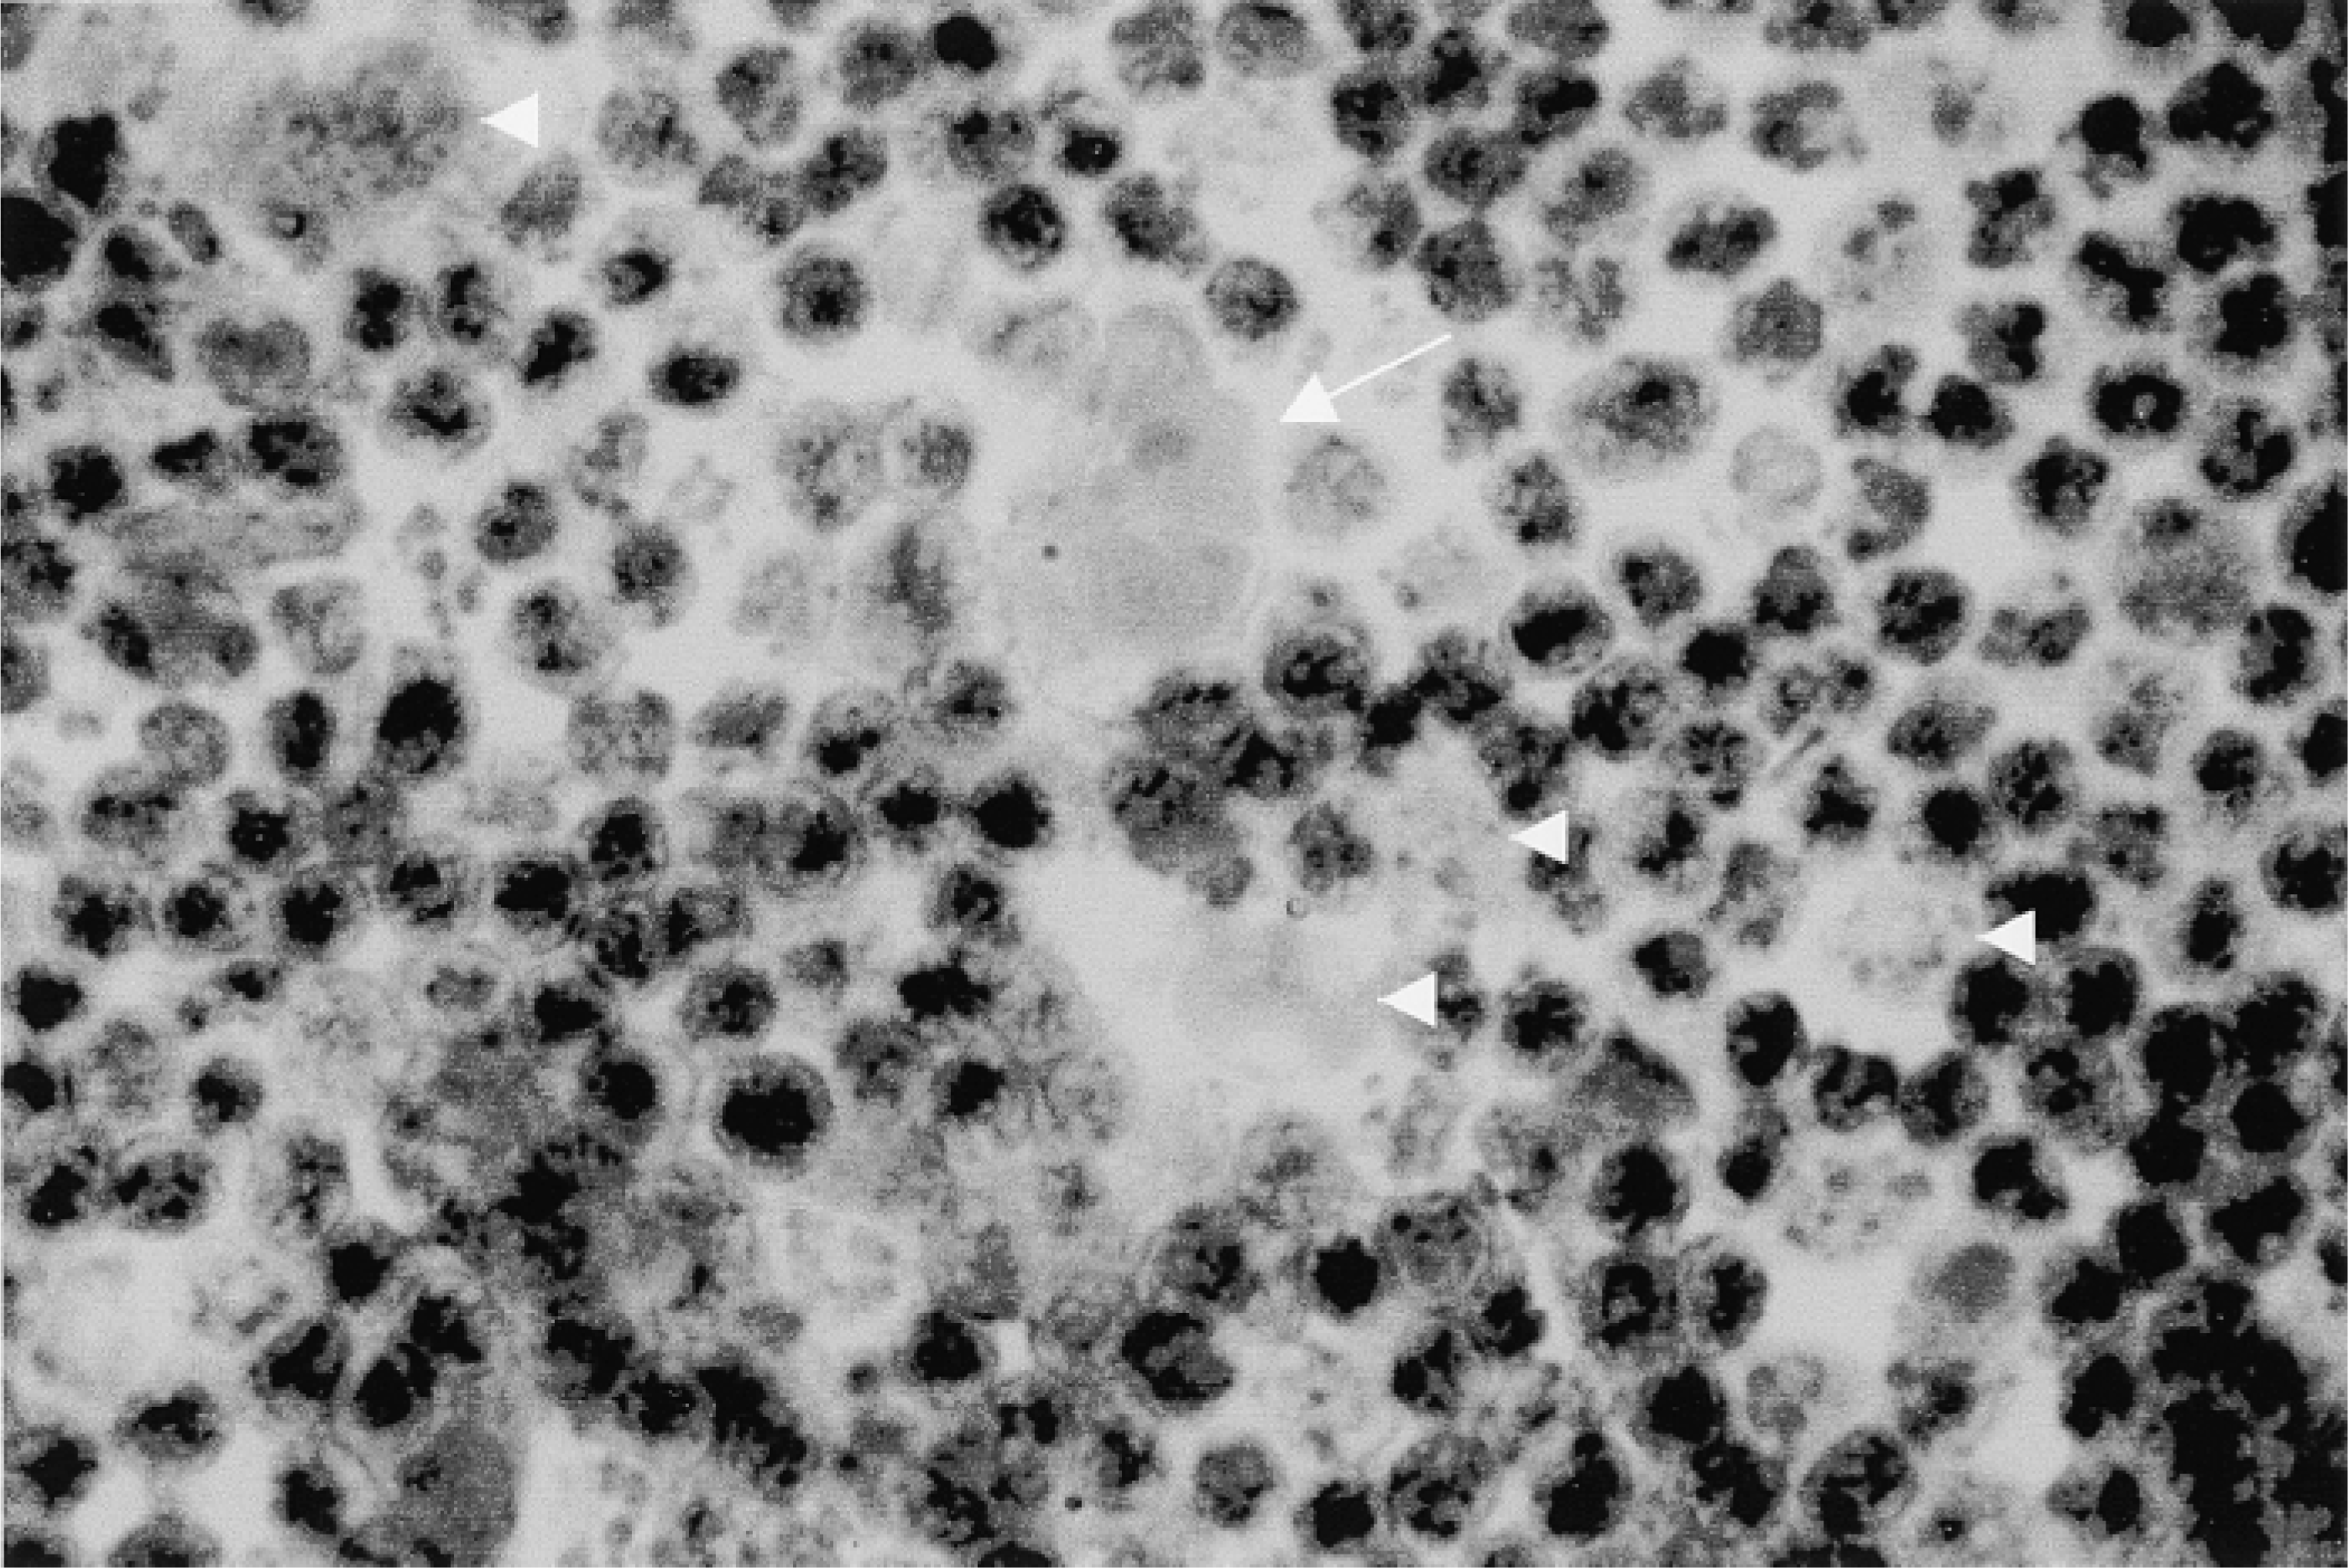
Because Reed–Sternberg cells are considered terminal cells and because they have been reported to exhibit arrested mitosis and DNA fragmentation very frequently (Leoncini et al. 1996), it was reasonable to attribute the disappearance of UBF to apoptosis. Other considerations to be discussed favored the same interpretation of our findings. Therefore, we asked whether the same UBF–AgNOR-reversed pattern would be found in other cells undergoing apoptosis. We first used GC B-cells, which are known to undergo spontaneous apoptosis after several hours of in vitro culture. Cells were collected at 12–14 hr of culture or when set in culture (0 hr) and the two groups were stained as before for UBF and AgNOR. Apoptosis of these cells was assessed by staining with FITC–annexin V and flow cytometric analysis. The percentage of apoptotic cells estimated by this method was 18% at 0 hr, reaching 66% at 12 hr (not shown). AgNOR and UBF staining of the same cultures demonstrated a divergent pattern of expression (maintenance of AgNOR counts and disappearance of UBF dots) restricted to the 12-hr cultures (not shown). Therefore, whereas AgNOR counts were similar in apoptotic and non-apoptotic cultures, UBF dots disappeared or exhibited decreased fluorescence intensity in the apoptotic cells. Most cells in cultures at 0 hr showed three or four UBF dots per cell. At 12 hr, many cells were negative. The percentage of negative cells was 60% but positive cells showed smaller and usually fewer dots (one or two per cell) than 0-hr cultures. UBF and AgNOR staining were also compared in Jurkat T-cells cultured for different times in the presence of anti-CD95 MAb (400 ng/ml) or left untreated (Figure 4). UBF was not seen or showed a decreased intensity in a high percentage of apoptotic cells. When positive UBF dots were seen in apoptotic cultures, they were clearly of smaller size in practically 100% of cells. The fraction of completely negative cells was more than 50% in some experiments. Again, AgNOR counts did not appear to differ markedly between the two cultures (neither in volume nor in dot number) (Figure 4). Therefore, because there were two large populations clearly defined as apoptotic and non-apoptotic, we proceeded to evaluation of AgNOR counting by computerized analysis because it was crucial to the meaning of these experiments to clearly verify that AgNOR amounts do not change noticeably after induction of apoptosis. To our surprise, AgNOR counts were not only maintained but even increased in apoptotic cultures (Table 1). Spontaneous apoptosis of Jurkat cells estimated by annexin V and flow cytometry was around 6%, and this figure increased to 77% after treatment with anti-Fas for 18 hr. In addition, Jurkat cell extracts were prepared from Fas-induced and non-induced cultures for different time lengths and equal number of cells were loaded in each well to carry out immunodetection of UBF by Western blotting and AgNOR staining of gels after blotting to nitrocellulose membranes. It can be seen that although the UBF band is much weaker in wells corresponding to apoptotic cells (Figure 5A), AgNOR-stained bands do not decrease in such cultures as a whole (Figure 5B). In experiments in which incubation with anti-Fas lasted for about 16 hr, proteolytic bands of UBF were detected, but in the experiment shown in Figure 5, in lanes where incubation with anti-Fas was for 20 hr, UBF bands have completely disappeared. It is possible that one of the AgNOR proteins, nucleolin, suffers some degree of proteolysis because the corresponding band appears to be slightly thinner in apoptotic cultures. Howewer, this is not reflected in the total amount of AgNOR-positive staining because two bands of lower molecular weight appear, which are also stained by the AgNOR technique.
AgNOR counting of control Jurkat cells a
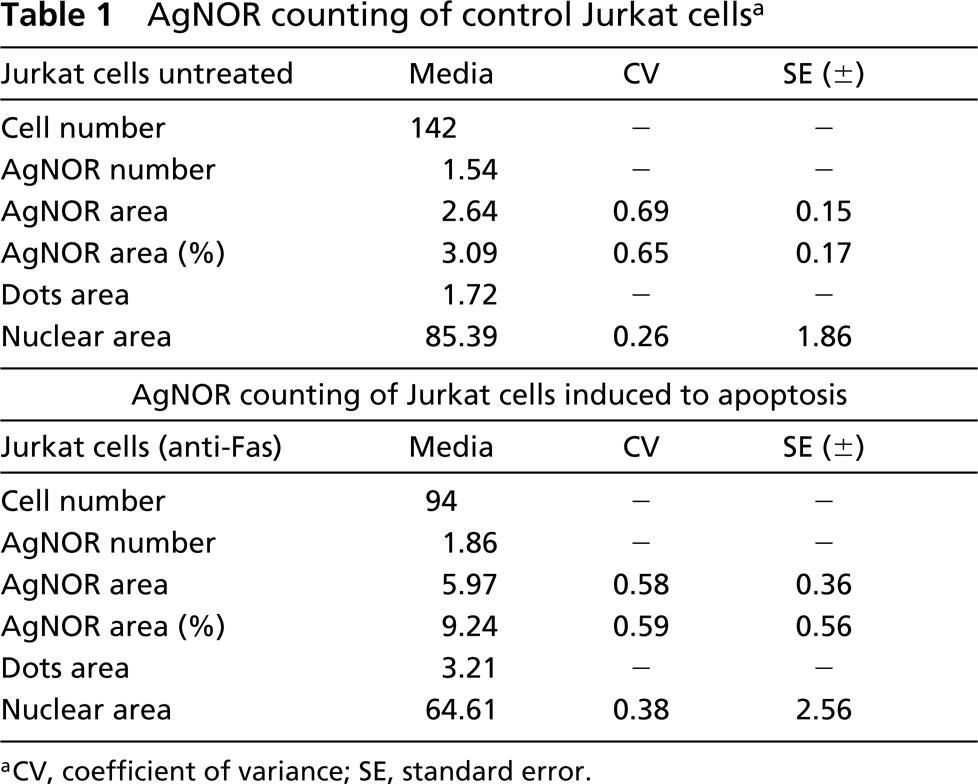
aCV, coefficient of variance; SE, standard error.
Staining of Jurkat cells with anti-UBF and AgNOR. AgNOR staining (
Discussion
AgNOR evaluation is based on quantitative changes of several NOR-associated proteins that are directly related to nucleolar activity. As a histochemical technique, it is not specific for a single protein but instead it reveals several silver-affinity proteins which, remarkably, belong to the ribosome assembly machinery (Roussel et al. 1992). When immunodetection of the co-factor of RNA pol I, UBF, is compared with this en bloc meassurement of nucleolar activity, a clear agreement between both methods is the rule in lymphoid and other malignancies (Torres–Montaner 1998b). This is not surprising because all these proteins are engaged in the ribosome assembly process.
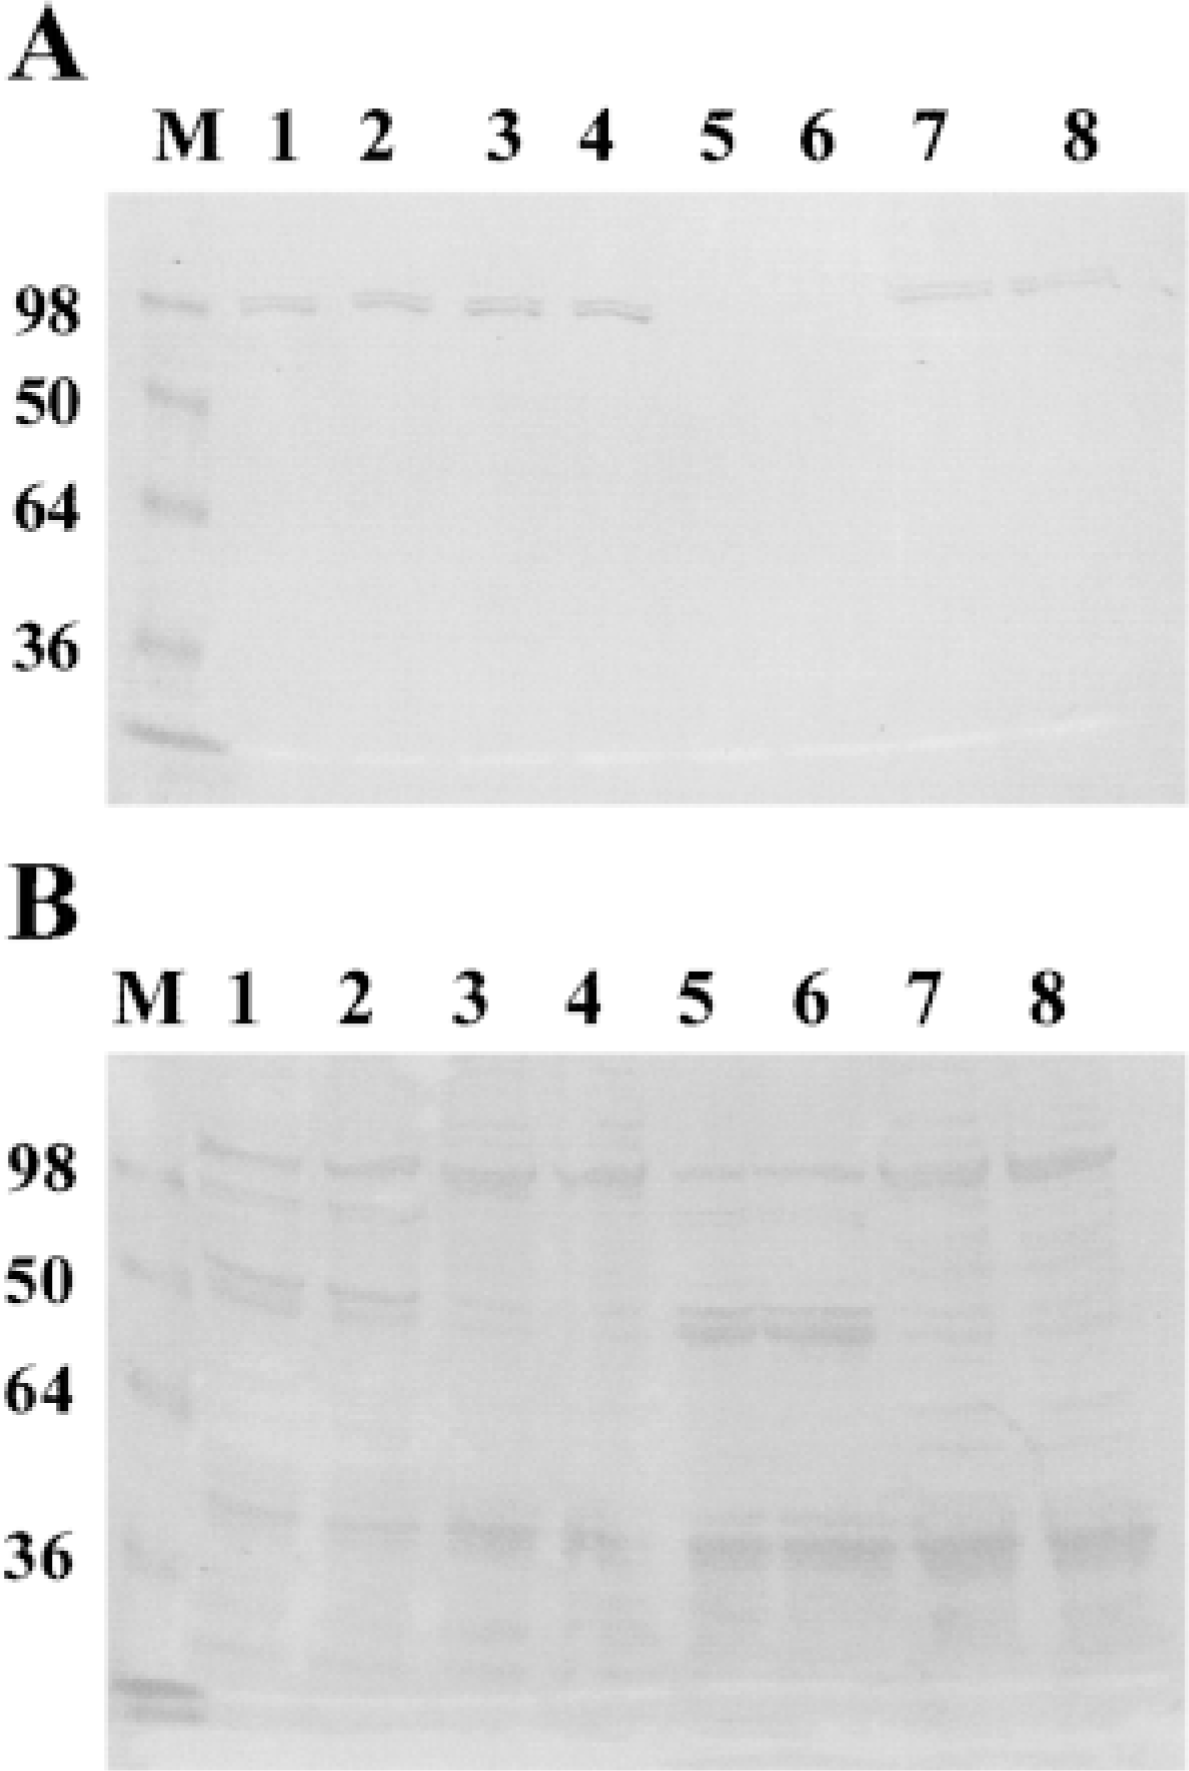
Blotting to nitrocellulose membranes of Jurkat cell extracts incubated with or without anti-Fas antibody and stained with anti-UBF antibody or by the AgNOR technique. (
According to current knowledge of this process, the finding of a high AgNOR value in the face of decreased or absent UBF content is particularly striking, because UBF is required in the first step of ribosome biogenesis. The amount of UBF has been found to diminish in differentiating cells, but with cessation of proliferation there is a concomitant decrease in rDNA gene transcription, and therefore AgNOR counts also diminish (Larson et al. 1993; Datta et al. 1997). Hodgkin and Reed–Sternberg cells show a high Ki-67 and PCNA index, similar to that of high-grade lymphomas, suggesting that they are actively proliferating. These proliferation markers correlate as in other lymphomas with AgNOR counts. However, whereas UBF and AgNOR counts correlate in other lymphoma cells, a discrepancy is found frequently in neoplastic cells of HD. According to current concepts of nucleolar factors, this pattern of expression of NOR proteins must be considered anomalous, because UBF is thought to be an essential in vivo factor. This suggests that this staining pattern may be due to apoptosis. Several other facts favor the same interpretation. (a) Apoptosis was very intense in Case 4 according to the notable presence of mummified cells, and the dissociated staining pattern was more marked than in any other case. (b) We have seen this dissociation in desquamated and superficial cells of lining epithelia (Torres–Montaner et al. 1998b). (c) More importantly, a dissociative staining pattern could have been anticipated from findings showing that apoptosis entails a differential pattern of proteolysis (Casiano et al. 1996). These authors observed, on induction of apoptosis in Jurkat cells, that some proteins, including UBF, were degraded in the process, whereas others, such as B23, were spared. Nucleolin was not tested in their study. Conversely, on induction of apoptosis in two model systems, we reproduced the same pattern of UBF–AgNOR expression. The in vitro models enabled us to analyze our finding at the level of single proteins, confirming results obtained in cytohistological samples and discarding trivial explanations such as masking of antigens. When AgNOR staining is performed on nitrocellulose membranes, the nucleolin band appears to be thinner in lanes corresponding to apoptotic cells, but this is compensated for by the appearance of two silverstained bands of lower molecular weight. This suggests that nucleolin may undergo some degree of proteolysis, albeit to a lower extent than UBF, producing two fragments that are still positive in AgNOR staining. Therefore, even if nucleolin is degraded to some extent, the total number of AgNOR-positive bands remains unaltered or could be increased by splitting of nucleolin into two fragments. At the cytohistological level, this may turn to our advantage by increasing silver counts in conventional AgNOR staining. This hypothesis deserves further investigation. On the other hand, because B23 is not degraded during apoptosis, a comparison of B23 and UBF should be rewarding. The disappearance of UBF probably underestimates the number of apoptotic cells because proteolytic fragments before complete disappearance could yield smaller but more numerous positive dots. Therefore, the finding of some Reed–Sternberg cells positive for UBF staining can be expected even if they are pre-apoptotic.
Previous research on the expression of apoptosis regulatory genes in Hodgkin and non-Hodgkin lymphomas suggested that apoptosis deregulation was involved in the pathogenesis of HD (Xerri et al. 1995; Rigal-Huguet et al. 1996). A more conclusive demonstration of the apoptotic nature of Reed-Sternberg cells was reported shortly thereafter (Leoncini et al. 1996). Our findings suggest that in neoplastic cells of HD the rate of apoptosis is higher than that of accompanying small lymphocytes and is probably, higher than that of other lymphomas. However, they do not allow a comparison between rate of apoptosis of Hodgkin and Reed-Sternberg cells because the small numbers of Reed-Sternberg cells usually detected prevent this study from being statistically significant. Although some studies and our own suggest that Reed-Sternberg cells are pre-apoptotic, it appears that Hodgkin cells can also enter apoptosis without going through a Reed-Sternberg stage. According to this view, Hodgkin cells would be a dynamic and heterogeneous compartment with proliferating and apoptotic cells coexisting.
The extreme variability of UBF and the high AgNOR counts in Hodgkin cells are consistent with an actively proliferating population subject concomitantly to a high rate of apoptosis. This is also consistent with findings demonstrating that apoptosis is linked to unscheduled proliferation and that expression of oncogenes sensitizes cells to apoptosis (Lowe et al. 1993). Differential proteolysis of NOR-associated proteins might be very suitable for detection of pre-apoptotic events in tumor pathology because these proteins vary concomitantly under most physiopathological conditions and they are proliferation markers. Therefore, combined UBF and AgNOR staining could yield valuable information on the balance between apoptosis and proliferation in neoplasia.
Footnotes
Acknowledgements
Supported by a grant from C.I.C.Y.T. from Ministerio de Educación y Ciencia to M.M.V. (PB93–0726) and by grant 96/0666 from Fondo de Investigación Sanitaria, Madrid, Spain to A.T.–M.
We are grateful to Antonia Ortiz, Mari Carmen Lopez, and Maria Luisa Megias for technical assistance.