
Abstract
IL-1β, TNF-α, and IL-6 have been implicated in the destruction of parotid gland acinar cells (but not duct cells) in autoimmune sialoadenitis. Here we report the temporal alterations of these cytokines in parotid acinar cells that may lead to this specificity in cell death in the non-obese diabetic (NOD) mouse model for Sjögren's syndrome. Immunohistochemistry on paraffin sections of parotid gland from 5- and 10-week-old BALB/c and NOD mice confirmed the presence of many peri-acinar lymphoid nodules but few T-cells and macrophages between acinar cells. RT-PCR on enzymatically dispersed mouse parotid acinar cells (MPACs) showed no bands for CD3∊, CD20, or F4/80 regardless of mouse strain or age. By ELISA, MPACs from 10-week-old NODs showed a small but highly significant (p < 0.003) increase in IL-1β and a large significant decrease (p < 0.008) in IL-6 compared to 5-week-old NODs. Norepinephrine-stimulated amylase release from MPACs was not different regardless of mouse strain or age. These data show that alterations in acinar cell production of IL-1β and IL-6 in aging NODs precede periductal lymphoid aggregates and acinar cell secretory dysfunction. (J Histochem Cytochem 48:1033–1041, 2000)
The progressive development of Sjögren's disease was recently shown to coincide with expression of IL-1β, IL-6, and TNF-α in human (Fox et al. 1994; Boumba et al. 1995; Azuma et al. 1997) and mouse (Hamano et al. 1993; Chandrasekar et al. 1995; Robinson et al. 1998) salivary glands and saliva (Fox et al. 1994; Grisius et al. 1997). Because these studies were done using saliva or homogenized tissue, the cellular sources of these cytokines and the modulation of these signaling molecules during disease progression remain unknown. Inflammatory cytokines are synthesized and released by salivary gland acinar cells (Tanda et al. 1998), lymphocytes (Fox et al. 1994; Hiroi et al. 1994), and macrophages (van Blokland et al. 1997).
The histopathology of salivary glands affected by autoimmune disease shows clones of CD4+ T-cells (Miyagawa et al. 1986) with Th1 and Th2 subpopulations (Fox et al. 1994), B-cells (Miyagawa et al. 1986), macrophages (Takeda 1980; Tanaka et al. 1988), and plasma cells (Tanaka et al. 1988) in clusters with acinar atrophy and duct proliferation (Price and Venables 1995) in humans and in mouse models for Sjögren's syndrome. Although the temporal presence of monocytic cell infiltrates in salivary glands correlates with reduced saliva production in non-obese diabetic (NOD) mice (Hu et al. 1992), the central role of these cells in the destruction of secretory epithelial cells has recently been challenged (Robinson et al. 1997). For example, NOD mice with severe combined immunodeficiency (NOD-scid) in B- and T-cells show acinar cell death in the absence of functional lymphocytes (Robinson et al. 1996). In addition, MRL/lpr mice show a progressive increase in lymphocyte infiltration in salivary glands (Jonsson et al. 1987) that does not correlate with a temporal decline in saliva production (Wolff et al. 1991).
A new paradigm for autoimmune exocrinopathy suggests that cytokine-induced, programmed cell death (Kong et al. 1997) of secretory epithelial cells (Robinson et al. 1996) leads to release of organ-specific autoantigens (Haneji et al. 1997), generation of autoantibodies (Haneji et al. 1997), and infiltration of the exocrine gland by B- and T-cells (Higuchi et al. 1992). Genetic predispostion to increased activity of cysteine proteases, such as interleukin-1β-converting enzyme in salivary gland acinar cells, may induce acinar cell apoptosis through the CD95 (Fas) signaling pathway (Kong et al. 1997; Robinson et al. 1997). In addition, Il-1β and TNF-α enhance the secretion of acinar cell (but not duct cell)-sythesized matrix metalloproteinase-2 (MMP-2) expression (e.g., a 72-kD collagenase) (Azuma et al. 1997). Therefore, IL-1β and TNF-α may cause degradation of the basement membrane and disruption of acinar cell architecture (Azuma et al. 1997) through MMP-2 modulation. Ultimately, acinar cell death may lead to the release of salivary gland-specific autoantigens, such as anti-Golgi complex antigens (Rodriguez et al. 1982) or the 120-kD α-fodrin antigen (Haneji et al. 1997), that activate the immune system. In toto, these studies are raising important new questions regarding the effector cells responsible for initiating Sjögren's syndrome. This report is the first to establish temporal alterations in concentrations of IL-1β, TNF-α, and IL-6 in parotid acinar cells preceding lymphocyte infiltration of salivary glands in aging NOD mice.
Materials and Methods
Animal Care Guidelines
The experiments were approved by the Beth Israel-Deaconess Committee on Animal Research and by the Harvard Medical School's Animal Management Program. These animal management programs are accredited by the American Association for the Accreditation of Laboratory Animal Care, meet National Institutes of Health standards as set forth in the “Guide for the care and use of laboratory animals” [DHHS publication (NIH) 86-25, revised 1996], and accept as mandatory the PHS “Policy on Humane Care and Use of Laboratory Animals by Awardee Institutions” and NIH “Principles for the Utilization and Care of Vertebrate Animals Used in Testing, Research and Training.” The animals were housed in the Beth Israel-Deaconess animal care facility.
Harvest and Dispersion of Mouse Parotid Acini
NOD and BALB/c (control strain) male mice ages 4–5 weeks and 10–12 weeks were used in these studies. Mice were fasted overnight, anesthetized with sodium pentobarbital (Veterinary Laboratories; Lenexa, KS) (50 μg/g), and sacrificed by severing the abdominal aorta. Freshly harvested glands from three mice were pooled per experiment and used for secretion studies, light microscopy, RNA isolation, RT-PCR, and enzyme assays. All experiments were done in triplicate.
Acinar cell isolation was done using a standard collagenase digestion method (Quissell and Redman 1979), slightly modified (Tanda et al. 1998). Dispersed acinar preparations consisted of aggregates, each containing 5–30 acinar cells. Cell viability was >90% as determined by trypan blue dye (Sigma Chemical; St Louis, MO) exclusion.
Cell Handling and Stimulation
At precise time points (0, 5, 10, and 20 min after stimulation), 2.5-ml aliquots of acinar cells in suspension were added to a 12-ml syringe (Monoject; St Louis, MO) that was connected to a 3-μm filter (Millipore; Bedford, MA). Aliquots (1.8-ml) of supernatant for either IL-1β, TNF-α, or IL-6 ELISA and 0.6-ml aliquots of supernatant for amylase and lactate dehydrogenase (LDH) release were collected in separate tubes. and immediately frozen at –70C. The filter was immersed in 1 ml of distilled water for determination of total cellular IL-1β, TNF-α, or IL-6 by ELISA. Aliquots (100-μl) of cells in suspension were collected at each time point to determine total amylase, LDH, and DNA. Unstimulated acinar cells from the same mouse harvests were handled identically and in parallel to stimulated aliquots at each time point to determine basal secretion. The entire time required to sample a single time point was less than 20 sec.
Histology
Parotid glands and spleens were fixed in 10% neutral buffered formalin for 2 hr at 20C and processed routinely on a Tissue-Tek VIP processor (Miles; Naperville, IL), beginning with ethanol dehydration (Login et al. 1997). Paraffin sections were cut at 4 μm in preparation for staining by hematoxylin and eosin or for immunohistochemistry.
Immunohistochemical Detection of CD3∊ and F4/80
Using a Vectastain Elite ABC kit (Vector Laboratories; Burlingame, CA), 4-μm paraffin sections of mouse parotid gland were stained for a cytoplasmic T-cell-specific antigen, CD3, with rabbit anti-human CD3 IgG (1:30, 1 hr, 20C) (Dako; Carpinteria, CA), secondary biotinylated swine anti-rabbit IgG (1:200, 30 min, 20C) (Dako), and avidin-horseradish peroxidase conjugate (1:400, 30 min, 20C) (Vector) (Login et al. 1997). A murine macrophage membrane antigen, F4/80, was detected using rat anti-mouse F4/80 IgG (1:200, 1 hr, 20C) (Serotec; Raleigh, NC), secondary biotinylated rabbit anti-rat IgG (1:200, 30 min, 20C) (Vector), and avidinhorseradish peroxidase conjugate (1:125, 30 min, 20C) (Vector). Sections stained for CD3 were blocked with 5% normal swine serum and sections stained for F4/80 were blocked with 5% normal rabbit serum. Normal rabbit IgG and normal rat IgG were used in negative controls for CD3 and F4/80 detection, respectively. Diaminobenzidine substrate (Sigma) was used for signal detection. Sections were counterstained with hematoxylin (Sigma) or with crystal violet-free methyl green (Sigma) for 1 min at 20C.
RNA Isolation and RT-PCR Confirmation of Murine CD3∊, F4/80, CD20, and Glyceraldehyde-3-phosphate Dehydrogenase (G3PDH)
Total RNA was isolated from whole parotid gland and spleen preparations and from dispersed mouse parotid acinar cell preparations using the guanidine isothiocyanate method (Davis et al. 1986). RNA concentration was determined by measuring the OD260 of an aliquot of the final preparation on a Beckman DU-64 spectrophotometer (Tanda et al. 1998).
RT-PCR detection of CD3∊, F4/80, CD20, and G3PDH mRNAs was done using mouse-specific primers as previously described (Login et al. 1997), slightly modified. In brief, thirty cycles for G3PDH, CD3∊, and CD20 and 35 cycles for F4/80 were performed using a Perkin Elmer Cetus GeneAmp PCR System 2400 (Foster City, CA) with the following temperature profiles for G3PDH and F4/80 at 94C for 1 min, 60C for 1 min, and 72C for 1 min; for CD3∊ at 94C for 30 sec, 56C for 30 sec, and 72C for 1 min; and for CD20 at 94C for 1 min, 55C for 1 min, and 72C for 1 min. Mouse G3PDH primers (Gibco BRL Life Technologies; Gaithersburg, MD) included the sense primer: 26-mers5′-TGA AGG TCG GTG TGA ACG GAT TTG GC-3′ from nucleotide position 51–76 and the antisense primer: 24-mers5′ CAT GTA GGC CAT GAG GTC CAC CAC-3′ from nucleotide position 1033–1010 (Clontech Laboratories; Palo Alto, CA). Mouse CD3∊ (generously donated by C. Fox and J. Danska; Hospital for Sick Children, Toronto) primers included the sense primer: 18-mers5′ ACT GGA GCA AGA ATA GGA-3′ from nucleotide position 473–490 and the antisense primer: 18-mers5′ AGG AGA GGA AAG GAA CTG-3′ from nucleotide position 968–951 (Fox and Danska 1997). Mouse CD20 and F4/80 primers were designed using Oligo Primer Analysis Software (National Biosciences; Plymouth, MN) and synthesized commercially (Gibco BRL Life Technologies; Grand Island, NY). Mouse CD20 primers included the sense primer: 24-mers5′-AAA ACC TCC AGG AAG AGT TTG GTC-3′ from nucleotide position 475–498 and the antisense primer: 23-mers5′-CGA TCT CAT TTT CCA CTG GCA AG-3′ from nucleotide position 1045–1023. Mouse F4/80 primers included the sense primer: 22-mers5′-AGA TGG GGG ATG ACC ACA CTT C-3′ from nucleotide position 85–106 and the antisense primer; 20-mers5′-TGT TCA GGG CAA ACG TCT CG-3′ from nucleotide position 593–574. The amplified products were visualized on an ethidium bromide-stained 1% agarose gel. Gel documentation was done using the Kodak Digital Science electrophoresis documentation and analysis system with the ID Image Analysis Software (version 2.0U) (Eastman Kodak; Rochester, NY).
DNA Assay
Acinar cells were washed off the filter paper and were freeze-thawed three times in distilled water to release total DNA from each preparation. DNA was stained with bisbenzamidetrihydrochloride (Sigma). Excitation and emission were measured at 360 λ and 450 λ respectively, in a Hitachi F-2000 fluorescence spectrophotometer (Hitachi America; Princeton, NJ) according to the method of Labarca and Paigen (1980). The assay was linear between 0.25 μg and 3 μg of DNA.
ELISA
Il-1β, IL-6, and TNF-α determinations from lysates of unstimulated cells were made in a double-sandwich ELISA format using commercially available kits for mouse cytokines (Endogen; Cambridge, MA) as previously described (Tanda et al. 1998). Colorimetric reactions were read on a Thermomax microplate reader (Molecular Devices; Menlo Park, CA). Cytokine concentrations (cytokine/μg DNA) in each acinar cell preparation were determined by dividing the ELISA values for each cytokine by the total amount of DNA per preparation from lysates of unstimulated cells.
Calculation of Total IL-1β, IL-6, and TNF-α Amounts in Parotid Acinar Cells
Cytokine concentrations (pg cytokine/μg DNA) were multiplied by the known amount of DNA in a rodent salivary gland cell (6.85 pg DNA/cell) (Shapiro 1976) to yield an estimate for the total amount of cytokine per cell.
Amylase and Lactate Dehydrogenase Determination
Amylase was determined using a 4,6-ethylidene (G7)-p-nitrophenyl (G1)-α d-maltoheptaside substrate (Sigma) and LDH was determined using a pyruvate substrate (Sigma) in a centrifugal autoanalyzer (COBAS-BIO; Roche Diagnostic, Nutley, NJ) according to the method of Crouse et al. (1979).
Statistical Methods
Differences among the percent amylase release and concentrations of IL-1β, TNF-α, and IL-6 in parotid acinar cells from BALB/c and NOD mice were examined for statistical significance using the one-tailed, two-sample t-test. Data organization and analysis were performed on the PROPHET system (Bolt, Barenek, and Newman; Cambridge, MA), a national computer resource, sponsored by the National Center for Research Resources, National Institutes of Health (Bethesda, MD).
Results
Detection of T-cells and Macrophages in Mouse Spleen Parotid Gland and Parotid Acinar Cell Preparations
Histological examination of BALB/c mouse parotid glands revealed the presence of many well-circumscribed lymphoid nodules (i.e., 200–2000 μm in diameter) (Figure 1) in close association with parotid gland lobules, as shown in Figure 1A for BALB/c. Hematoxylin and eosin staining of the lymphoid nodule showed typical germinal center-like architecture (Figure 1B), with abundant CD3+ T-lymphocytes in the periphery of the lymphoid nodules (Figure 1C).
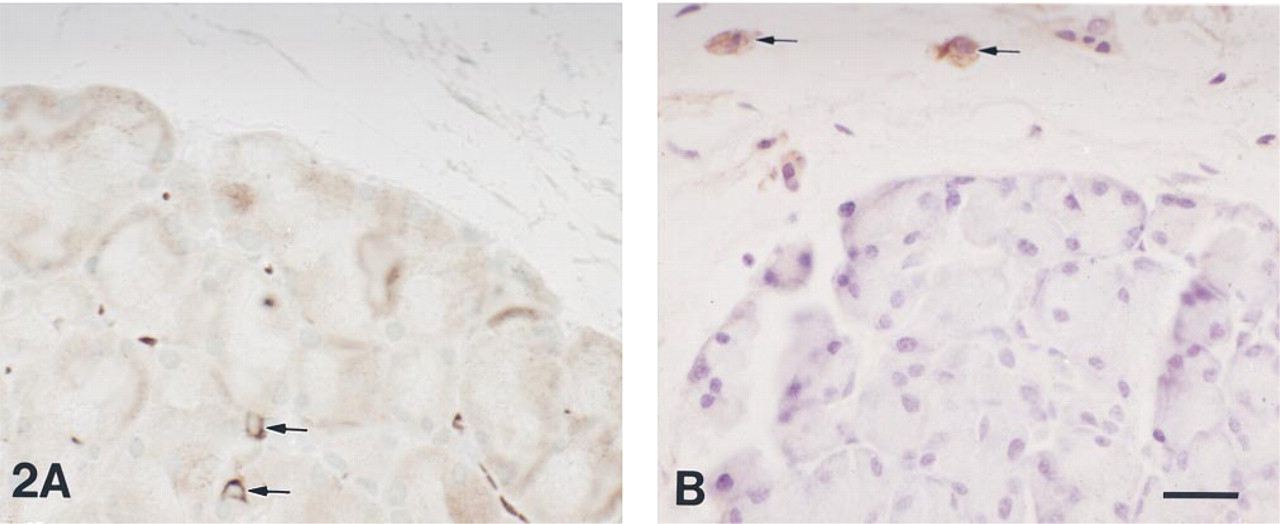
T-cells were rarely seen between parotid gland acinar cells in mice, regardless of age, including the parotid glands of the autoimmune NOD mouse (Figure 2A). Using immunohistochemical staining to detect murine F4/80 [a 160-dK macrophage transmembrane glycoprotein (McKnight et al. 1996)], we found a few macrophages in the connective tissue of mouse parotid glands (Figure 2B). Macrophages were not seen between parotid acinar cells in these studies, regardless of mouse strain or age. Despite the limited number of leukocytes infiltrating the parotid glands of mice, the presence of lymphoid nodules necessitated special care in isolating purified acinar cell populations to carry out the following experiments.
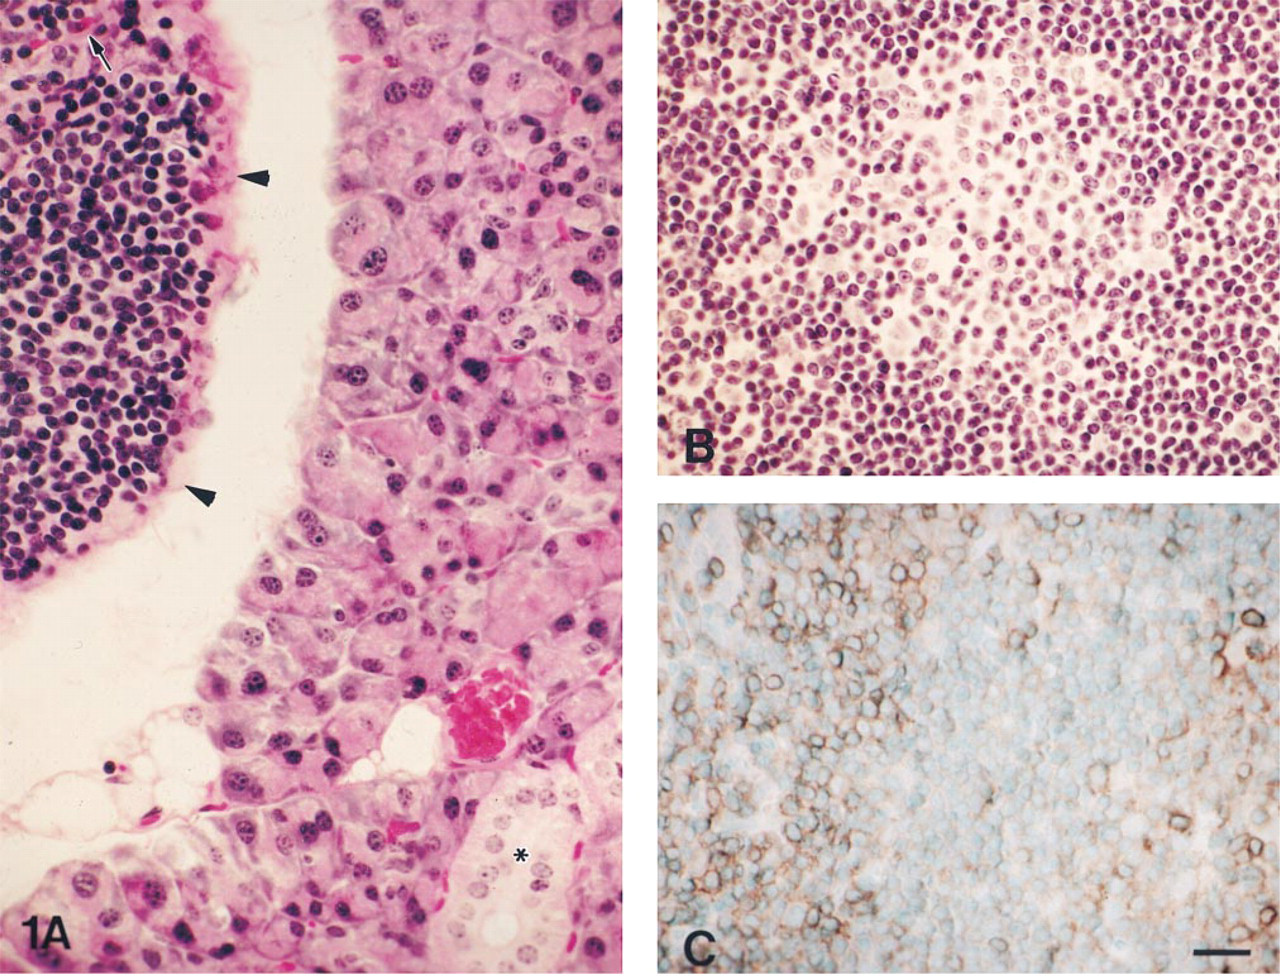
Paraffin sections of a parotid gland lobule (
Paraffin section of a 5-week-old NOD mouse parotid gland lobule showing immunohistochemical localization of CD3-positive T-cells (see legend to Figure 1) and counterstained with methyl green (
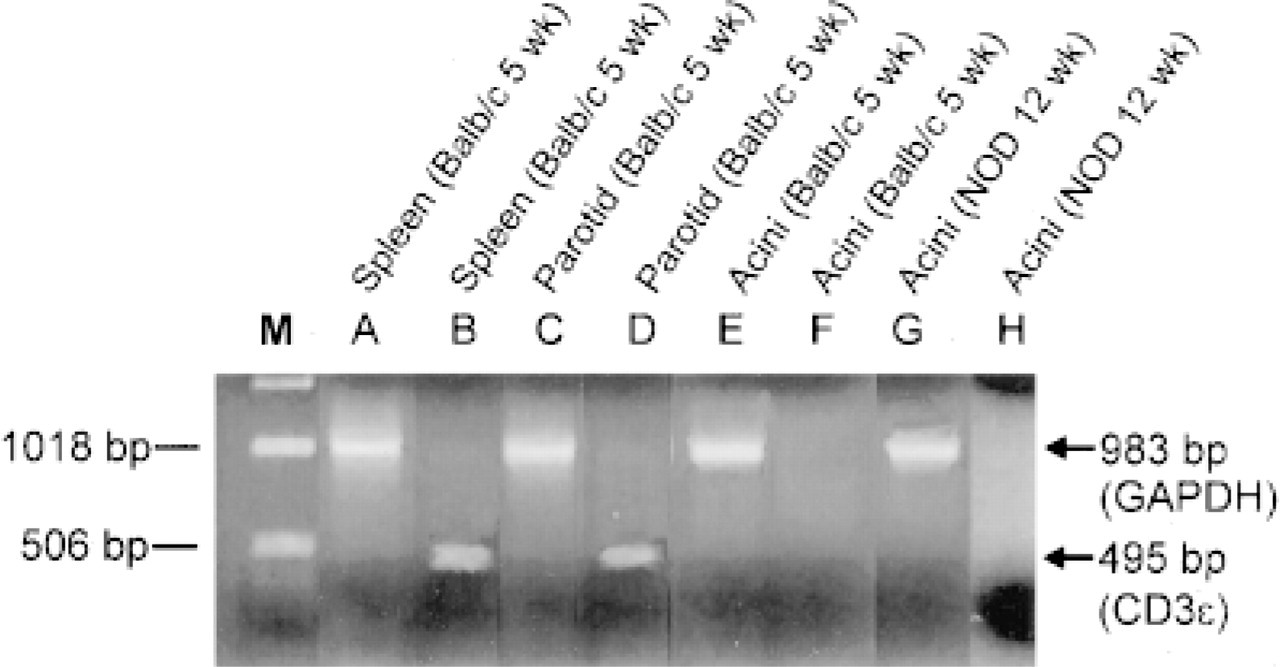
RT-PCR characterization of murine G3PDH (Lanes A,C, E,G) and murine T-cell CD3∊ (Lanes B,D,F,H) in 5-week-old BALB/c mouse spleen (Lanes A,B), parotid gland (Lanes C,D), and a dispersed parotid acinar cell preparation (Lanes E,F), and in a 12-week-old NOD mouse dispersed parotid acinar cell preparation (Lanes G,H). No bands are seen for CD3∊ in the acinar cell preparations (Lanes F,H). M, 1 kbp marker.
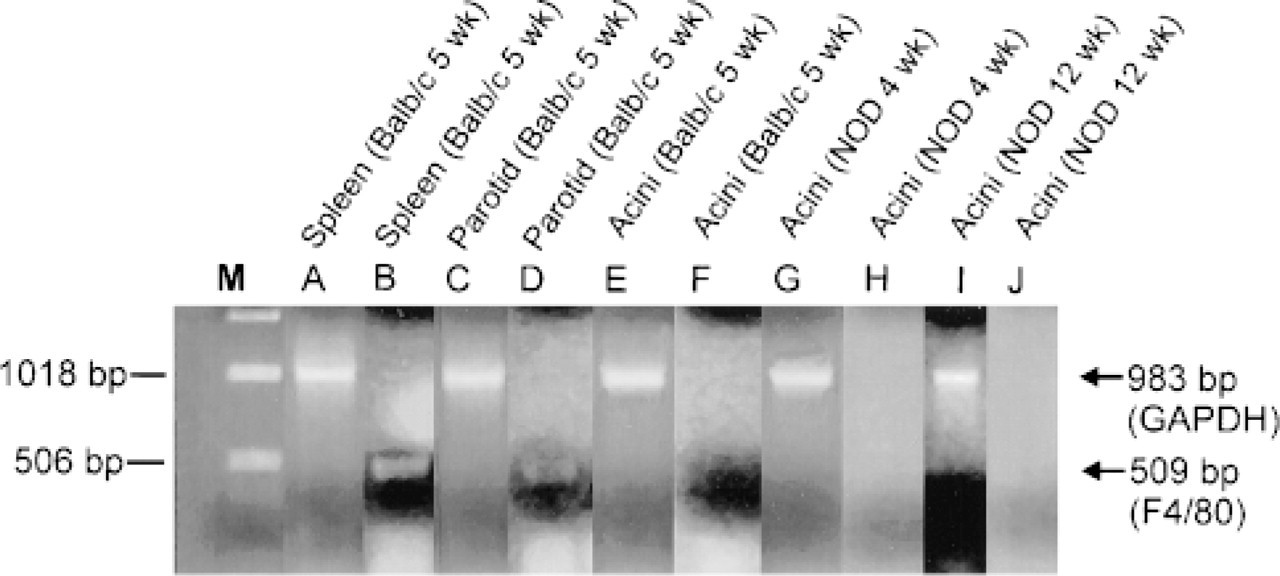
RT-PCR characterization of murine G3PDH (Lanes A,C, E,G,I) and murine macrophage F4/80 (Lanes B,D,F,H,J) in 5-week-old BALB/c mouse spleen (Lanes A,B), parotid gland (Lanes C,D), and a dispersed parotid acinar cell preparation (Lanes E,F), and in 4- and 12-week-old NOD dispersed mouse parotid acinar cell preparations (Lane G,H and I,J, respectively). No bands are seen for F4/80 in the acinar cell preparations (Lanes F,H,J). M, 1-kbp marker.
We next used RT-PCR and mouse primers specific for CD3∊, CD20, and F4/80 to detect the presence of CD3∊, CD20, and F4/80 mRNAs in homogenized parotid gland, enzymatically dispersed acinar cell preparations, and spleen. CD3∊ could be detected only in mouse spleen and parotid gland (Figure 3, Lanes B and D). Dispersed acinar cell preparations from 5-week-old BALB-c (Figure 3, Lane F) and from 12-week-old NOD (Figure 3, Lane H) mice showed no CD3. The presence of G3PDH mRNA in the spleen, parotid gland, and in two acinar cell preparations (Figure 3, Lanes A,C,E,G) showed that our specimen handling methods yielded high-quality total cellular RNA. Controls in which the RT enzymes were omitted showed no reaction products for G3PDH, CD3∊, of F4/80, indicating that our RNA preparations were free of genomic DNA contamination (data not shown).
F4/80 could be detected only in mouse spleen and parotid gland (Figure 4, Lanes B and D). Dispersed parotid acinar cell preparations from 5-week-old BALB/c (Figure 4, Lane F), 4-week-old NOD (Figure 4, Lane H), and 12-week-old NOD (Figure 4, Lane J) mice showed no F4/80 mRNA. G3PDH mRNA was abundant in spleen, parotid gland, and in all acinar cell preparations (Figure 4, Lanes A,C,E,G,I).
CD20 was detected in mouse spleen (Figure 5, Lane A) but not in dispersed parotid acinar cell preparations from 5-week-old BALB/c (Figure 5, Lane B) or from 12-week-old NOD (Figure 5, Lane C) mice. G3PDH mRNA was abundant in spleen and in acinar cell preparations (data not shown)
Determination of Cell Number in Parotid Acinar Cell Harvests
Total cellular DNA in all acinar cell preparations was 13.9 ± 3 mg DNA/ml (n = 12 preparations). Next, using the published value of 6.85 pg DNA per rodent salivary gland acinar cell (Shapiro 1976), we calculated 2 ± 0.4 × 10⁶ acinar cells/ml in all preparations. There were no differences in cell yield regardless of mouse age or strain.
Determination of IL-1β, IL-6, and TNF-α Concentrations in Mouse Parotid Acinar Cell Preparations and Calculated Average Amounts in Individual Acinar Cells
We used ELISA and DNA assays to determine total cell concentrations of IL-1β, IL-6, and TNF-α in unstimulated, enzymatically dispersed mouse parotid acinar cell preparations harvested from 5-week- and 10-week-old BALB/c and NOD mice. Dispersed parotid acinar cells harvested from 10-week-old NOD mice showed a small but highly significant (p < 0.003) increase in IL-β and a large significant decrease (p < 0.008) in IL-6 compared to 5-week-old NOD mice (Table 1). In contrast, BALB/c mice showed a significant increase both in IL-1β (p < 0.03) and in IL-6 (p < 0.005) with increasing age. In addition, the concentration of IL-6 in 10-week-old NOD mice was significantly lower (p < 0.0007) than IL-6 in 10-week-old BALB/c mice. TNF-α showed no change in concentration with mouse strain or age (Table 1). Calculated average amounts of IL-1β, IL-6, and TNF-α in parotid acinar cells from 5- and 10-week-old BALB/c and NOD mice are shown in Table 1.
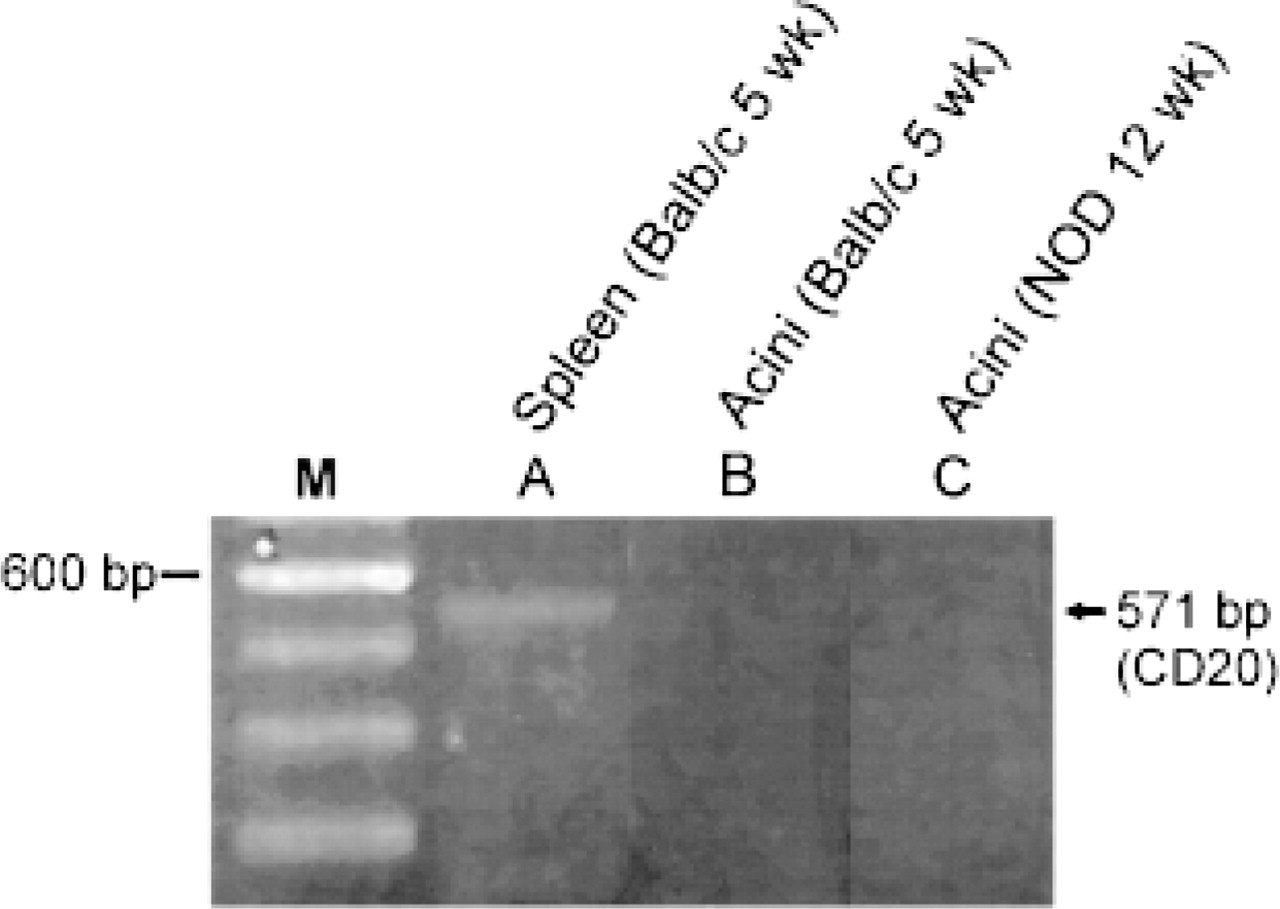
RT-PCR characterization of murine B-cell CD20 (Lanes A–C) in 5-week-old BALB/c mouse spleen (Lane A), a dispersed parotid acinar cell preparation (Lane B), and in a 12-week-old NOD dispersed mouse parotid acinar cell preparation (Lane C). No bands are seen for CD20 in the acinar cell preparations (Lanes B,C). M, 600-bp marker.
Amylase and LDH Release from Dispersed Parotid Acinar Cells Harvested from BALB/c and NOD mice
Amylase determinations from all partoid acinar cell preparations showed maximal release by 20 min after 10−5 M norepinephrine stimulation at 37C. The percent amylase released above basal levels for 5-week-old BALB/c and NOD mice (56 ± 12% and 58 ± 9%, respectively) was not statistically different from 10-week-old BALB/c and NOD mice (62 ± 4% and 66 ± 8%, respectively) (Figures 6A-6D). Importantly, LDH determinations from the same acinar cell preparations were less than 5%, which showed that the concentration of norepinephrine used for stimulation did not cause acinar cell death (Figures 6A–6D).
Parotid acinar cell concentrations and calculated average cellular amounts of IL-1β, IL-6, and TNF-α from BALB/c and NOD mice
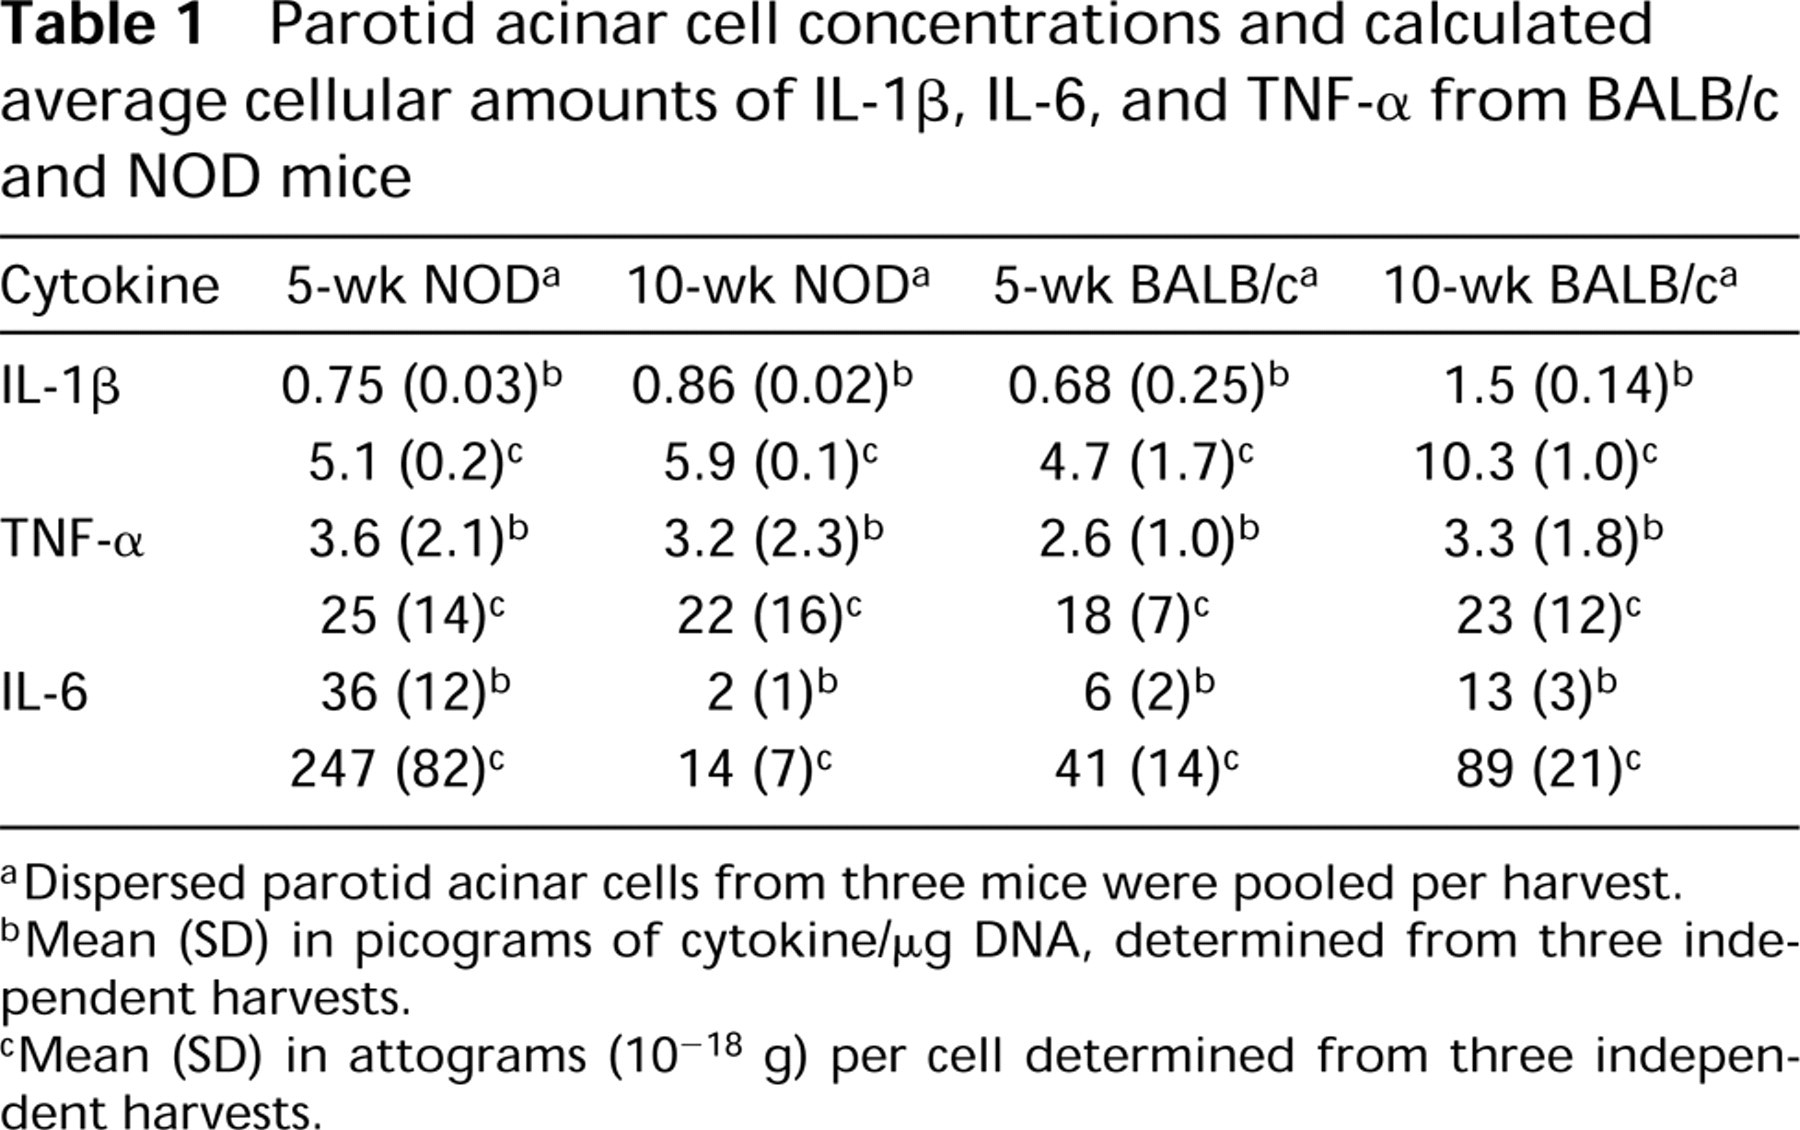
Dispersed parotid acinar cells from three mice were pooled per harvest.
Mean (SD) in picograms of cytokine/μg DNA, determined from three independent harvests.
Mean (SD) in attograms (10−18 g) per cell determined from three independent harvests.
Discussion
These studies show that an enzymatic digestion method for dispersing secretory epithelial cells from the parotid gland also eliminates T-cells, B-cells, and macrophages below the level of detection by a highly sensitive RT-PCR method. Using standardized cytokine concentrations (i.e., pg cytokine/μg acinar cell DNA), we determined cytokine profiles in parotid acinar cells from BALB/c and NOD mice at precise time points during progression of autoimmune sialoadentis. The parotid gland was selected for these studies because it is the major saliva-producing gland in the oral cavity of humans (Grau 1990) and rodents (Baker et al. 1979). Serous acini are the sole secretory cell type in parotid gland (Tandler 1978) and are an important cell type in most exocrine glands. The secretory function of serous acini can be easily determined using assays of amylase and LDH release (Login et al. 1997). In addition, parotid glands affected by Sjögren's syndrome show a chronic progressive decrease in function in humans (Wise et al. 1988) and in NOD mice (Hu et al. 1992).
Because of the recent emphasis on the role of acinar cells in the initiation and progression of autoimmune sialaodenitis (Fox et al. 1994; Azuma et al. 1997), we studied parotid acinar cells from 5-week and 10-week NOD mice, a time frame that precedes obvious lymphocytic involvement and salivary gland dysfunction in this mouse strain (Rabinovitch et al. 1996; Robinson et al. 1998). The onset of the periductal lymphocytic histopathology in rodent pancreas and salivary glands is observed between 8 and 10 weeks (Noorchashm et al. 1997; Robinson et al. 1998). Interestingly, the NOD mouse literature does not report inflammatory cytokine mRNA or protein data in mouse salivary glands younger than 8-weeks (Miyagawa et al. 1986; Wicker et al, 1992; Robinson et al. 1997, 1998). Therefore, alterations of these cytokine signaling molecules that occur in acinar cells preceding the lymphocytic infiltrate have not been determined.
In this study, it was necessary to determine if the enzymatic dispersion methods we used for harvesting parotid acinar cells resulted in cell preparations that were free of other cellular sources (i.e., T-cells, B-cells, macrophages) of these cytokines. Using RT-PCR, we showed the unequivocal absence of T-cell-, B-cell-, and macrophage-specific mRNA in all acinar cell preparations. Enzymatic dispersion methods similar to the one we used do not disrupt T-cell surface markers (Hiroi et al. 1994) or affect cell viability (Hiroi et al. 1994), further suggesting that if these cells were contaminating our acinar cell preparations we could also have detected them by immunohistochemistry. Although enriched preparations of lymphocytes have been recovered from enzymatically dispersed mouse salivary gland using Percoll gradients (Mega et al. 1992), our data are the first to show that these methods can be used to prepare acinar cell preparations free of T- and B-cells and of macrophages.
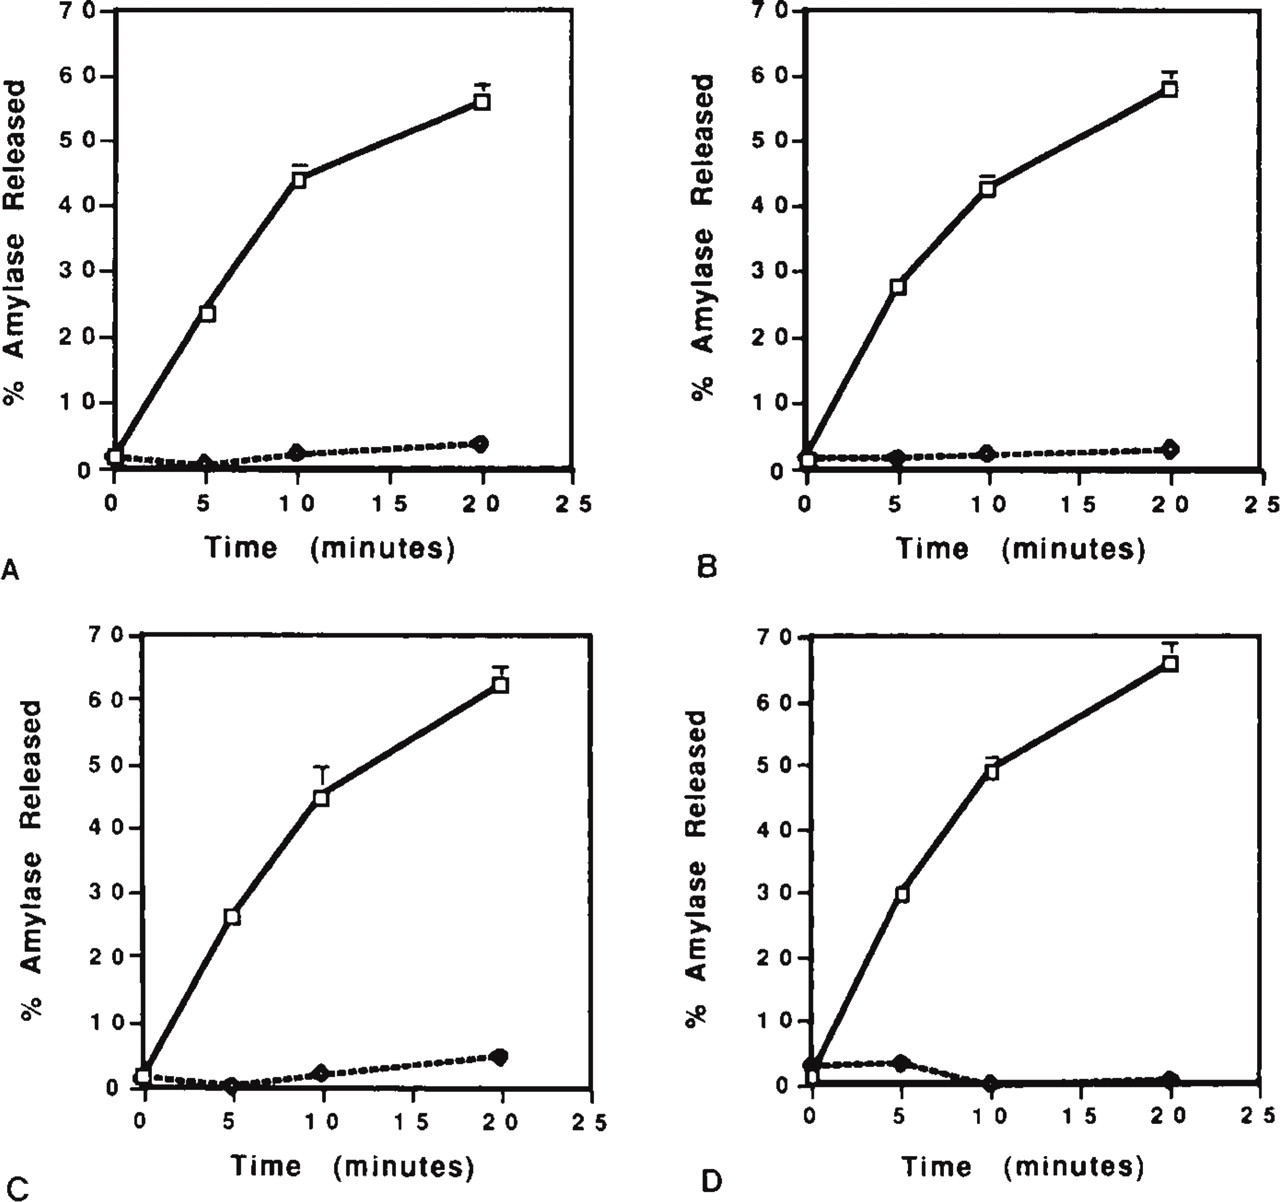
Amylase and LDH release from parotid acinar cells harvested from 5-week-old BALB/c mice (
We considered the possibility that intracellular IL-1β, TNF-α, and IL-6 concentrations in isolated acinar cells might be altered secondary to the acinar cell dispersion procedure. Therefore, we used established cell dispersion methods (Quissell and Redman 1979) appropriately modified to reduce upregulation of IL-1β, IL-6, and TNF-α. For example, media and dispersion solutions did not contain known inducers (e.g., endotoxin or serum factors) of IL-1 genes (Dinarello 1996). In addition, collagenase and hyaluronidase do not induce IL-1β (Dinarello 1996). Because upregulation of cytokine mRNA in rodents occurs between 6 and 12 hours after induction (Hebda et al. 1998), the harvesting and digestion methods we used were completed within 3–4 hr. Finally, IL-1β and IL-6 remain compartmentalized within their delicate secretory storage granules after acinar cell dispersion (Tanda et al. 1998). Taken together, the cytokine data we report most likely reflect the concentration of stored cytokine rather than newly synthesized cytokine secondary to handling.
Although the precise role(s) of inflammatory cytokines in the pathophysiology of Sjögren's syndrome is unknown, evidence supporting their direct participation in initiating glandular dysfunction is mounting. For example, increased levels of cysteine proteases (e.g., interleukin-converting enzyme, ICE) were found by both an in vitro activity assay and Western blotting analysis of salivary glands from 20-week-old NOD mice compared with 8-week-old BALB/c and NOD mice (Robinson et al. 1997). The mechanism of ICE has been shown to function in the cell death pathway by linking biochemically to other key molecules of the apoptotic pathway (Bcl-2, Bcl-x, and a CED family of proteases that are localized on mitochondrial cell membranes) (Yang et al. 1994). Once the complex is associated, cytochrome-C is released from mitochondria and a caspase cascade is activated (Chinnaiyan et al. 1997). Furthermore, IL-1β is a substrate of ICE relevant to cell death and, depending on the temporal cellular commitment to apoptosis, mature IL-1β may function as a positive or negative mediator of cell death (Friedlander et al. 1996).
It is interesting that whereas IL-1 β increased, TNF-α concentrations in parotid acinar cells remained almost constant in BALB/c and NOD mice between 5 and 10 weeks. In support of our findings, others have shown in mononuclear leukocytes from aging NOD mice that IL-1 concentrations increased between 13 and 16 weeks but that TNF-α mRNA concentrations did not change (Rabinovitch et al. 1996). Similarly, in studies of cytokine mRNA expression in submandibular gland homogenates from NOD mice, IL-1β increased between 8 and 12 weeks, whereas TNF-α mRNA was at the same level when measured at these two time pints (Robinson et al. 1998). TNF-α may act synergistically with IL-1 β to induce expression of Fas ligand in secretory epithelial cells and to trigger apoptosis (Giordano et al. 1997). Alternatively, a recent study using a neutralizing anti-TNF-α monoclonal antibody in NOD mice showed no reduction in the development of insulin-dependent diabetes mellitus, arguing against a crucial role of TNF-α in the induction of this autoimmune disease (Yang et al. 1994).
Several studies report a correlation between increased IL-6 concentrations and increased autoimmune disease activity (Grisius et al. 1997) in homogenized salivary gland preparations from humans (Fox et al. 1994; Boumba et al. 1995) and from mice (Hamano et al. 1993) or of IL-6 concentrations in human saliva (Grisius et al. 1997). The importance of these findings remains unknown because these study designs used homogenized glands and saliva that had cytokine contributions from multiple sources (i.e., acinar cells, intralobular lymphocytes, interlobular lymphoid nodules, and serum).
In this study we demonstrated a surprising decrease in intracellular IL-6, specifically in parotid acinar cells from aging NOD mice. This result is interesting in light of two recent reports showing that recombinant mouse IL-6 suppresses both IL-1- and TNF-α-induced apoptosis in a cultured epithelial cell line (Schindler et al. 1990). Moreover, IL-6 has been shown to rescue resting T-cells from apoptosis in vitro in the absence of other cytokines, possibly by maintenance or induction of Bcl-2 expression (Teague et al. 1997). Therefore, decreasing concentrations of IL-6 may intensify the small but highly significant increase of IL-1 β in aging NOD mice. In contrast to NOD mice, the rise in intra-acinar cell IL-6 in normal BALB/c mice may block the effect(s) of a parallel rise in IL-1β.
An important contribution of this work was the estimation of cytokine quantities in individual mouse parotid acinar cells. We used a fluorescence assay to determine total DNA concentration for each cell preparation and ELISA assays to determine total cellular cytokines per milliliter of buffer. By using published values of DNA in rodent salivary gland acinar cells, we calculated the intracellular quantities of IL-1β, IL-6, and TNF-α. This approach has not been previously reported, to the best of our knowledge, but should be particularly valuable for cytokine determinations from glandular cells, which typically are difficult to separate from one another. Determination of cytoplasmic quantities of cytokines will be useful in testing recently proposed intracellular mechanisms of cytokine modulation of cell death pathways (Friedlander et al. 1996; Maniatis 1997).
At the heart of our hypothesis is the idea that parotid acinar cells are important producers of the inflammatory cytokines that modulate their health and disease. We have now determined that mouse parotid acinar cells represent an independent source of abnormally expressed IL-6 and IL-1β in sialoadenitis-prone animals. By mapping characteristic alterations in specific pro-inflammatory cytokines from salivary gland acinar cells, we ultimately hope to identity the particular micorenvironmental conditions that predispose the salivary gland to lymphocyte infiltration and acinar cell destruction. Ongoing studies of the intracellular signal pathways that control age-associated alterations in cytokine production by sialoadenitis-prone parotid acinar cells should help to clarify the role of inflammatory cytokine processing in the pathogenesis of Sjögren's syndrome.
Footnotes
Acknowledgments
Supported by USPHS grants DE-10059 (GRL), DE12358 (GRL), DE10335 (DTW), and DE08680 (DTW).