
Abstract
Cyanine 5.18 (or Cy5) is a fluorochrome emitting in the long-red/far-red range, usually regarded as unsuitable for direct observation by the human eye. We describe here the optimization of a direct visualization approach to Cy5 labeling, based on a standard fluorescence microscope with mercury light excitation and applicable to both immunocytochemistry and fluorescent in situ hybridization. Crucial factors were (a) an excitation path in the microscope not absorbing light in the orange-red range, up to 640 nm, (b) a 588-640-nm excitation filter range, distinctly below the excitation optimum for Cy5, (c) a 650-700-nm emission filter range, transmitting the low-wavelength portion of Cy5 emission, and (d) high-efficiency filter set components allowing a narrow gap between excitation and emission ranges without visible cross-talk of excitation light in the emission path.
Keywords
I
Although the human eye can detect light in the emission range of Cy5, its sensitivity in the long-red/ far-red range is low (Lennie et al. 1993). Therefore, Cy5 has generally been regarded as unsuitable for direct visualization and observation (Brelje et al. 1993; Cullander 1994) and is commonly detected using charge-coupled device (CCD) cameras or similar equipment.
The availability of advanced optical coating technology, suitable for fine-tuning of rejection and transmission regions in interference filters (Marcus 1988; Reichman 1994), prompted us to address the possible use of Cy5 as a fluorochrome directly visible to the eye. On the basis of previous work on quadruple immunofluorescence (Ferri et al. 1997), our aim was to maximize visibility of Cy5 emission for use with both immunofluorescence and fluorescent in situ hybridization (FISH). Several specialized filter sets were designed and custom-made, resulting in a stepwise increase in visible Cy5 signal. We report here a comparative assessment of such filter sets, based on a combination of direct observation, photography, and CCD imaging.
Materials and Methods
Filter Set Specifications (Table 1)
Our first filter set for direct visualization of Cy5 (Set 1; Ferri et al. 1997) was aimed at transmitting low-wavelength emission of Cy5 from about 635 nm. Therefore, excitation was restricted to a 590-620-nm range. For Sets 2, 3, and 4, the upper limit of the excitation filter range and the lower limit of the emission filter range were shifted to about a 10-, 15-, and 20-nm longer wavelength, respectively. In view of the small Stokes' shift of Cy5 (see Figure 3), we aimed at bringing excitation and emission ranges as close to each other as possible. Therefore, we requested dichroic mirrors with a very steep transition between rejection and transmission regions for Sets 4 and 5. Filter Sets 1-5 were custom-made by Chroma (Brattleboro, VT). On a request for similar specifications (about 590-635-nm excitation, 650 to 700-750-nm emission, with excitation and emission ranges as close as possible), Omega (Brattleboro, VT) kindly supplied an experimental filter set for comparison (Set 6).
Filter set components a
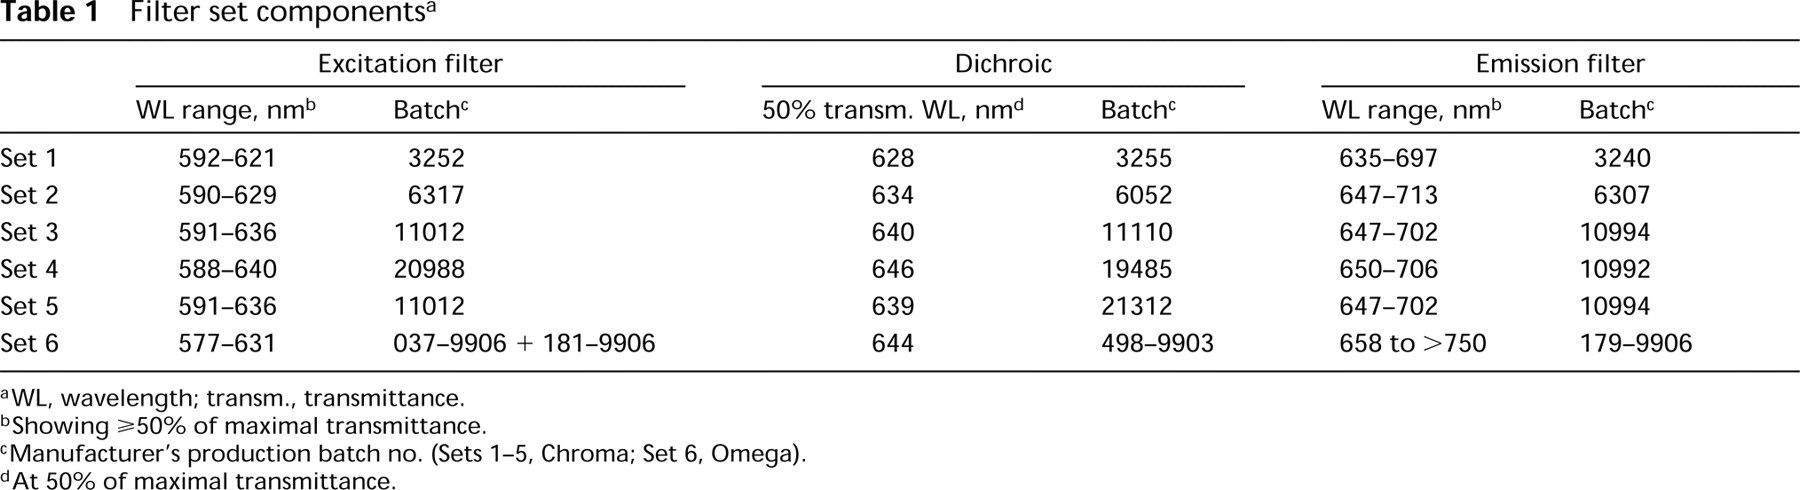
WL, wavelength; transm., transmittance.
Showing ≥50% of maximal transmittance.
Manufacturer's production batch no. (Sets 1-5, Chroma; Set 6, Omega).
At 50% of maximal transmittance.
Characterization of Filter Sets and Their Components
Complete excitation and emission pathways were assessed as described previously (Ferri et al. 1995b). Monochromatic light (350-750 nm) was projected onto the excitation filter and measured after 90° reflection by the dichroic mirror (Figure 1A), using a spectrofluorometer (Fluorolog-2; Spex Industries, Metuchen, NJ). Absorbance was measured through the combined dichroic (at 45°) and emission filter (Figure 1B) using a spectrophotometer (Lambda 9; Perkin-Elmer, Langen, Germany). Absorption spectra were also obtained for each set component. Upper and lower limits of filter ranges were indicated as the wavelength at half-maximal transmission.
Spectral Tests with Cy5
A cuvette filled with Cy5 antibody or avidin conjugate (see below) diluted in PBS was used as sample. Monochromatic light (560-645 nm) was projected through the excitation filter and the dichroic mirror onto the sample, and emission was collected after dichroic and emission filtering for photometry (at 660 nm: Figure 1D, Fluorolog-2 as above). Standard excitation and emission spectra of Cy5 conjugates were obtained for comparison.
Tissues and Immunofluorescence Experiments
Pituitaries and spinal ganglia (porcine and bovine, from a local abattoir) were fixed in either 4% paraformaldehyde or periodate-lysine-paraformaldehyde (McLean and Nakane 1974) and cryosectioned (at 4-10 μm). Primary antisera/ antibodies (from sheep, monkey, rabbit, guinea pig, or mouse) were against human β-LH and neuroendocrine protein VGF (Ferri et al. 1995a), rat CGRP (Affiniti; Mamhead, UK), bovine prolactin (Berger et al. 1988), neurofilament protein (SM 311; Affiniti), rat GH (NIDDK AFP411S), ACTH (NIDDK AFP39013082), S-100 protein (Chemicon; Temecula, CA), and rat TSH (NIDDK AFP3035990P). Species-specific donkey/horse secondary antibodies were conjugated with either Cy5 (Jackson Immunoresearch; West Grove, PA), or biotin (Jackson; or Vector, Burlingame, CA). Where appropriate, a third incubation included an avidin-streptavidin-Cy5 conjugate (Jackson). Single-staining preparations were also revealed using lissamine-rhodamine-, XRITC-, and Texas Red-avidin conjugates (Molecular Probes, Eugene, OR; or Vector). Quadruple immunofluorescence (Ferri et al. 1997) was carried out using secondary antibodies conjugated with AMCA, FITC (or Cy2), Cy3, and Cy5 (from Jackson, Vector; or Rockland, Gilbertsville, PA). Primary antisera/antibodies were diluted (1:400-1:4000, or 1-5 μg/ ml for monoclonals; overnight incubation) in PBS containing 3% normal horse/donkey serum, 3% normal serum of the species being immunostained (porcine or bovine), and 0.02% NaN3. Secondary antibodies were diluted in the same medium (10-20 μg/ml, or 1-5 μg/ml for Cy3 conjugates; 1-2-hr incubation); avidin conjugates were diluted in PBS (with 0.1% bovine serum albumin 10-20 μg/ml, or 1-5 μg/ ml for Cy3 conjugates; 1-2-hr incubation). Routine controls included substitution of each antiserum/antibody or conjugate, in turn, with PBS. Slides were coverslipped with PBS-glycerol (50 + 50%).
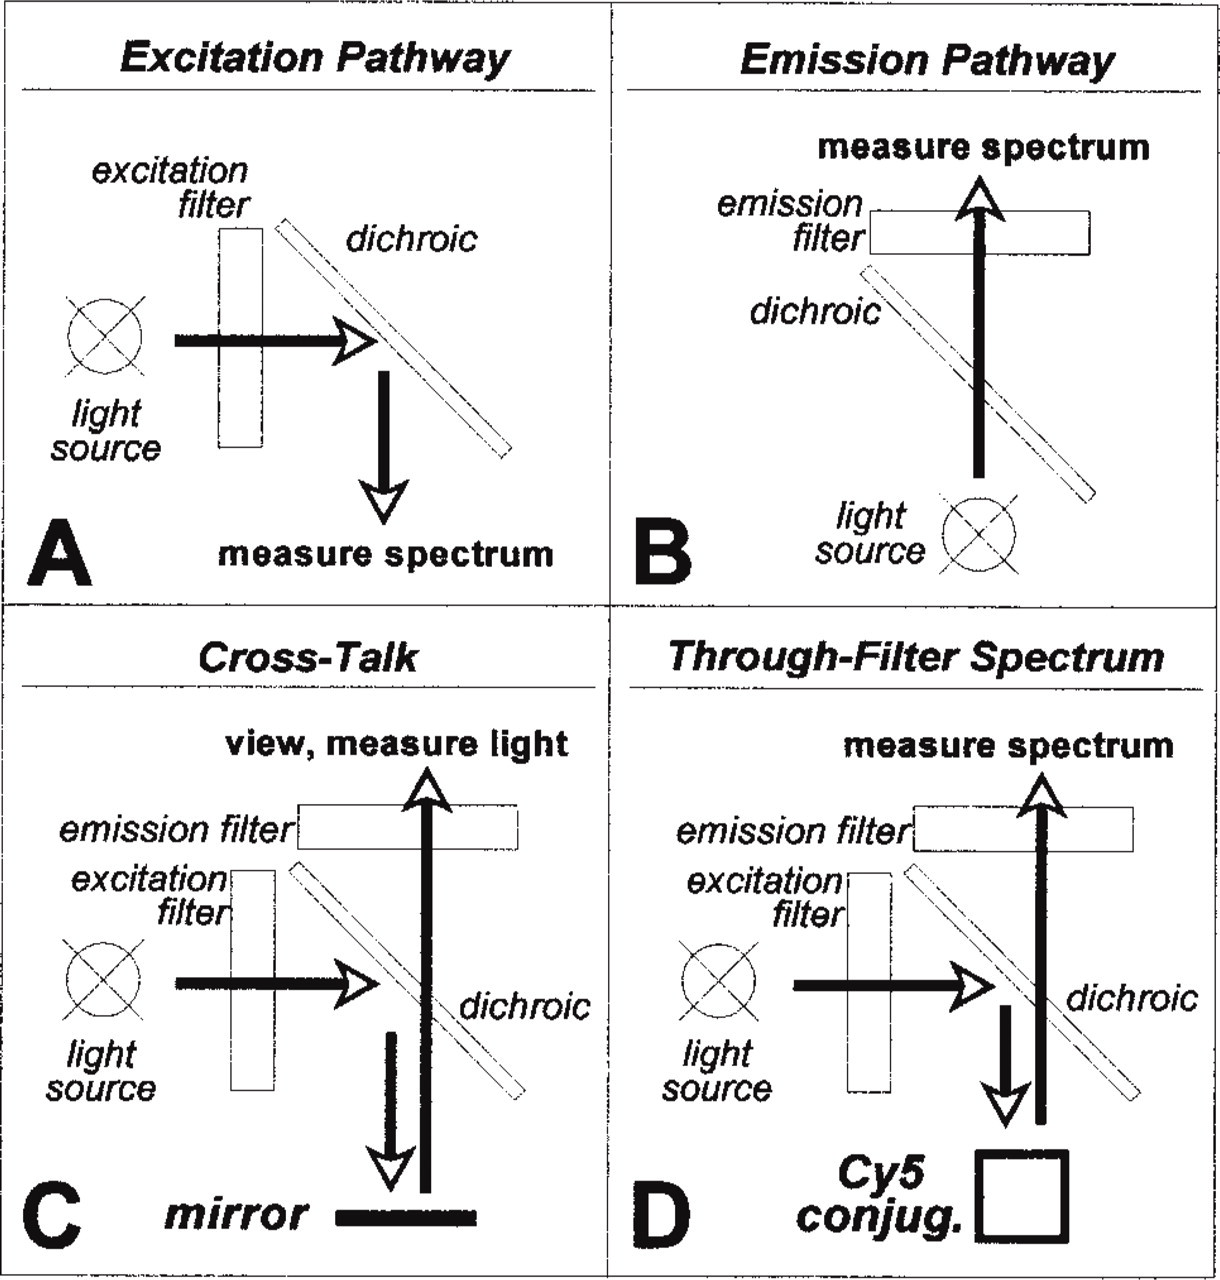
(A-D) Filter set characterization and testing, as described in detail in Materials and Methods.
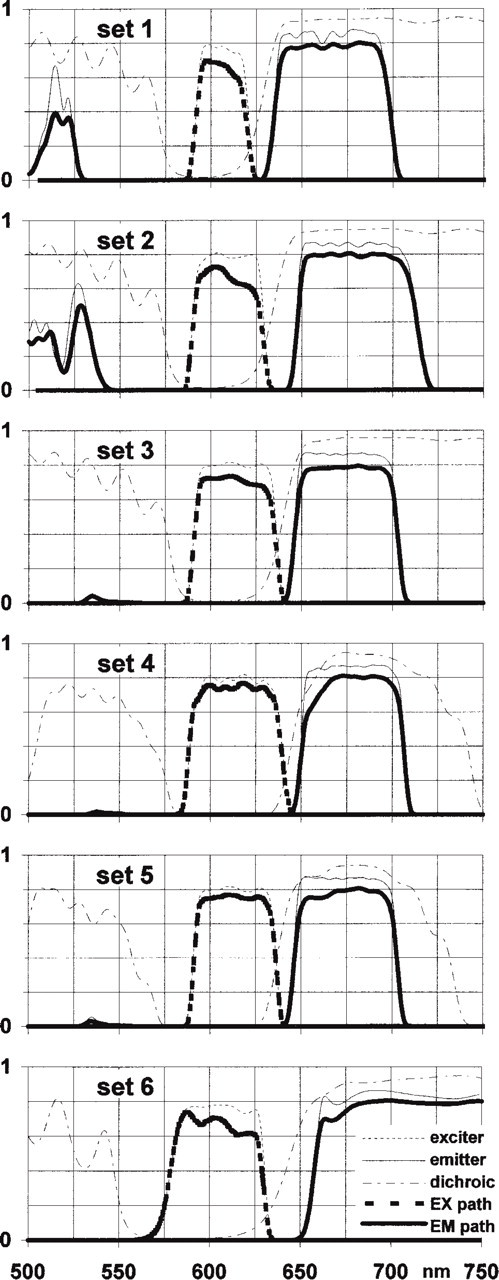
Characterization of filter sets: efficiency of complete excitation and emission path (thick lines “EX path” and “EM path,” respectively) and absorption spectra of components (thin lines excitation filter, dichroic mirror, emission filter). Note differences in excitation and emission ranges and the variable gaps between these. Data are expressed as output/input light intensity ratio.
Fluorescent In Situ Hybridization
Lymphocytes were prepared from PHA-stimulated peripheral blood according to a standard cytogenetic protocol (Bridger et al. 1998) and were fixed with methanol-acetic acid (3:1, 10 min). Preparations were denatured in 70% formamide (2 min, 68C), dehydrated through graded ethanols, and air-dried. For chromosome painting hybridizations, a biotin-labeled chromosome 1-specific probe, and an FITC-labeled chromosome 2-specific probe (Cambio; Cambridge, UK) were mixed (2
Fluorescence Microscopy and Photography
Slides were observed with BX-60 and BX-50 microscopes (Olympus Italia; Milan, Italy). These were equipped with 100-W high-pressure mercury lamps (HBO-103 from Osram, S. Giuliano Milanese, Italy; or 102D from Ushio, Tokyo, Japan), a collector lens with mirror [either achromatic-aplanatic “A” type or UV-transmissive “B” type, from Olympus; with or without their standard heat filter(s)], an accessory “conversion lens” (Olympus) aimed at maximizing excitation light, and a range of apochromatic objectives (
Direct Observation Tests
Signal intensity (of Cy5 and other fluorochromes) and excitation-emission cross-talk (see below) visible through Sets 1-6 were assessed subjectively. The 0-10 subjective score used was intended to provide a relative within-test estimate of overall visual effectiveness. Therefore, score values for signal and for cross-talk were not comparable. To compensate for possible (although apparently low) fading during observation, the same fields were observed using the different filter sets in varying sequential order.
Depending on the degree to which excitation wavelengths are suppressed by the dichroic mirror and emission filter, unwanted excitation light may become visible through the emission path as excitation-emission cross-talk. To maximize detection of such cross-talk, if any, a mirror was used in place of the preparation (Figure 1C). Whereas slide and coverslip surfaces reflect roughly 7% of the excitation light, the test mirror used had high reflectivity (>97%). Cross-talk was also assessed quantitatively using the exposure meter of the PM30 photographic system.
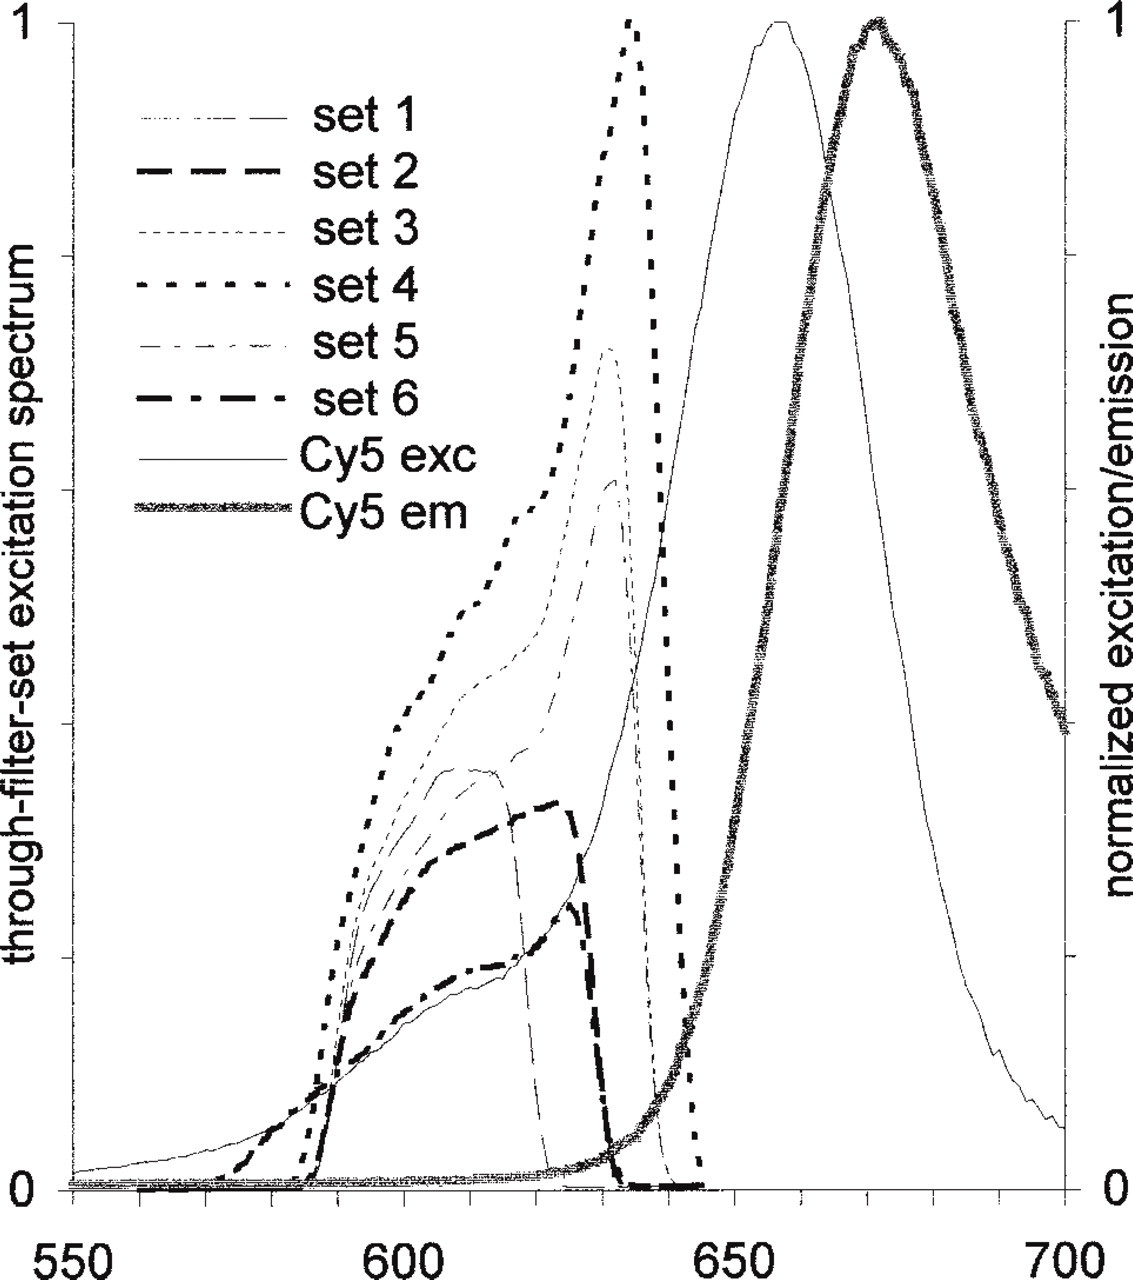
Excitation spectra of Cy5 conjugate obtained through each filter set (see Figure 1D), measuring emission at 660 nm. Standard excitation and emission spectra of Cy5 conjugate are provided for comparison (“Cy5 exc” and “Cy5 em,” respectively). Note rapidly increasing efficiency when excitation extends above 620 nm, parallel to ascending slope of Cy5 excitation probability. Avidin conjugate solution in PBS; data normalized to highest value.
CCD Camera Tests
FISH and immunofluorescence preparations were captured using a high-sensitivity VarioCam CCD camera (PCO Computer Optics; Kelheim, Germany). Excitation-emission crosstalk tests were also carried out using a mirror (as above) and further increasing sensitivity with a prolonged acquisition time (6 sec vs 0.6 sec, which was appropriate for imaging).
Results
Filter Set Characterization
Excitation filter, emission filter, and dichroic used for each set are listed in Table 1. Differences in excitation path and emission path ranges (Figure 2, thick lines, vs excitation filters, emission filters, and dichroics, thin lines) can be summarized as follows: (a) progressively increasing upper limit of excitation, Sets 1, 2, 6, 3, 5, 4; (b) progressively increasing lower limit of emission, Sets 1, 3, 5, 2, 4, 6. In addition, for Set 6 excitation extended down to 577 nm (about 10 nm lower than other sets), and the emission filter showed a longpass profile extending to the infrared range. For the “very steep” dichroic 4, the rejection (reflection) region extended almost to the upper limit of the corresponding excitation filter range (Figure 2; approximately 8% transmittance at 638 nm).
Spectral Tests with Cy5
As expected, a steep ascending slope above 620 nm was apparent parallel to the ascending slope in Cy5 excitation (Figure 3). Significant differences in excitation efficiency were revealed, superimposable for avidin (Figure 3) and antibody conjugates (not shown). Sets 4, 3, and 5 (in decreasing order) proved most effective.
Microscope
Of the two collector lenses tested, the “A” type provided more consistent illumination of the microscopic field for excitation of Cy5 (orange-red light) and of the other fluorochromes tested (UV to green light). The accessory conversion lens significantly increased the amount of excitation light and was used for all tests. Removal of heat filters mounted along the collector lens resulted in significantly brighter signal. Further testing was therefore carried out with no heat filter, with no apparent problem. Although most excitation filters tested included an infrared blocking treatment, CCD camera capture and exposure metering revealed potential problems when such blocking was insufficient (Set 6; see below).
Direct Observation Tests
All filter sets tested permitted direct visualization of Cy5 labeling, which was seen as deep red signal over a very dark background for both immunostained and FISH preparations. Medium-high-power objectives (X20-100) were most effective, lower magnification resulting in little visible signal. Brighter images were shown with higher numerical aperture objectives, such as Olympus PlanApo X40 (NA 0.95) vs UPlanApo X40 (NA 0.85). Naturally, in multiple staining visible signal intensity with Cy5 was well below that of Cy3, FITC, or Cy2.
However, autofluorescence was exceedingly low with Cy5 labeling; therefore, the signal/noise ratio was distinctly high. Cy5 FISH labeling with both centromeric and chromosome painting probes resulted in bright visible signal against a virtually black background. Because of the low, virtually absent background, nuclei or interphase chromosomes were best located on the slide using a DAPI filter set (or an FITC set, where relevant) before switching to the Cy5 filter set.
For all preparations, distinct differences in visible signal intensity were observed, Sets 4, 3, and 5 (in decreasing order) being distinctly more effective than other sets (Table 2). Best results were seen when the upper limit of excitation was close to 640 nm and the lower limit of emission around 650 nm (Set 4). Even under the severe testing conditions used, visible excitation-emission cross-talk was minimal for most sets (Table 2). Exposure metering revealed insufficient infrared blocking of Set 6 (see Table 2).
Tests with Other Fluorochromes
In multiple- and/or single-staining preparations, AMCA, FITC, Cy2, Cy3, lissamine-rhodamine, XRITC, and Texas Red labeling resulted in bright signal when viewed through the appropriate filter set. No signal was seen for AMCA, FITC, Cy2, or Cy3 through Cy5 Sets 1 to 5 (Table 2). These were designed with a low-wavelength excitation limit around 588-590 nm. Conversely, Cy3 labeling was clearly visible through Set 6, in connection with its lower excitation limit at 577 nm. As expected, lissamine-rhodamine, XRITC, and Texas Red showed visible signal through all Cy5 filter sets tested.
Direct observation tests
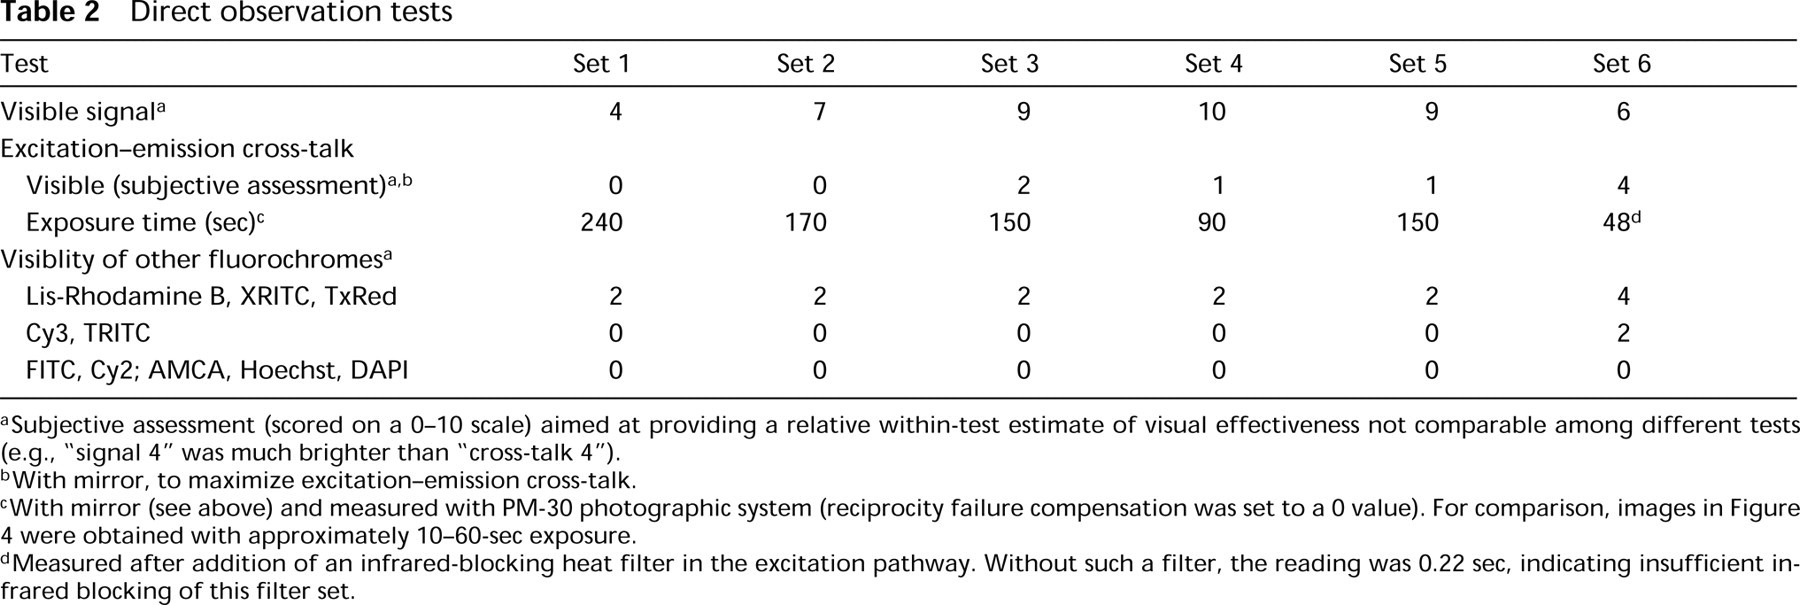
Subjective assessment (scored on a 0-10 scale) aimed at providing a relative within-test estimate of visual effectiveness not comparable among different tests (e.g., “signal 4” was much brighter than “cross-talk 4”).
With mirror, to maximize excitation-emission cross-talk.
With mirror (see above) and measured with PM-30 photographic system (reciprocity failure compensation was set to a 0 value). For comparison, images in Figure 4 were obtained with approximately 10-60-sec exposure.
Measured after addition of an infrared-blocking heat filter in the excitation pathway. Without such a filter, the reading was 0.22 sec, indicating insufficient infrared blocking of this filter set.
Photography
In preliminary tests (with filter Sets 1 and 2), black-white negative films required prolonged exposure with Cy5 (ISO 12 setting vs nominal ISO 400 for T-Max 400; ISO 100 vs nominal ISO 200 for the infrared-extended film SFX). Under the same conditions, color transparency films showed high sensitivity (exposure index around ISO 300 and 1000 vs nominal ISO 100 and 400 for E-100SW and Provia 400, respectively); therefore, these were used for all tests.
Photography showed differences that were less obvious but essentially similar to those resulting from direct observation tests. Sets 3, 5 and 4 resulted in bright photographic images. Longer emission ranges resulted in slightly (Set 4) and distinctly (Set 6) dimmer images, indicative of rapidly decreasing film sensitivity around the 640-650-nm range and above.
CCD Camera Tests
Parallel direct and CCD camera observation through the same filters sets proved very effective, signal being bright with sets 4, 3, and 5 (in decreasing order; Figure 4). Even under demanding test conditions (mirror plus tenfold overexposure), images captured through Sets 1-5 revealed no excitation-emission cross-talk. Set 6 showed a bright, diffuse background light (Figure 4, bottom right panel), which disappeared after addition of an infrared-blocking heat filter in the excitation path.
Discussion
Specific optimization of excitation and emission ranges, as described here, resulted in a distinct increase in visible Cy5 signal over our previous filter design (Ferri et al. 1997) while retaining a very high signal-noise ratio. Removal of orange-red nontransmissive heat filters, which are often included as standard in the excitation path of epifluorescence microscopes, resulted in further significant signal enhancement. Such improvements were immediately applicable to both immunocytochemistry and FISH, for direct observation and photography and for parallel CCD camera imaging. Furthermore, complete separation from other fluorochromes used in multiple labeling was fully maintained, i.e., Cy3 (or TRITC) and lower-wavelength emitters.
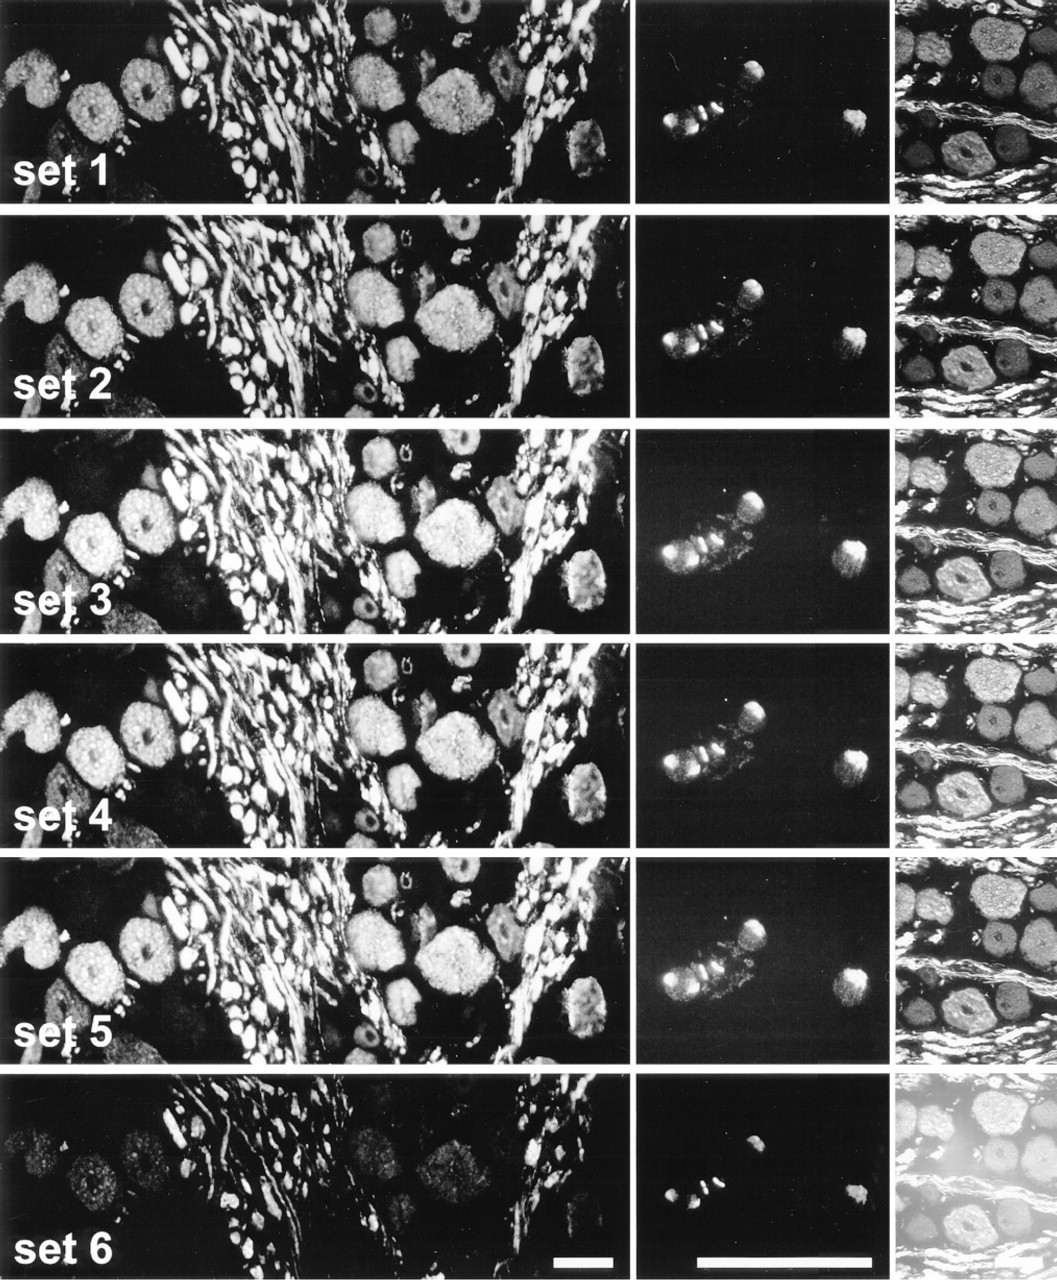
Photography (left and middle panels) and CCD imaging (right), showing Cy5-immunofluorescence (left and right panels) and Cy5 FISH (middle). Under identical conditions, a distinctly higher signal was obtained using filter Sets 3, 4, and 5. For Set 4, signal was slightly lower in photography (left and middle panels) but slightly more intense with CCD imaging (right). Filter Set 6 gave low signal in photography (left and middle panels), whereas signal was bright with CCD imaging (right) despite the “foggy” appearence due to diffuse, unblocked infrared. Cy5 immunofluorescence for neurofilament protein, pig spinal ganglion (left and right panels); and chromosome 1-painting FISH (middle). Identical exposure conditions for each vertical series, optimized for Set 4; color transparency film E100-SW. Bars = 50 μm.
Cy5 conjugates show excitation and emission maxima around 655 and 670 nm, respectively (Brelje et al. 1993; and this report), but the sensitivity of the human eye decreases rapidly above 630-640 nm (Lennie et al. 1993). Filter sets for direct visualization of Cy5 therefore imply a suboptimal excitation range to accommodate comparatively low-wavelength Cy5 emission, which is more suitable for eye visualization. The excitation ranges we designed largely correspond to the rapidly ascending portion of the Cy5 excitation spectrum, resulting in critical issues that were sorted out empirically. Overall, a 588-640-nm excitation filter range (Set 4) produced the best visible signal. The extended rejection (reflection) region of dichroic 4, almost fully superimposing the mentioned excitation filter range, provided some contribution to the high excitation efficiency observed with this set. In principle, even higher excitation wavelengths might be used, but the resulting shift in emission range would bring us to wavelengths at which visual effectiveness became low (Set 6). On the low-wavelength side, additional excitation light in the 577-588-nm range was of little value, and its exclusion effectively prevented Cy3/ TRITC visualization.
Spectral transmission in the microscope's elements was considered, because excitation above 590 nm is not commonly used. Optics in the microscope illuminator can be expected to be transmissive up to the near-infrared range, Olympus optics (BX series) showing approximately 90% transmittance up to 700 nm (A. Hirohashi, personal communication). Differences in collector lens correction have been mentioned, lower chromatic aberration resulting in more even illumination. Because the commonly used mercury arc lamps show low intensity above 590 nm, any additional lens aimed at collecting more light for excitation, such as the additional conversion lens we used, provides a useful contribution. Alternative light sources, such as xenon lamps, may provide brighter excitation light in the orange-red range but are significantly more expensive. Heat filters well suited to many fluorochromes (e.g., AMCA, DAPI, FITC, Cy2, Cy3, Texas Red) may significantly block orange-red light. Therefore, all fluorescence work in our laboratory during the past several years has been carried out using microscopes devoid of heat filters, with no apparent shortcomings. Certain applications, such as the use of living cell preparations, polarizer filters, or infrared-absorbing elements, require properly designed heat filters (fully transmissive up to 640 nm). Finally, high numerical aperture planapochromatic objectives proved highly effective for direct visualization of both Cy5 fluorescence and multicolor fluorescence. Their multiple wavelength optical correction will be especially helpful for multiple-exposure photography with blue, green, yellow-orange, and long-red/far-red emitters.
In photography, the (slightly) lower signal with Set 4 vs Sets 3 and 5, and the poor outcome with Set 6, may be explained by a rapidly decreasing color film sensitivity in the long-red range, especially above 650 nm. Therefore, the 650-700-nm emission range (Set 4) is probably a good compromise for parallel use in direct observation and photography. From a practical point of view, color transparency film proved well-suited to the present approach and is routinely used in our laboratory. When black-white photography is required, hypersensitized Technical Pan film may be an alternative (Smith 1986).
Normal-intensity FISH (as for standard CCD camera imaging) and immunofluorescence labeled with Cy5 resulted in very bright CCD images with the direct observation filter sets described, suggesting that in many systems the same filters can be used for direct observation in parallel to CCD capture. Working concentrations of antibodies and conjugates for Cy5 fluorescence were optimized for direct eye observation. Therefore, it is reassuring that an excellent signal/ noise ratio was also observed with CCD camera viewing. With more powerful light sources, such as lasers, it may be necessary to use higher dilutions. Most importantly, optimization for visible signal resulted in no excitation-emission cross-talk, even under demanding test conditions. In FISH preparations, both centromeric and chromosome painting probes showed very clearly, to both the human eye and photographic film, against a virtually black background, and the usually problematic fixative-related autofluorescence was negligible. Detailed tests with intrisically dimmer and smaller locus-specific P1 and PAC probes were beyond the scope of the present study. In multicolor FISH, locus-specific probes are ideally revealed using FITC and/or Cy3 labeling, wheras Cy5 is of use for reference probes (usually centromere probes). For the highest possible detection sensitivity, different filter sets, optimized on Cy5 excitation and emission maxima, can be combined with CCD camera imaging.
In multiple immunofluoresence, Cy5 can be used as an additional visible label (Ferri et al. 1997) very effectively separated from Cy3 (or comparable yellow-orange emitters) as well as from green (e.g., FITC, Cy2) and blue emitters (e.g., AMCA, Cascade Blue). In this respect, setting the low wavelength limit of excitation at 588-590 nm was essential to separate Cy5 from Cy3, TRITC, and similar fluorochromes. Orange-red-emitting fluorochromes, such as lissaminerhodamine, XRITC, and Texas Red, are visible to various extents through Cy5 filter sets optimized for direct eye visualization, as described here. This is especially true when a mercury excitation light source is used, because the low amount of orange-red light available would need to be further restricted to prevent excitation of the latter fluorochromes. A narrowband excitation light source (e.g., a laser) might permit such spectral separation even under conditions compatible with a direct visual approach.
In conclusion, using the set-up described here, Cy5 can be used as an effective visible fluorochrome, alone or in combination with others in multiple labeling. The described filter sets are particularly useful because they work well for photography and CCD-based imaging and also allow direct examination of samples by eye. A distinct advantage lies in the (generally) very low cell and tissue autoflorescence in the Cy5 wavelength range, as well as in the better tissue penetration and limited scattering of the comparatively long-wavelength excitation light required (Cullander 1994).
Footnotes
Acknowledgments
Supported in part by the Italian Ministry of University and Research (local Research Grants), Italian National Research Council (CNR), and Austrian Science Fund (P13652-GEN).
We thank the National Hormone and Pituitary Program, NIDDK, NICHHD, and USDA for providing antisera, and Olympus Italy for letting us use a VarioCam CCD camera. G-LF conceived and carried out the study, analyzed the data, and wrote the paper; JI provided FISH preparations; PB provided antibodies for staining and multiple staining; GG provided expertise and concrete cooperation with spectral testing.