
Abstract
The opioid crisis is a pressing issue with implications for the treatment of chronic pain, addiction, and criminal justice responses to substance use. This paper examines associations between prescription opioid dispensing rates and drug-related arrest rates using data from the Centers for Disease Control and the Uniform Crime Reporting System for the years 2009–2020. Fixed effects Poisson regression models are estimated to assess arrest-related outcomes. Findings suggest a positive association between opioid dispensing rates and arrest rates for possession and sale of synthetic narcotics, but a negative association with arrest rates for possession of heroin and cocaine. Future research should continue to assess measures of crime with consideration of opioid prescribing practices and policies. Policy implications include evaluation of criminal justice responses to substance use, and how diversion might be used in place of sanctions to offer treatment to those struggling with substance use disorders.
Introduction
Opioids are a class of drugs that include legal substances, such as pharmaceutical opioids like oxycodone and hydrocodone, as well as illicit substances like heroin and fentanyl (National Institute on Drug Abuse, 2024). In 2021, over 75% of fatal overdoses were opioid-related, and the number of overdose deaths attributed to opioids was ten times the number in 1999 (Hedegaard et al., 2021; Spencer et al., 2024). Recently, there has been a sharp increase in deaths attributed to fentanyl – a highly potent and lethal synthetic opioid (Volkow, 2021). While heroin and fentanyl have been especially deadly in recent years, the role of pharmaceutical opioids and the impacts of both overprescribing and limiting access to these substances is still a crucial area of study. County-level opioid dispensing rates are associated with higher rates of harmful opioid use, dependance, and frequency of use, which demonstrates the importance of continued study of the dispensing of opioid prescriptions (El Ibrahimi et al., 2023; Vuolo & Kelly, 2022). Prior research has focused strongly on associations between prescribing rates and overdose mortality, and while overdose mortality is an important and informative measure, there are other phenomena, such as arrests, that are indicative of problematic substance use that ought to be studied. These measures are important as they provide findings about the experiences of those living with substance use dependency, which mortality rates do not adequately capture.
Arrest rates can demonstrate increasing visibility of substance use and distribution of these substances, and how law enforcement responds to this (Deiana & Giua, 2021; Jewett et al., 2023; Ray et al., 2023). Arrest is typically the first stage of criminal justice system involvement and prompts interaction between police and vulnerable populations (Jewett et al., 2023; Ray et al., 2023; Shachar et al., 2020). By understanding associations between opioid dispensing rates and drug-related arrest rates, we can better understand how police respond to changes in opioid access and patterns of use. In doing so, more facets of the opioid crisis besides overdose mortality can be elucidated. Winkelman et al. (2018) found that those who use opioids are significantly more likely to have had contact with the criminal justice system within the past year, and intensity of opioid use and criminal justice involvement were significantly related. Opioid dispensing contributes to the available supply of addictive substances, which could be related to higher arrest rates for both sale and possession of these substances. Alternatively, the availability of pharmaceutical opioids might decrease demand within illicit markets because those who are dependent on opioids are able to access them through licit rather than illicit markets (Mallatt, 2022; Martin et al., 2018). This decreased activity within illicit markets may lead to lower drug-related arrest rates. Examining opioid dispensing and arrest rates provides important insight into the experiences of those who use opioids that goes beyond fatal overdose rates.
The current study examines two research questions. (1) Are opioid dispensing rates associated with arrest rates for drug possession? (2) Are opioid dispensing rates associated with arrest rates for drug sale/manufacturing? Three categories of drug arrests are assessed for both possession and sale/manufacturing - any drug, heroin/cocaine, and synthetic narcotics. I assess these questions at the county-level between 2009 and 2020 using data from the Center for Disease Control (CDC), the Uniform Crime Reporting System (UCR), the U.S. Department of Agriculture (USDA) and the American Community Survey (ACS) and estimate Poisson fixed effects regression models. This study captures an important time period of the opioid epidemic that was characterized by restrictive prescribing policies, decreases in prescription dispensing rates, and upticks in fentanyl-related mortality (Deiana & Giua, 2021; Hadland & Beletsky, 2018; Kolodny et al., 2015). The results have important implications for research on connections between opioids and crime and speak to important links between the opioid epidemic, public health practices, and drug-related crime.
Methods
Measures
Dependent Variable
Drug-Related Arrest Rates
The outcome variable of interest was county-level arrest rates for drug possession and sale/manufacturing between 2009 and 2020. These data came from the Uniform Crime Reporting System (UCR), which compiles data from over 18,000 law enforcement agencies (FBI, 2021; Kaplan, 2021). Due to concerns regarding the accuracy of county-level data (Maltz & Targonski, 2002), yearly county-level estimates of arrest rates were calculated by aggregating agency-level data at the county-level and converting these estimates to per capita rates. The UCR provides measures specific to arrests for the sale and possession of heroin/cocaine (both drugs are included in a single measure) as well as synthetic narcotics. They were selected because heroin is a type of opioid, and prior research has suggested spillover effects on heroin use when prescription opioids are restricted (Lee et al., 2021). The UCR defines synthetic narcotics as manufactured narcotics, such as methadone, Demerol, or fentanyl, that have similar addictive properties as traditional narcotics. Their list includes examples of highly potent synthetic narcotics like fentanyl as well as pharmaceutical opioids that are commonly prescribed, such as Oxycontin and Vicodin. The synthetic narcotics measures were selected because of the proliferation of fentanyl-related overdose mortality, particularly for those suffering from opioid use disorder (Volkow, 2021). In addition to the two categories of heroin/cocaine and synthetic narcotics, the “all drugs” category for both sale and possession arrests was included as well. The “all drugs” arrest measures were included to examine broad impacts on drug-related arrests, which includes any illicit substance that police can makes arrests for the sale and possession of.
In sum, six arrest-related variables are included in the current study – possession of heroin/cocaine, synthetic narcotics, and all drugs, as well as sale/manufacturing of heroin/cocaine, synthetic narcotics, and all drugs. These data are provided as count variables, which were converted to per capita rates using the county population data provided by the UCR (FBI, 2021). 1
Independent Variable
Opioid Dispensing Rate
Descriptive Statistics.
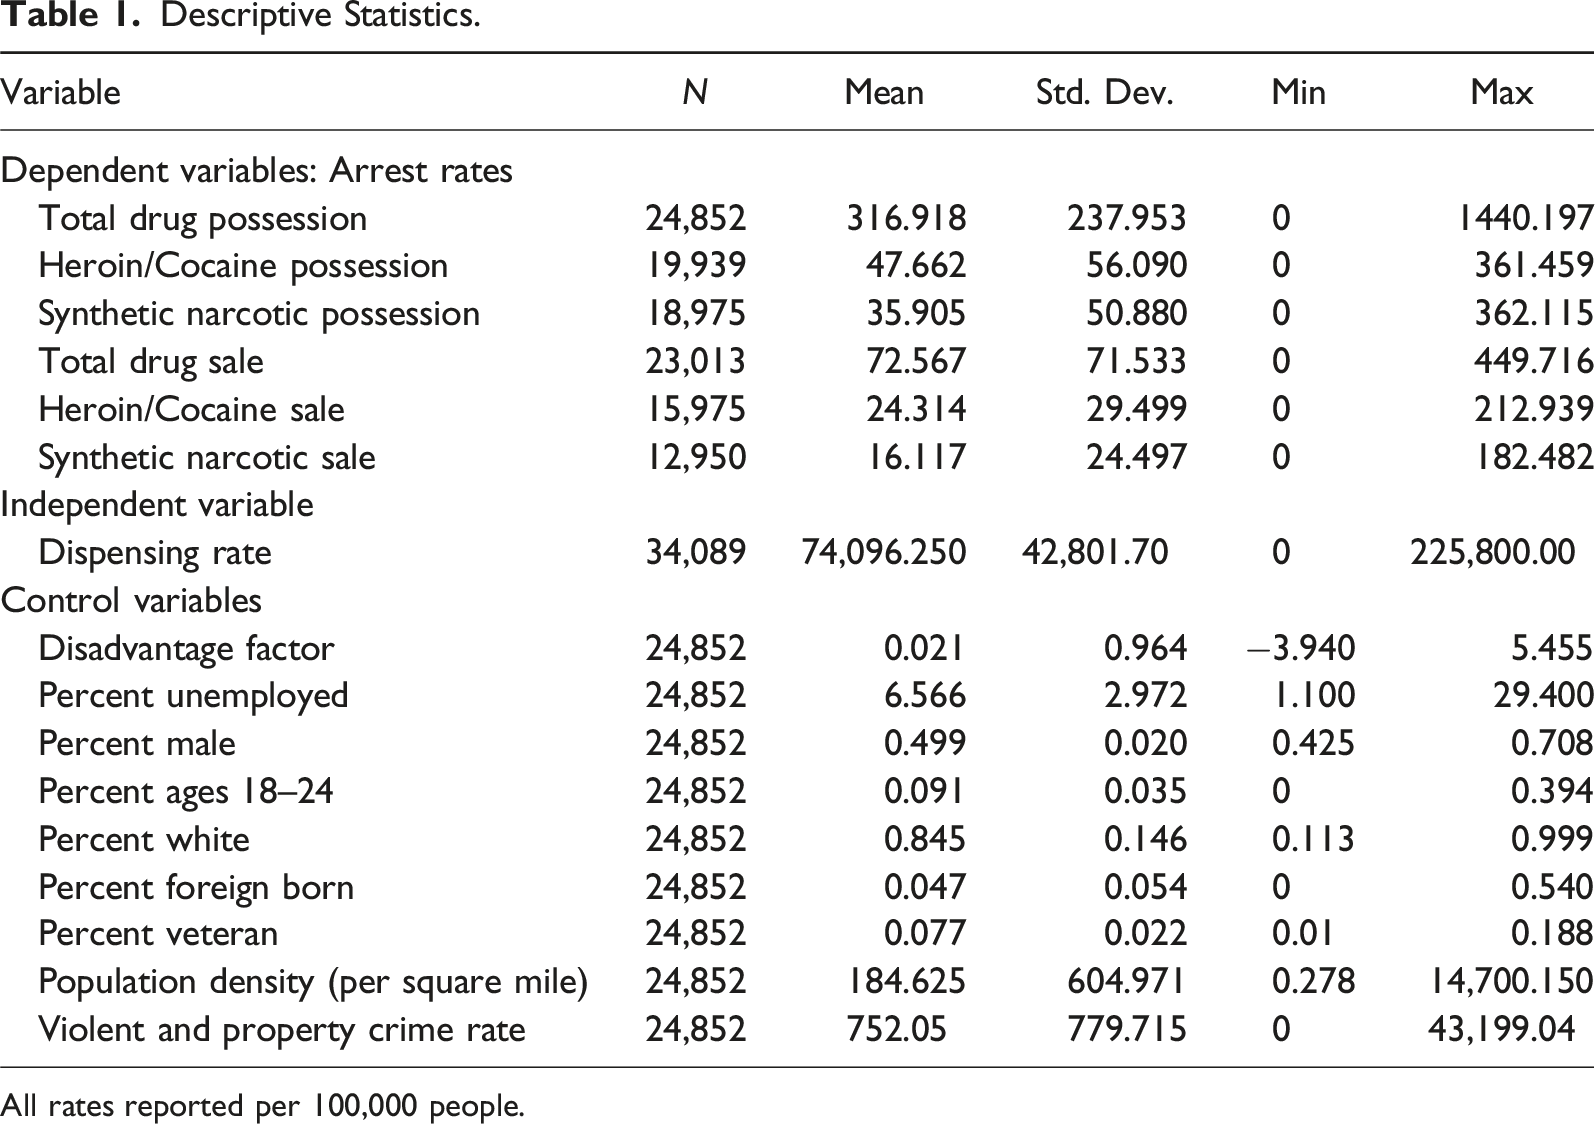
All rates reported per 100,000 people.
Control Variables
The majority of the control variables were obtained through the Social Explorer resource, which provides county-level demographic data that come from sources such as the American Community Survey (ACS), the United States Census Bureau, the FBI, and the UCR. Data on measures of disadvantage (median household income, median gross rent, per capita income, and unemployment), population density, and demographics (age, sex, race, veteran, and foreign-born composition) come from five-year estimates from the ACS (U.S. Census Bureau, 2022). The data on the percentage of adults in each county with less than a high school diploma and the percentage of people in poverty come from the U.S. Department of Agriculture (USDA, 2021). These data were available for 2009 and 2017, and values for each county were held constant between 2009–2016 and 2017–2020 2 .
Disadvantage
A disadvantage index was created based on the percentage of adults in each county with less than a high school diploma, the percentage of people in poverty, the median household income, the median gross rent, and per capita income, which is the total income of an area averaged over the entire population. The disadvantage index was created using principal components factor analysis (Eigenvalue = 3.603, factor loadings > .762, alpha = .900). The inclusion of this index is motivated by disparities in access to treatment for substance use disorders across counties based on socioeconomic status (Berkowitz et al., 2015). Furthermore, policing practices vary across communities of different socioeconomic statuses (Panditharatne et al., 2021).
Unemployment
Unemployment was operationalized as the percentage of people unemployed in each county. This measure served as an additional indicator of disadvantage given that unemployed people are not necessarily in poverty and may have other income sources outside of employment, such as through other people in their household.
Sex Composition
Sex composition was operationalized as the percentage of the population that is male in each county. Harmful opioid use has historically been higher among males, but this gap is narrowing (McHugh, 2020). The likelihood of arrest and the likelihood of testing positive for specific drugs also varies between males and females (Weller et al., 2023).
Age Composition
Criminal behavior dramatically declines by early adulthood and thus the percentage of adults in each county that is between ages 18–24 was controlled for (Farrington, 1986). Research also shows there are significant age differences in harmful opioid use patterns, and the risk of arrest is much higher for the 18–24 age group compared to other age groups (Park & Wu, 2020; Prendergast et al., 2010).
Racial Composition
This measure captured the percentage of the population that is white. Longitudinal data indicates that opioid use is higher among white people compared to Black, Hispanic, and Asian people (Schuler et al., 2021). White people also have greater access to prescription opioids, which has contributed to their higher rates of opioid use disorder (Hansen & Netherland, 2016).
Veteran Composition
The percentage of people in each county who are veterans was controlled for because this population is at risk for both physical and mental health concerns, making exposure to opioids particularly concerning for this population (Leonard Westgate et al., 2015; Seal et al., 2009). Some literature also suggests a higher risk of incarceration for veterans compared to their non-veteran counterparts, which is an important consideration in research on arrest rates (Edwards et al., 2022; Greenberg & Rosenheck, 2011).
Foreign Born Composition
The percentage of people born outside of the U.S. was controlled for. Foreign-born populations often report different experiences with police compared to their native-born counterparts (Davis & Hendricks, 2007; Hummel, 2016). This population also has unique experience in the American healthcare system, which is an important consideration for research on opioid dispensing (Adigun et al., 2021).
Violent and Property Crime Rates
Data on total violent and property crime rates comes from the Social Explorer resource, which extracts data from both the UCR and FBI (FBI, 2020). This measure was included to determine whether changes in drug-related arrests were a function of changes in arrests overall. Data was available from 2010 to 2019. To address the missing data for 2009 and 2020, the total violent and property crime rate in 2009 was held constant from the 2010 data, and the rate in 2020 was held constant from the 2019 data 3 . Sensitivity analyses estimated results for 2010–2019, and the results were the same as those for 2009–2020.
Population Density
Population density was included and operationalized as the number of people per square mile in each county (United States Census Bureau, 2022). This measure has been linked to differences in policing, responses to substance use, and informal social controls between densely and less densely populated areas (Battin & Crowl, 2017; Keyes et al., 2014).
Analytic Strategy
The analytic strategy had three main components. First, descriptive statistics and distributions were reported in tables and examined. Table 1 presents the descriptive statistics for all independent, dependent, and control variables. None of the control variables were highly correlated, so autocorrelation was not a concern (see Appendix A).
Second, fixed effects Poisson models were estimated. Poisson regression is suitable for analyzing outcome variables that are count outcomes that can be viewed as changes in rates over time (Osgood, 2017). The fixed effects estimator accounts for relatively stable unobserved heterogeneity that may exist across counties. County-level dispensing rates vary systematically based on political party and regional variation, which makes comparing across counties difficult. For example, there is variation in state-level opioid prescribing restrictions that directly impacts dispensing rates at the county-level (Davis & Lieberman, 2021). The fixed effects estimator treats each county as its own control and estimates the relationship between the changes in dispensing rates and the changes in drug-related arrests. Arrest rates vary depending on the season, prescribing trends overtime, and major shifts that have occurred over the last several decades. To account for time trends, year indicators were included in every model. To ensure outliers did not significantly influence the results, the top 1% of values for both the independent and dependent variables were excluded from the analysis.
Third, several sensitivity analyses were conducted. Because some agencies reported less than 12 months of data, Poisson regression models were estimated with adjusted arrest rates based on the number of months reported (see Ansari & He, 2017), excluding those that reported less than 4 months from the analysis (see Appendix B). 4 Fixed effects negative binomial models were also estimated for all outcomes to account for overdispersion, and results are similar (see Appendix C). 5 Models were also estimated using one year lagged dispensing rates to assess any delayed relationship between dispensing rates and drug-related arrests. Results are substantively similar to the models presented in the main analyses (see Appendix D).
Results
Opioid Dispensing Rates and Possession Arrest Rates
Poisson Models Estimating Possession Arrest Rates.
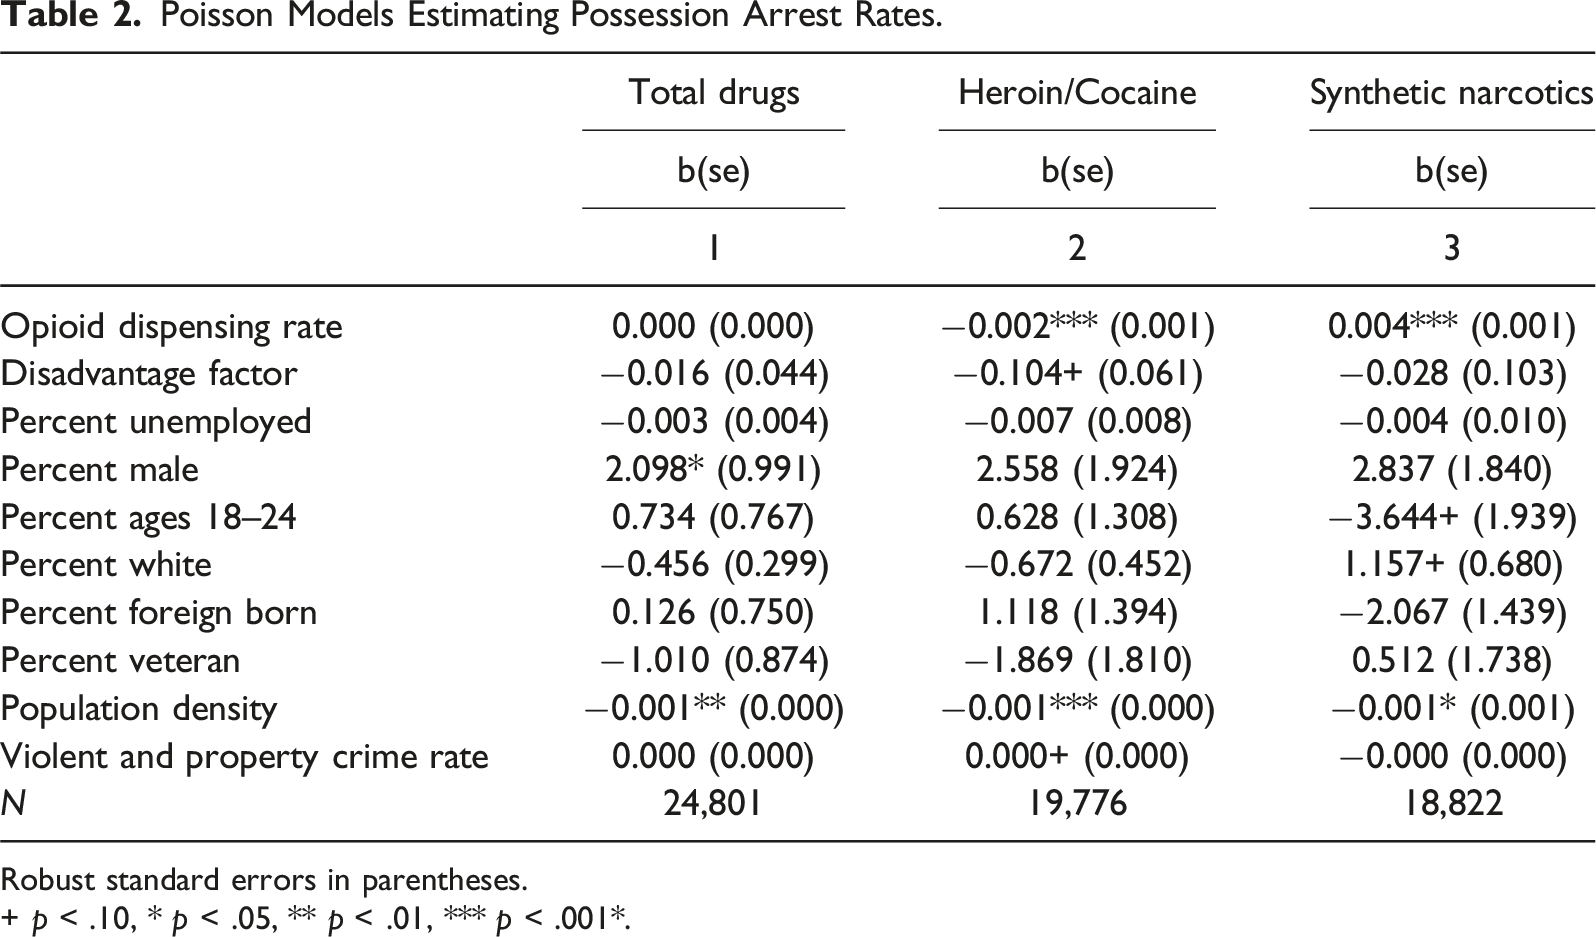
Robust standard errors in parentheses.
+ p < .10, * p < .05, ** p < .01, *** p < .001*.
Poisson Models Estimating Sale/Manufacturing Arrest Rates.
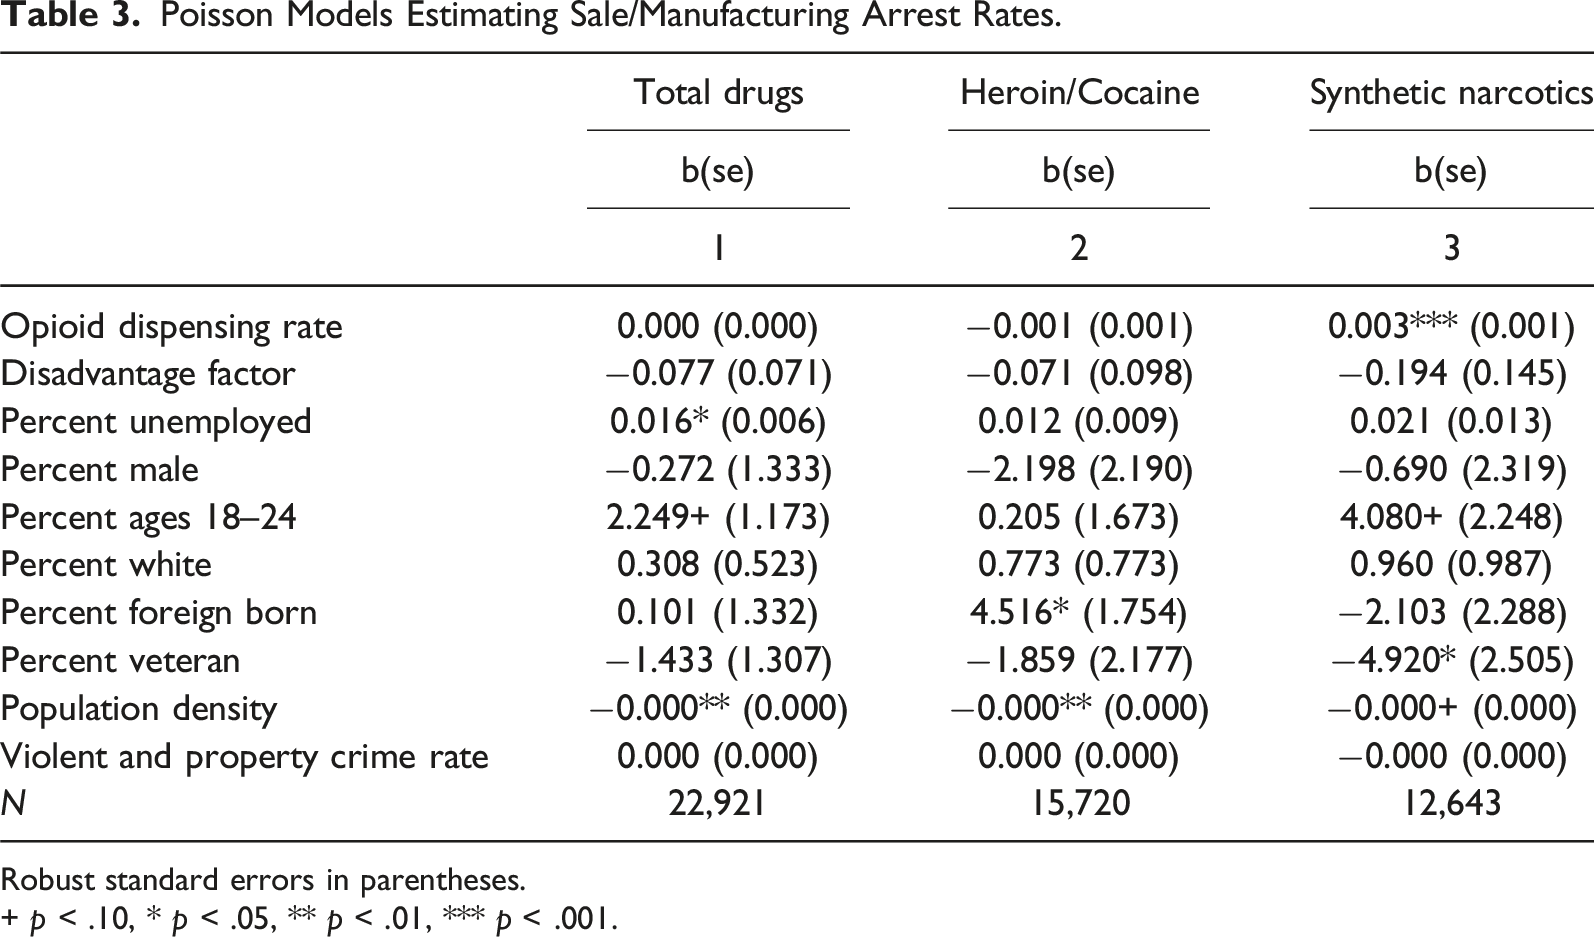
Robust standard errors in parentheses.
+ p < .10, * p < .05, ** p < .01, *** p < .001.
Model 2 predicts heroin/cocaine possession rates. The relationship between the opioid dispensing rate and heroin/cocaine possession arrest rates is negative and significant (b = −.002, p < .001), suggesting that a one unit increase in the opioid dispensing rate (one additional opioid prescription per 100 people in a county) is associated with a .002 decrease in per capita arrest rates for possession of heroin/cocaine. This finding suggests a substitution effect whereby people who lose access to prescription opioids may substitute with other substances. Population density also had a negative association with arrest rates for heroin/cocaine possession (b = −.001, p < .001), suggesting that a one unit increase in population density is associated with a .001 decrease in arrest rates for heroin/cocaine.
Model 3 presents the results for arrest for possession of synthetic narcotics. Interestingly, unlike heroin/cocaine possession arrest rates, there is a positive relationship between the opioid dispensing rate and arrests for synthetic narcotic possession (b = .003, p < .001). That is, a one unit within county increase in opioid dispensing rates is related to a .004 within county increase in arrest rates for synthetic narcotic possession. Population density was also negatively associated with arrest rates for possession of synthetic narcotics, similar to the results of models 1 and 2 (b = −.001, p < .01).
In sum, results from Table 2 suggest that increases in opioid prescribing are associated with within-county decreases in arrest rates for heroin/cocaine possession and within-county increases in arrest rates for synthetic narcotic possession, controlling for disadvantage and demographic factors. For possession arrests, increases in percentage of males in a county tends to be associated with increases in arrest rates (only for total drug possession) and increases in population density were associated with reductions in arrest rates in all three groups of possession arrests.
Opioid Dispensing Rates and Sale/Manufacturing Arrest Rates
Table 3 presents the results for arrests for total drug sale, heroin/cocaine sale, and synthetic narcotic sale. Model 3 suggests that increases in dispensing rates were associated with increases in rates of arrest for sale of synthetic narcotics, indicating a potential amplifying effect of strong opioid prescribing (b = .003, p < .001). While there was no significant relationship between dispensing rates and total drug sale arrest rates, model 1 suggests that the unemployment rate is positively associated with total drug sale arrest rates (b = .016, p < .05). Similar to the results of Table 2, models 1 and 2 in Table 3 revealed a negative association between population density and arrest rates, and model 3 revealed a marginal negative association. Therefore, every model that included population density indicated that increases in population density were associated with within county decreases in arrest rates for both sale and possession of any drug, controlling for all other variables.
Discussion
The current study tested whether there is a relationship between opioid dispensing rates and drug-related arrest rates at the county-level using yearly fixed effects. This study is motivated by the lack of research on associations between opioid dispensing and specific kinds of drug-related arrest rates. These findings expand on prior research that has suggested that problematic opioid use is associated with outcomes such as opioid-related crime and emergency department visits (Chen et al., 2022; Deiana & Giua, 2021). The current study makes unique contributions to the literature because drug-related arrest rates capture phenomena related to policing responses to substance use, unintended consequences of opioid prescribing policies and practices, and the marginalization of people experiencing addiction. By examining county-level opioid dispensing rates and possession and sale arrest rates between 2009 and 2020, I capture a time frame in which the opioid crisis has seen major shifts in prescribing and overdose rates, criminal justice responses to the crisis, and the proliferation of dangerous substances like fentanyl (Guy et al., 2019; Hedegaard et al., 2021; Volkow, 2021).
The findings contribute to the literature on the opioid epidemic by expanding the understanding of connections between legal and illegal markets for opioids. On one hand, the inverse relationship between opioid dispensing and arrest rates for possession of heroin/cocaine suggests a potential substitution effect (Kolodny et al., 2015; Reuter et al., 2021). This extends findings from prior literature which finds restrictive opioid prescribing policies are associated with substitution for other substances (Hadland & Beletsky, 2018; Manchikanti et al., 2018). This is particularly concerning because withdrawal symptoms from opioids can be extremely painful and difficult to treat (Pergolizzi et al., 2020; Radcliffe & Parkes, 2013). If opioid dispensing rates in the U.S. continue to decrease, it will be important to understand potential unintended consequences (El Ibrahimi et al., 2023; Hadland & Beletsky, 2018). Prior research has investigated the impact of policies such as state-level restrictions on prescribing and prescription drug monitoring programs (PDMPs) (e.g., Deiana & Giua, 2021; Lee et al., 2021; Pacula & Powell, 2018) and future research should continue to assess these policies with specific attention on opioid dispensing rates.
On the other hand, there is some evidence of a positive relationship between opioid dispensing and arrest rates for both possession and sale/manufacturing of synthetic narcotics. These findings provide suggestive evidence of diversion of prescription opioids into illicit markets, and the positive relationships for both possession and sale/manufacturing suggest that police are focused on both the supply and demand aspects of this issue. Prior literature has found a positive association between opioid dispensing rates and property crime rates (Giles & Malcolm, 2021), and this research provides commentary on drug specific arrests. An important future direction is whether arrest rates influence opioid-related overdose rates. This would expand knowledge of connections between police drug interventions and public health, which is crucial to understanding how police contact affects individuals experiencing addiction (Deiana & Giua, 2021; Jewett et al., 2023; Ray et al., 2023). Future research should also investigate if continued decreases in opioid dispensing will lead to the proliferation of novel substances, increased prevalence of counterfeit prescription opioids, or higher overdose mortality from potent substances such as fentanyl, which is something both researchers and law enforcement officials have expressed great concern about (Hadland & Beletsky, 2018; Manchikanti et al., 2018; Pergolizzi et al., 2020).
The results of this study should be interpreted in light of several limitations. First, participation in the UCR is not nationally mandated; however, many states require law enforcement to provide data. Nonetheless, some counties are missing from the analysis and interpretation of the findings should be limited to counties in the analyses. Second, the UCR lists many substances within their categories for drug-related arrests. Heroin and cocaine are grouped together as one measure, and the synthetic narcotics category includes substances such as methadone, Demerol, fentanyl, and pharmaceutical opioids. Future research could link dispensing rates with arrests using the National Incident-Based Reporting System (NIBRS), which contains details about each single crime incident. The analysis in the current study utilized UCR data due to inconsistent coverage of counties in NIBRS, particularly in earlier years. Finally, there is a potential for spuriousness and the omitted variable bias. While the within county estimation reduces unobserved heterogeneity and a number of time varying covariates are accounted for, additional factors such as prevalence of manual labor jobs, prior prescribing trends, and presence of pain management clinics could be considered in future analyses, although data on these measures is limited. In this same vein, the data cannot speak to which drugs are prioritized by law enforcement, which could shape arrest statistics. Despite these limitations, this study provides an important assessment of associations between opioid prescribing practices, policing responses to substance use, and changes over time.
There are several policy implications of these findings. First, it is important to consider the potential distribution of prescription opioids in illicit markets when creating prescribing policies. Prescribing guidelines outlined by the CDC should be followed, and excessive prescribing should be avoided in order to ensure the well-being of both the patient and other members of the community (Howard et al., 2018; Morris et al., 2019; Weisberg et al., 2014). Second, the findings suggest a potential substitution effect in which people substitute prescription opioids for illicit substances when access to prescription opioids is restricted, and the expansion of medication-assisted treatment could potentially help those experiencing substance dependance and withdrawal (Homer & Wakeland, 2021; Meyers et al., 2025). Finally, the results suggest connections between opioid dispensing and interactions between police and people experiencing addiction, demonstrating the importance of expanding harm reduction practices in the criminal justice system, such as requiring police to carry naloxone, offering treatment as an alternative to incarceration, and offering medication assisted treatment in incarceration settings (Caulkins et al., 2021; Winkelman et al., 2018). This is especially important when considering that forced detoxification is common in correctional settings, and only .8% of correctional institutions in the U.S. offer medication-assisted treatment (Giftos & Tesema, 2018).
Conclusion
The opioid crisis is a pressing and dynamic issue that has led to hundreds of thousands of overdose-related deaths as well as incarceration of those experiencing addiction. While prescribing rates have significantly decreased in recent years, the effects of prescribing opioids for chronic pain that began in the 1990s are still apparent today. Even as prescribing rates decrease, there may still be unintended consequences regarding the supply and demand of opioids within illicit markets. When researchers uncover these unintended consequences, policymakers are better equipped to put structures and systems in place that address components of the opioid crisis that are not as visible or widely discussed as other components. Understanding as many facets of the opioid crisis as possible is the first step in attempting to implement innovative solutions that minimize harm and maximize care and treatment options for people struggling with addiction.
Supplemental Material
Supplemental Material - From Pain Management to Street Crime: A County-Level Analysis of Opioid Dispensing Rates and Drug-Related Arrest Rates
Supplemental Material for From Pain Management to Street Crime: A County-Level Analysis of Opioid Dispensing Rates and Drug-Related Arrest Rates by Anna Newell in Journal of Drug Issues
Footnotes
Declaration of Conflicting Interests
The author declared no potential conflicts of interest with respect to the research, authorship, and/or publication of this article.
Funding
The author received no financial support for the research, authorship, and/or publication of this article.
Data Availability Statement
All data are publicly available and cited in the references section. Concatenated data and code are available upon request.
Supplemental Material
Supplemental material for this article is available online.
Notes
Author Biography
References
Supplementary Material
Please find the following supplemental material available below.
For Open Access articles published under a Creative Commons License, all supplemental material carries the same license as the article it is associated with.
For non-Open Access articles published, all supplemental material carries a non-exclusive license, and permission requests for re-use of supplemental material or any part of supplemental material shall be sent directly to the copyright owner as specified in the copyright notice associated with the article.