
Abstract
Although intended to avoid illicit drug use, national laws and international conventions have limited research on psychoactive drugs. To characterise the evolution of the literature on psychoactive drugs, a bibliometric study of 15 psychoactive drugs from 1960 to 2018 was conducted in which 956,703 academic publications were obtained from Web of Science. Growth patterns were analysed per drug type, legal status and country. Our results show the existence of heterogeneous patterns of growth for the publications of different psychoactive drugs. Strikingly, the literature on legal substances and depressants represented between 60% and 80% throughout the years. We found unexpected regional differences in the scientific output about the selected drugs, which might be explained by cultural and political phenomena. Governments and funding bodies should consider these results when allocating resources to research on psychoactive drugs to optimise the therapeutic applications of these compounds and our understanding of the nervous system.
Introduction
Trading and consuming psychoactive drugs are activities controlled under national laws and international conventions. When these activities involve compounds like alcohol or caffeine, they are deemed legal, subject to specific market and trade regulations in line with other goods. However, when these activities involve compounds such as LSD or cocaine, often referred to as ‘controlled substances’, they are considered illegal. These laws aim to reduce their availability, due to their perceived societal and individual harm. However, the way in which psychoactive substances are policed is poorly correlated with their harms (Nutt, King, & Phillips, 2010). This policing also has a number of opportunity costs, such as barriers to research on controlled substances (Reuter, 2009). This in turn leads to asymmetry in the amount of research performed on substances.
A) Classification of controlled substances in the United States of America as of July 2019. Drug schedules are a result of the Controlled Substances Act, enacted in 1970. Some substances have since then been added, removed, or transferred from one schedule to another. B) Classification of controlled substances in the United Kingdom as of July 2019. Drug classes are a result of the Misuse of Drugs Act, enacted in 1971. MDMA, 3,4-methylenedioxymethamphetamine; LSD, lysergic acid diethylamide & GHB, gamma-hydroxybutyrate.
Timeline of key socio-political events on controlled substances from 1960 to 2018. Abbreviations in figure: UN, United Nations; UK, United Kingdom and US, United States of America.
Individual countries and regions have modified the policies developed to enforce drug laws since they were established. However, the original laws have remained virtually unchanged at a global scale despite their political, social and scientific costs. Although drug laws do not explicitly ban research on these substances, they have limited the scope and impact of psychoactive substance research. When scientists attempt to study controlled substances, they face four main hurdles. Firstly, research on controlled substances requires a special licence. For instance, research on schedule I drugs in the UK requires a licence costing around £5000 for only 8 weeks duration. Secondly, controlled drugs can only be administered in licenced institutions of which there are only four in the UK (Nutt, 2015). Thirdly, the substances are not readily available, and they are expensive to obtain. For instance, psilocybin – only produced by one licenced pharmaceutical company in the UK, COMPASS Pathways PLC – is priced at £100,000 per 1 g (Johnson, Garcia-Romeu, Cosimano, & Griffiths, 2014). Fourthly, given the social stigma surrounding the topic, most research depends on private sources of funding, which are a very unreliable and unstable source of income (Rucker, 2015). These hurdles increase the financial burden and consume valuable research time, becoming increasingly challenging the more restrictive the category.
The number of papers published per year can be used as a proxy for the productivity and growth of a research topic over time (Bornmann and Mutz, 2015). Previous bibliometric studies on psychoactive substances have highlighted the impact of drug policies on their research (Akbar, Siddiq, & Nusrat, 2019; Bramness, Henriksen, Person, & Mann, 2014; Lawrence, Sharma, Griffiths, & Carhart-Harris, 2021; Zyoud, Waring, Al-Jabi, & Sweileh, 2017). These studies have highlighted regional differences in publications between the US and Europe (Bramness et al., 2014; Akbar et al., 2019; Lawrence et al., 2021) and have focused on addiction and dependence (Akbar et al., 2019), cocaine (Zyoud et al., 2017) and opioids (Bramness et al., 2014). However, the impact of historical and socio-political factors is hardly discussed when the results are put into context. Given the legislations and their changes in different countries over time, a bibliometric analysis that considers global and regional socio-political events would provide further insights into the impacts of these factors on publication trends of psychoactive substances.
Furthermore, given the categorical policing of drugs, comparing publication trends among different psychoactive substances could serve as an indicator of the asymmetric impact of drug laws on psychoactive drug research. Namely, substances classified under more restrictive categories might be less investigated, with the growth of their literature stagnating or even becoming negative. This could reveal the existing gaps in this field to inform future policies and funding strategies. Therefore, our study aims to compare the publication trends for different psychoactive substances.
To elaborate hypotheses about the impact of drug policies on psychoactive drug research, we used previous literature and our revision of socio-political events above (Figure 1). We hypothesised that publications on drugs classified into the most restrictive categories would show unstable patterns of growth and periods of decline. The growth of publications over time is defined by an exponential equation (Price, 1965). Thus, we expected this curve to fit poorly with an exponential equation for publications about drugs in restrictive categories. Similarly, for the literature of less or non-restricted drugs, the same curve would be explained well by exponential fitting. We expected drugs classified in the most restrictive categories to show low or negative growth in the 70s, 80s and 90s. Finally, we anticipated regional differences in the growth patterns and productivity.
Methods
A bibliometric study was conducted on the evolution of the scientific literature of 15 psychoactive drugs over 58 years (1960–2018).
Search Protocol
Keywords used to identify primary research articles by drug type. THC, tetrahydrocannabinol; GHB, gamma-hydroxybutyrate; MDMA, 3,4-methylenedioxymethamphetamine & LSD, lysergic acid diethylamide.
Data was extracted from the Web of Science Core Collection using a basic search within a custom year range and advanced analysis tools. The number of publications per year (WoS′ publication years analysis tool) and top contributing countries (WoS′ countries/regions analysis tool) were obtained. The procedure below was followed to retrieve the data for each drug: 1. After pilot searching, a series of topic keywords (Table 2) were determined in the following format: KEYWORD ‘OR’ KEYWORD ‘OR’ KEYWORD, etc. Using these keywords, a search was conducted for each drug (e.g. for alcohol: ETHANOL (topic) OR ALCOHOL (topic)). 2. The total number of papers of a given topic as well as the number of papers published in a topic by a given country were obtained using WoS′ analysis tools within the WoS′ database. 3. The WoS advanced search countries/regions tool was used to determine the top 5 contributing countries for each drug.
Selection criteria
The psychoactive drugs included in this study were selected according to two criteria. Firstly, we aimed to select at least one drug per drug schedule or class according to the legal classifications used in the US and UK as of July 2019. For the analysis, the classification (independent variable) remained fixed. Secondly, we cross-referenced our selection with the Drugs Wheel model (Adley, 2019), aiming to select at least two substances from each of its seven categories: cannabinoids, stimulants, empathogens, psychedelics, opioids, dissociatives and depressants (Table 2). Briefly, empathogens are psychoactive substances which increase empathy and connectedness to others.
The Drugs Wheel model provides a simplified classification of psychoactive drugs used recreationally based on their psychological effects. To assess similarities and differences between and within psychoactive drug categories, we aimed to select at least two substances from each category. To begin the selection process, 2 to 5 drugs per drug category were selected based on prevalence of use among different populations and their overall harm (Nutt et al., 2010). However, it was only possible to include one drug for the empathogen, cannabinoid and dissociative categories, primarily due to the lack of literature on drugs other than MDMA, cannabis and ketamine, respectively.
Datasets with a starting year after 1980 were excluded. Drug laws changed substantially during the 70s. Therefore, conclusions of the impact of drug laws on research could not be drawn without data previous to and during this period. Consequently, mephedrone, which was rediscovered and studied after 2003, was excluded. The same is true for mexedrone, which had little to no human use until 2015 (Mclaughlin et al., 2017).
The publications of the drugs that met the previous criteria were individually checked to exclude studies unrelated to the drug. Nitrous oxide (NO) and drugs belonging to the 2C-x psychedelic family (e.g. 2CB, 2CI and 2CE) were not included in the study as searches for these drugs resulted in an unmanageable number of papers completely unrelated to the drugs.
As a result of the inclusion and exclusion criteria described above, the psychoactive substances included in this bibliometric study are cannabis, alcohol, benzodiazepines, GHB, ketamine, MDMA, codeine, heroin, methadone, LSD, psilocybin, amphetamine, cocaine, khat and methamphetamine (Table 2).
Analysis
Curves on the number of publications per year were fitted to an exponential curve (equation (1)). The number of publications in a field has been shown to increase exponentially (Zhang, Quan, Xiao, & Du, 2019) and bibliometric studies typically use exponential fitting to describe the pattern of growth of publications in a topic (Aaen-Stockdale, 2017). The curve used in this study was defined as
Our main hypothesis was that stricter regulations on the trade and consumption of a drug would result in publications patterns which deviate from an exponential curve. Importantly, the free parameters, growth rate (r) and initial value of y at time 0 (a0) were computed for each drug independently. The resulting exponential equations were different for each substance. Therefore, our hypothesis focused on the fit to an exponential function, but not to the same exponential equation. To test this hypothesis, we compared the goodness of fit (R2) of the resulting exponential equations. We expected that the lesser the restrictions imposed over a drug, the higher the value of R2 and vice versa.
The Relative Growth Rate (RGR) was calculated per decade for all drugs, with the last value calculated over 8 years (2010–2018). RGR is a standardised measure of growth used in bibliometric research to assess productivity and growth of a given research field relative to time. It was calculated with the following equation
Results
Our search found a total of 956,703 academic publications from 1960 to 2018 which contained keywords for the 15 selected psychoactive drugs. Figure 2 shows the evolution of publishing productivity for each drug over time. During the 1960s, the number of published papers increased subtly but steadily for most drugs. During the 1970s, the growth of the number of published papers differed across drugs. Published papers on heroin, methadone and benzodiazepines increased steeply in the 70s (Figure 2c, j and m). Conversely, papers on LSD and psilocybin decreased during this decade and the decline lasted until the 90s (Figure 2b and d). The growth was subtle but steady for most other drugs. During the 1980s, published papers for most drugs kept growing steadily (Figure 2). Around 1990, there was a sudden increase in the publications on almost all drugs, matching with a surge in the papers indexed at Web of Science (Figure 2p) which has also been reported in other bibliometric studies (Glynn, Scutaru, Kerin, & Sweeney, 2010; Zyoud et al., 2017). During the 2000s and 2010s, the literature on most drugs increased rapidly. In these last two decades, there was a stagnation or decrease in the number of publications for research on drugs like MDMA and GHB (Figures 2a, g and l). Number of publications published per year (1960-2018) for 15 psychoactive substances (A-O). The x-axis represents time (years) and the y-axis represents the total number of publications for a given year. The solid line represents the number of papers published for each drug and the dotted line represents its exponential fit. The parameters of the fits can be found in Figure 3. The solid lines are coloured according to the schedule classification (July 2019) to which the drug belongs to.
To parametrise and compare the growth rate of publications for each drug, we fitted an exponential curve to publications per year for each drug (Figure 2). Parameters of the exponential fits can be found in Figure 3. Publications on psilocybin showed the highest growth rate, 0.17 (Figure 3a). The growth rate of the publications on all other drugs lied between 0.04 and 0.08. The rate of growth of publications in Web of Science was 0.04. This can be considered as a reference, and it ranked the lowest compared to the literature of the drugs selected in this study. Parameters from the exponential fits to the curves shown in Figure 2. A) Bar plot of the growth rate (r) of the publications for each drug. Drugs coloured and clustered by schedule as in Figure 2. Within each schedule cluster, they are ordered in descending order. B) Bar plot of the R2 obtained after fitting the exponential curves. Drugs coloured and clustered by schedule as in Figure 2. Within each schedule cluster, they are ordered in descending order.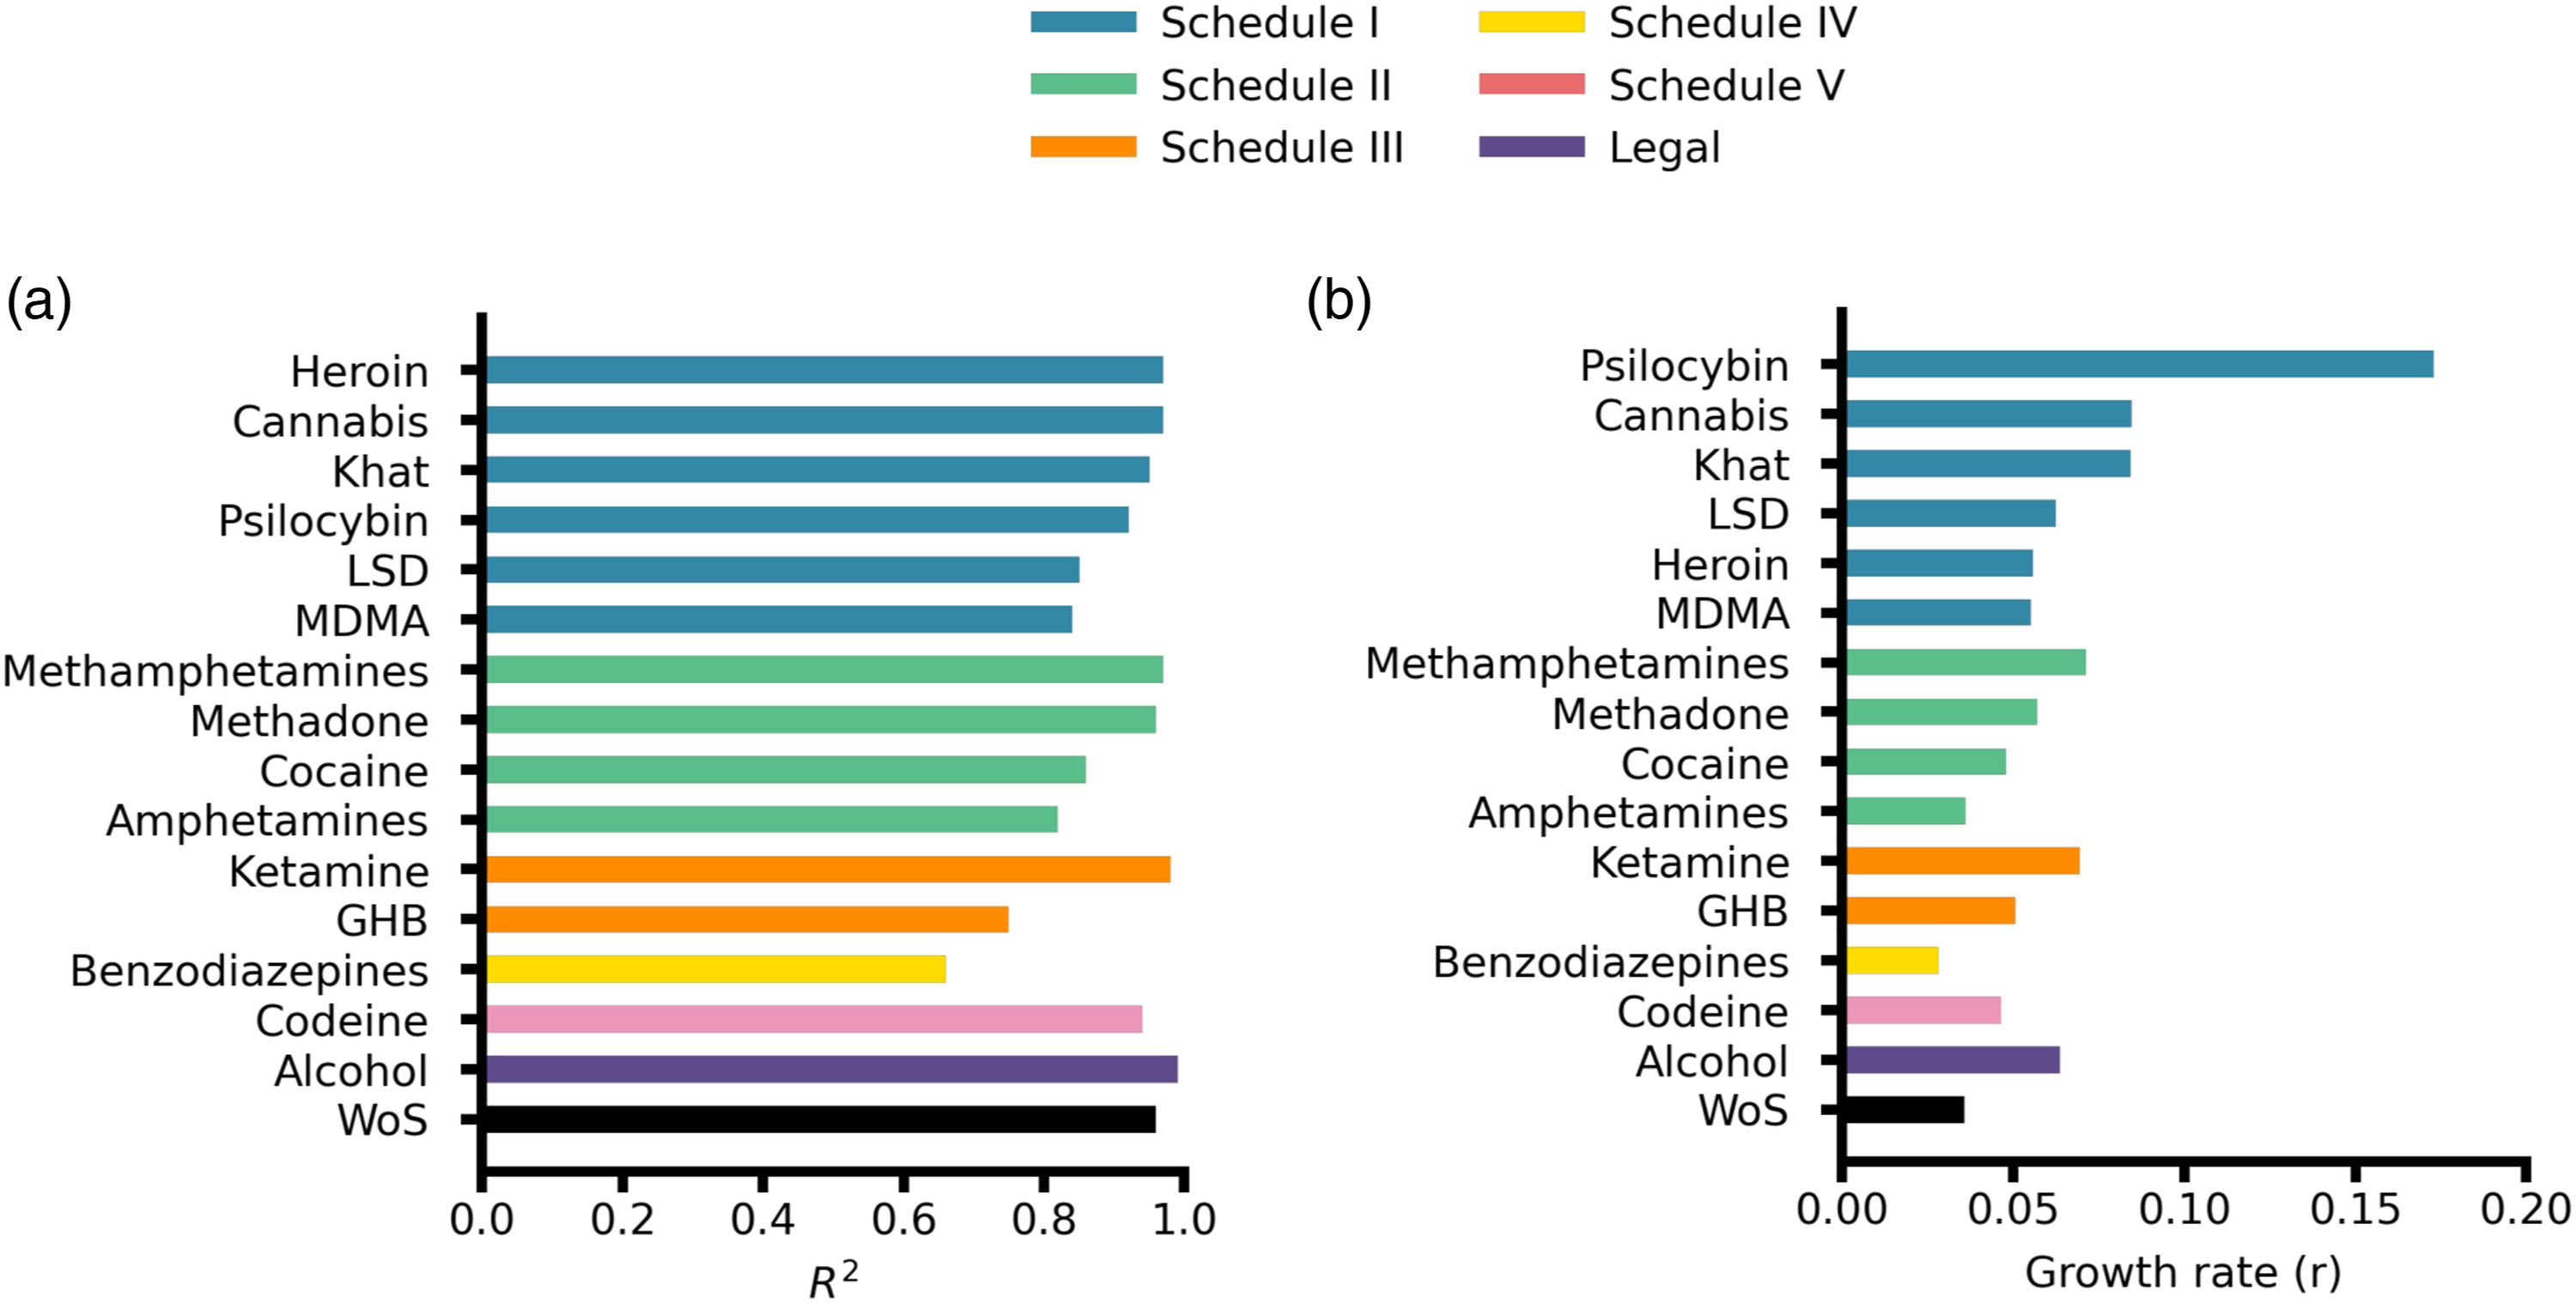
Regarding the goodness of fit (R2) of the exponential curves (Figure 3b), the curve for publications on alcohol had the best fit to an exponential curve, 0.99. Conversely, the publications on benzodiazepines had the poorest fit to an exponential curve, 0.66. The goodness of fit to an exponential curve for the growth of the Web of Science’s database was 0.96. Taken together, this analysis (Figures 2 and 3) shows different growth patterns for the publications of the studied drugs. However, our prediction that there would be a positive correlation between the restrictiveness of the laws for a particular drug and the goodness of fit (R2) of their number of papers per year to an exponential curve does not seem to hold. Nevertheless, further analyses were performed to interpret the different growth patterns observed.
To analyse the productivity and growth, we used the Relative Growth Rate (RGR) standardised measure. Figure 4 and 5 illustrates the evolution of the RGR for published papers in 10-year intervals, from 1960 to 2018. Alcohol, amphetamines, cannabis, ketamine, codeine and methadone showed positive RGR values over time, which means there was no decline in the productivity of the field during this period (Figure 4b–d, f and g). Conversely, there is at least one negative RGR value for khat, benzodiazepines, GHB, MDMA, heroin, LSD, psilocybin, cocaine and methamphetamines (Figure 4a–e). This means that there was a decline in productivity of publications in a decade. Most negative RGR values are found during the 70s and 80s. Relative growth rate (RGR) of psychoactive drug literature over time (1960-2018). X-axis represents time (decades) and Y-axis represents the RGR. Drugs are grouped and coloured by schedule with a maximum of 3 drugs per graph. Drugs are coloured by schedule as in Figure 2. Percentage of number of publications per drug, schedule and drug category relative to all selected drugs over time (1960-2018). The proportions were calculated as the ratio between the total papers published on a drug, schedule or drug category at a given year and the total number of papers for the 15 drugs in the same year. X-axis represents time (years) and Y-axis represents the percentage that the literature for each drug contributes to the total. A) Percentage of publications per drug from 50% to 100% for visualisation purposes. B) Percentage of publications per schedule. C) Percentage of publications per drug category.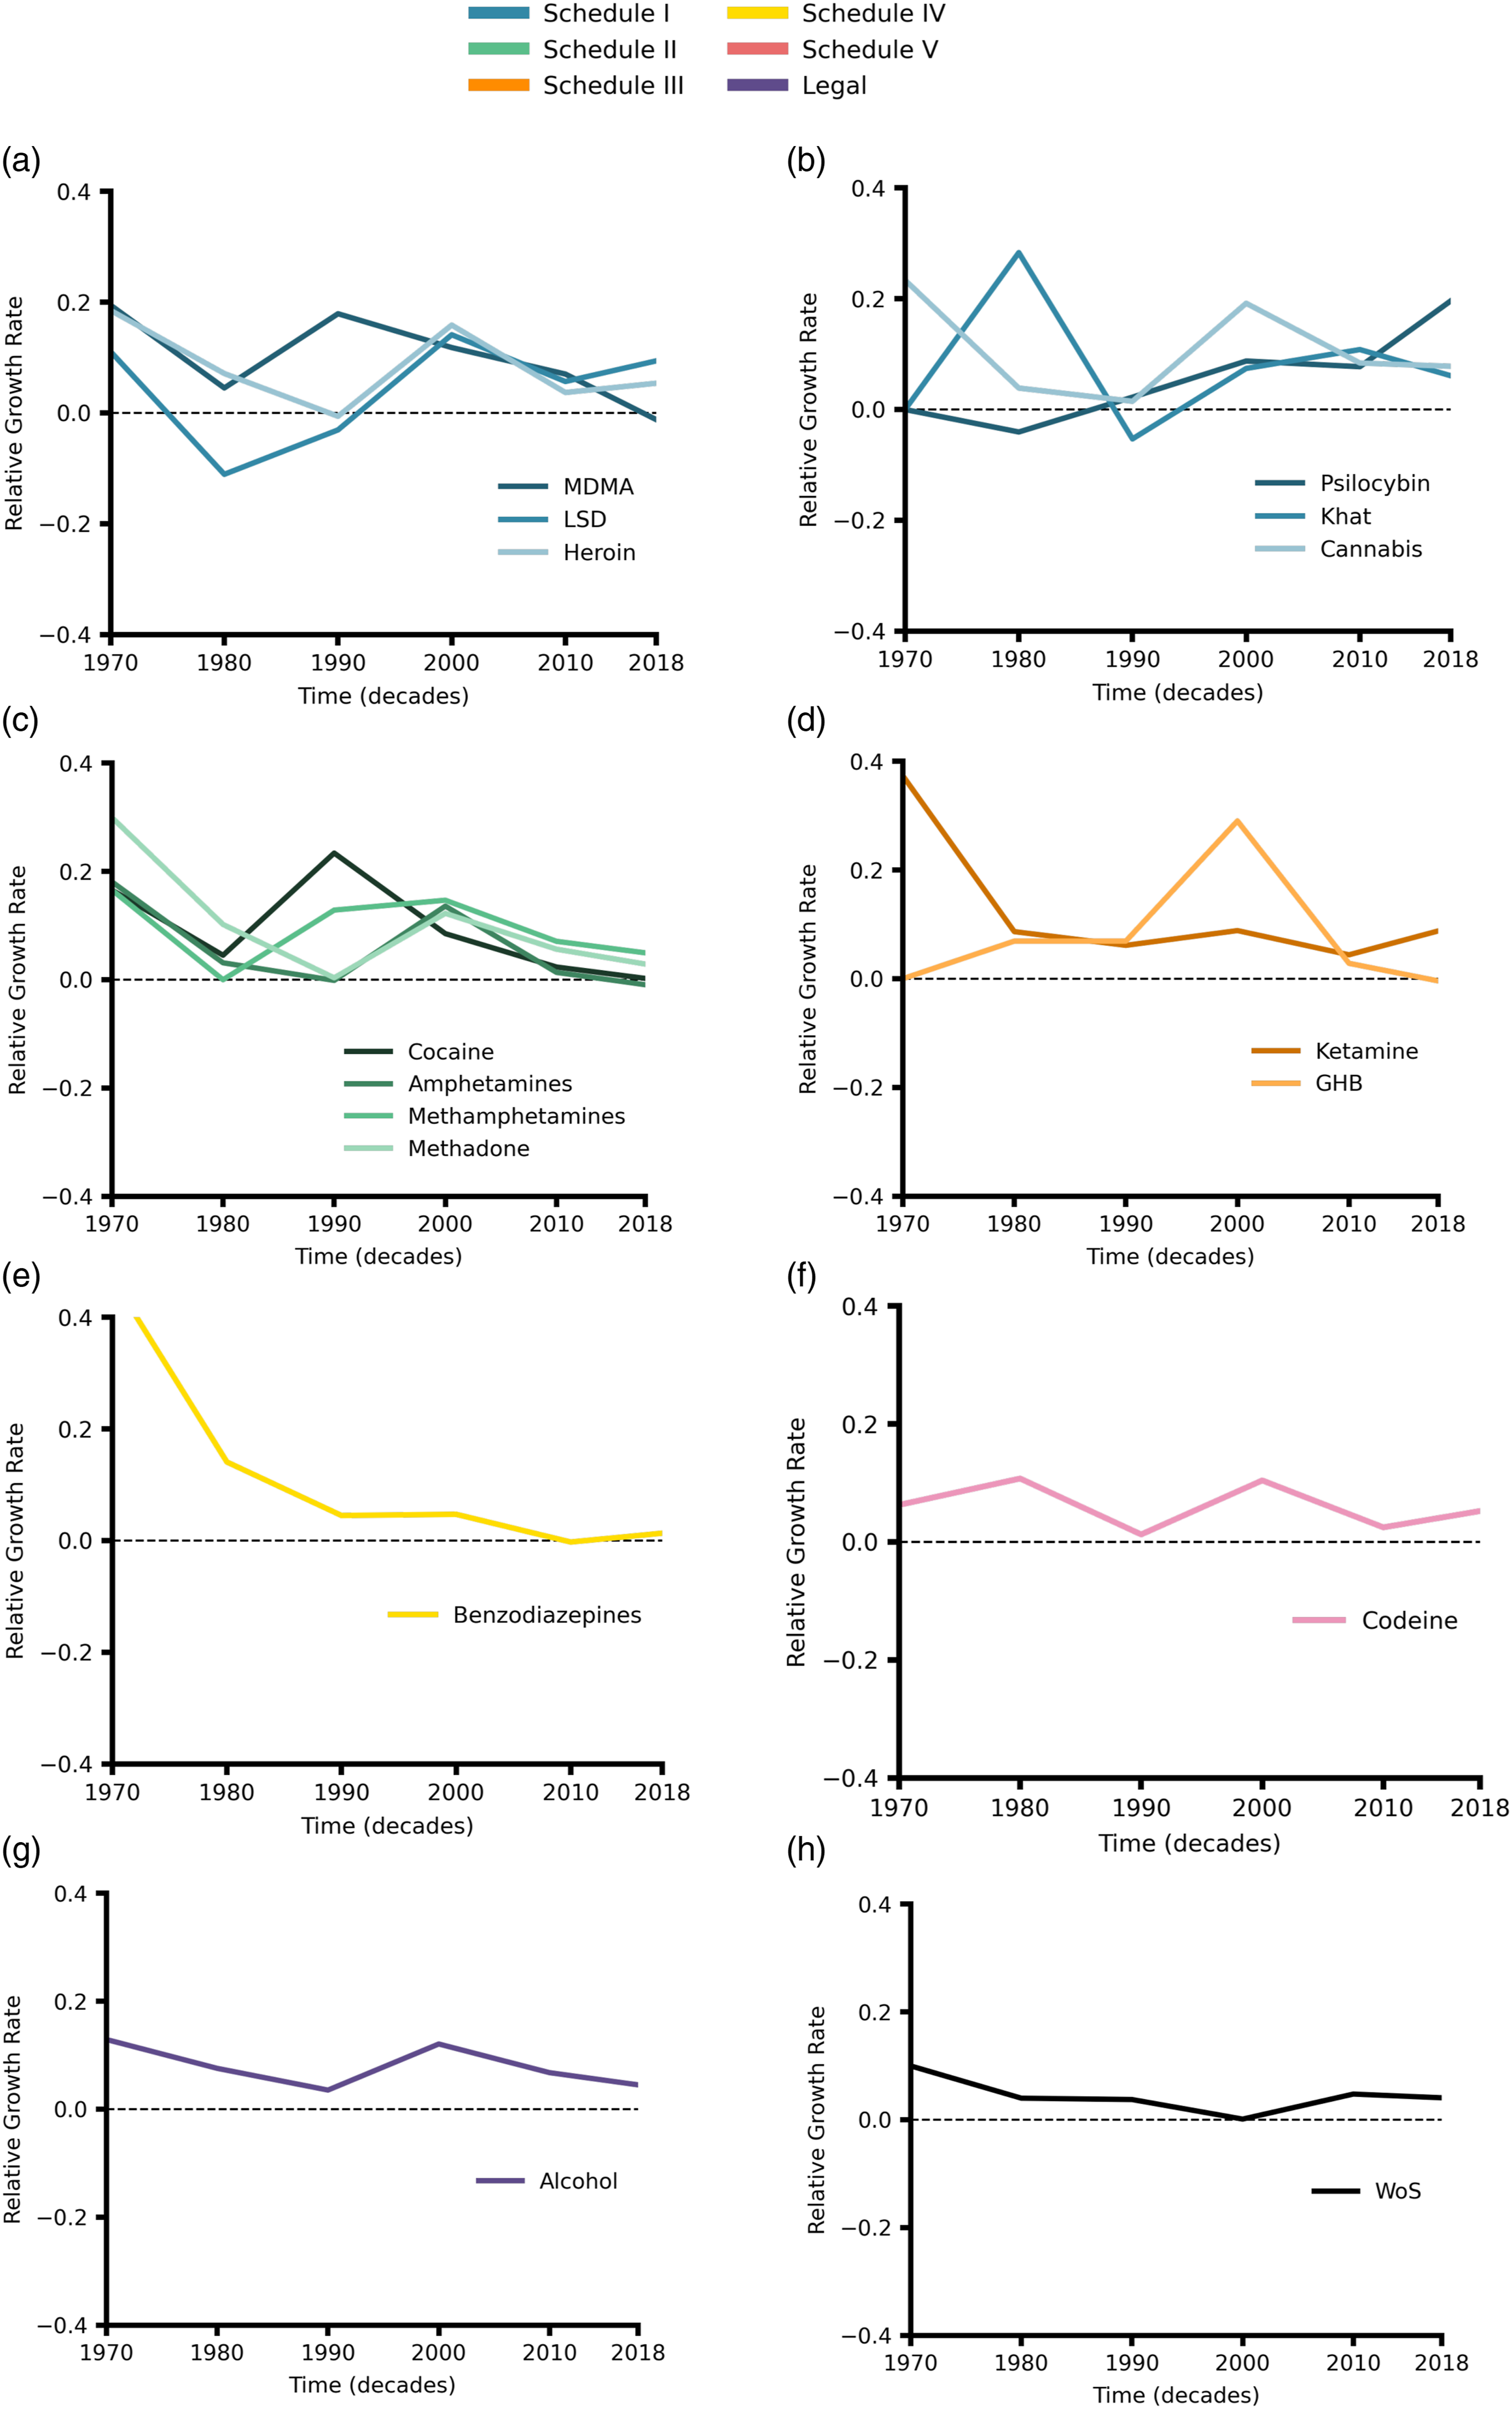
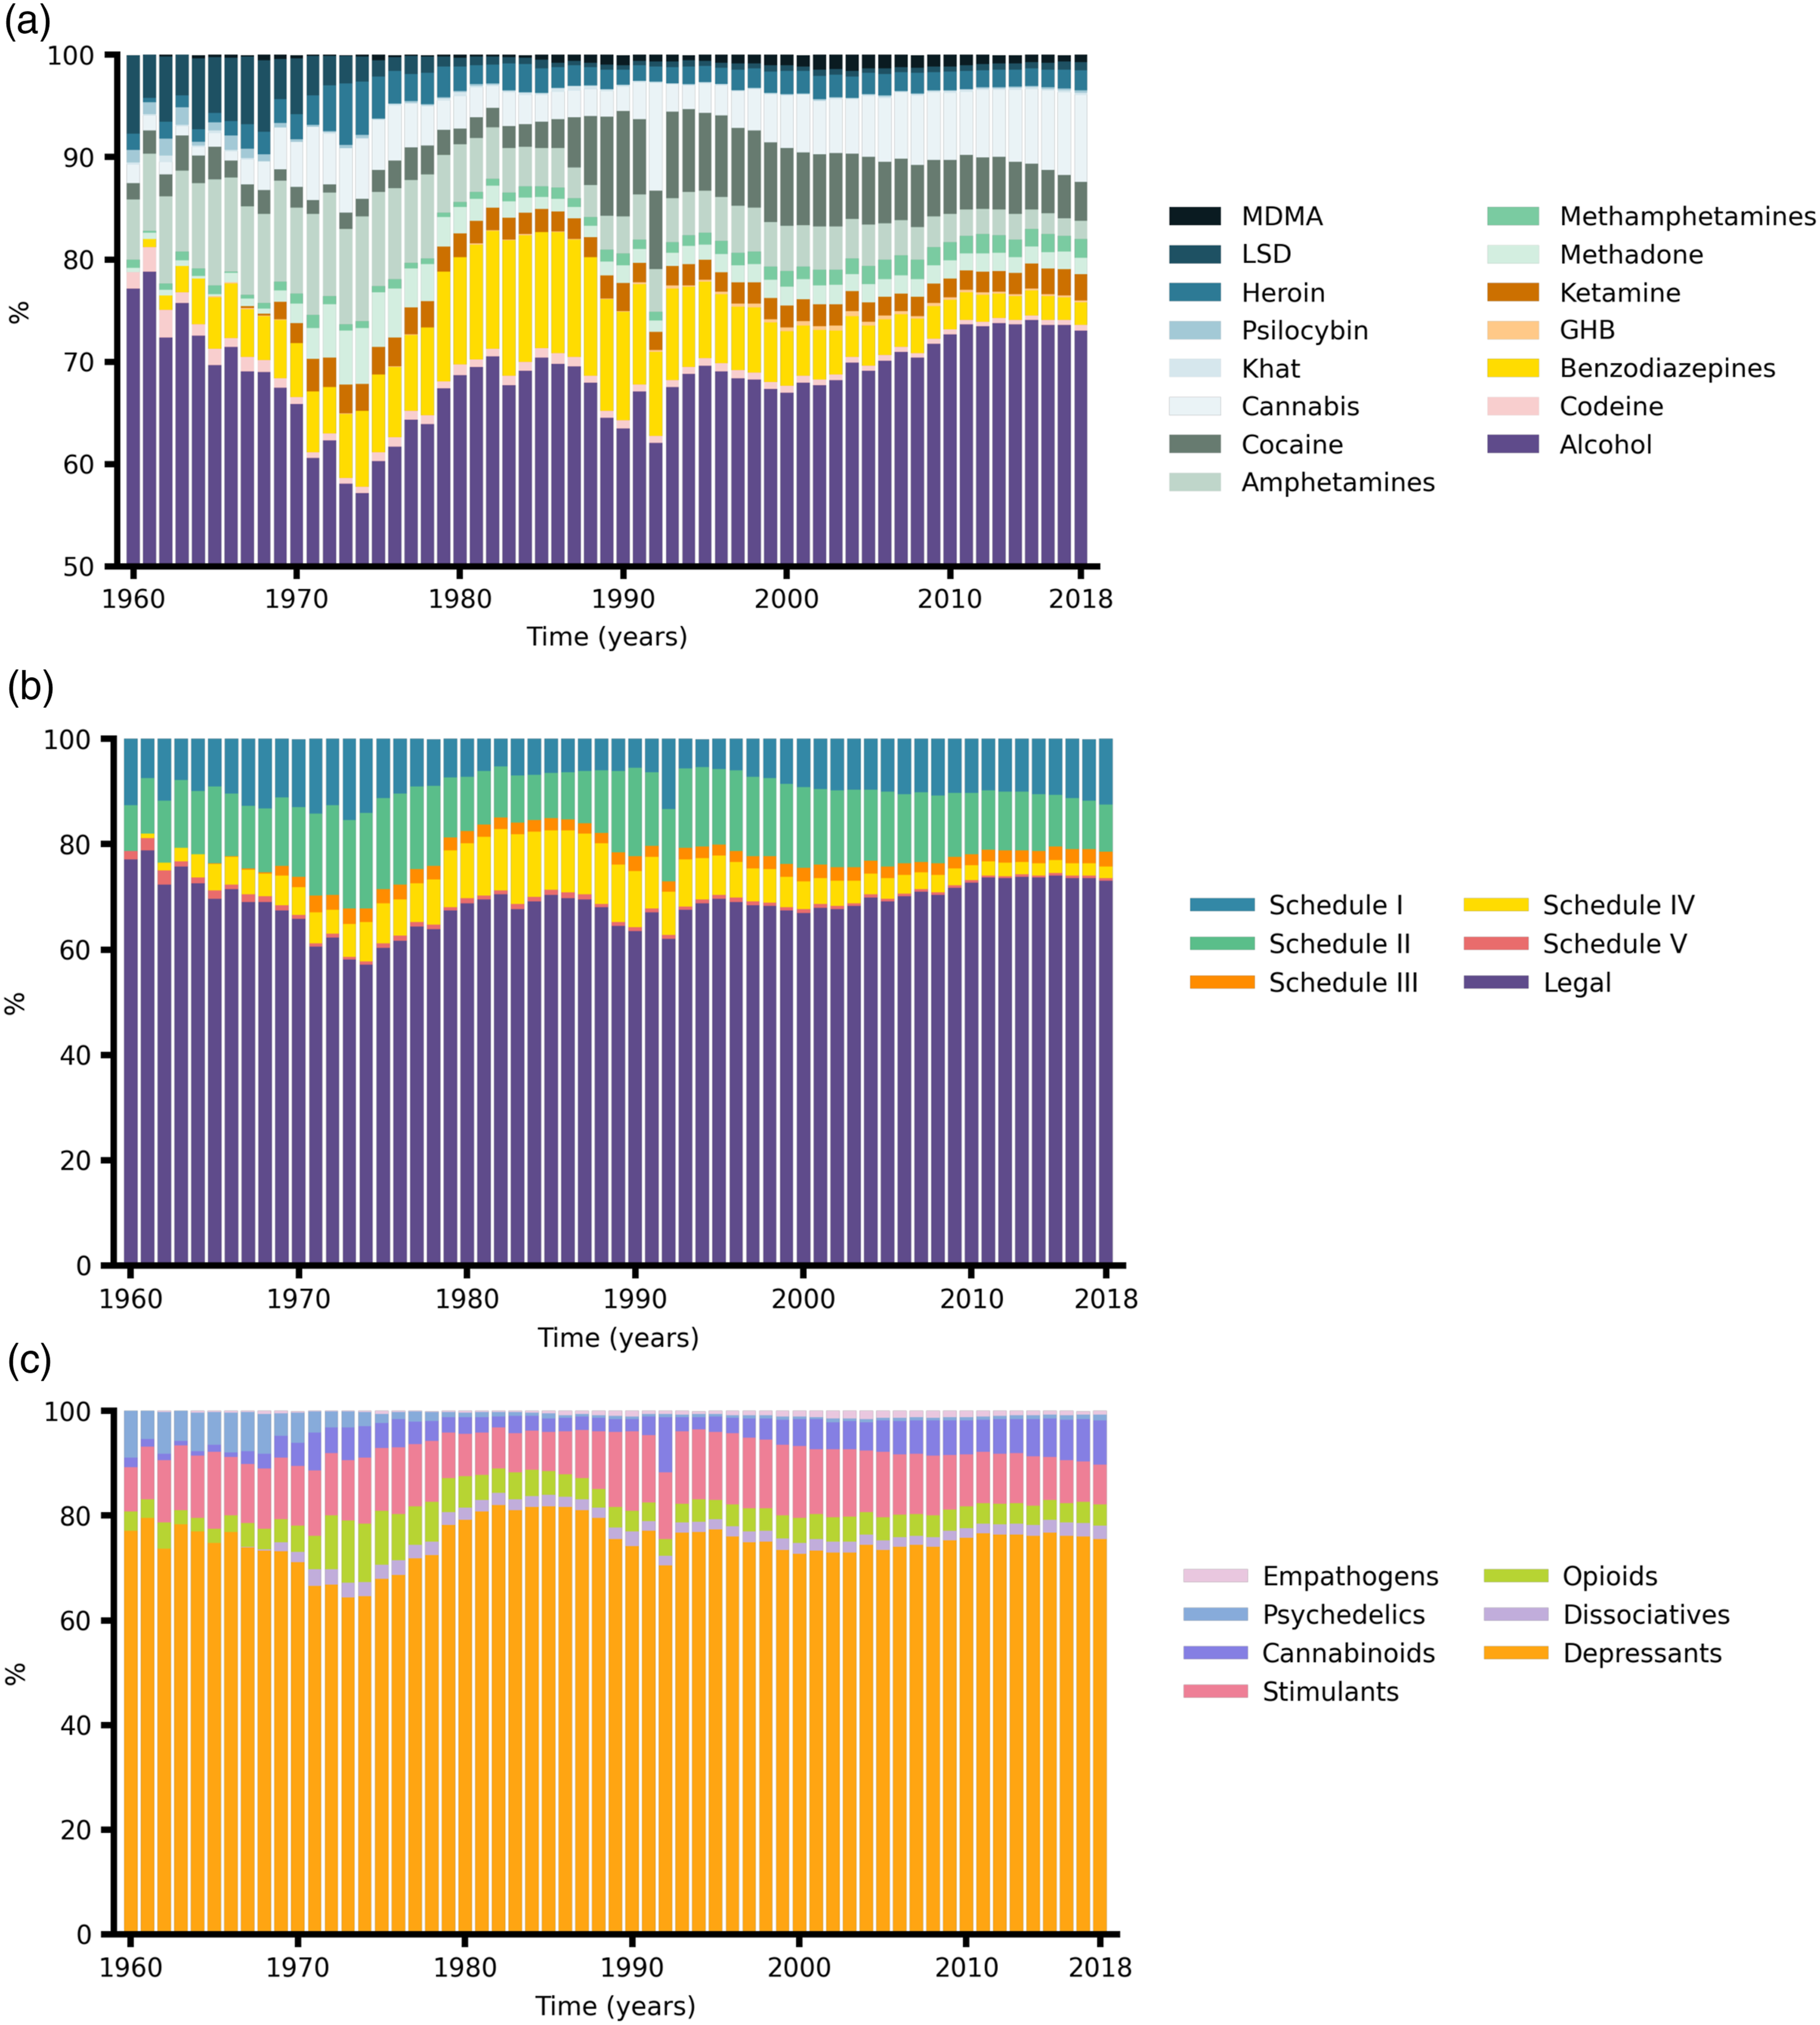
Figure 5a shows the percentage of number of publications per drug relative to all selected drugs per year from 1960 to 2018. The literature on alcohol represented between 60% and 80% of total literature over the years (Figure 5a). Consistent with this observation, literature on legal substances and depressants represented between 60% and 80% (Figure 5b and c). Interestingly, literature on LSD represented 5–10% during the 1960s, but dropped during the 70s, reaching 1.5% in 1978. The literature on psychedelics (LSD and psilocybin) follows a similar trend (Figure 5c). The literature on drugs classified in Schedules I–V increases from the 60s to the mid-70s, but it drops after this point, and it then stabilizes around 30% of representation. Within this group, the percent that the literature on Schedule I drugs represents has steadily increased since the 90s, whereas it has decreased for the literature on Schedule II drugs (Figure 5b). All in all, this analysis shows that the relative contribution to the psychoactive drug literature for different psychoactive drugs and categories greatly differs and has fluctuated over time.
Figure 6 shows top five contributing countries to literature on alcohol (A), cannabis (B), MDMA (C), LSD (D) and cocaine (E) from 1960 to 2018. The US has been the main contributor (i.e. the country with highest amount of papers over time) for all five drugs. In the literature on alcohol (Figure 6a), the top contributing countries were the US, China, Japan, India and England. In the literature on cannabis (Figure 6b), the countries that contributed the most were the US, England, Italy, Germany and Canada. Top 5 contributing countries to the literature of alcohol (A), cannabis (B), MDMA (C), LSD (D) and cocaine (E) from 1960 to 2018. The X-axis represents time (years) and y-axis represents total number of publications published by a given country at a given year. Top contributor countries are selected on the basis of total published articles from 1960 to 2018. The colour hue represents the drug’s legal classification as per previous figures and the shading indicate different countries.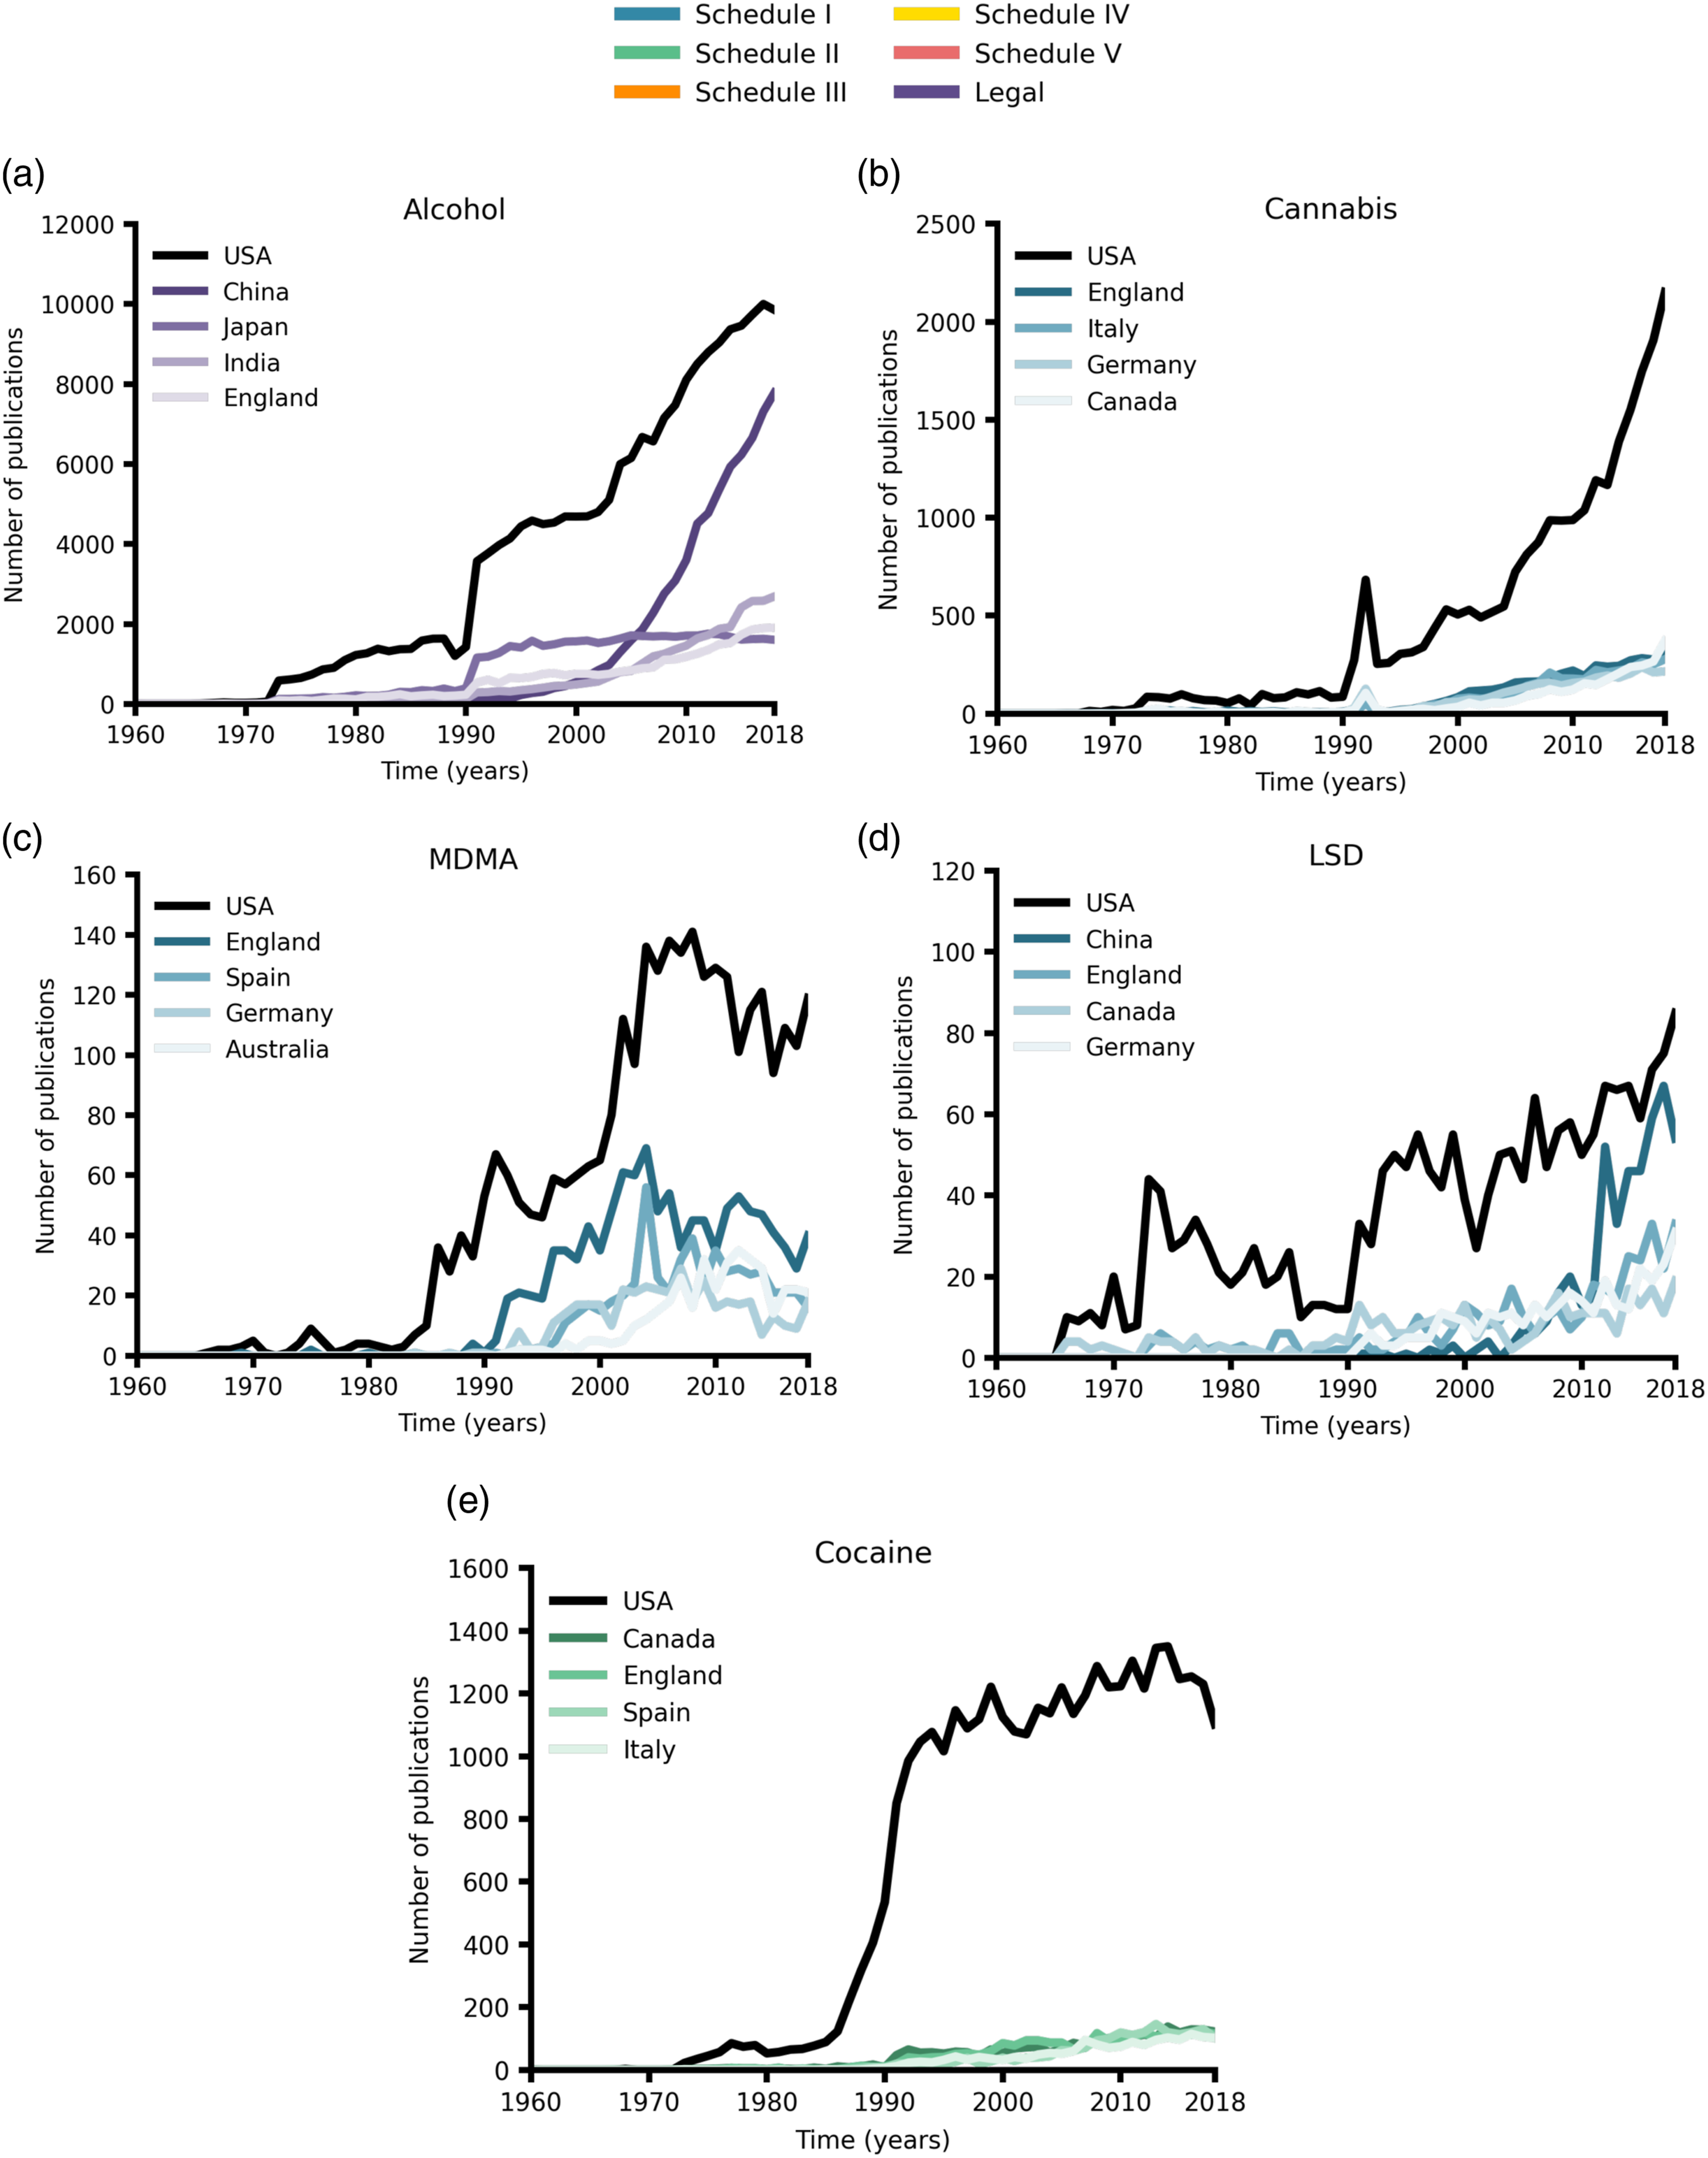
The US, England, Spain, Germany and Australia contributed the most to the literature on MDMA (Figure 6c). In the literature on LSD (Figure 6d), the top contributing countries were US, China, England, Canada, and Germany. Lastly, in the literature on cocaine (Figure 6e), the US, Canada, England, Spain and Italy published the most. The top five contributing countries for the other drugs selected in this study can be found in the online dataset at https://github.com/Drugs-and-Me/asymmetry-research/tree/master/data. Overall, this data shows the dominance of the US in the number of publications for these drugs. It also reveals regional differences in the focus of research for different drugs as the top contributing countries vary across drugs.
Discussion
Our bibliometric analysis has focused on the evolution of the literature of 15 different psychoactive drugs. In this discussion, we will focus on three different insights. Firstly, the publications of the selected drugs show heterogenous growth patterns. These growth patterns may be explained by the asymmetrical impact of socio-political events on psychoactive drug research. Secondly, research output is uneven among the selected drugs. Most publications have been conducted on alcohol, but its dominance fluctuates over time. This may reflect social and economic changes throughout the years. Thirdly, there are regional differences in the contribution of countries to the literature of the studied drugs. This may be due to differences in policies and social issues between regions.
Observed Growth Patterns for Each Drug by Schedule.
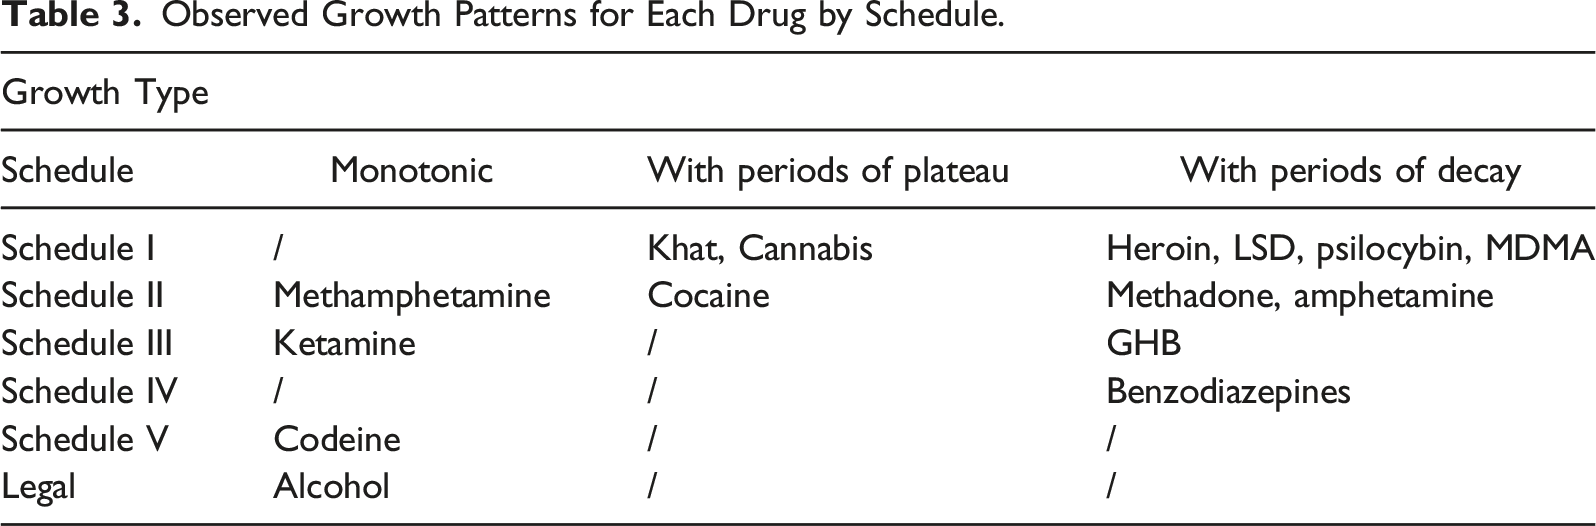
The number of scientific publications over time has been shown to follow an exponential growth (Zhang et al., 2019; Aaen-Stockdale, 2017), which is by definition monotonic. Therefore, periods of plateau or decay within the publication patterns suggest there are factors affecting this natural growth. For instance, literature on LSD and psilocybin shows growth with periods of decay (Figures 2b and 4b). Research on these substances was on the rise during the 50s and 60s, but underwent an important recess in the 1970s (Figures 2b and d, 4a and b) after a series of socio-political events (Figure 1) (Lawrence et al., 2021; Rucker, 2015). Additionally, the literature on MDMA also exhibits growth with periods of decay. After the prohibition of psychedelics, a number of clinical studies during the 1980s and 1990s suggested MDMA was a valuable alternative to psychedelic treatment (Sessa, Higbed, & Nutt, 2019). However, the US banned MDMA in 1985 (Corwin, 1985). Despite this, there was an increase in its recreational use in the 90s (Miech et al., 2018). In the UK, the brewing industry sponsored anti-MDMA campaigns due to the negative impact it was having on their business (Carey, 1997). Given the instability and shortage of funding sources to study Schedule I compounds, the ban together with the unfavourable propaganda against MDMA impacted its research (Rucker, 2015). These limitations seem to explain the pattern of growth of the number of papers on MDMA per year, which increased through the 1980s and early 1990s, but stagnated and dropped after 1995 (Figures 2 and 4).
Regarding the uneven research output among the selected drugs (Figure 5), the most notable observation is the dominance of research on alcohol over the years. Additionally, the publications on depressants and stimulants account for between 70% and 90% of the total literature of the selected drugs (Figure 5). Importantly, psychoactive substances interact with neuromodulatory networks (Marder, 2012) and are powerful tools to help understand the nervous system. Thus, psychopharmacologists can use psychoactive substances to study how neuromodulatory circuits modulate neuronal activity and support different functions. However, the asymmetric distribution of psychoactive substance research skews our understanding of the nervous system (Nichols, 2016). For instance, the dopamine theory has been a leading explanation for addiction, and it has guided funding and treatment development efforts. Although there is convincing evidence that depressants and stimulants increase dopamine levels, the role of dopamine in cannabis and opioid use is less convincing (Nutt, 2015). The asymmetry in the type of drugs which have been studied may be a factor which explains the development of incomplete theories which result in suboptimal treatments (Carhart-Harris & Goodwin, 2017; Liechti, 2017; Nutt et al., 2013).
Regarding the regional differences in research output for the studied drugs (Figure 6), we have observed patterns which may be explained by socio-political regional differences. Firstly, our analysis revealed that the US dominates the psychoactive drug literature as shown by previous studies (Akbar et al., 2019). Secondly, while no Asian country is listed within the top five contributor countries for cannabis, ketamine, LSD nor MDMA literature, in the case of alcohol we found three Asian countries (China, India and Japan) within the top five contributors (Figure 6). A reason for this could be that countries in Asia have addressed trading and consumption of illegal drugs with much harder punishments. Additionally, research on illegal substances have received little government funding (Zhang & Chin, 2015).
Another interesting example is that Italy is the third top contributor for the literature on cannabis, while it is not a top five contributor for most other drugs. This might be because Italian doctors have been able to prescribe cannabis products and synthetic cannabinoids for therapeutic use since 1998 (Zaami, Di Luca, Di Luca, & Vergallo, 2018). Additionally, Italy has recognized the therapeutic use of THC since 2007 (Bifulco and Pisanti, 2015). Similarly, Ethiopia and Yemen – in which trade and consumption of khat are legal – are amongst the top 5 contributors to literature on khat. Interestingly, while previous bibliometric studies (Zyoud, 2015) and our results show the dominance of African countries in the literature on khat, these countries do not generally have high productivity rankings in research (Clarivate, 2011) (Figure 6). Another example comes from Switzerland, which has pioneered the legal, medical use of psilocybin since 1988, as well as the implementation of harm reduction programmes (Uchtenhagen, 2010). During the late 1980s, despite the rise of recreational use and general decline in psychedelic research (Lawrence et al., 2021), the Swiss Federal Office for Public Health granted special permission psychiatry and psychotherapy specialists to use psilocybin and LSD. This favoured research on psychedelics and their clinical applications through the 1980s and 1990s, making Switzerland the third contributor to the literature on psilocybin.
Our bibliometric study of 15 different psychoactive substances shows that psychoactive drug use research is asymmetric. Our historical and regional analyses suggest that this asymmetry is influenced by socio-political events both at a national and supranational level. Restrictive laws and social stigma seem to particularly hinder research on psychoactive substances. Importantly, the laws are not intended to directly stop or slow down research. Government and funding bodies should consider these side-effects of drug laws and continue promoting drug research even for highly regulated substances. Despite drug laws aiming to reduce the harm on society, if they make research slow, expensive and underfunded, then society misses opportunities to engineer infrastructures and treatments to further decrease the associated harm. Importantly, research output is a complex, multi-dimensional phenomenon and here we have only considered a narrow number of parameters and explanations. Future studies should apply other bibliometric tools like citation networks and compare the results with quantitative social indicators to further inform policy-makers. Our results should stimulate both governments and funding bodies to review the investment and regulations on psychoactive substances. Decreasing the barriers to research and increasing access to funding would facilitate researchers to investigate psychoactive substances to assess their safety and therapeutic applications. This could help developing more optimal interventions for problematic drug use as well as treating millions of patients suffering from other mental health conditions.
Footnotes
Acknowledgements
The authors would like to thank David de Segovia Vicente for his advice on the analysis and feedback for early versions of the manuscript
Declaration of Conflicting Interests
The author(s) declared the following potential conflicts of interest with respect to the research, authorship, and/or publication of this article:The authors declare the following relationships which may be considered as potential competing interests. The authors of the paper are members of the harm reduction group, Drugs and Me. This group operates under the limited company by guarantee, Mental Health Education Foundation (11118471). The last author is also shareholder of the limited company by shares NeuroSight Consultancy Ltd (13444906). This company works with organisations to implement harm reduction practices and reduce drug-related harm. Importantly, (1) these organisations do not work in the policy sector, and (2) this research will not directly benefit economically or in any other form any of the two entities. This paper is particularly relevant for policymakers at a national level. The risk of any competing interests influencing the scientific integrity of the paper has been minimised by applying quantitative analyses and providing tables with all the data collected. We plan to make both the data and the code available to the public in a GitHub repository.
Funding
The author(s) received no financial support for the research, authorship, and/or publication of this article.