
Abstract
Yttria-stabilized zirconia (YSZ) has become indispensable in restorative dentistry; however, the influence of yttria content on its crystalline phases and fine structure remains incompletely understood. This study investigated how variations in yttria content (3–8 mol%) and low-temperature degradation (LTD) influence the crystalline phase composition and local atomic structures of dental zirconia using synchrotron-based X-ray diffraction (XRD) and X-ray absorption fine structure (XAFS) spectroscopy. Forty-two sintered disc-shaped specimens were prepared from zirconia powders stabilized with 3–8 mol% yttria (3–8YSZ). Half of the specimens were polished, while the other half underwent autoclaving to induce LTD. Synchrotron XRD showed that 3–5YSZ contained 2 tetragonal (t and t′) phases, while 8YSZ contained a cubic (c) phase. The t-phase fraction decreased markedly with increasing yttria content, from 83.1 mass% in 3YSZ to 25.3 mass% in 5YSZ. LTD induced monoclinic (m) and rhombohedral (r) phases in 3YSZ and 4YSZ but not in 5YSZ, indicating improved LTD resistance at higher yttria contents. XAFS showed that the dual-peak white-line profile of zirconia specimens varied with yttria content, reflecting the t-to-t′ phase transition, and transformed into a single broadened peak after LTD, consistent with structural disorder induced by phase transformation. Fine structural analysis revealed 2 main coordination shells, Zr–O and Zr–Zr. In the Zr–Zr shell, the Debye–Waller factors changed systematically with yttria content, reflecting structural disorder associated with oxygen vacancies. In conclusion, a combined synchrotron XRD and XAFS approach elucidated the phase composition and atomic-scale structural disorder in dental zirconia across different yttria contents. These insights provide a foundation for the rational design of next-generation translucent dental zirconia, in which crystalline phase composition and local atomic disorder are deliberately tailored to achieve durable clinical performance.
Keywords
Introduction
Zirconia stabilized with 3 mol% yttria (3YSZ) has become an indispensable restorative material in clinical dentistry, particularly owing to its high flexural strength (~1,000 MPa) (Denry and Kelly 2008). This strength primarily arises from stress-induced transformation toughening, in which crack propagation is impeded by compressive stress generated during transformation from the tetragonal (t) to the monoclinic (m) phase (Garvie et al 1975; Piconi and Maccauro 1999). However, the t–m transformation can also occur gradually and spontaneously in the presence of water, a phenomenon known as low-temperature degradation (LTD) (Denry and Kelly 2008), raising concerns regarding the long-term stability of 3YSZ dental restorations. Additionally, the relatively low translucency of 3YSZ restricts its use in highly esthetic restorations. To improve LTD resistance and translucency, zirconia stabilized with higher yttria contents has been developed (Zhang et al 2016; Mao et al 2018; Kolakarnprasert et al 2019). Nevertheless, although higher yttria contents enhance phase stability and translucency, they compromise mechanical properties by decreasing the fraction of transformable t-phase, thereby weakening transformation toughening and resulting in lower flexural strength (e.g., ~600 MPa for 5YSZ) (Zhang et al 2019). Therefore, achieving an optimal balance among optical performance, mechanical integrity, and LTD resistance requires a deeper understanding of the crystalline phase composition as a function of yttria content.
Today, 4–6 mol% yttria-stabilized zirconia (4–6YSZ) is commercially available for dental applications (Ban 2021). In these materials, several crystalline phases are relevant, including the t-phase, modified tetragonal (t′) phase, and cubic (c) phase (Belli et al 2021; Nakamura et al 2024). In addition, when zirconia is subjected to hydrothermal or mechanical stress, the rhombohedral (r) phase may also appear alongside the m-phase (Inokoshi et al 2018; Shishido et al 2023). In the absence of such stresses, 4–6YSZ is generally considered to consist of the t-phase together with an additional phase. While this secondary phase has traditionally been identified as the c-phase, recent X-ray diffraction (XRD) studies suggest that it may instead correspond to the t′-phase, a nontransformable variant of the t-phase (Belli et al 2021; Nakamura et al 2024). This revised understanding of phase composition reshapes the interpretation of zirconia structure–property relationships. However, accurate identification of the t, t′, and c phases remains challenging with conventional laboratory XRD analysis because these phases often show substantial peak overlap. This problem is further complicated by the Cu Kα1/Kα2 doublet commonly produced by laboratory X-ray sources. Although monochromators can remove the Kα2 component, they also reduce X-ray intensity, which is particularly problematic at higher 2θ angles where phase-specific peaks are more distinguishable but inherently weak (Harrington and Santiso 2021; Nakamura et al 2024). Consequently, inaccuracies in qualitative phase identification may propagate into errors in quantitative phase analysis based on Rietveld refinement, which relies on prior qualitative assumptions regarding the phases present.
Synchrotron-based XRD can overcome several limitations of conventional XRD, owing to its exceptionally high brilliance (Bunker 2010a; Ishikawa 2019). Even after monochromatization, synchrotron X-rays provide sufficient intensity to resolve closely spaced diffraction peaks. However, the application of synchrotron X-rays in dental zirconia has not been fully established because it requires specialized facilities and is associated with high operational costs.
To complement phase analysis by XRD, synchrotron X-rays enable X-ray absorption fine structure (XAFS) spectroscopy (Bunker 2010a), which probes the local atomic environment, referred to as fine structures (Lee et al 1981; Sun et al 2015). The X-ray absorption spectrum comprises 2 regions: the X-ray absorption near-edge structure (XANES), which reflects oxidation states and electronic structures, and the extended X-ray absorption fine structure (EXAFS), which yields quantitative information on local atomic coordination (Li et al 2010). However, in dental zirconia, systematic XANES/EXAFS analyses remain limited.
In this context, we hypothesized that 3–5YSZ predominantly consists of t- and t′-phases rather than a mixture of t- and c-phases, with the specific phase fractions governed by the yttria content. We further posited that yttria contents and LTD would modulate the local atomic structure, leading to distinct X-ray absorption spectra. Accordingly, the present study aimed to investigate both the crystalline phase composition and local fine structures of dental zirconia stabilized with different yttria contents, with and without LTD, using synchrotron-based techniques: XRD for qualitative and quantitative phase analysis, and XAFS spectroscopy, including both the XANES and EXAFS regions, to probe the fine structural characteristics. By integrating synchrotron-based XRD and XAFS, this study seeks to clarify structure–property relationships in translucent zirconia and to inform future material design strategies for durable dental restorations. This is clinically important because the interpretation of translucency, mechanical reliability, and LTD resistance in high-yttria zirconia depends strongly on its actual phase composition and local atomic structure.
Materials and Methods
Detailed protocols are provided in the Appendix; a brief overview of the methodology is presented below.
Specimen Preparation
Disc-shaped specimens were fabricated using 4 zirconia powders: Zpex (3YSZ; Tosoh), Zpex4 (4YSZ; Tosoh), Zpex Smile (5YSZ; Tosoh), and TZ-8YSB (8YSZ; Tosoh), following previously reported protocols (Kurihara et al 2023). 8YSZ was prepared as the c-phase reference (Matsui et al 2008; Nakamura et al 2024). In total, 42 specimens were sintered at 1,500 °C for 2 h (diameter: 13.5 mm; thickness: 1.3 mm). Six specimens from each group were polished as previously reported to minimize the influence of surface irregularities and machining-related damage on crystallographic characterization (Shishido et al 2023). The remaining 3–5YSZ specimens were subjected to autoclave-induced LTD at 134 °C and 0.2 MPa for 50 h to induce m-phase transformation (Nakamura et al 2015, 2016).
Synchrotron-Based XRD
XRD analysis was performed at beamline BL8S1 of the Aichi Synchrotron Radiation Center using monochromatic X-rays (9160 eV; wavelength = 1.355 Å) obtained with a Si (111) monochromator. Diffraction patterns were collected over a 2θ range of 20° to 90° using a 2-dimensional pixel array detector (Pilatus 100K; Dectris). Three specimens per group were randomly selected for measurement. Scanning was conducted at a speed of 10°/min with an angular step size of 0.01°. Qualitative phase analysis focused on the 2θ = 62.5°–65.0° (equivalent to 72°–76° for Cu Kα1 radiation), where t-, t′-, and c-phase peaks are distinguishable (Nakamura et al 2024). The 2θ range of 23° to 29° was also examined to detect m- and r-phases. Quantitative phase analysis was conducted via Rietveld refinement using TOPAS Academic V7 (Coelho software) (Nakamura et al 2022, 2024).
Synchrotron-Based XAFS
XAFS spectroscopy was conducted at beamline BL11S2 of the Aichi Synchrotron Radiation Center. Scans were performed around the Zr K-edge (17998 eV) using Si (111) crystals over an energy range of 17,700 to 19,100 eV. XAFS measurements were performed using the conversion electron yield mode in a chamber purged with He gas at a flow rate of 300 mL/min. Each scan was completed within 9 min, with a step size of 0.33 eV.
The XANES regions (17,980–18,090 eV) were analyzed using the Athena software package (Ravel and Newville 2005). As no single theoretical model is available for fitting the XANES region (Kurisaki et al 2008; Rehr and Ankudinov 2005), the analysis was primarily qualitative, focusing on the white-line profile. Additionally, first-derivative plots of the XANES spectra were obtained to evaluate the pre-edge peak at ~18,005 eV.
To analyze the EXAFS region, X-ray absorption spectra were first processed using Athena and subsequently fitted using the Artemis program package (Ravel and Newville 2005). Phase identification and lattice parameters determined via XRD were used for path calculations using the FEFF6 program (Rehr et al 1991). For the t- and t′-phases, 3 paths (Zr–Oi, Zr–Oii, and Zr–Zr) were assumed. For the c-phase, 2 paths (Zr–O and Zr–Zr) were considered based on FEFF calculations and previous literature (Li et al 1993). The spectra were transformed into k-space, where the X-ray energy was converted into the photoelectron wavevector (k). Subsequently, a Fourier transformation was applied to obtain spectra in R-space, and fitting was performed over an R range of 1.30 to 3.55 Å based on the EXAFS equation (Bunker 2010b; Husain et al 2021):

where χ(k) is the EXAFS oscillation,
Results
XRD: Phase Analysis
Diffraction peaks of 3–5YSZ appeared at essentially the same 2θ positions, with variations only in peak intensity, whereas those of 8YSZ appeared at slightly shifted positions (Fig. 1A). These differences were more clearly resolved in the 2θ range from 62.5° to 65.0° (Fig. 1B). While 3–5YSZ exhibited 4 distinct peaks at approximately 63.1°, 63.5°, 63.9°, and 64.2°, 8YSZ exhibited a single peak at 63.7° corresponding to the c(400). Given that 8YSZ is known to consist exclusively of the c-phase, the absence of a peak at 63.7° in 3–5YSZ indicates the lack of a c-phase. The peaks at 63.1°, 63.5°, 63.9°, and 64.2° in 3–5YSZ were assigned to t(004), t′(004), t′(220), and t(220), respectively.

Synchrotron X-ray diffraction (XRD) analysis of 3–8YSZ. XRD patterns of (
The LTD considerably altered the diffraction patterns of 3YSZ and 4YSZ, whereas that of 5YSZ remained almost unchanged (Fig. 1C). In the 2θ region from 23° to 29°, 3YSZ and 4YSZ exhibited 3 distinct peaks at approximately 24.7°, 26.4°, and 27.5°, corresponding to m(11-1), t&t′(101), and m(111), respectively (Fig. 1D), whereas 5YSZ exhibited only a single peak at 26.4°. Moreover, the peak at 26.4° in 3YSZ and 4YSZ broadened toward the low-angle side, characteristic of the r-phase (Inokoshi et al 2018; Shishido et al 2023). These results confirm the generation of not only the m-phase but also the r-phase in aged 3YSZ and 4YSZ.
The phase compositions and lattice parameters determined by Rietveld refinement are summarized in the Table. The t-phase fraction decreased from 83.1 mass% in 3YSZ to 25.3 mass% in 5YSZ and was almost absent in 8YSZ. Regarding the lattice parameters, yttria content exerted a slight influence on both the t- and t′-phases. Consequently, the tetragonality of both t- and t′-phases in unaged 3–5YSZ, assuming a fluorite-type structure (i.e., cf /af, where af = a√2 and cf = c), decreased with increasing yttria content (Table).
Crystalline Phases and Lattice Parameters Determined by Rietveld Refinement (n = 3 for Each Group).

LTD, low-temperature degradation.
Yttria contents were cited from a previous study (Nakamura et al 2024). Tetragonality was calculated by dividing c in the lattice parameter by a√2.
XANES: Analysis of Edge Features and White-Line Profiles
Representative X-ray absorption spectra of each specimen, along with that of the standard Zr foil, are presented in Appendix Figure 1. The Zr K-edge of all zirconia specimens was shifted by ~8 eV to higher energy relative to the Zr foil, with no significant differences among zirconia. In the XANES region, the white line in the spectrum of unaged 3–8YSZ exhibited 2 components at ~18,020 and ~18,025 eV (Fig. 2A). The intensity of the peak at ~18,020 eV decreased with increasing yttria content, whereas that of the peak at ~18,025 eV increased significantly. Following the LTD, the dual-peak structure in 3YSZ and 4YSZ collapsed into a single peak at ~18,022 eV (Fig. 2B). A weak pre-edge feature at ~18,005 eV was observed in all specimens and became more evident in the first-derivative spectra (Fig. 2C), with decreasing intensity as yttria content increased (Fig. 2D).
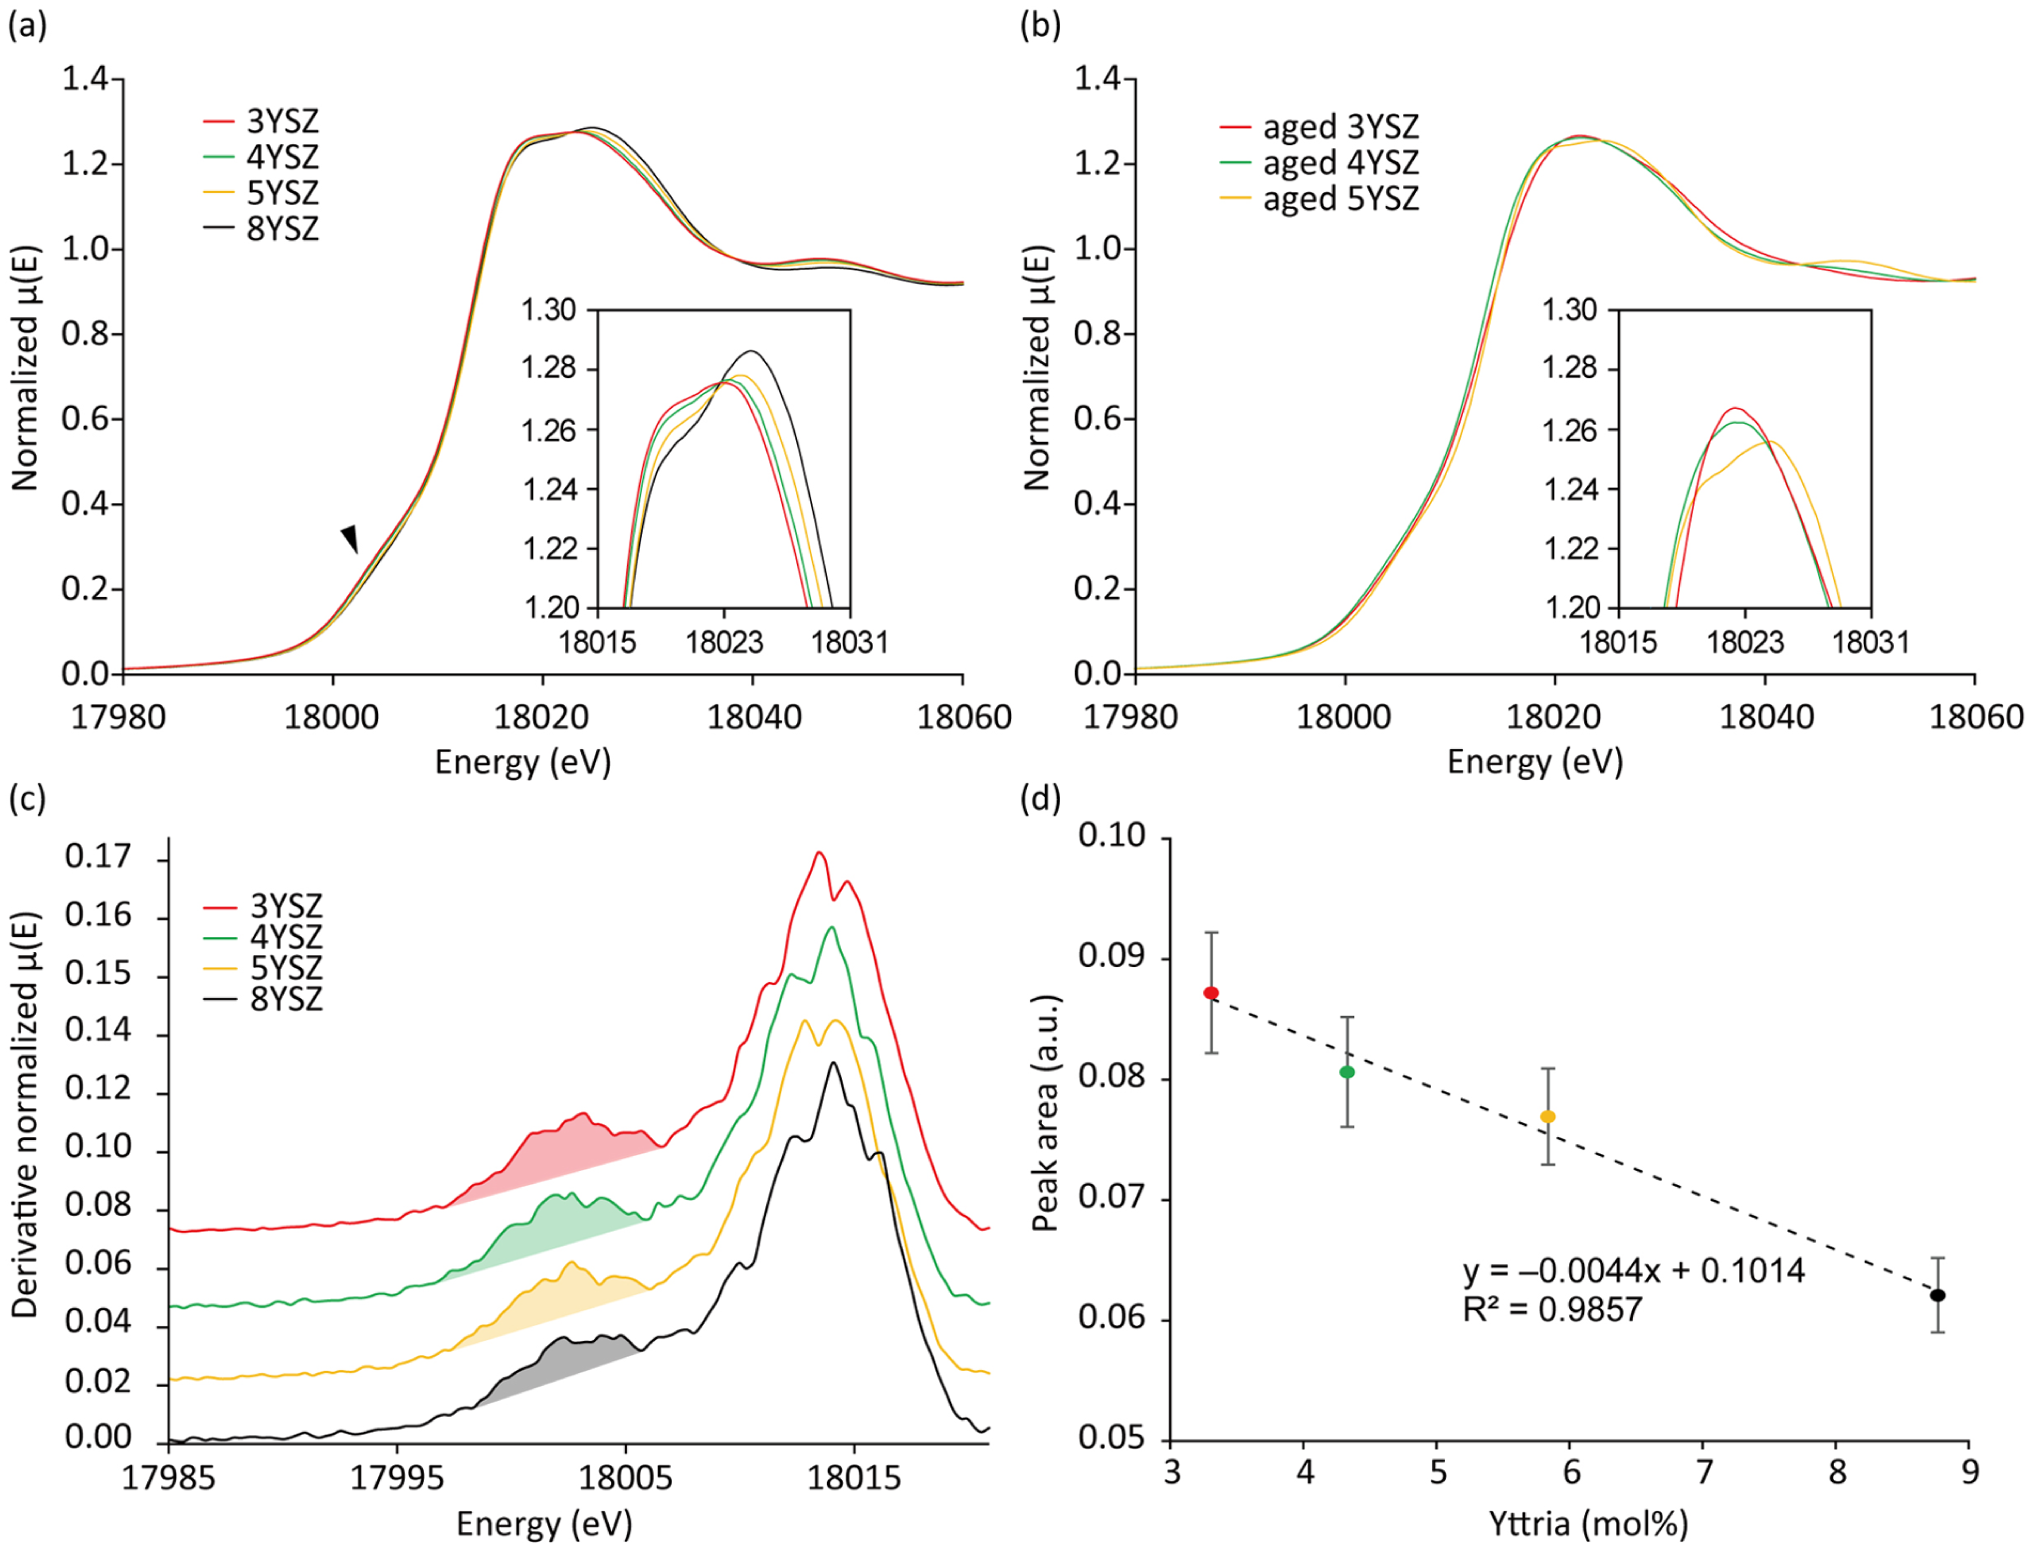
X-ray absorption near-edge structure (XANES) analysis at Zr K-edge of 3–8YSZ. XANES spectra of (
EXAFS: Analysis of Local Atomic Structure
The EXAFS spectra of 3–8YSZ in R-space exhibited 2 distinct peaks at radial distances of 1.6 Å and 3.2 Å, corresponding to the first (Zr–O) and second (Zr–Zr) coordination shells, respectively (Fig. 3A). The primary variation associated with yttria content was observed in the intensity of the Zr–Zr peak, which decreased progressively with increasing yttria content. Conversely, the Zr–O peak showed a slight increase with increasing yttria content. Upon autoclaving, the Zr–Zr peaks of 3YSZ and 4YSZ were substantially modified, whereas those of 5YSZ remained largely unchanged (Fig. 3B). Specifically, the Zr–Zr peak intensities in 3YSZ and 4YSZ were significantly reduced. In 3YSZ, the Zr–Zr peak shifted from a radial distance of 3.2 to 3.0 Å, and an additional peak appeared at 3.5 Å. In contrast, changes in the intensity and position of the Zr–O peak were less pronounced.
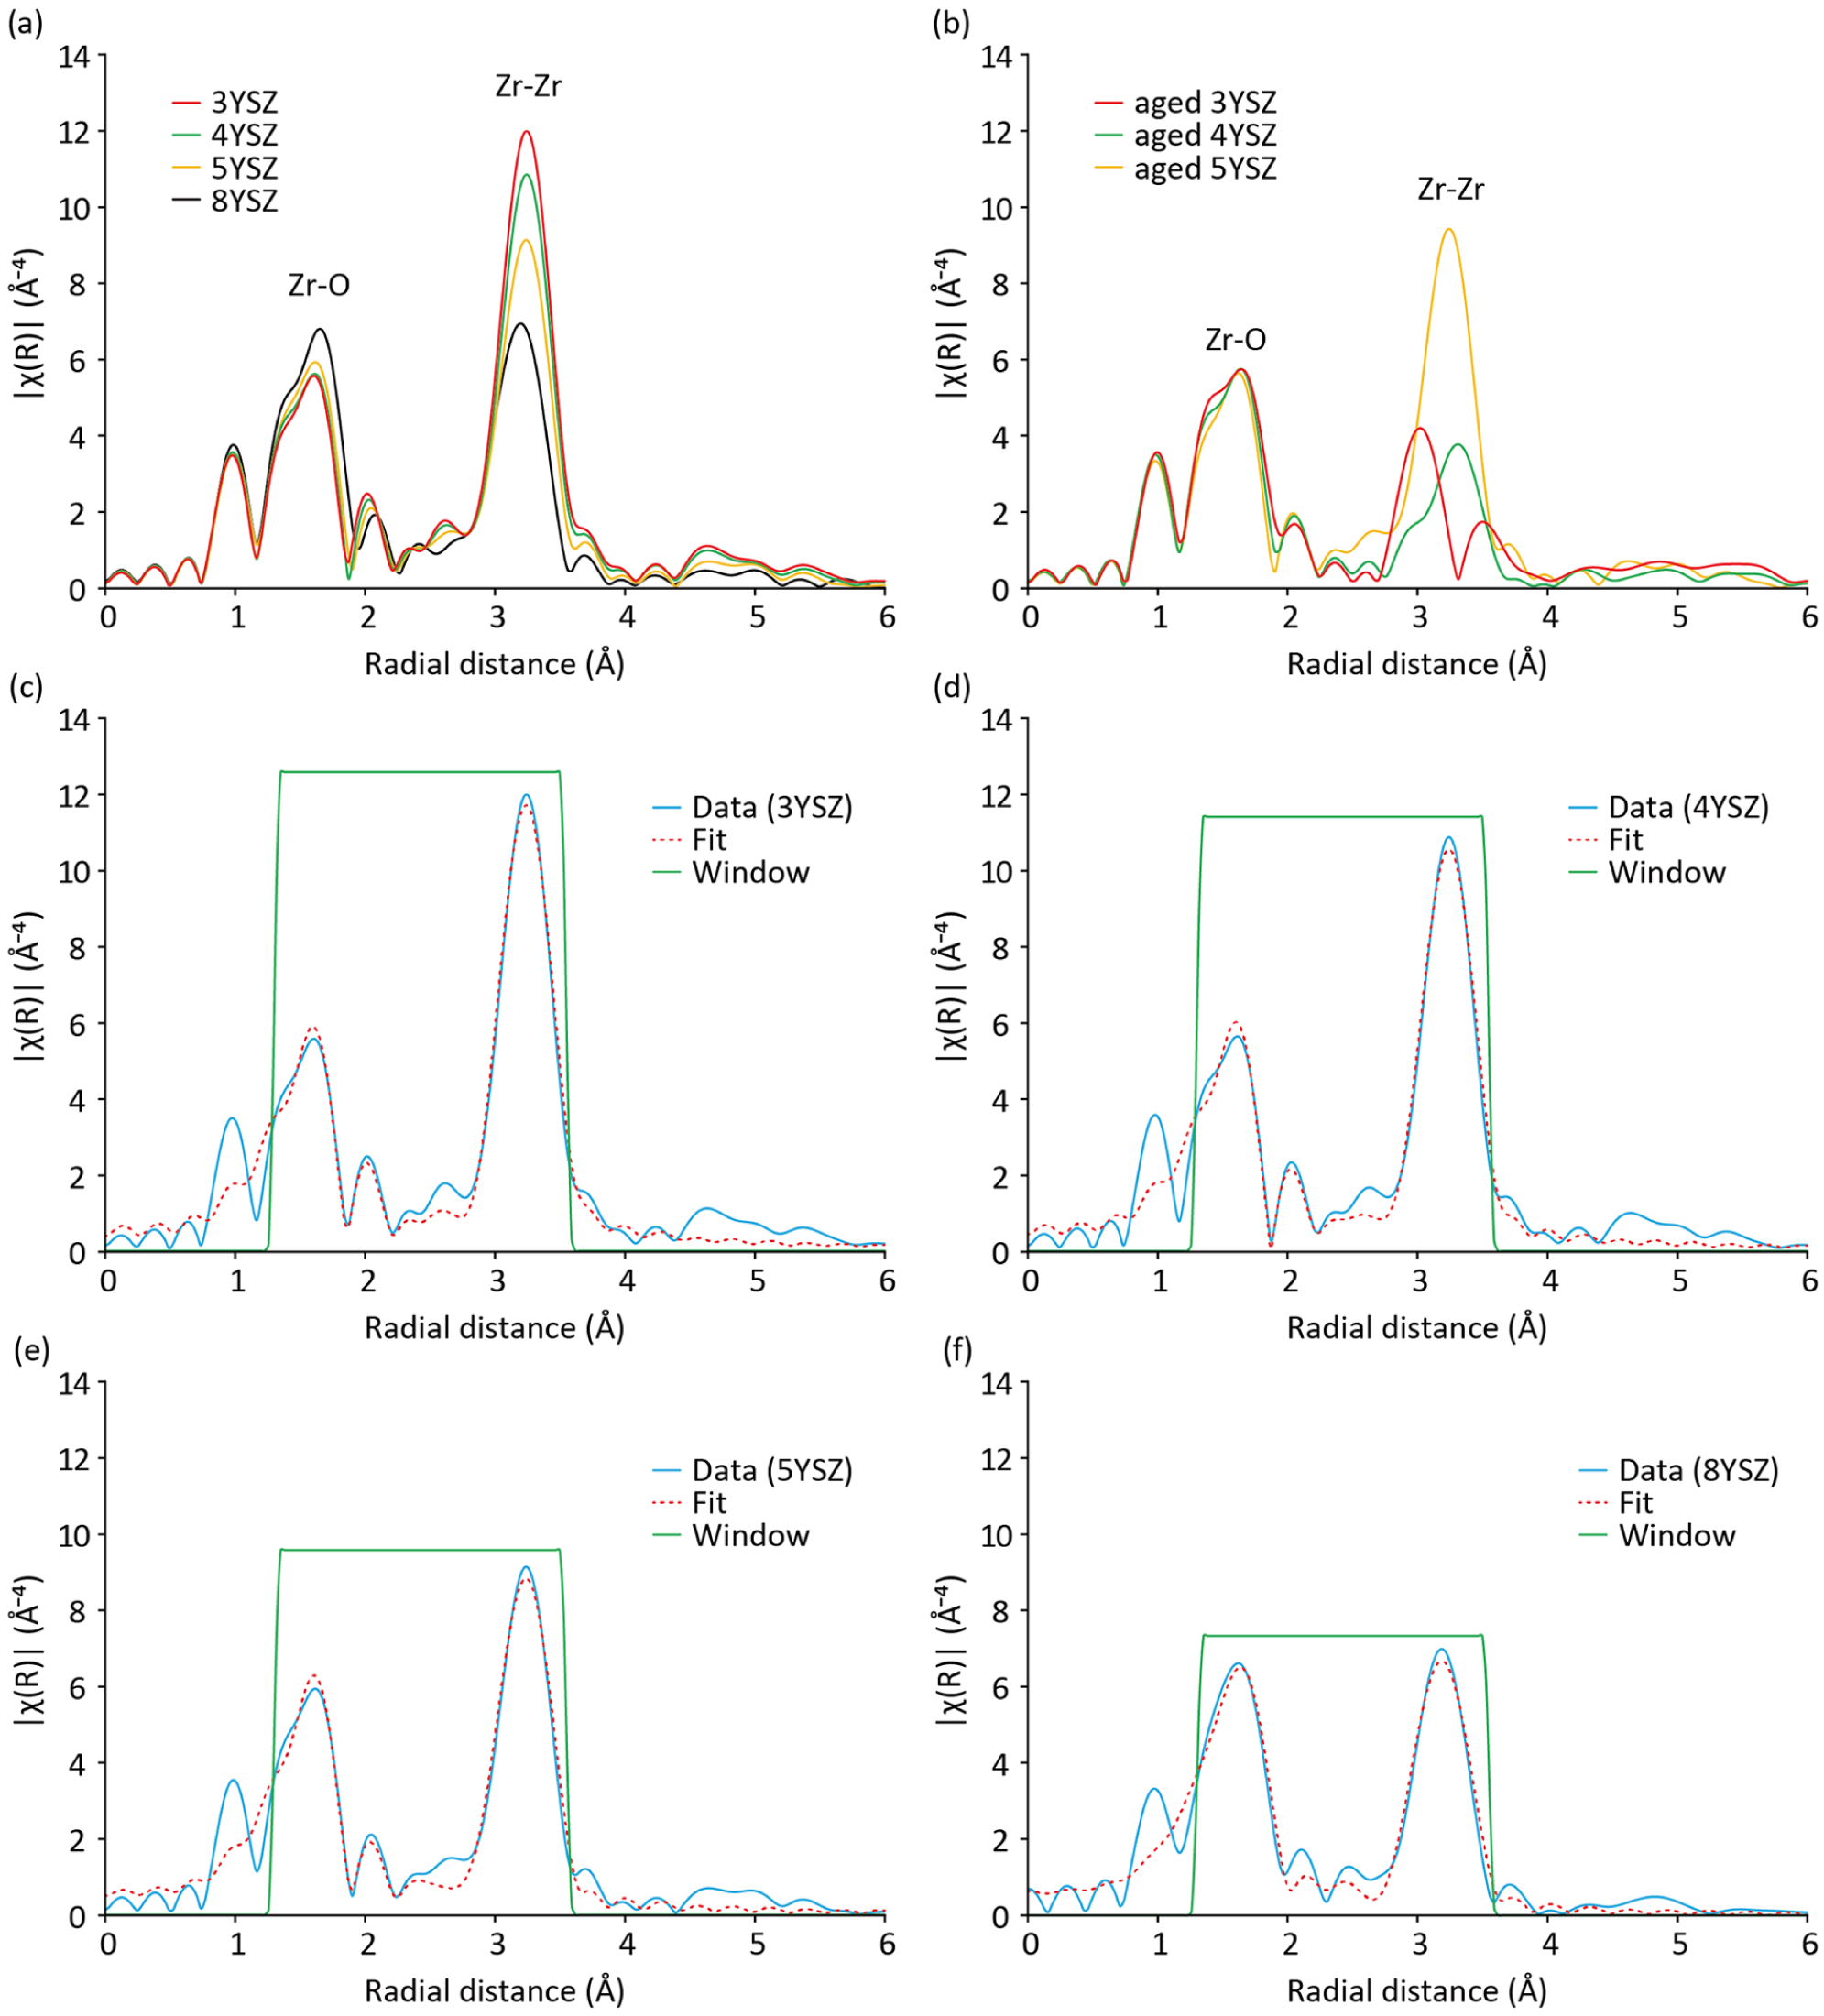
Extended X-ray absorption fine structure (EXAFS) analysis at Zr K-edge of 3–8YSZ. R-space EXAFS spectra of (
To further quantify these spectral features, a fitting analysis was performed on the unaged 3–8YSZ specimens (Fig. 3C–F), and the results are presented in Figure 4A to F and Appendix Table 1. Across the yttria content range of 3–8 mol%, the interatomic distances and coordination numbers exhibited only minor variations. In contrast, the Debye–Waller factors for Zr–Oi and Zr–Zr paths increased significantly with increasing yttria content.
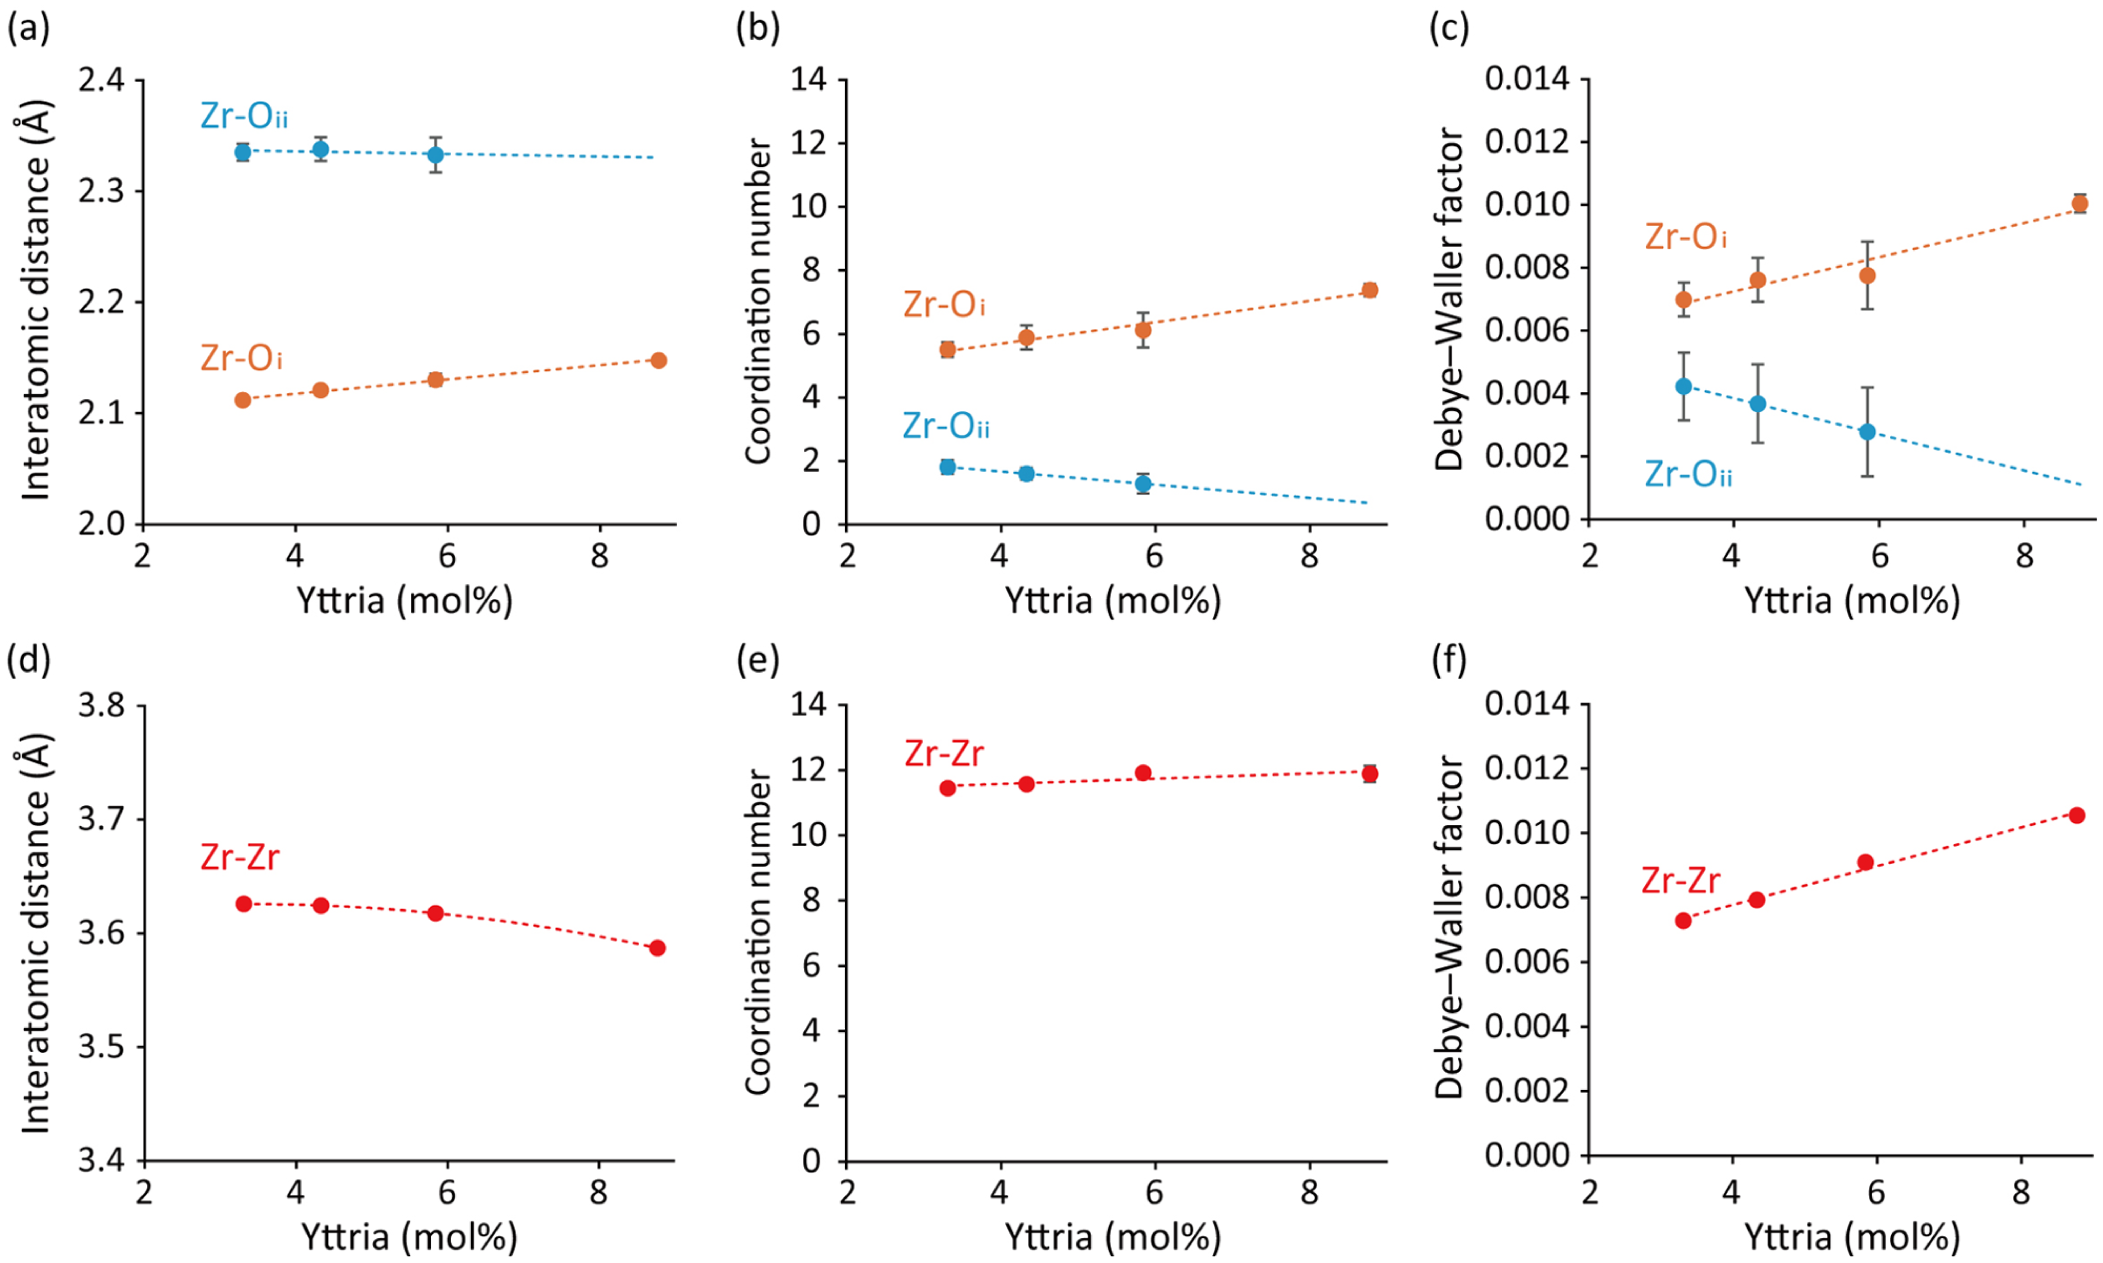
Influence of yttria content on the fine structural parameters of zirconia. (
Discussion
The highly intense and monochromatic synchrotron X-ray beam provided substantially enhanced resolution of the diffraction patterns compared with that achieved using conventional laboratory XRD equipment, enabling reliable identification of t-, t′-, and c-phase peaks. Synchrotron-based XRD clearly demonstrated the presence of t- and t′-phases in unaged 3–5YSZ, with c-phase absent, as evidenced by the lack of a characteristic c-phase peak observed in 8YSZ. Variations in the yttria content did not substantially alter the peak positions, indicating that 3–5YSZ shared the same crystalline phases. In contrast, yttria content significantly influenced peak intensities, suggesting that it modifies the relative phase proportions, with the t-phase fraction decreasing from 83.1 mass% in 3YSZ to 25.3 mass% in 5YSZ. These observations corroborate previous findings from laboratory-based XRD studies (Gibson and Irvine 2001; Belli et al 2021; Nakamura et al 2024) but with substantially improved reliability. These results also have practical relevance for the interpretation of translucent dental zirconia, as they suggest that the improved translucency of 4–5YSZ is not necessarily attributable to the presence of a true c-phase. Upon autoclave-induced LTD, only 3YSZ and 4YSZ underwent phase transformation, exhibiting the emergence of m- and r-phases. Notably, 4YSZ exhibited reduced susceptibility to LTD, likely due to its higher yttria content. In 5YSZ, the formation of m- or r-phases was barely detected after autoclaving, consistent with earlier reports (Nakamura et al 2016, 2022).
To complement the XRD findings, synchrotron-based XAFS was used to probe the local atomic structure of zirconia. In the XANES region, all zirconia specimens exhibited an edge shift of ~8 eV toward higher energies relative to the Zr foil, reflecting the oxidation of metallic Zr to Zr4+. This corresponds to an increased binding energy of the 1s core electrons due to the greater effective nuclear charge (Kriventsov 2023). The white-line profiles of unaged 3–8YSZ exhibited 2 components centered at ~18,020 and ~18,025 eV. With increasing yttria content, the lower-energy component gradually diminished, whereas the higher-energy component intensified, reflecting the formation of more symmetric Zr–O coordination environments that approach cubic-like local symmetry (Li et al 1993; Dura et al 2013). Autoclave-induced LTD transformed the dual-peak profiles of 3YSZ and 4YSZ into a single peak near 18,022 eV, likely reflecting the structural disorder associated with the t- to m-phase transformation (Dura et al 2013). Further insights were obtained from the first-derivative plots of the XANES spectra. All specimens exhibited a subtle shoulder near 18,005 eV, attributed to the 1s→4d transition (Li et al 1993). Although this transition is formally forbidden by dipole selection rules, it gains intensity via quadrupole contributions and p–d hybridization, which are enhanced by local asymmetry (Getty et al 2008). At lower yttria contents, oxygen vacancies are more randomly distributed. Therefore, the t-phase is regarded as 2 sets of nonequivalent Zr–O tetrahedra rather than cubic coordination (Li et al 1993). These asymmetric environments might promote p–d mixing, thereby increasing the pre-edge peak intensity.
EXAFS analysis provided additional quantitative insight into the local atomic structure of 3–8YSZ. In R-space, the most notable trend was a progressive decrease in the Zr–Zr peak intensity with increasing yttria content. Such attenuation of peak intensity typically reflects reduced CN or increased structural disorder. Fitting analysis showed that the CN for Zr–Zr remained relatively stable with <5% variation. In contrast, the Debye–Waller factors, which reflect structural disorder (Bunker 2010b), increased linearly by over 20%. These findings suggest that disorder was the primary driver of peak attenuation. This configurational disorder likely arose from oxygen vacancies created during yttria doping. Higher yttria content increases the vacancy concentration, potentially disrupting Zr4+ alignment and contributing to the attenuation of the Zr–Zr peak (Li et al 1993; Khare et al 2015). In contrast, the Zr–O peak intensity showed only a slight increase with increasing yttria content. This may be because a slight increase in CN partially offsets the effect of the increased Debye–Waller factors in the Zr–Oi shell. However, the Debye–Waller factors exhibited relatively large variability, and their interpretation should be approached with caution. With respect to interatomic distances, only subtle changes were observed with increasing yttria content. The Zr–Zr interatomic distance decreased from 3.626 Å in 3YSZ to 3.587 Å in 8YSZ, likely reflecting structural relaxation induced by oxygen vacancy formation and distortion of the fluorite lattice (Kondoh et al 1998). These interatomic distances are consistent with reported values for the t- and c-phases of YSZ (Li et al 1993; Dura et al 2013; Kriventsov 2023), and the observed contraction trend parallels findings of Veal et al (1988), who reported a decrease from 3.67 to 3.63 Å as yttria content increased from 9 to 40 mol%.
When the analysis was extended to aged specimens, notable changes were observed in the Zr–Zr shells of 3YSZ and 4YSZ. The marked reduction in Zr–Zr peak intensity in R-space indicates substantial disorder in the cationic sublattice. In 3YSZ, the original Zr–Zr peak shifted from ~3.2 to ~3.0 Å, and an additional peak appeared at ~3.5 Å in R-space, indicative of a new cationic arrangement associated with the m-phase (Schenk et al 2019; Onodera et al 2024). These changes were absent in 5YSZ, highlighting its superior structural stability against LTD, consistent with XRD findings. In contrast, the EXAFS peak arising from the Zr–O shell remained largely unchanged in both position and intensity, indicating that the local oxygen coordination around Zr was largely stable under autoclave conditions.
Although this study provides detailed synchrotron-based insights into dental YSZ, several limitations should be considered when interpreting the findings. First, the analysis of the Zr–O shell using EXAFS showed a high degree of variability, which could compromise the reliability of the calculated CN and Debye–Waller factors. This uncertainty may stem from the complex nature of the first coordination shell, where oxygen vacancies introduce local distortions that are difficult to model. Future studies could address this limitation by performing XAFS measurements at the O K-edge to directly probe the local oxygen environments. Second, XAFS measurements were conducted in conversion electron mode. In this mode, photoelectrons interact with He gas to produce He+, and the resulting ionization current was measured. Consequently, the retrieved information is limited to the topmost surface because photoelectrons have a limited escape depth and therefore primarily reflect near-surface structures.
Within these limitations, our integrated synchrotron XRD and XAFS approach provides a comprehensive view of how yttria content influences the crystalline phase composition and local atomic structure of dental zirconia. Notably, zirconia with 3–5 mol% yttria consisted mainly of t- and t′-phases, with no detectable c-phase. Yttria stabilizes the anionic sublattice via oxygen vacancies while introducing disorder into the cationic sublattice. This delicate balance between phase stability and local structural disorder is central to understanding the trade-offs among translucency, mechanical strength, and LTD resistance in dental zirconia. At a practical level, these atomic-scale insights may assist in the rational design of next-generation translucent zirconia materials for specific clinical demands. More broadly, the present findings suggest that highly translucent dental zirconia should be interpreted not as a simple c-phase-rich material but as a system in which yttria-dependent phase partitioning and local structural disorder together govern clinically relevant properties. Future studies integrating local structural analysis with processing parameters and long-term performance metrics will be essential to further translate these structure–property relationships into optimized dental restorative materials.
Author Contributions
K. Nakamura, contributed to conception and design, data acquisition, analysis, and interpretation, drafted and critically revised the manuscript; S. Shishido, contributed to acquisition and analysis, drafted and critically revised the manuscript; S. Barkarmo, P. Svanborg, contributed to interpretation, critically revised the manuscript; U. Örtengren, contributed to conception, data interpretation, critically revised the manuscript; K. Itoh, contributed to acquisition and interpretation, critically revised the manuscript; H. Sone, contributed to design, data acquisition and interpretation, critically revised the manuscript. All authors gave their final approval and agree to be accountable for all aspects of the work.
Supplemental Material
sj-docx-1-jdr-10.1177_00220345261446264 – Supplemental material for Synchrotron X-rays Uncover Crystalline Phase and Fine Structure of Zirconia
Supplemental material, sj-docx-1-jdr-10.1177_00220345261446264 for Synchrotron X-rays Uncover Crystalline Phase and Fine Structure of Zirconia by K. Nakamura, S. Shishido, S. Barkarmo, P. Svanborg, U. Örtengren, K. Itoh and H. Sone in Journal of Dental Research
Footnotes
Acknowledgements
The XRD and XAFS experiments were conducted at BL8S1 and BL11S2, respectively, at the Aichi Synchrotron Radiation Center, Aichi Science & Technology Foundation, Aichi, Japan (Proposal Nos. 202405051, 202406083, 202501019, and 202502044).
Declaration of Conflicting Interests
The authors declared the following potential conflicts of interest with respect to the research, authorship, and/or publication of this article: K. Nakamura and S. Shishido are members of an academia–industry collaboration laboratory at Tohoku University Graduate School of Dentistry, which receives funding from Luke Co., Ltd. (Sendai, Japan). This collaboration was examined and approved by the Conflict of Interest Management Committee at Tohoku University. Luke Co., Ltd. had no role in the study design, data collection and interpretation, or the decision to submit the work for publication. The other authors declared no potential conflicts of interest with respect to the research, authorship, and/or publication of this article.
Funding
The authors disclosed receipt of the following financial support for the research, authorship, and/or publication of this article: This study was partly supported by the Japan Society for the Promotion of Science (JSPS) KAKENHI, under Grant-in-Aid for Scientific Research (C) (grant 23K09267).
Data Availability
The raw X-ray diffraction (XRD) and X-ray absorption fine structure (XAFS) datasets, including the data underlying all figures and tables supporting the findings of this study, are publicly available in the Zenodo repository at ![]() . All data are provided in a format that enables reproduction of the analyses and figures reported in this article.
. All data are provided in a format that enables reproduction of the analyses and figures reported in this article.
A supplemental appendix to this article is available online.
References
Supplementary Material
Please find the following supplemental material available below.
For Open Access articles published under a Creative Commons License, all supplemental material carries the same license as the article it is associated with.
For non-Open Access articles published, all supplemental material carries a non-exclusive license, and permission requests for re-use of supplemental material or any part of supplemental material shall be sent directly to the copyright owner as specified in the copyright notice associated with the article.