
Abstract
This study evaluated the impact of the Soft Drinks Industry Levy (SDIL) on socioeconomic inequalities in hospital admissions for caries-related extractions in England. The study used monthly data on hospital admissions in NHS hospitals in England between March 2007 and December 2024 for 0- to 17-y-olds. Admission rates for caries-related extractions were standardised by population size (per 100,000 person-months) and stratified by area deprivation quintiles. The slope and relative indices of inequality (SII and RII) were used to evaluate the magnitude of the absolute and relative inequalities in admission rates by area deprivation. Admission rates for tonsillectomy were chosen as a negative control outcome. A segmented regression model was fitted with a parameterization that incorporated 4 key policy and contextual phases: SDIL announcement, implementation, COVID-19 lockdown, and postlockdown recovery. When the counterfactual and observed trends were compared, there were absolute reductions in the SII for caries-related extractions of 3.89 (95% CI: 2.38, 5.39) and 9.27 (95% CI: 7.15, 11.40) at 22 and 80 mo after implementation, corresponding to relative reductions of 9.16% (95% CI: 3.18, 15.13) and 25.54% (95% CI: 15.74, 35.34), respectively. There were also absolute reductions in the RII of 0.03 (95% CI: 0.01, 0.05) at 22 and 80 mo after implementation, corresponding to relative reductions of 13.52% (95% CI: 4.56, 22.48) and 12.74% (95% CI: 4.49, 20.99). No differences in SII or RII were observed for tonsillectomy admission rates. The introduction of the SDIL was associated with reductions in deprivation-related inequalities in admission rates for caries-related extractions among children in England.
Keywords
Introduction
The taxation of sugar-sweetened beverages (SSBs) is considered a cost-effective policy to address the burden of noncommunicable diseases (WHO 2023). Simulation studies suggest that taxing SSBs can reduce sugar intake, which in turn may reduce dental caries and the associated need for treatment (Hajishafiee et al 2023; Nguyen et al 2023; Lamloum et al 2025). Real-world evaluations of SSB taxes remain limited and yield mixed results. An evaluation of the effects of joint taxes on SSBs and energy-dense foods implemented in Mexico from January 2014 found immediate posttax reductions, followed by decreasing trends for the number of individuals having experienced dental caries (Hernandez et al 2021). However, an evaluation of the Philadelphia beverage tax, implemented in January 2017, found that it was not associated with reduced dental caries in the general population but was associated with reduced dental caries in low-income groups (ie, those on Medicaid; Petimar et al 2023).
The Soft Drinks Industry Levy (SDIL) was announced in England in March 2016 and came into effect in April 2018. The SDIL is a 2-tiered levy: drinks with ≥8 g of sugar per 100 mL are taxed at 24 pence per litre (higher-levy tier), while drinks with 5 to <8 g of sugar per 100 mL are taxed at 18 pence per litre (lower-levy tier). Drinks with <5 g of sugar per 100 mL are not levied (HM Government 2016). Unlike most SSB taxes that aim to increase the price for the end consumer (excise tax) to reduce demand (Hattersley and Mandeville 2023), the SDIL aims to incentivise manufacturers to reformulate soft drinks to move them from the higher- to lower-levy tier (Scarborough et al 2020). An evaluation of the impact of SDIL until February 2020 (ie, prepandemic period) found a relative reduction of 12.1% (95% CI: 7.2%, 17.0%) in hospital admissions for caries-related extractions in 0- to 18-y-olds, 22 mo after the SDIL was enforced. Reductions were seen in 0- to 4-y-olds and 5- to 9-y-olds but not in older children. Reductions were also seen in all 5 deprivation quintiles but the middle one (Rogers et al 2023c). Since dental caries disproportionately affect lower-income families, it is anticipated that the SDIL could help reduce social inequalities in dental caries. However, despite evidence of the levy’s impact on sugar purchases and obesity, its effect on inequalities in dental caries remains unknown.
This study provides a comprehensive long-term evaluation of the SDIL’s impact on socioeconomic inequalities in hospital admissions for caries-related extraction in England, extending the observation period until December 2024 to include pre– and post–COVID-19 pandemic years. By examining absolute and relative inequalities across area-based deprivation, this study not only updates existing evidence but also addresses critical gaps in understanding the long-term and equity effects of the SDIL.
Methods
A natural experiment design with a controlled interrupted time series (ITS) analysis was used to compare observed changes associated with the implementation of the SDIL against the counterfactual scenario of no implementation. This report adheres to recommendations for the design and analysis of ITS (Hudson et al 2019; Turner et al 2020) and the RECORD Statement (Reporting of Studies Conducted Using Observational Routinely-Collected Health Data; Benchimol et al 2015). This study did not require ethics approval. The study protocol was registered in the ISRCTN registry (ISRCTN17412377).
Data Source
This study used monthly data on hospital admissions in NHS hospitals in England between March 2007 and December 2024 for 0- to 17-y-olds from the Hospital Episode Statistics Admitted Patient Care database (Herbert et al 2017). Anonymised data were accessed through NHS England’s Secure Data Environment, following approval of a Data Access Request Service application. To comply with Secure Data Environment disclosure control rules, data were aggregated with monthly counts rounded to the nearest 5 for values ≥8 and suppressed for values <8.
The aggregated data contained 107 mo before the announcement, 25 mo between the announcement and implementation of the SDIL, and 80 mo after the implementation of the SDIL. A time series with a minimum 72 data points, one-third of which represent the postintervention period, was required to detect a small effect size (0.5) for the change in level or slope for the outcome, assuming a statistical power of 0.80 and autocorrelation between −0.40 and −0.90 (Zhang et al 2011).
Outcome Data
The primary outcome was hospital admissions for extraction of carious teeth, including all finished consultant episodes with a primary procedure code (OPSC-4) for surgical removal of a tooth (F09) or simple extraction of a tooth (F10) and a primary diagnosis code (ICD-10) for dental caries (K02.1, K02.5, K02.8, K02.9) or diseases of pulp and periapical tissues (K04.0, K04.5, K04.6, K04.7). Admissions for tonsillectomies (F34.1 to F34.9) were chosen as a negative control outcome (eg, an outcome that should not be affected by the SDIL), as they are a common reason for hospitalization among children who were affected by the lockdowns during the COVID-19 pandemic. Per our protocol, we planned to include ventilation support for asthma, appendicectomy, and removal of a foreign body from the nose or ear as negative control outcomes. Asthma was recently identified as an unexpected effect of the SDIL given the potential association between SSB and asthma symptoms (Rogers et al 2024b). The other 2 procedures had much lower admission rates than those for caries-related extractions.
Hospital admission rates were calculated per 100,000 person-months by dividing the monthly number of hospital admissions by the midyear population aged 0 to 17 y and multiplying the result by 100,000. Midyear population estimates were derived from census data published by the Office for National Statistics (Nomis 2025). Since midyear population estimates for 2023 and 2024 were not yet available, these were derived by linear extrapolation based on population data from preceding years. Admission rates were calculated for all 0- to 17-y-olds and stratified by quintiles of the 2019 Index of Multiple Deprivation at the level of Lower Super Output Areas.
From these data, the slope index of inequality (SII) and relative index of inequality (RII) were used to evaluate the magnitude of the absolute and relative inequalities in admission rates by area deprivation, respectively (WHO 2024). The SII reflects the absolute difference across the deprivation gradient, while the RII captures the proportional difference relative to the overall average. SII values >0 and RII values >1 indicate that admission rates are higher in more deprived areas, whereas SII values <0 and RII values <1 indicate that the admission rates are higher in less deprived areas (WHO 2024).
Statistical Analysis
ITS analysis was used to assess the short-term (1-22 mo after implementation) and long-term (46-80 mo) impacts of the SDIL on admissions rates and SII and RII values for the primary and negative control outcomes. A key analytic challenge was to disentangle the long-term impact of the SDIL from that of the COVID-19 lockdown restrictions. Hospital admissions decreased between March 2020 and July 2021 (Dobbs et al 2021; Elsherif et al 2021) but gradually recovered 6 mo after the lockdowns ended (Bosque-Mercader et al 2025). Thus, a segmented regression model was fitted with a parameterization (impact model) that incorporated 4 key policy and contextual phases: the SDIL announcement, implementation, COVID-19 lockdown, and postlockdown recovery (Wagner et al 2002; Xiao et al 2021). The model specification was as follows:

where
To assess the SDIL impact, the observed outcomes were compared against a counterfactual scenario; namely, the predicted trend had the preannouncement data (April 2007 to February 2016) continued without intervention. Absolute and relative differences between the observed and counterfactual values, along with 95% CIs via the delta method, were estimated at 22 and 80 mo postimplementation.
Model diagnostics were conducted to ensure validity. Stationarity was assessed by the Dickey-Fuller test. Autocorrelation was evaluated via the Durbin-Watson test and inspection of autocorrelation and partial autocorrelation plots. To account for autocorrelation residuals, the Prais-Winsten regression was employed (Bernal et al 2017; Bernal et al 2018). To account for seasonality, a forward stepwise approach (entry criterion, P < 0.05) was applied to the preannouncement data to determine which monthly dummy variables, with January as the reference month, should be included in each model. All analyses were carried out in Stata (StataCorp).
Results
Mean admission rates for caries-related extractions and tonsillectomies declined over time (Table 1). Absolute inequalities also narrowed for both outcomes, as indicated by mean SII values moving closer to 0. Relative inequalities remained largely stable for caries-related extractions but decreased for tonsillectomies, as indicated by mean RII values moving closer to 1.
Admission Rates and Absolute and Relative Inequalities for Caries-Related Extractions and Tonsillectomies.
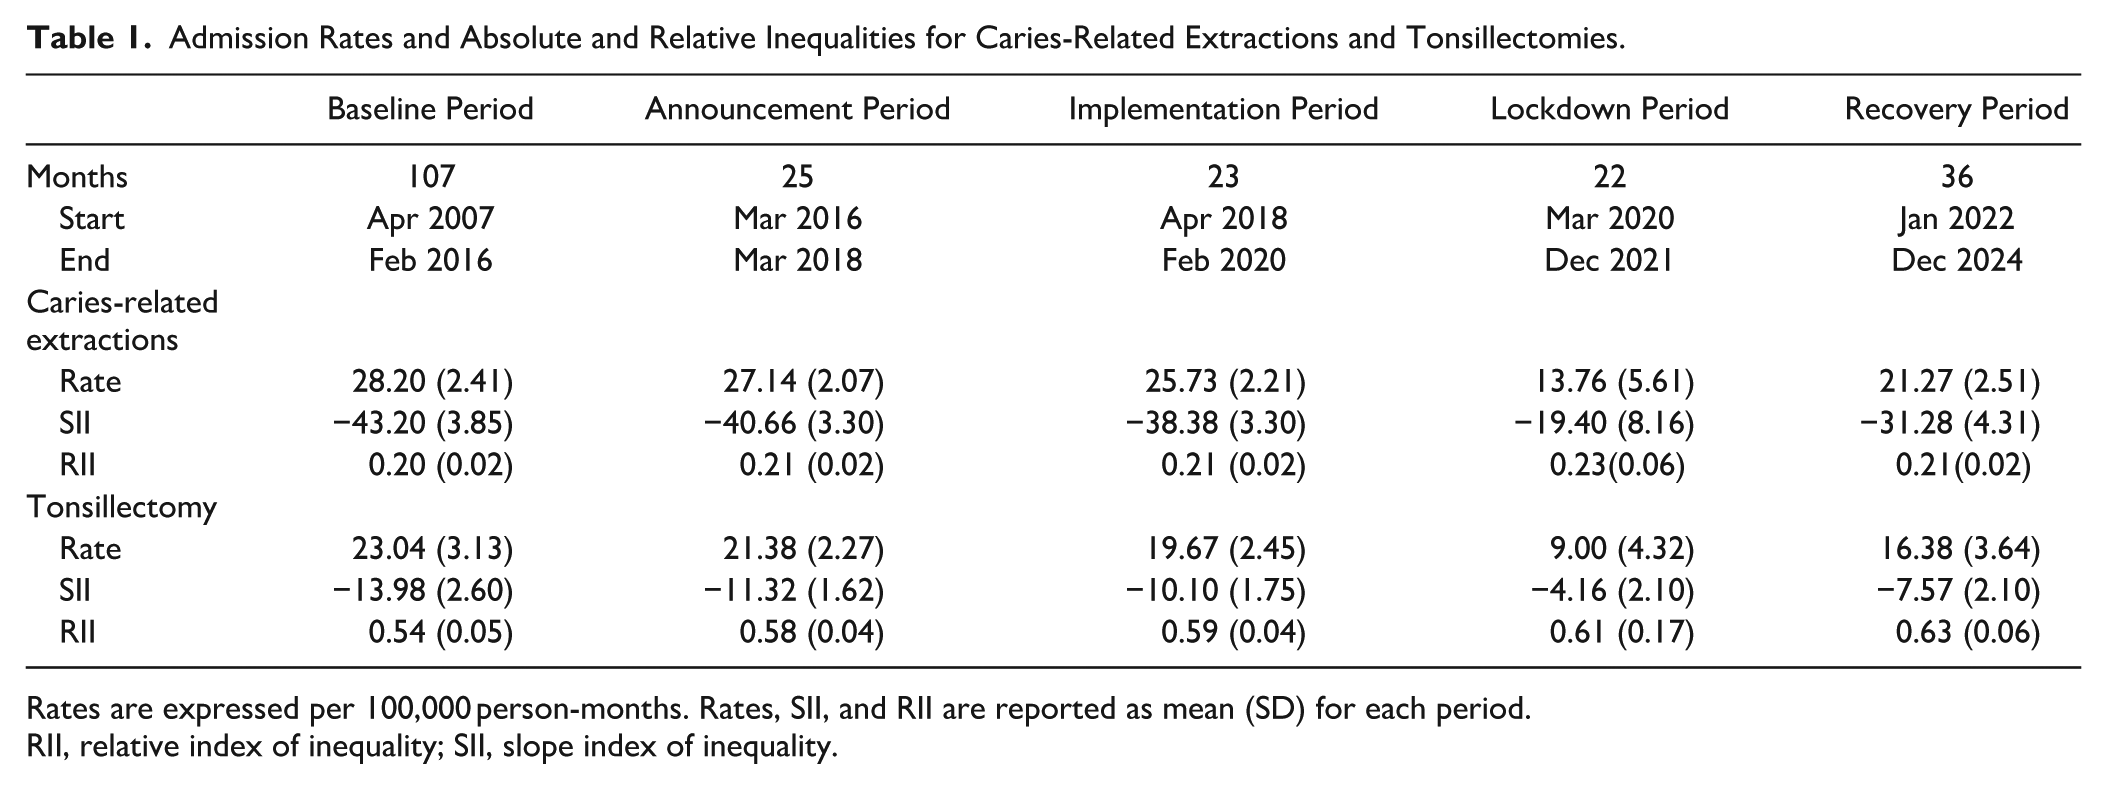
Rates are expressed per 100,000 person-months. Rates, SII, and RII are reported as mean (SD) for each period.
RII, relative index of inequality; SII, slope index of inequality.
The admission rate for caries-related extractions was 26.33 (95% CI: 25.66, 27.01) per 100,000 person-months at the start of the series, increasing by 0.02 (95% CI: 0.01, 0.03) units per month. When compared with these estimates, there was a decrease in level (–1.89; 95% CI: −3.17, −0.60) but no change in trend (–0.07; 95% CI: −0.16, 0.01) in the announcement period, no change in level (–2.22; 95% CI: −4.7, 0.26) or trend (–0.05; 95% CI: −0.14, 0.04) in the implementation period, and a decrease in level (–22.57; 95% CI: −29.44, −15.69) but no change in trend (0.04; 95% CI: −0.03, 0.10) in the recovery period (Table 2, Fig. 1). The model for tonsillectomy admission rates showed a decreasing trend during the implementation period as well as a lower rate and increasing trend during the recovery period. When the counterfactual trend (predicted from baseline) and observed trends (fitted values for the later phase) were compared, there were absolute reductions of 5.26 (95% CI: 3.75, 6.76) and 9.49 (95% CI: 7.37, 11.61) in admission rates for caries-related extractions at 22 and 80 mo after implementation, which corresponded to relative reductions of 17.43% (95% CI: 12.69%, 22.18%) and 34.72% (95% CI: 27.85%, 41.59%), respectively. However, no differences were observed in tonsillectomy admission rates (Table 3).
Models for the Impact of the Soft Drinks Industry Levy on Admission Rates and Absolute and Relative Inequalities in Admission Rates for Caries-Related Extractions and Tonsillectomies..
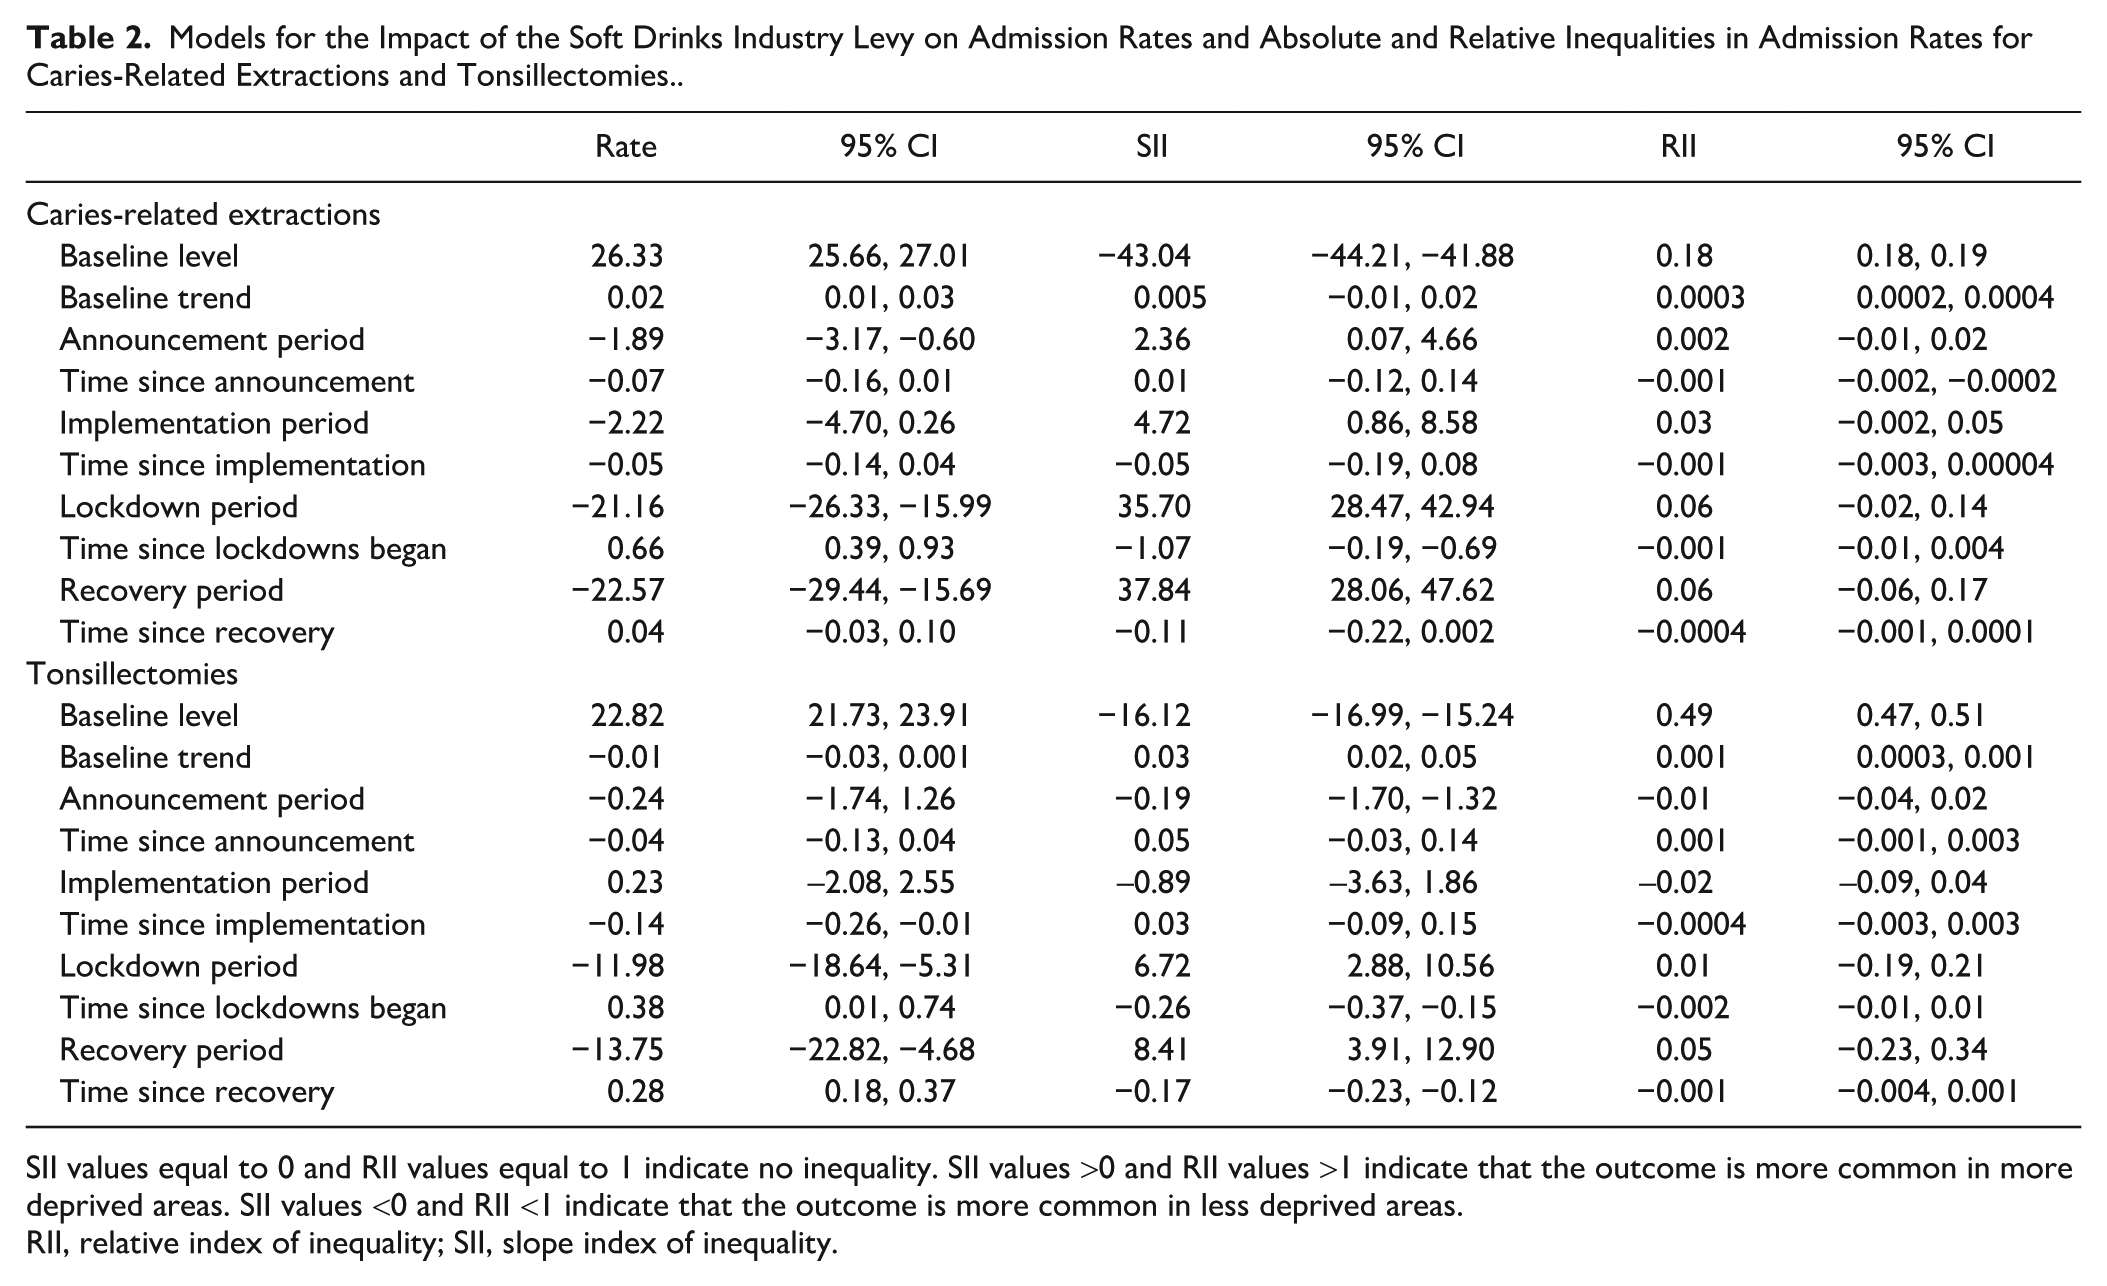
SII values equal to 0 and RII values equal to 1 indicate no inequality. SII values >0 and RII values >1 indicate that the outcome is more common in more deprived areas. SII values <0 and RII <1 indicate that the outcome is more common in less deprived areas.
RII, relative index of inequality; SII, slope index of inequality.
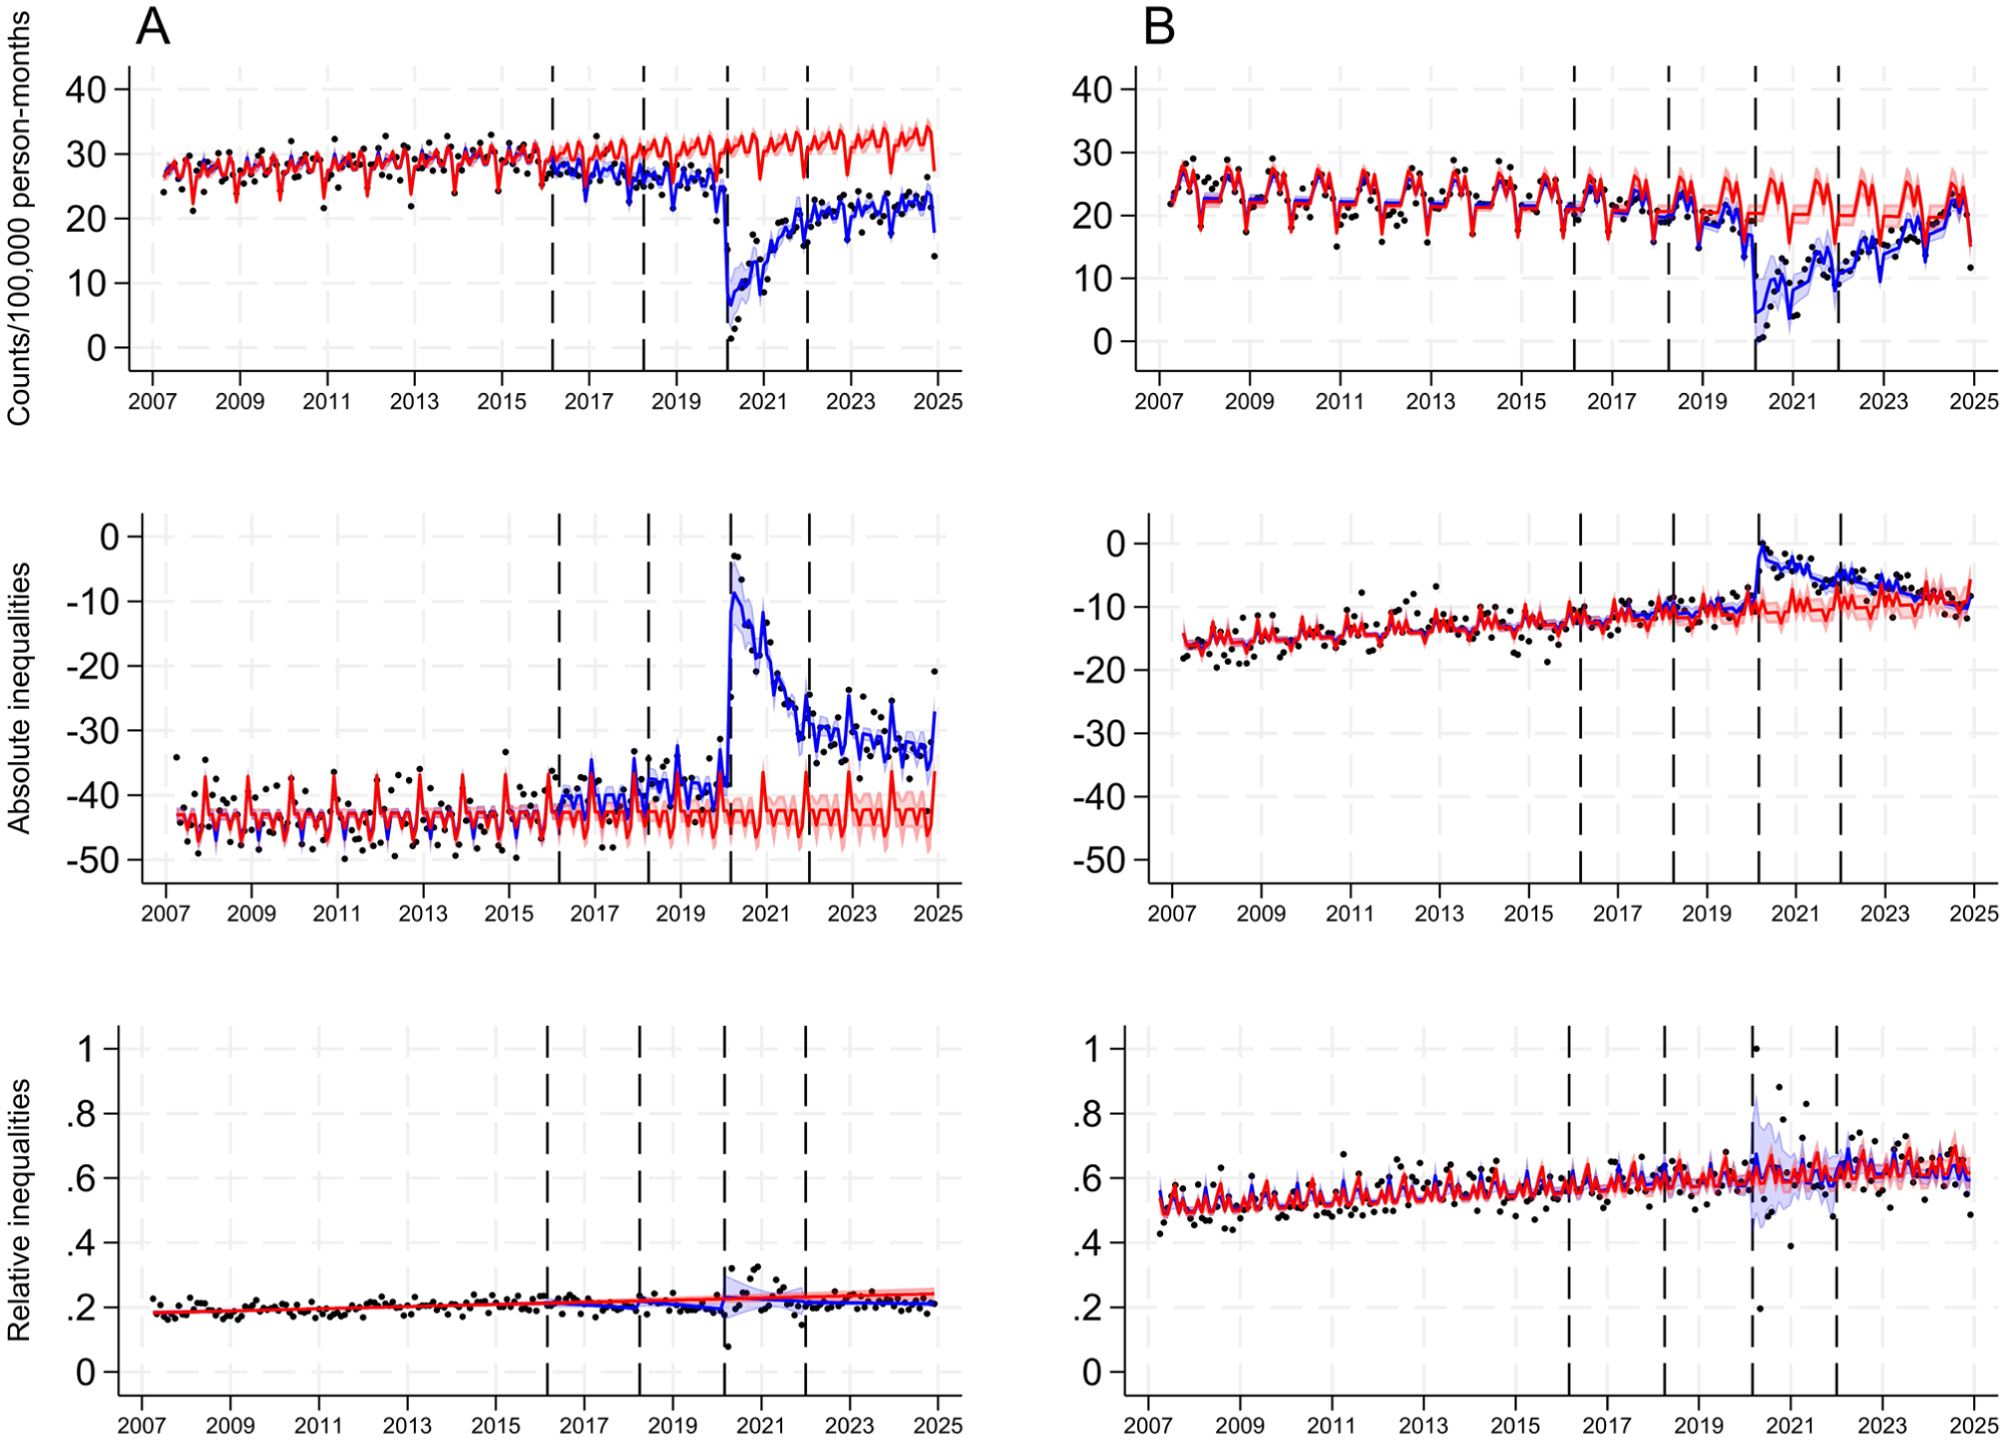
Admission rates per 100,000 person-months and absolute and relative deprivation-related inequalities in admission rates for caries-related extractions (A) and tonsillectomy (B) among 0- to 17-y-old children in England between April 2007 and December 2024. Absolute and relative inequalities were measured by the slope and relative indices of inequality. The black dots show the observed data; the blue line presents the predicted trend with 95% CI (blue shadow) fitted to the observed data; and the red line represents the counterfactual trend with 95% CI (red shadow) based on data from the preannouncement period. The 4 dashed vertical lines indicate the dates of announcement (March 2016), implementation (April 2018), and start (March 2020) and end (January 2022) of lockdowns.
Predicted Differences between the Counterfactual and Fitted Trends for Admission Rates and Absolute and Relative Inequalities in Caries-Related Extractions and Tonsillectomies 22 and 80 mo after Implementation of the Soft Drinks Industry Levy.
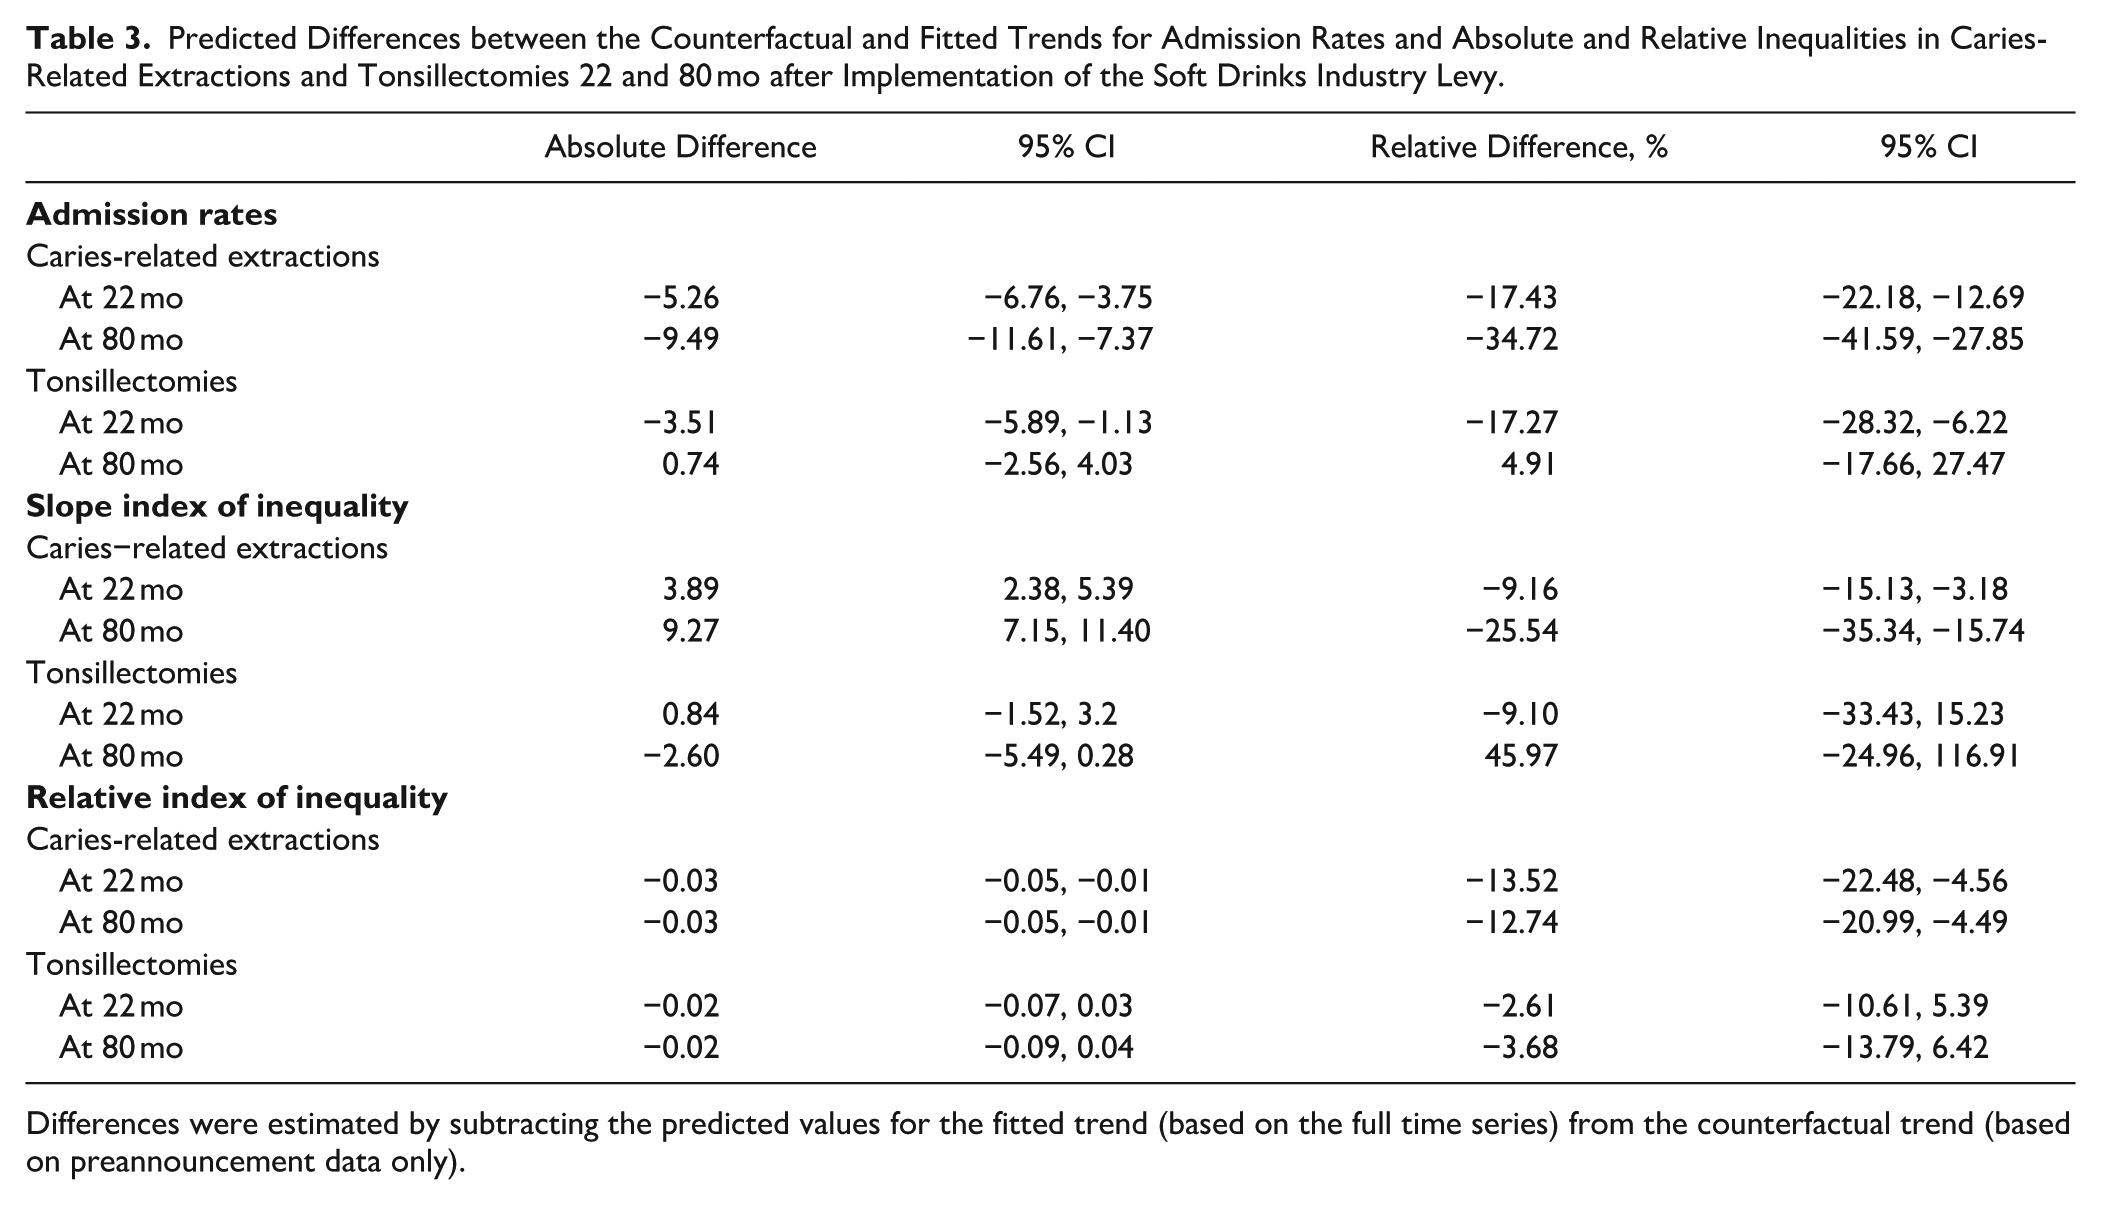
Differences were estimated by subtracting the predicted values for the fitted trend (based on the full time series) from the counterfactual trend (based on preannouncement data only).
The admission rate for caries-related extractions was −43.04 (95% CI: −44.21, −41.88) units lower in the least than most deprived quintile at the start of the series. However, the baseline trend was static (0.005; 95% CI: −0.01, 0.02). When compared with these estimates, there was a level increase (2.36; 95% CI: 0.07, 4.66), suggesting a narrowing of absolute inequalities (SII moved closer to 0), but no trend change (0.01; 95% CI: −0.12, 0.14) in the announcement period; a level increase (4.72; 95% CI: 0.86, 8.58) but no trend change (–0.05; 95% CI: −0.19, 0.08) in the implementation period; and a level increase (37.84; 95% CI: 28.06, 47.62) but no trend change (–0.11; 95% CI: 0.06, −0.22, 0.002) in the recovery period. The SII for tonsillectomy showed a level decrease in the announcement period (widening of inequalities) as well as a level increase (narrowing of inequalities) and decreasing trend (widening of inequalities) in the recovery period (Table 2, Fig. 1). When the counterfactual and observed trends were compared, there were absolute reductions in SII for caries-related extractions of 3.89 (95% CI: 2.38, 5.39) and 9.27 (95% CI: 7.15, 11.40) at 22 and 80 mo after implementation, which corresponded to relative reductions of 9.16% (95% CI: 3.18%, 15.13%) and 25.54% (95% CI: 15.74%, 35.34%), respectively. No differences were observed for tonsillectomies (Table 3).
The admission rate for caries-related extractions in the least deprived quintile was 18% (RII, 0.18; 95% CI: 0.18, 0.19) of the rate in the most deprived quintile at the start of the series. The RII increased by 0.0003 (95% CI: 0.0002, 0.0004) units per month, indicating a narrowing of relative inequalities in the baseline period (SII moved closer to 1). When compared with these estimates, there was no level change in RII (0.002; 95% CI: −0.01, 0.02) in the announcement period, but a decreasing trend was noted (–0.001; 95% CI: −0.002, −0.0002). No change in level (0.03, 95% CI: −0.002, 0.05) or trend (–0.001; 95% CI: −0.003, 0.00004) was observed in the implementation or the recovery period (0.06 [95% CI: −0.06, 0.17] for level; −0.0004 [95% CI: −0.001, 0.0001] for trend). The RII for tonsillectomies did not show any changes after the baseline period (Table 2, Fig. 1). Between the counterfactual and observed trends, there were absolute reductions in the RII of 0.03 (95% CI: 0.01, 0.05) at 22 and 80 mo after implementation, which corresponded to relative reductions of 13.52% (95% CI: 4.56%, 22.48%) and 12.74% (95% CI: 4.49%, 20.99%). No differences were observed in the RII for tonsillectomies (Table 3).
Discussion
We found that the introduction of the SDIL was associated with a marked decrease in admission rates for caries-related extractions. When compared with a counterfactual scenario (ie, the expected trend had the SDIL not being implemented), the admission rate in February 2020 (the month before the first lockdown) was 17% lower. By December 2024, this reduction had increased to 35%.
Previous evaluations support the hypothesised role of the SDIL in the sugars–caries relationship. Scarborough et al (2020) found that between the announcement and implementation of the SDIL, many manufacturers reformulated their products to reduce sugar content and avoid taxation. One year after implementation, purchases of higher-tier drinks fell by 37.8% per household per week, and the corresponding of sugar purchased in these drinks declined by 42.6%. Purchases of lower-tier drinks dropped even more sharply by 85.8%, accompanied by an 87.8% reduction in the sugar content of these drinks (Rogers et al 2023b). Overall, reductions in free sugar consumption from drinks alone were 3.0 g per child and 5.2 g per adult 11 mo after implementation (Rogers et al 2024a). Furthermore, 19 mo after implementation, the SDIL was associated with a 1.6% absolute reduction in childhood obesity prevalence, particularly among girls in school year 6 (10-11 year-olds) (Rogers et al 2023a).
On the basis of the best available dose–response data, Hajishafiee et al (2023) estimated that a 20% volumetric SSB tax would reduce free sugar intake by approximately 4.4 g/d in high-income countries and 4 g/d in low- and middle-income countries. This reduction is projected to lower childhood caries prevalence by 2.9% in high-income countries and 2.7% in low- and middle-income countries over a 10-y period. These estimates closely align with observed trends in England, thus providing further support for the impact of the SDIL on childhood caries and related treatment, including extractions.
The SDIL was associated with reductions in absolute and relative inequalities in caries-related extractions. When compared with the counterfactual, the SII decreased by 9% at 22 mo and 26% at 80 mo, while the RII declined by 14% and 13%, respectively. Our findings suggest that reductions in inequalities began soon after the SDIL was implemented in April 2018, although its early announcement in March 2016 likely triggered product reformulation and changes in consumption beforehand. To effectively reduce social inequalities in caries-related extractions, the SDIL would need to have a greater impact on children from more deprived areas. A previous evaluation found that the largest reductions in sugar purchases occurred in low-income households, which also had the highest pre-SDIL purchasing levels (Rogers et al 2025).
We are more confident in our estimates of the short-term impact of the SDIL than in those of the long-term impact, as the latter may be confounded by the effects of the COVID-19 lockdowns, which led to reduced hospital admissions during our assessment period (Dobbs et al 2021; Bosque-Mercader et al 2025). During the recovery period, reductions in admission rates and absolute (but not relative) inequalities were also observed for tonsillectomies, suggesting that the observed long-term effects may not be entirely attributable to the SDIL. However, tonsillectomy admission rates and absolute inequalities began to rise again during the recovery period, indicating a return to previous levels and pointing to a transient effect of the lockdown period. In contrast, these increasing trends were not seen for caries-related extractions. More important, no differences in tonsillectomy admission rates or socioeconomic inequalities from the counterfactual trend were observed 22 and 80 mo after the implementation of the SDIL.
It remains to be determined whether the reductions in area-level inequalities observed in this study are reflected across other key socioeconomic factors, such as family income, ethnicity, and rural/urban residence. In April 2023, the SDIL was extended to include packaged concentrates, which are mixed with sugar and diluted by a fountain machine to dispense a drink containing a total sugar content ≥5 g per 100 mL. Furthermore, Autumn Budget 2024 announced annual increases for the next 5 y in line with inflation (Watt and Marshman 2025). As the SDIL evolves over time, it will become necessary to carry out regular assessments of its impact to maintain effectiveness.
Some limitations of this study must be addressed. ITS analysis relies on the key assumptions that, absent the intervention, the outcome would have followed its established trend and that no other systematic changes or confounding events occurred at the same time as the intervention. Including a comparison group would have offered a stronger control for time-varying confounding. In the absence of an appropriate comparator, we used a negative control outcome that was not anticipated to be influenced by the SDIL. Although not ideal, the findings on tonsillectomy admission rates generally supported our hypothesis. However, without a nonintervention comparison group, we cannot rule out the possibility of residual confounding. Concurrent interventions or external factors, such as school-based preventive programmes or hospital budget constraints, may have contributed to the observed reduction in inequalities in hospital admissions and could have led to an overestimation of the SDIL’s impact. Nevertheless, we are not aware of any such concurrent events. The SDIL formed part of a broader government strategy to reduce sugar consumption (DHSC 2016), and most observed changes appear directly attributable to the SDIL (PHE 2019). Finally, we used hospital admissions for caries-related extractions as the primary outcome due to the absence of equivalent time series data on caries prevalence. National child dental health surveys in England are conducted only once every 10 y (most recently in 2013), limiting their utility for ITS analysis. While extractions reflect only the most severe cases, they serve as a robust and consistently recorded population-level indicator (OHID 2022). Further research is needed to assess the SDIL’s impact across the full distribution of caries.
Conclusion
The introduction of the SDIL was associated with a reduction in admission rates for caries-related extractions among 0- to 17-y-olds in England, as well as a narrowing of socioeconomic inequalities in these rates by area deprivation. While these findings are consistent with the hypothesised impact of the SDIL, they should be interpreted cautiously given the absence of direct measures of sugar intake and caries incidence.
Author Contributions
C.C. Salomon-Ibarra, contributed to acquisition, analysis, and interpretation, drafted and critically revised the manuscript; J. Wu, V. Toffolutti, contributed to design, critically revised the manuscript; E. Bernabe, contributed to conception and design, data acquisition, analysis, and interpretation, drafted and critically revised the manuscript. All authors gave their final approval and agreed to be accountable for all aspects of the work.
Footnotes
Declaration of Conflicting Interests
The authors declared no potential conflicts of interest with respect to the research, authorship, and/or publication of this article.
Funding
The authors disclosed receipt of the following financial support for the research, authorship, and/or publication of this article: This study is funded by the NIHR (Public Health Research; NIHR159649). The views expressed are those of the authors and not necessarily those of the NIHR or the Department of Health and Social Care.
Data Availability Statement
Data were obtained through NHS England’s Secure Data Environment under a data-sharing agreement with NHS Digital, which is subject to specific conditions of use. Any requests for data access should be directed to NHS Digital, as the authors do not have the authority to grant access.