
Abstract
The World Health Organization (WHO) recommends reducing free sugar intake (FSI) to below 10%, and ideally below 5%, of the estimated energy requirement (EER) to prevent noncommunicable diseases, including dental caries. Little progress has been made in lowering FSI to reduce early childhood caries (ECC) over the past few decades. Although sugar’s impact on health is well established, no studies have quantified the extent to which reducing FSI to these thresholds would reduce decayed, missing, and filled surfaces (dmfs) scores. Data from 2,182 Australian children in the SMILE birth cohort were analyzed using G-computation analysis to estimate counterfactual dmfs if FSI at age 2 y had been reduced below 10% or 5% of the EER. A dose-response analysis using restricted cubic splines was also conducted to empirically assess thresholds by modeling dmfs at age 5 y as a function of continuous FSI. The G-computation results indicate that, in the general preschool population, reducing FSI to less than 10% or 5% of the EER would result in an absolute reduction (AR) in dmfs of 1.3 and 1.5, respectively, corresponding to attributable fractions among the exposed (AFE) of 84% and 97%. Among high-risk children, the estimation impact is even greater, with ARs in dmfs of 4.4 to 4.5 and AFEs ranging from 75% to 99%. The dose-response analysis identified an empirical threshold of approximately 6.25 g/d, equivalent to 2.5% of the EER, where dmfs began to increase most steeply, which is lower than the WHO cutoffs. These findings underscore the importance of reducing FSI to below 10% of the EER for all children and suggest a target below 5% for high-risk groups. The results offer evidence to support clinical guidance and population-level interventions to lower FSI in early childhood. Future research should test these findings in diverse sociocultural settings, including children and adults in low- and middle-income countries, to strengthen the evidence for global dietary sugar-reduction policies.
Keywords
Introduction
Early childhood caries (ECC) represents a significant global public health challenge, affecting approximately 48% of children worldwide (Uribe et al 2021). Free sugar intake (FSI), a critical factor causing dental caries (Moynihan and Kelly 2014), has been identified as an important mediator in the socioeconomic status (SES)–ECC pathway (Dao et al 2025b), accounting for 52% of the total effect. A 1-unit SES increase corresponded to a 6% reduction in ECC risk via FSI (Dao et al 2025b). Reducing FSI is recommended to reduce not only levels of dental caries (World Health Organization [WHO] 2015) but also diminish the level of inequality in dental health (Dao et al 2025a).
The WHO recommends limiting FSI to less than 10% of the total estimated energy requirement (EER), with further reductions below 5% providing additional health benefits such as reducing levels of noncommunicable diseases, including dental caries (WHO 2015). However, robust evidence supporting these thresholds remains limited (Yan and Louie 2023). The <10% EER recommendation was based on a systematic review of 8 longitudinal studies that mainly assessed associations rather than causal effects (WHO 2015; Moynihan 2016; Dao et al 2024), while the <5% EER guideline relied on very-low-quality evidence from ecological studies (WHO 2015). None of these studies quantified the extent of reduction, a critical component for clear guidance, nor provided tangible estimates of FSI reduction benefits (Yan and Louie 2023). Furthermore, most evidence focuses on sugar-sweetened beverages (SSBs), with limited data on FSI from all food sources (Yan and Louie 2023).
In the Australian context, little progress has been made in reducing FSI levels. Between 2007 and 2012, the proportion of children consuming FSI exceeding the WHO-recommended thresholds of <10% and <5% of total energy intake declined only slightly, from more than 68.0% and 98.0% in 2007 (Louie et al 2016) to 60.6% and 93.4% in 2011 to 2012, respectively (Lei et al 2016). Similarly, caries prevalence among 5- to 6-y-olds declined by less than 10.0% during this period (Mejia et al 2012), with 34.3% of Australian preschoolers still experiencing caries (Do et al 2016).
To strengthen global evidence supporting WHO’s FSI thresholds and to inform strategies for reducing FSI among Australian children, it is essential to generate robust causal evidence addressing existing knowledge gaps. Using data from the Study of Mothers’ and Infants’ Life Events Affecting Oral Health (SMILE) birth cohort, this study applies a causal inference framework to evaluate the potential impact of targeting FSI reduction on ECC.
Specifically, G-computation was used to estimate the potential effect of reducing FSI at age 2 y on the occurrence of ECC at age 5 y in the overall population of preschool children. In addition, an exploratory subgroup analysis was conducted to examine the effect within a high-risk population, defined as children who exceeded the recommended FSI threshold by age 2 and developed ECC by age 5.
Methods
This study conformed to the guidelines for Strengthening the Reporting of cohort studies in Epidemiology (von Elm et al 2007). It also incorporated the target trial framework for causal inference using observational data (Hernan et al 2025).
Data Source
The SMILE is a longitudinal observational study that recruited mother–child dyads from 3 main hospitals in Adelaide between 2013 and 2014. It was funded by National Health and Medical Research Council (NHMRC) Project Grant #1046219 (2013 to 2016) and conducted with the approval of ethical research committees (Do et al 2014). A total of 2,182 children were recruited at baseline and followed up at 3, 6, 12, 24, and 60 mo with informed consent. For this study, FSI at age 2, dental caries at age 2 and 5, and plaque index at age 2 and 5 were analyzed using only completed relevant data.
Study Design
The analysis addresses the research question by quantifying the reduction in dental caries resulting from lowering FSI to below 10% and 5% of the EER through 2 populations: (1) general preschoolers and (2) the high-risk subgroup, children who exceeded the recommended FSI threshold by age 2 and developed ECC by age 5. For the general population, it estimates the change in dmfs scores at age 5 if the entire preschool population had reduced their FSI intake from ≥10% or ≥5% to below these thresholds. For the high-risk subgroup, it assesses how their dmfs scores would have differed had their FSI been reduced below 10% or 5%.
A causal inference approach using g-computation was applied in 3 stages (Snowden et al 2011). In the first stage, a regression model was fitted to predict the effect of exposure (FSI at age 2) on the outcome (ECC at age 5). The second stage estimates 2 counterfactual outcome values, derived by conditioning on the presence or absence of the risk factor/exposure across the entire study population, based on the model’s parameters fit in the first stage. In the third stage, the change in the outcome was estimated by comparing these 2 counterfactual outcome values. The absolute reduction (AR) represented the magnitude of change, while the attributable fraction among the exposed (AFE) was calculated by dividing the AR by the dmfs scores of the population exposed to the risk factor at age 2 (Fig. 1).
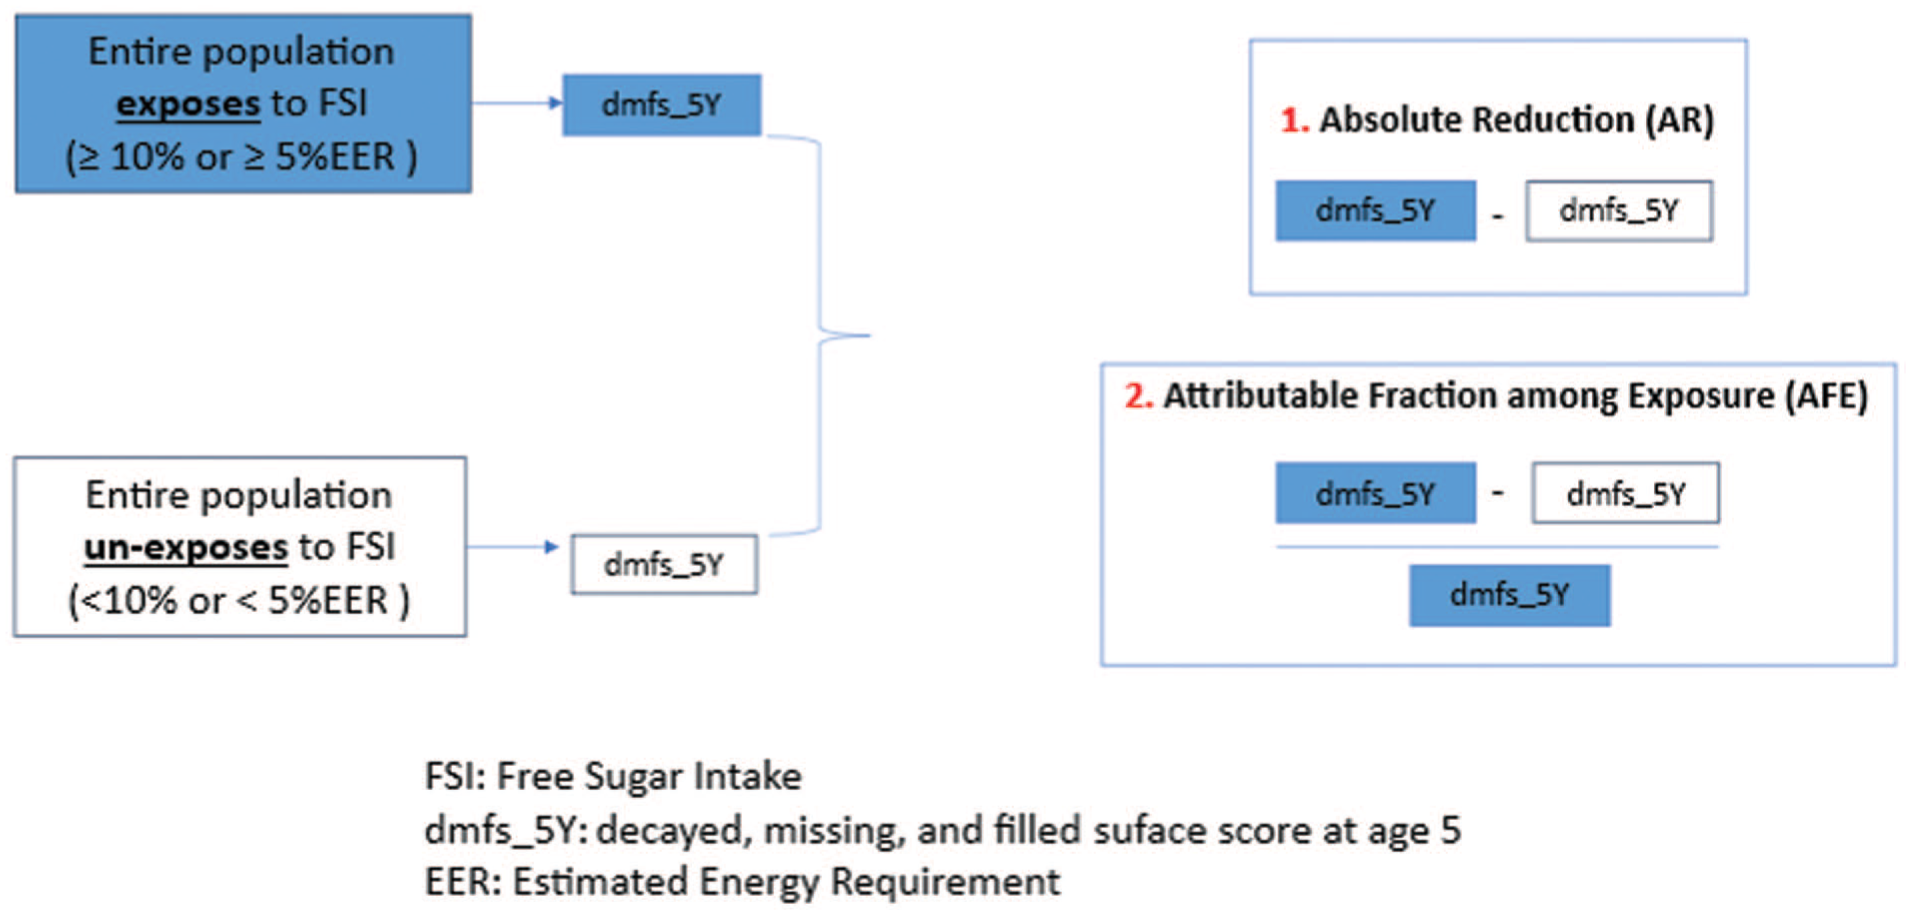
Counterfactual framework for G-computation analysis.
Measurements
Outcome: ECC
ECC is defined as the presence of 1 or more carious lesions, white spot lesions, tooth loss due to caries, or filled surfaces due to caries in the primary teeth of a child younger than 6 y (WHO). ECC was evaluated through oral epidemiological examinations conducted by trained dental examiners following a standardized protocol when the children turned 2 and 5 y of age. For each child, any tooth surface affected by decay (cavitated or noncavitated), missing due to caries, or filled was recorded and assigned a single score. The cumulative score, known as the score of decayed, missing, and filled surfaces (dmfs score) (Do et al 2020), was used to create a continuous ECC variable at age 5 y.
Exposure: FSI
FSI is defined as the consumption of any type of sugar added to foods and beverages. This includes Sugar-Sweetened Beverages (SSBs) such as fruit-based and milk-based sweetened drinks and 100% fruit juices, as well as confectionery, cakes, biscuits, sweetened cereals, sweet desserts, sucrose, honey, syrups, and preserves. It does not include naturally occurring sugars found in fruits, vegetables, and milk (WHO 2015).
At age 2 y, FSI was assessed using 89-item Food Frequency Questionnaire (FFQ), whose repeatability and validity were evaluated against 24-h dietary recalls (Devenish et al 2017; Devenish et al 2019). FSI values were extracted from these food items and converted into milligrams per day (mg/day) as a continuous variable, and outliers exceeding the 99th percentile were excluded due to the highly right-skewed distribution.
For G-computation analysis, the continuous FSI variable was categorized into a binary variable, 1 (≥10% or ≥5% of EER) and 0 (<10% or <5% of EER). Based on the Nutrient Reference Values for Australia and New Zealand Including Recommended Dietary Intakes Australia, the daily total EER is 4,200 kJ for girls and 4,400 kJ for boys (NHMRC et al 2006). Given that 17 kJ is equivalent to 1 g of free sugar, 10% of EER corresponds to 24.7 g/d for girls and 25.9 g/d for boys. Similarly, the 5% threshold corresponds to 12.4 g/d for girls and 12.9 g/d for boys. These thresholds were used to create the binary FSI variables for the analysis.
Confounders
SES at baseline (Dao et al 2024; Dao et al 2025b), ECC at age 2 y (Lin et al 2021), gender (Ferraro et al 2010; Ra and Park 2022), dental visits pattern (Andrew et al 2021) during the first 5 y, and plaque index at ages 2 and 5 y (Marsh 2010) were identified as potential confounding variables. These 6 factors were therefore included in the analysis to control for confounding (Fig. 2).
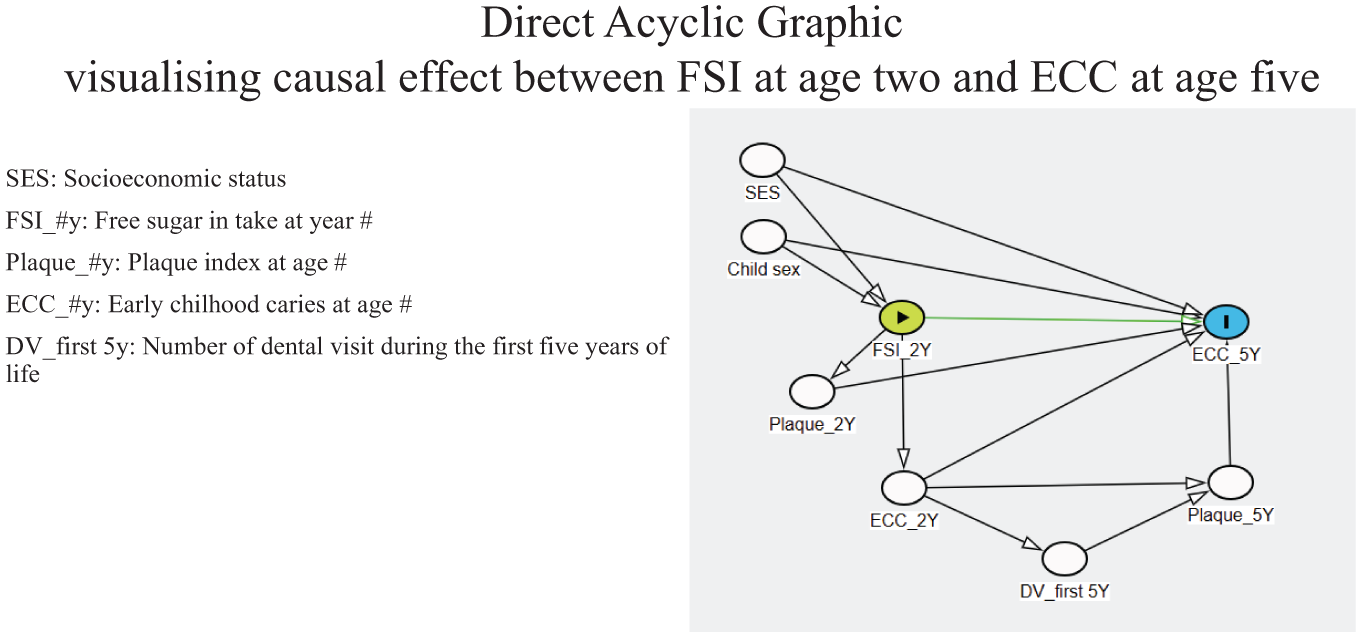
Direct acyclic graphic: visualizing the causal effect of free sugar intake (FSI) at age 2 y on early childhood caries (ECC) at age 5. DV, dental visit; SES, socioeconomic status.
SES is defined as one’s access to social-economic resources across various dimensions (Antonoplis 2023). It is measured through multiple dimensions and considered a covariate for the causal relationship between FSI and ECC. In this study, SES was represented using a composite created by Dao et al through a hybrid approach (Dao et al 2025a), described in detail elswhere. In brief detail, at baseline, mothers or caregivers answered 21 SES-related questions, focusing on 12 SES indicators. Of these, 11 were potentially relevant and were used as inputs for principal component analysis (PCA) to create the SES composite. This composite was generated by summing the standardized values of the 5 significant loading indicators, family education, work, occupation, income, and health insurance, from the first PCA component, each weighted for its loading value. The composite was used as a continuous SES variable measured by the standardized score.
ECC experience at age 2 y was obtained by a clinical exam and described above. Plaque presence was assessed during the oral clinical examinations at ages 2 and 5 y and was classified into 4 categories: 0, no plaque; 1, thin plaque detected with dental probing; 2, visible plaque without probing; and 3, abundant plaque (Do et al 2020). The plaque variable was then treated as a binary variable, with the first 2 categories defined as “invisible plaque” and the latter two as “visible plaque.” Dental visit pattern was assessed through a survey administered when the child turned 5 y. Parents were asked to list all dental visits during their child’s first 5 y. The total number of dental visits was calculated by summing all reported visits (Do et al 2020).
Statistical Analyses
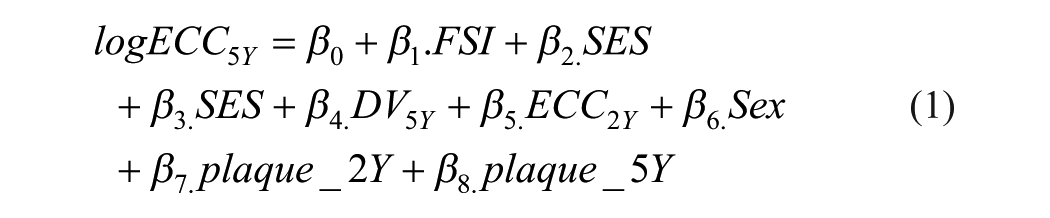
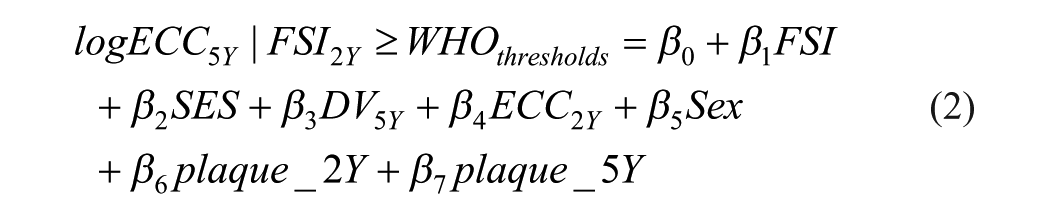
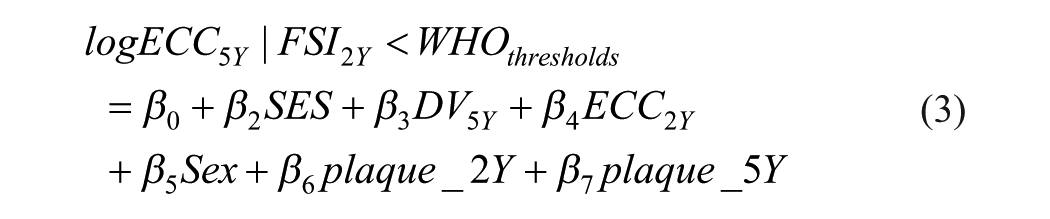
The model was fitted using a negative binomial regression in Stata (nbreg) (UCLA 2024), as dmfs is count data and exhibits overdispersion (variance greater than the mean) (equation 1). Based on the model coefficients, counterfactual dmfs values at age 5 y corresponding to FSI levels of ≥10% versus <10% and ≥5% versus <5% were estimated as log-transformed values, following equations 2 and 3, respectively. The comparison reduction or change in dmfs score at age 5 y was first estimated by using log-transformed dmfs values. The AR in the observed dmfs scores was then calculated by exponentiating the changes in the log values given the real values have skew distributions (equation 4), while the proportion of reduction or the AFE was determined by dividing the AR by the dmfs score for individuals exposed to FSI ≥10% or 5% of the EER, as presented in equation 5.
A command nbreg was first fitted without adjusting for confounding factors. It was then adjusted for SES and, finally, for all 6 potential confounders. The final model was selected based on the values of the Akaike information criterion (AIC) and the Bayesian information criterion (BIC). The AIC penalizes the number of parameters to prevent overfitting and is based on information theory. BIC also penalizes model complexity but does so more strongly, as it incorporates sample size into the penalty term. The model with the lowest AIC and BIC was considered the best-fitting model and was selected for estimating counterfactual values in the G-computation approach, following the general rule of thumb (Pham 2019).


Converting continuous FSI into a binary variable for G-computation results in some loss of granularity. However, this tradeoff reflects real-world public health recommendations (<10% EER) and facilitates the translation of our findings into actionable intervention scenarios. To balance this limitation and empirically assess WHO recommended thresholds, we conducted a dose–response analysis (Steenland and Deddens 2004) using restricted cubic splines functions with 4 knots at placed at the 5th, 35th, 65th, and 95th percentiles of the FSI distribution, modeling dmfs at age 5 as a function of continuous FSI.
Results
Of 2,182 children recruited at baseline, 879 completed clinical examination at age 5 y (Appendix Fig. 1). The completers were more likely have higher SES than those who dropped out before age 5 (Appendix Table 1).
The distributions of study variables including exposure FSI at age 2 y, dmfs at age 5 y, covariate SES at baseline, and 5 confounders are presented in Table 1. Of the 2,182 recruited children, response rates varied across these variables: 1,047 provided data for 89 FFQ items asking about FSI (excluding 10 cases provided values exceeded 99th percentile), 1,878 responded to all 21 SES items at baseline, 824 had information on the number of dental visits in the first 5 y, and 1,394 had data on gender. For clinical examinations, dmfs scores were recorded for 1,040 children at age 2 y and 879 at age 5 y, while plaque index measurements were available for 1,041 and 866 children, respectively.
Distribution of the Study Variables.
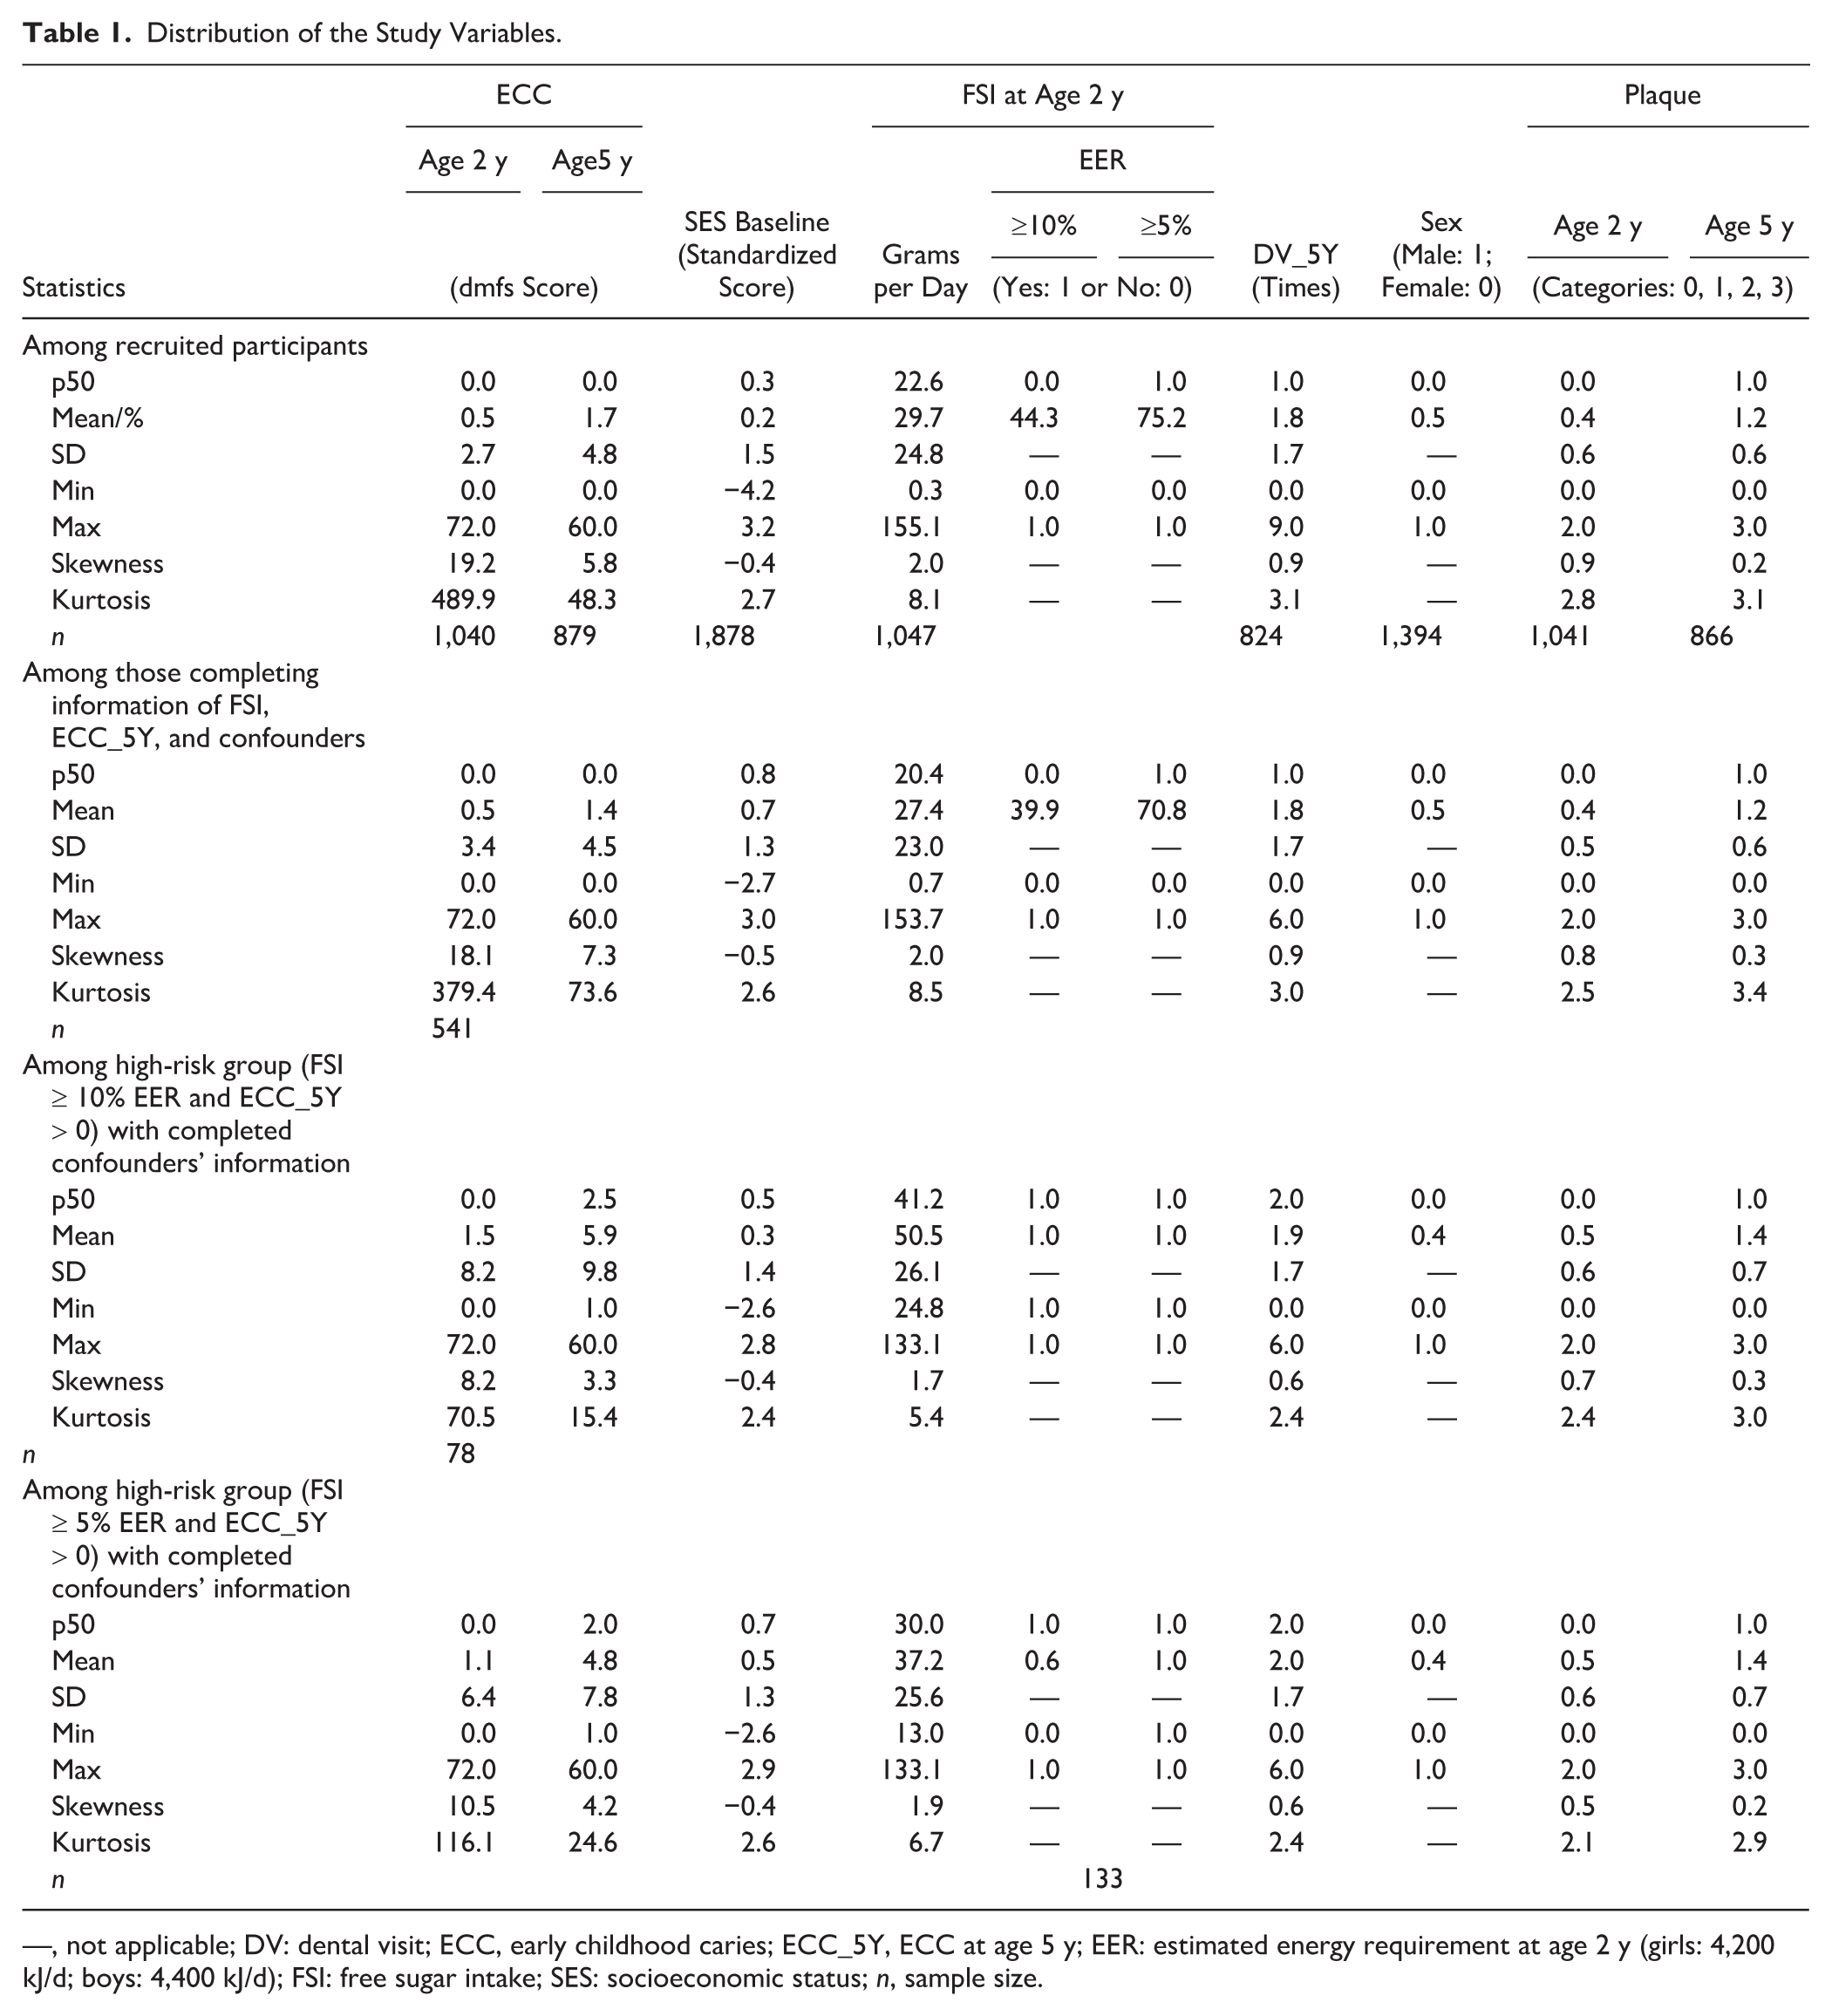
—, not applicable; DV: dental visit; ECC, early childhood caries; ECC_5Y, ECC at age 5 y; EER: estimated energy requirement at age 2 y (girls: 4,200 kJ/d; boys: 4,400 kJ/d); FSI: free sugar intake; SES: socioeconomic status; n, sample size.
Of 1,047 children having FSI measured at age 2 y via the 89 FFQ items, their FSI distribution showed a right-skewed distribution (Appendix Fig. 2a) with a median intake of 22.6 g/d. Of these children, 464 (44.3%) and 787 (75.2%) reported having an FSI exceeding the 10% and 5% of the EER, respectively (Table 1), with no significant FSI difference between boys and girls (Appendix Table 2). The ECC score distribution at age 5 y was also right skewed (Appendix Fig. 2b), with a median of 0 and a range of 0 to 60.0, with 32.5% of children experiencing ECC age 5 y. In contrast, SES distribution at baseline was approximately normal (Appendix Fig. 2c).
A total of 541 children had completed data for FSI at age 2 y and dmfs at age 5 y, SES at baseline, and 5 potential confounders. Within this subgroup, the high-risk population was defined as follows: 78 children who consumed FSI exceeding 10% of EER and experienced ECC at age 5 y or 133 children who consumed FSI exceeding 5% of EER and experienced ECC at age 5 y.
FSI levels at age 2 and dmfs levels at age 5 among the 541 children were comparable with those of the overall sample. However, among the high-risk population, FSI levels were nearly double those of the overall study sample, with a median of 41.2 g/d for children consuming ≥10% of EER and 1½ times higher, with a median of 30 g/d, for those consuming ≥5% of EER. Similarly, dmfs levels of the high-risk group were substantially higher than those observed in the overall study sample.
Negative bionomial regression (nbreg), estimating the effects of FSI at age 2 y on dmfs at age 5 y, both with and without adjustment for confounders, were conducted. The fully adjusted model, which included all 6 confounders, showed the best fit, as indicated by the lowest AIC and BIC values (Appendix Table 3). Consuming FSI at levels ≥10% or ≥5% of EER significantly increased dmfs at age 5 y. Specifically, children consuming FSI ≥10% or ≥5% of EER had dmfs scores nearly 0.5 units higher compared with those consuming FSI below these thresholds (Appendix Table 4).
The results of dmfs score reduction for the general and high-risk populations are presented in Tables 2 and Table 3, respectively. Findings consistently show that if either the general population or the high-risk population reduced their FSI intake from ≥10% of EER to below this threshold, the mean difference in dmfs score at age 5 y would decrease by 1.3 or 4.4, representing approximately an 84% or 75% dmfs reduction among exposure group, respectively, compared with when the population consumes ≥10% of EER. Notably, if FSI intake were reduced to below 5% of EER, the dmfs score at age 5 y would decrease by 1.5 or 4.7, corresponding to nearly a 97% or 99% reduction, respectively, compared with when the population consumes ≥5% of EER. The dose-response analysis revealed an empirical threshold of FSI at ~6.25 g/d (≈2.5% of EER) where dmfs began to increase most steeply, which is lower than the WHO 5% cutoff (Appendix Fig. 3).
Change in dmfs Score among the General Population when FSI Changed from ≥10% to Less than 10% or from ≥5% to Less than 5%.
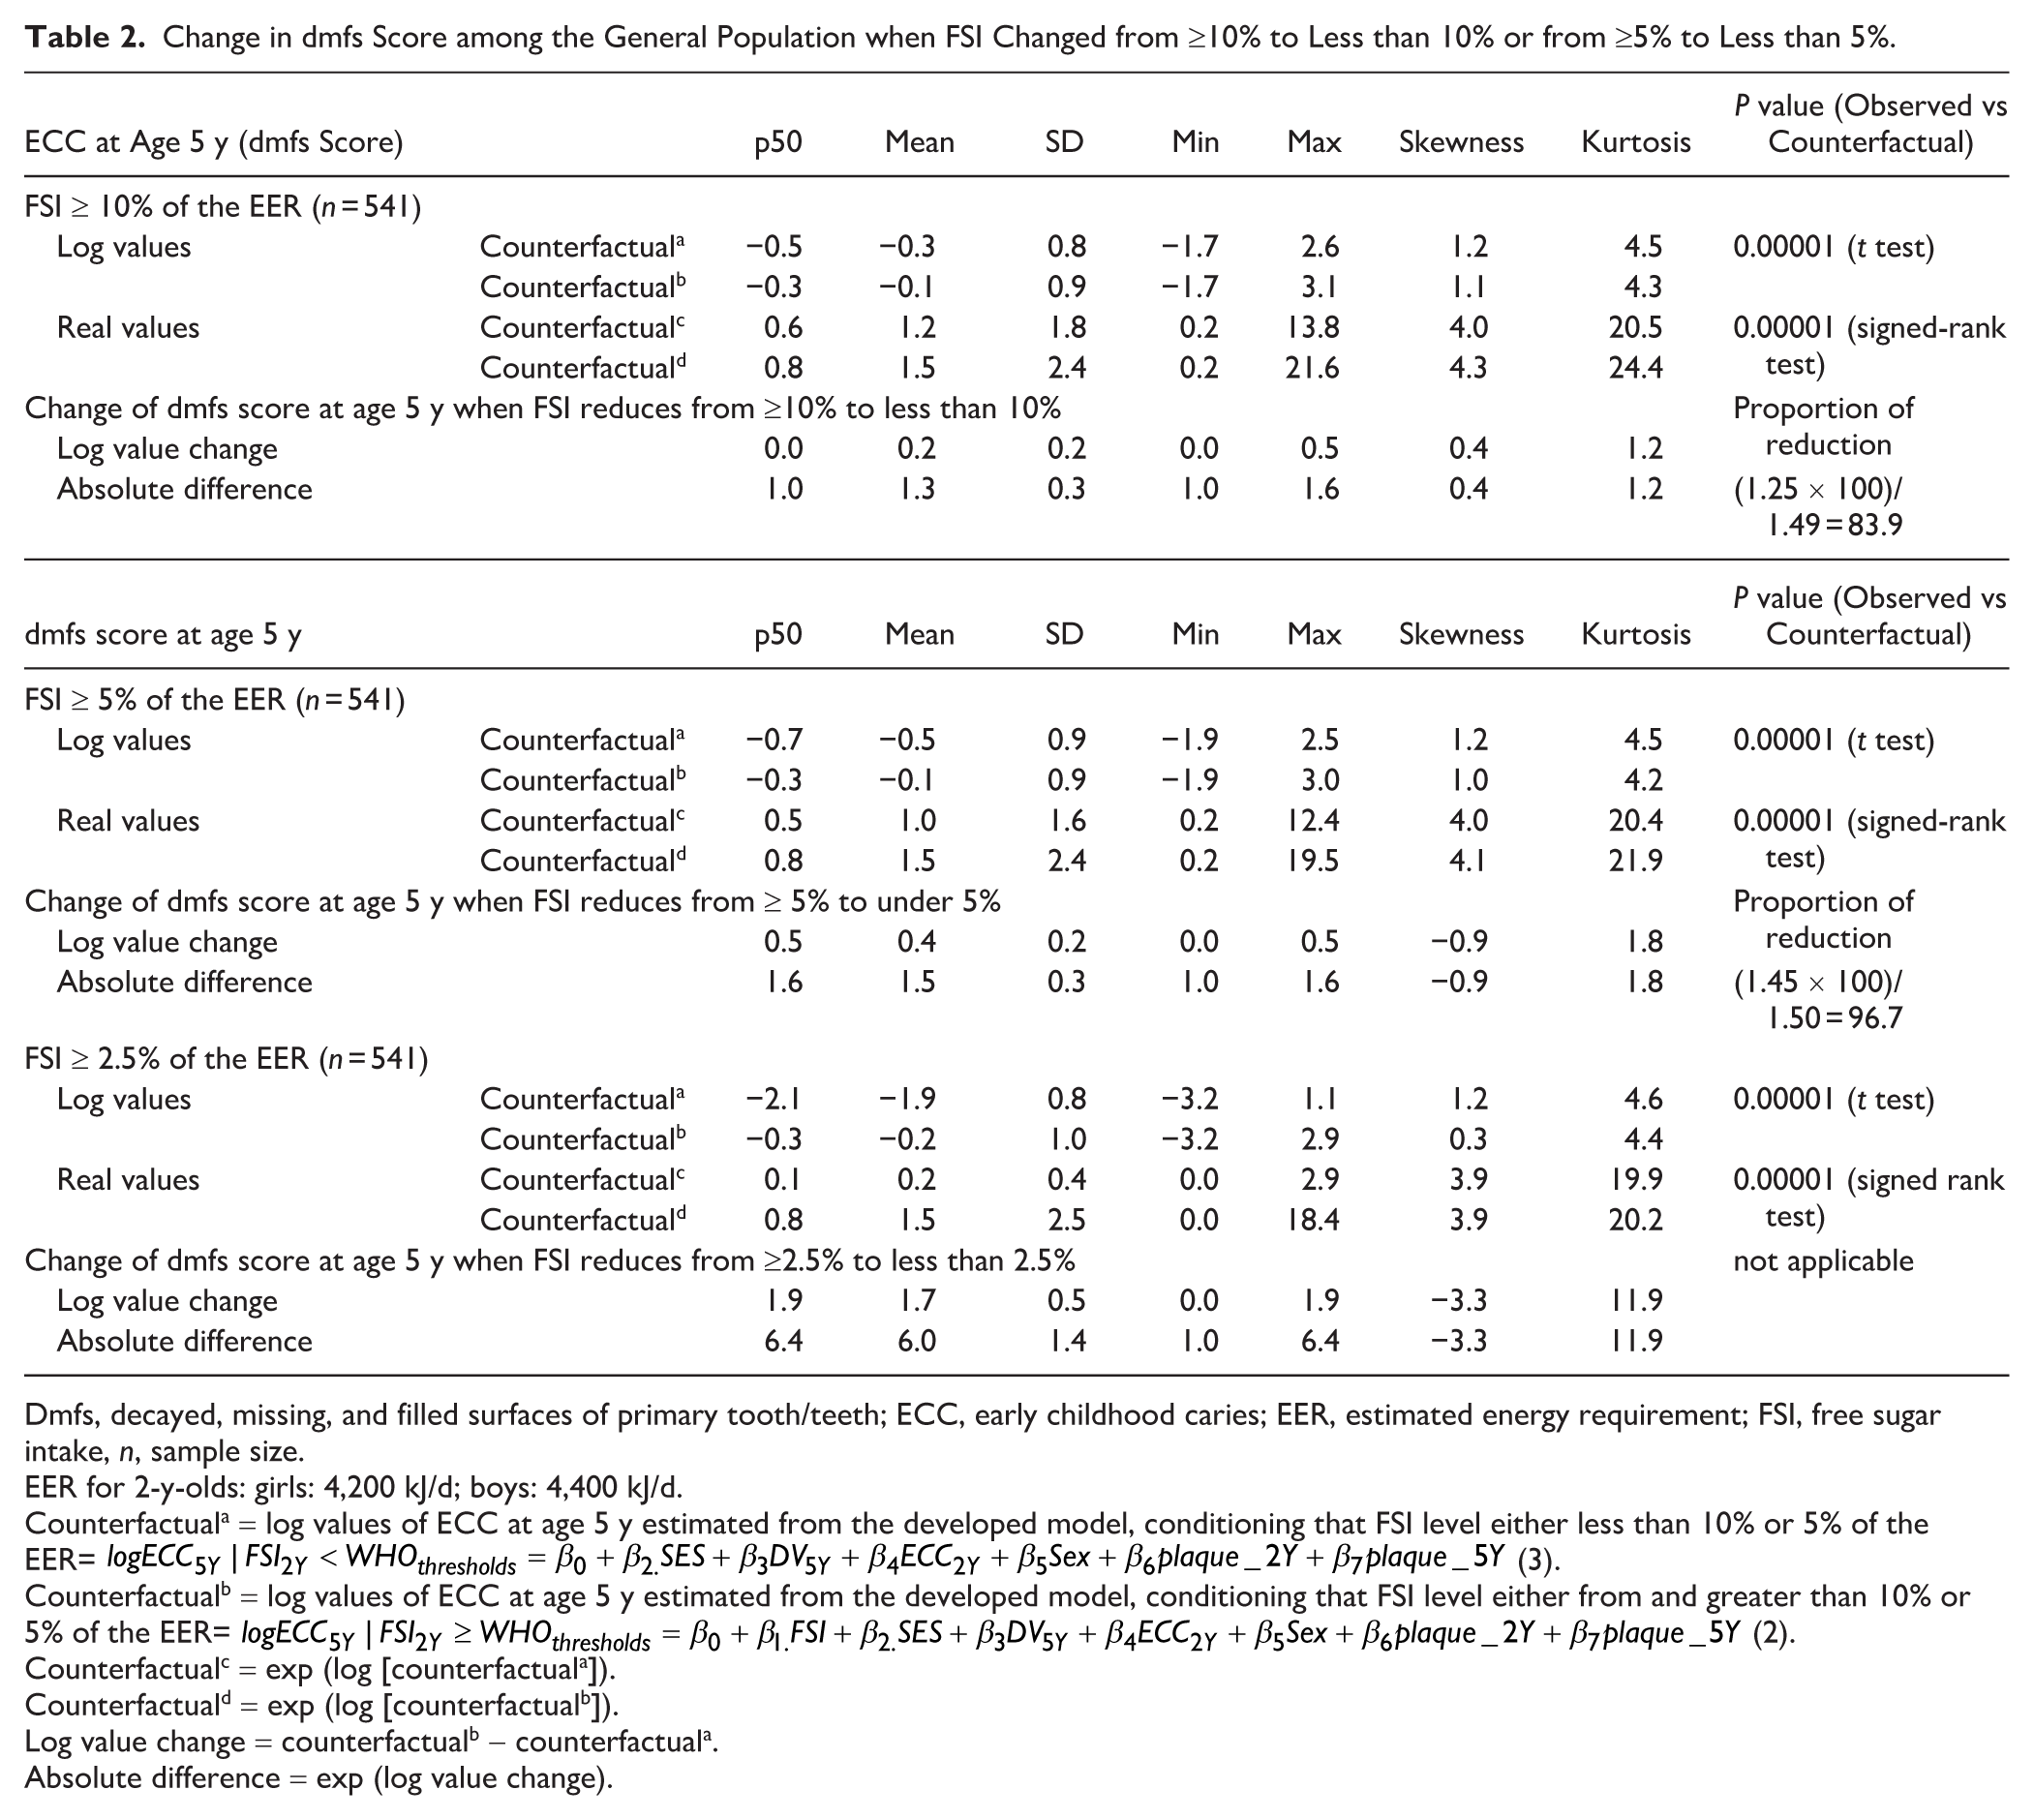
Dmfs, decayed, missing, and filled surfaces of primary tooth/teeth; ECC, early childhood caries; EER, estimated energy requirement; FSI, free sugar intake, n, sample size.
EER for 2-y-olds: girls: 4,200 kJ/d; boys: 4,400 kJ/d.
Counterfactuala = log values of ECC at age 5 y estimated from the developed model, conditioning that FSI level either less than 10% or 5% of the EER=
Counterfactualb = log values of ECC at age 5 y estimated from the developed model, conditioning that FSI level either from and greater than 10% or 5% of the EER=
Counterfactualc = exp (log [counterfactuala]).
Counterfactuald = exp (log [counterfactualb]).
Log value change = counterfactualb - counterfactuala.
Absolute difference = exp (log value change).
Change in dmfs Score among the High-Risk Population when FSI Changed from ≥10% to Less than 10% or from ≥5% to Less than 5%.
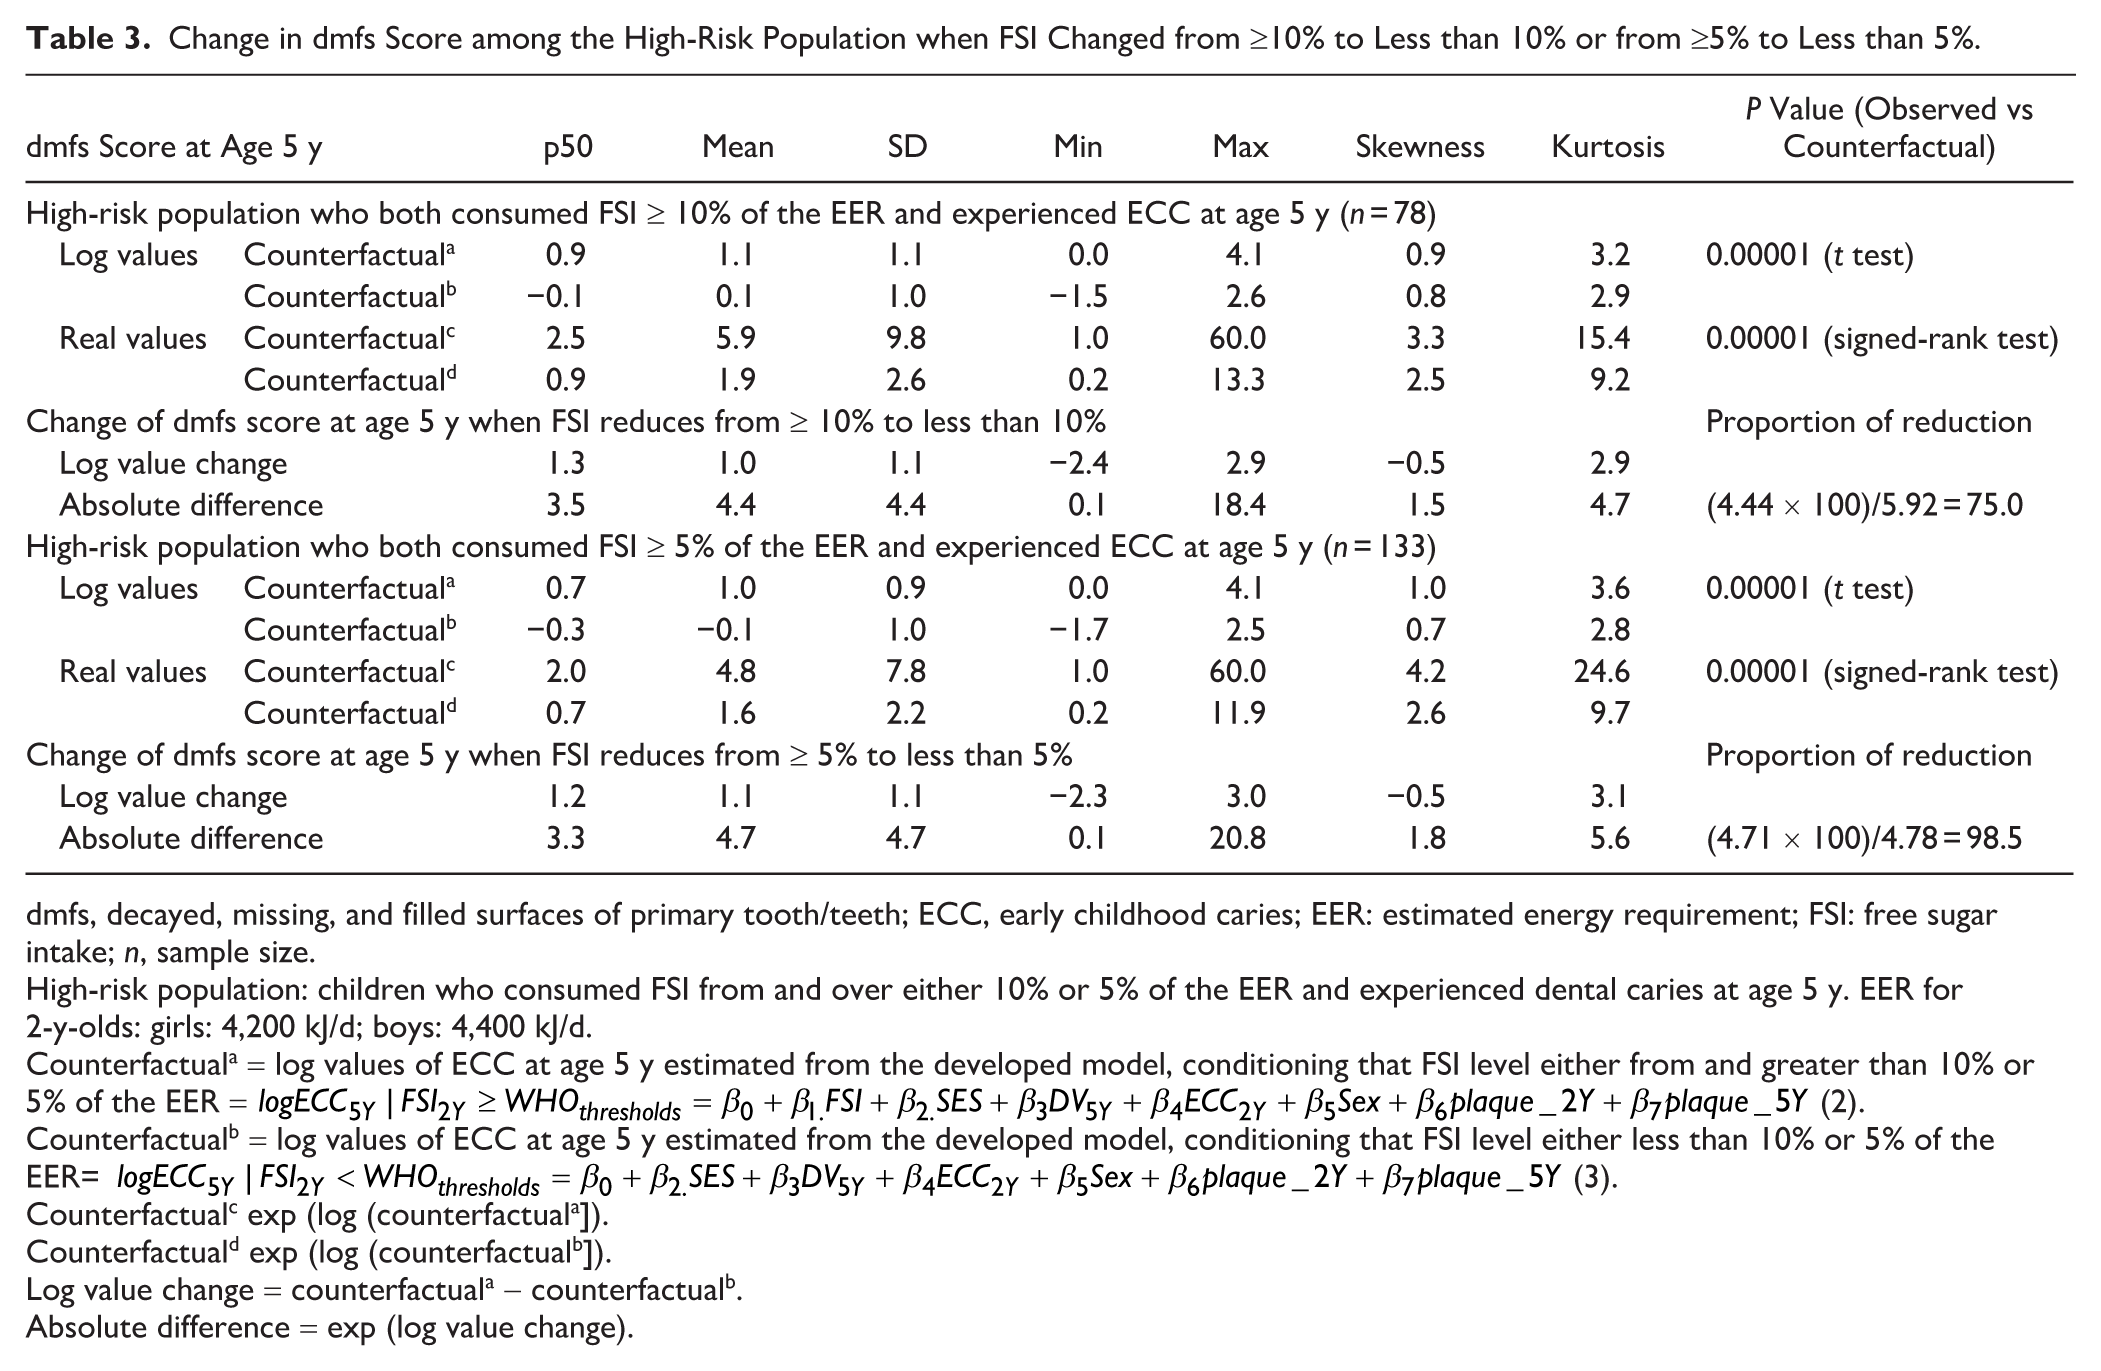
dmfs, decayed, missing, and filled surfaces of primary tooth/teeth; ECC, early childhood caries; EER: estimated energy requirement; FSI: free sugar intake; n, sample size.
High-risk population: children who consumed FSI from and over either 10% or 5% of the EER and experienced dental caries at age 5 y. EER for 2-y-olds: girls: 4,200 kJ/d; boys: 4,400 kJ/d.
Counterfactuala = log values of ECC at age 5 y estimated from the developed model, conditioning that FSI level either from and greater than 10% or 5% of the EER =
Counterfactualb = log values of ECC at age 5 y estimated from the developed model, conditioning that FSI level either less than 10% or 5% of the EER=
Counterfactualc exp (log (counterfactuala]).
Counterfactuald exp (log (counterfactualb]).
Log value change = counterfactuala - counterfactualb.
Absolute difference = exp (log value change).
Discussion
This study provides robust evidence quantifying the potential change in dmfs scores among the preschool population if their FSI levels were reduced to below either 10% or 5% of the EER, addressing the research question: “How would dmfs scores among preschoolers have changed if FSI levels had been reduced to below either 10% or 5% of the EER?” The findings indicate that reducing FSI from ≥10% to below this threshold would decrease dmfs scores at age 5 y by nearly 84% within the exposed of the general population and 75% in the high-risk population. Further reducing FSI to less than 5% of the EER would result in a nearly 97% and 99% reduction, respectively.
These findings are robust evidence supporting the WHO’s recommended FSI thresholds. First, the study captured FSI from all food sources, not just SSBs, which have been the narrow focus of much previous research (Yan and Louie 2023). Second, using the G-computation framework, an advanced causal approach (Hernán and Robins 2011), and birth cohort data, it estimated both absolute and relative reductions in dmfs scores. These findings add important specificity to the otherwise general WHO recommendations, particularly the <5% of EER threshold (WHO 2015). Specifically, the study quantified the percentage reductions for each threshold, supporting the application of the 10% threshold for the general preschool population and suggesting a stricter 5% threshold for high-risk preschool children. Furthermore, a dose-response analysis, a data-driven validation approach, identified an empirical threshold of 6.25 g/d. This value, lower than the WHO recommendation, may reflect the greater susceptibility of preschool children to caries, further reinforcing the WHO’s guidance.
The current study also represents a paradigm shift in caries prevention by integrating stages of translational science (Nazarian 2023), building on evidence that SES is a fundamental driver of dental health inequalities (Fisher-Owens et al 2007; Do et al 2022) and that FSI is a key mediator linking SES to ECC (Dao et al 2025b), our study advances to estimate the potential causal effect of reducing FSI on the burden of ECC in both general and high-risk populations. Overall, the study offers actionable insights for a range of stakeholders: health care providers can incorporate these results into routine pediatric dental care and nutritional counseling, policymakers can implement WHO’s recommended thresholds to different populations and settings, and schools, daycare centers, and health care providers can collaborate to promote low-FSI diets among young children.
The study faced several challenges, such as attrition and recall bias. Attrition, common in cohort studies, was addressed by oversampling low-SES mothers, as they were more likely to be lost to follow-up (Do et al 2014). This helped maintain sample representativeness, as reflected in the similar dmfs scores between the SMILE cohort (1.34, 95% CI: 1.0–1.6; 23.4%) and the broader South Australian population (1.40, 95% CI: 1.0–1.6; 25.3%) (Do et al 2016). Recall bias in dietary intake was reduced using a validated 89-item dietary checklist, developed from 3-d food diaries at 12 mo and tested for repeatability and accuracy (Do et al 2020), while that in number of dental visits was controlled by not collecting as a single summary measure; instead, parents were asked to provide the dates of the first, second, and subsequent visits. Consistent results across both general and high-risk groups strengthen the robustness of our findings. Although generated for the Australian preschool population, these results have not yet been tested across diverse sociocultural contexts, including low- and middle-income countries.
In addition, some other unmeasured confounders, such as breastfeeding, caregivers’ caries status, dietary diversity, and parental oral health behaviors, were not controlled. Sensitivity analysis indicated an E-value for the observed effect of approximately 2.62 to 2.64, with a lower-bound E-value of 1.24 to 1.34 (Appendix A.6), suggesting that an unmeasured confounder would need to be moderately strongly associated with both the exposure and the outcome to fully explain the observed effect. Although breastfeeding and parental dietary factors could theoretically act as confounders, existing evidence suggests that their effect sizes are relatively small. For example, Shrestha et al (2024) reported effect sizes of 1.54 (lower CI = 1.16) for children breastfed for 12 mo or longer and 2.44 (lower CI = 1.09) for those breastfed for 18 mo or longer. Similarly, Ha et al (2022) found effect sizes ranging from 1.24 (95% CI 0.96–1.60) to 1.37 (95% CI 1.01–1.67) for maternal high-sugar intake trajectories. These estimates are smaller than the calculated E-value, indicating that the results appear moderately robust to potential residual confounding from these unmeasured factors.
Finally, the subgroup analysis of high-risk children was conducted on a small sample and intended for descriptive purposes only. Because it conditions on the outcome, it may introduce selection bias, limiting the causal interpretation. While the estimates highlight those with the worst outcomes, they should be interpreted with caution.
Conclusion
This study used the advanced G-computation approach to estimate the causal impact of reducing FSI in accordance with WHO guidelines on the prevalence of ECC. The findings underscore the importance of reducing FSI to less than 10% of the EER for the general population of children. The results also suggest additional benefits of less than 5% among high-risk children who consumed excessive FSI and experienced dental caries.
The corresponding reductions in dmfs at these thresholds provide tangible evidence to inform both clinical practice and community-level interventions. Clinically, these findings can support dental practitioners and pediatric health providers in counseling parents about optimal dietary sugar limits and incorporating sugar reduction guidance into preventive oral health programs. At the community level, the results can inform public health initiatives such as nutrition education campaigns, reformulation of children’s foods and beverages, and integration of sugar reduction goals into school and childcare nutrition policies. Future research should build on these results by applying causal inference methods to broader populations, including adults, to further strengthen the evidence base for dietary sugar reduction policies.
Author Contributions
A.T.M. Dao, contributed to conception and design, data analysis and interpretation, drafted and critically revised manuscript; L.G. Do, D.H. Ha, contributed to conception and design, data acquisition and interpretation, critically revised manuscript; N. Stormon, contributed to conception and design, data interpretation, critically revised the manuscript; H.V. Nguyen, contributed to conception and design, data analysis and interpretation, critically revised the manuscript. All authors gave their final approval and agreed to be accountable for all aspects of the work.
Supplemental Material
sj-docx-1-jdr-10.1177_00220345251406559 – Supplemental material for G-Computation Quantifying Caries Reduction by World Health Organization Sugar Limits in Children
Supplemental material, sj-docx-1-jdr-10.1177_00220345251406559 for G-Computation Quantifying Caries Reduction by World Health Organization Sugar Limits in Children by A.T.M. Dao, L.G. Do, N. Stormon, H.V. Nguyen and D.H. Ha in Journal of Dental Research
Footnotes
Acknowledgements
We would like to express our gratitude to the research team of the SMILE for their efforts in securing the study grant and coordinating and implementing the surveys. We also thank the SMILE participants for providing information and taking part in clinical examinations. In addition, we would like to thank the Oral Health Centre at the University of Queensland for their technical support of the present manuscript.
Declaration of Conflicting Interests
The authors declared no potential conflicts of interest with respect to the research, authorship, and/or publication of this article.
Funding
The authors disclosed receipt of the following financial support for the research, authorship, and/or publication of this article: This study used data from the Study of Mothers’ and Infants’ Life Events Affecting Oral Health (SMILE), which was conducted under the Project Grant APP1161581 support by the NHMRC. The authors received no financial support for authorship, and/or publication of this article.
Data Availability Statement
The data underlying this article cannot be shared publicly due to the privacy of individuals who consented to participate in the SMILE study. The data will be shared on reasonable request to Prof. Loc Do (
A supplemental appendix to this article is available online.
References
Supplementary Material
Please find the following supplemental material available below.
For Open Access articles published under a Creative Commons License, all supplemental material carries the same license as the article it is associated with.
For non-Open Access articles published, all supplemental material carries a non-exclusive license, and permission requests for re-use of supplemental material or any part of supplemental material shall be sent directly to the copyright owner as specified in the copyright notice associated with the article.