
Abstract
Intraoral ultrasound (IUS) is emerging as a valuable imaging modality in dentistry, offering noninvasive, radiation-free, real-time visualization of periodontal structures. Unlike traditional imaging methods, IUS enables dynamic assessments during clinical procedures, supporting diagnostic and treatment-planning capabilities. The accurate evaluation of parameters such as alveolar bone level (ABL), gingival thickness (GT), and alveolar bone thickness (ABT) is critical for diagnosing periodontal diseases. However, current assessment techniques are typically manual, time-consuming, and based on static images, leading to inter-operator variability and limiting real-time application. To address these gaps, this study aimed to develop OralSAM, an end-to-end machine learning network for automated segmentation and quantitative assessment of periodontal structures in IUS videos. The network segments gingiva, enamel, alveolar bone, and cementum, followed by a morphological analysis pipeline to extract clinically relevant measurements. A total of 158 IUS videos from 30 orthodontic patients were included, and the dataset was split into training, validation, and testing subsets following a 6:2:2 ratio. The segmentation performance of OralSAM, evaluated against expert-annotated ground truth, demonstrated high segmentation accuracy across key periodontal structures. Morphological measurements derived from the machine learning network also exhibited strong inter-rater reliability, as confirmed by Bland–Altman analysis, which demonstrated narrow limits of agreement (LOAs) for ABL (mean bias = −0.063 mm, LOA = −0.771 to 0.646 mm), GT (mean bias = −0.063 mm, LOA = −0.24 to 0.115 mm), and ABT (mean bias = −0.002 mm, LOA = −0.104 to 0.1 mm). The intraclass correlation coefficients were 0.893 (95% confidence interval [CI], 0.864 to 0.915) for ABL, 0.918 (95% CI, 0.768 to 0.960) for GT, and 0.848 (95% CI, 0.806 to 0.880) for ABT. These findings highlight OralSAM’s capability to accurately delineate periodontal structures and provide consistent assessments. The proposed framework shows strong potential for integration into routine chairside workflows, enabling early detection, real-time monitoring, and personalized management of periodontal disease.
Keywords
Introduction
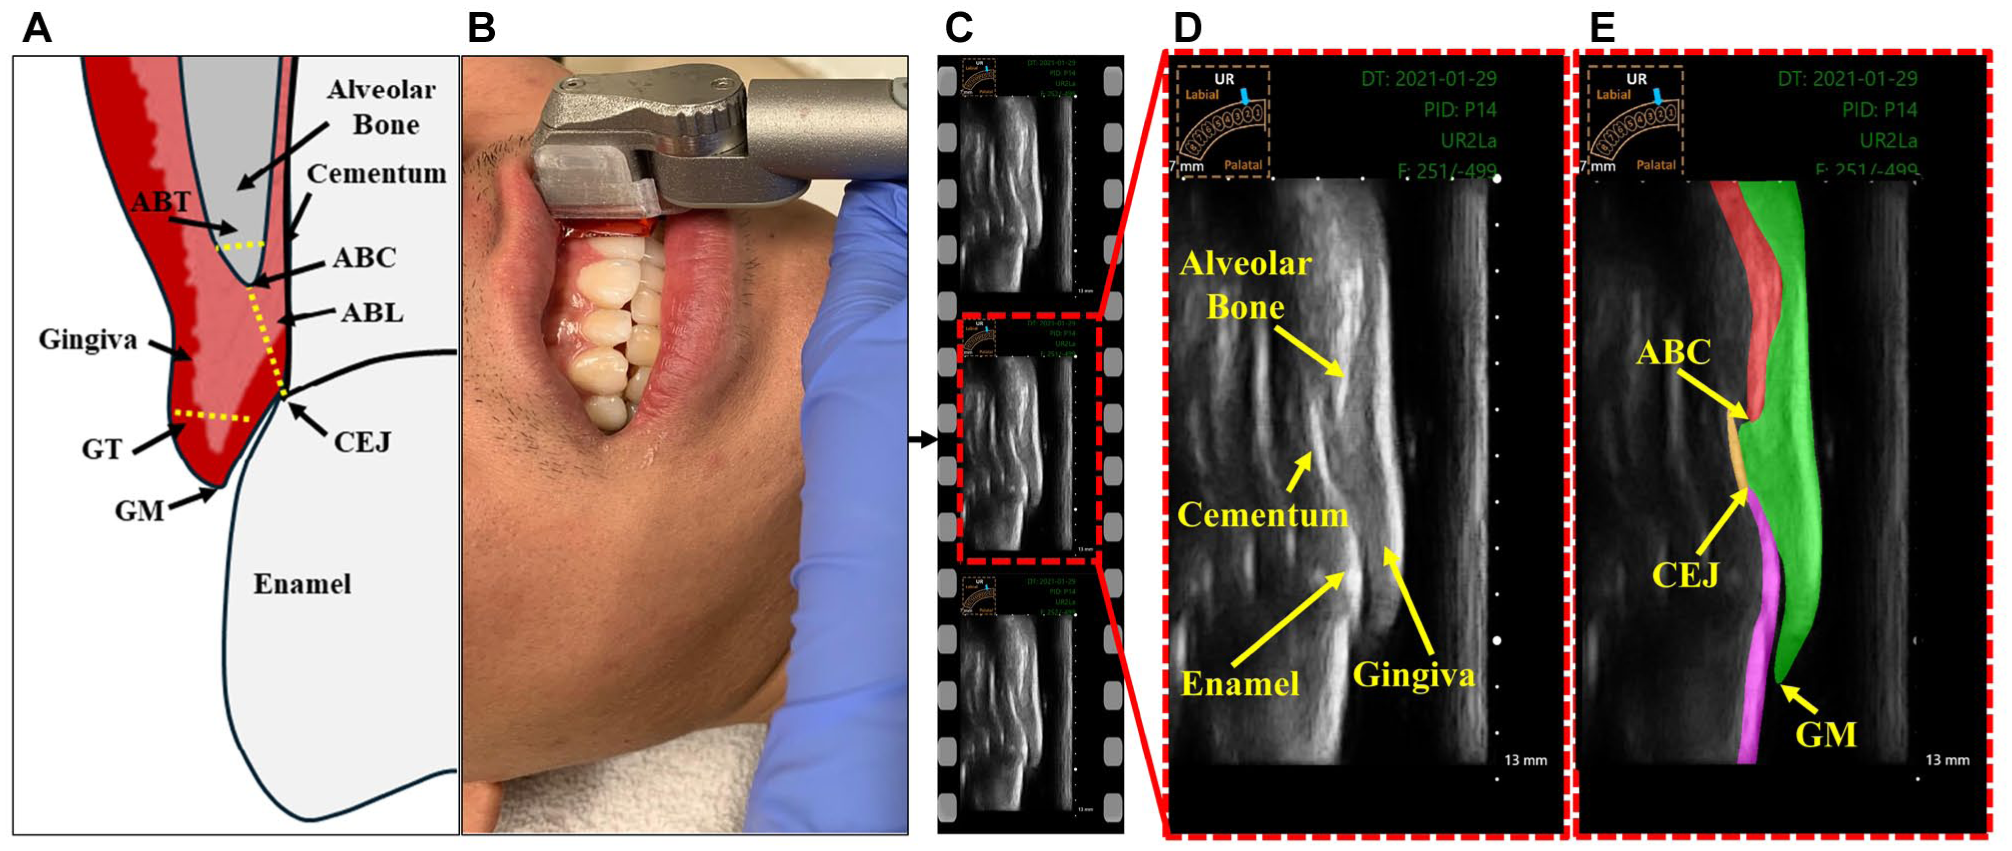
Periodontitis, also known as periodontal disease, is a prevalent oral health condition that significantly contributes to the global burden of chronic diseases (Nazir et al 2020). Epidemiological studies estimate that between 2011 and 2020, the prevalence of periodontitis among dentate adults was approximately 62% (Trindade et al 2023). Periodontitis can lead to tooth loss due to the gradual weakening of the periodontium (Scannapieco and Gershovich 2020). Figure 1A illustrates the periodontal structures and key anatomical landmarks of the dento-periodontal complex. The periodontium consists of the alveolar bone, cementum, periodontal ligament, and gingival tissues (Hughes 2015). Early detection and precise assessment of periodontal parameters, such as alveolar bone level (ABL), is crucial for timely intervention, effective treatment planning, and prognosis determination in periodontics (Kook et al 2012). Additionally, parameters such as gingival thickness (GT) and alveolar bone thickness (ABT) play an essential role in periodontal plastic procedures, particularly during soft-tissue grafting and flap surgeries (Holtzman et al 2021). Conventional imaging techniques, including 2-dimensional (2D) radiography and cone-beam computed tomography (CBCT), are commonly used to evaluate these biomarkers. However, 2D radiographs suffer from structural superimposition of bone, gingival, and tooth root, which hinders the reliable visualization of the labial/buccal and lingual/palatal alveolar bone and soft tissues. Although CBCT offers 3-dimensional imaging capabilities, it carries inherent limitations, including exposure to ionizing radiation, high expense, and challenges in real-time applications (De Grauwe et al 2019).
Intraoral ultrasound (IUS) has gained attention as a promising imaging modality in dentistry due to its noninvasive nature, cost-effectiveness, portability, absence of radiation exposure, and ability to provide real-time imaging of periodontal structures (Chifor et al 2010; Nguyen et al 2016; Chan et al 2017; Tattan et al 2020; Le et al 2021, 2024). Figure 1D illustrates the key periodontal structures visualized in a representative IUS video frame. The unique ability of ultrasound to image both soft and hard tissues in a dynamic, chairside setting provides substantial advantages over traditional imaging techniques. Recent evidence supports the diagnostic value of ultrasound in assessing key clinical periodontal parameters, including ABL, GT, and ABT, underscoring its potential for biomarker evaluation in intraoral settings (Figueredo et al 2023; Le et al 2023; Nguyen et al 2023). However, the interpretation of ultrasound images remains a challenge, requiring specialized training and relying heavily on clinician expertise. This dependence contributes to considerable inter- and intra-observer variability, complicating the evaluation process. Furthermore, the manual selection of high-quality, diagnostically relevant frames for analysis is labor intensive and time-consuming. These limitations underscore the need for automated approaches to enable consistent and efficient assessment in clinical practice. The accurate delineation of anatomical regions of interest is critical for the reliable quantification of periodontal biomarkers (Arifin et al 2017). Nevertheless, the segmentation of ultrasound images is inherently challenging due to modality-specific artifacts and limitations. Common issues such as low signal-to-noise ratio, low contrast-to-noise ratio, speckle noise, and edge dropout caused by surrounding anatomical structures can impair image quality and hinder the identification of anatomical boundaries (Noble and Boukerroui 2006; Nguyen et al 2018).
(
Supervised machine learning (ML) algorithms have recently shown great promise in the segmentation of periodontal structures from IUS images (Nguyen et al 2020, 2021; Chifor et al 2022; Pan et al 2022; Qi et al 2025). Convolutional neural networks (CNNs), in particular, are well-suited for medical image analysis due to their ability to learn hierarchical spatial features (Shaheen et al 2021). However, most existing studies rely on the U-Net architecture or its variants. While effective for static image segmentation, these architectures are limited in their ability to capture temporal information, a key factor for improving anatomical boundary detection in IUS videos. This segmentation approach often leads to spatial inconsistencies across frames and fails to leverage the temporal coherence inherent in ultrasound video sequences (Kumaralingam et al 2023, 2024). While YOLACT (Bolya et al 2019) and YOLACT++ (Bolya et al 2022) are well-established real-time instance segmentation models, they are primarily designed for natural images. Conventional models often struggle with such dynamic, high-variability clinical data and typically require large amounts of annotated data for effective training. This limitation highlights the need for advanced, video-aware learning frameworks capable of achieving real-time, temporally consistent segmentation.
Recently, foundation models (Ma et al 2024) have outperformed task-specific U-Net architectures, maintaining consistent accuracy across diverse datasets. These models leverage pretrained knowledge to capture both spatial and temporal contexts, enabling more consistent segmentation across video sequences while reducing the reliance on large annotated datasets for training. Furthermore, foundation models can also use user-selected points or regions (prompts) to guide the segmentation across the whole video, making them more flexible and useful for real-time ultrasound exams. The aim of this study was to develop a foundation model capable of delineating key periodontal structures, including the gingiva, enamel, alveolar bone, and cementum and performing automated measurements of ABL, GT, and ABT in IUS videos.
Materials and Methods
Cohort Description and Ground-Truth Labeling
The dataset consisted of IUS video recordings collected from 30 orthodontic patients (aged 11 to 57 y; mean ± SD: 21.3 ± 11.4 y), including 25 females and 5 males. Written informed consent was obtained from all participants, and, where applicable, from their parents or legal guardians. Ethical approval for the study was obtained from the Research Ethics Committee of the University of Alberta (Pro00099721, Pro00062355). Participants were selected based on full complement of permanent incisors, canines, and premolars, with mild-to-moderate dental crowding. Exclusion criteria included missing maxillary or mandibular permanent central incisors, edentulous status, severe crowding, gingival recession below the cementoenamel junction (CEJ), history of corrective orthodontic treatment, unfavorable oral hygiene, or craniofacial syndromes. Among the participants, 2 were undergoing active orthodontic treatment with fixed metallic appliances, and none were treated with clear aligners. IUS imaging was performed by a trained oral clinician using a custom-built 20-MHz handheld intraoral transducer system, as described in Le et al (2024). The probe was positioned at the midline of each tooth to obtain video recordings with a scanning depth of 13 mm (Figure 1A-B). While a standardized protocol was followed, anatomical differences between the upper and lower arches naturally resulted in variations in orientation. Each video comprised approximately 500 frames, had a dimension of 556 × 1,062 pixels, and a spatial sampling rate of 0.015 mm/pixel (Figure 1C-D). The dataset included a total of 158 IUS videos, consisting of mandibular incisors (n = 43), canines (n = 28), and first premolars (n = 17), as well as maxillary incisors (n = 31), canines (n = 26), and first premolars (n = 13). The dataset was split into training (60%), validation (20%), and testing (20%) subsets, ensuring no subject overlap across the partitions. For each video, 9 to 10 frames were randomly selected and manually annotated by a primary expert (rater 1), an orthodontist with 9 y of experience in ultrasound imaging, using the LabelMe annotation tool (Figure 1E). This sparse sampling strategy was adopted to reduce annotation burden while ensuring representative coverage of anatomical variability throughout each video. To assess interrater reliability, the same test set comprising 20% of the dataset was independently annotated by a second expert (rater 2), who had 1 y of experience in US imaging. Both raters were calibrated by 30 randomly selected images prior to annotation through a joint review of labeling criteria.
OralSAM Architecture and Training Details
The proposed OralSAM (Kumaralingam et al 2025) is a video segmentation network based on the pre-trained Segment Anything Model (SAM) backbone (Dosovitskiy et al 2020), specifically designed for IUS videos. This network enables the delineation of gingiva, cementum, bone, and enamel with minimal manual annotations, by learning the temporal consistency across subsequent frames. The OralSAM network consists of an encoder–decoder architecture. The encoder extracts hierarchical feature representations, while the decoder reconstructs the segmentation maps. The architecture ensures accurate segmentation of essential periodontal structures, supporting the subsequent morphological assessment of ABL, GT, and ABT in IUS videos. For training, all video frames were resized to 256 × 256 pixels. The model was optimized using a combined loss function that enhances both spatial and temporal consistency. Detailed information about the network and implementation details are available in Appendix of the Supplementary Material.
Automatic Thickness Measurement
The segmented structures predicted by the OralSAM network were resized back to the original ultrasound frame dimensions and subsequently used to automatically quantify key periodontal parameters: ABL, GT, and ABT. Figure 2 illustrates the methodology used to derive these measurements from IUS frames.
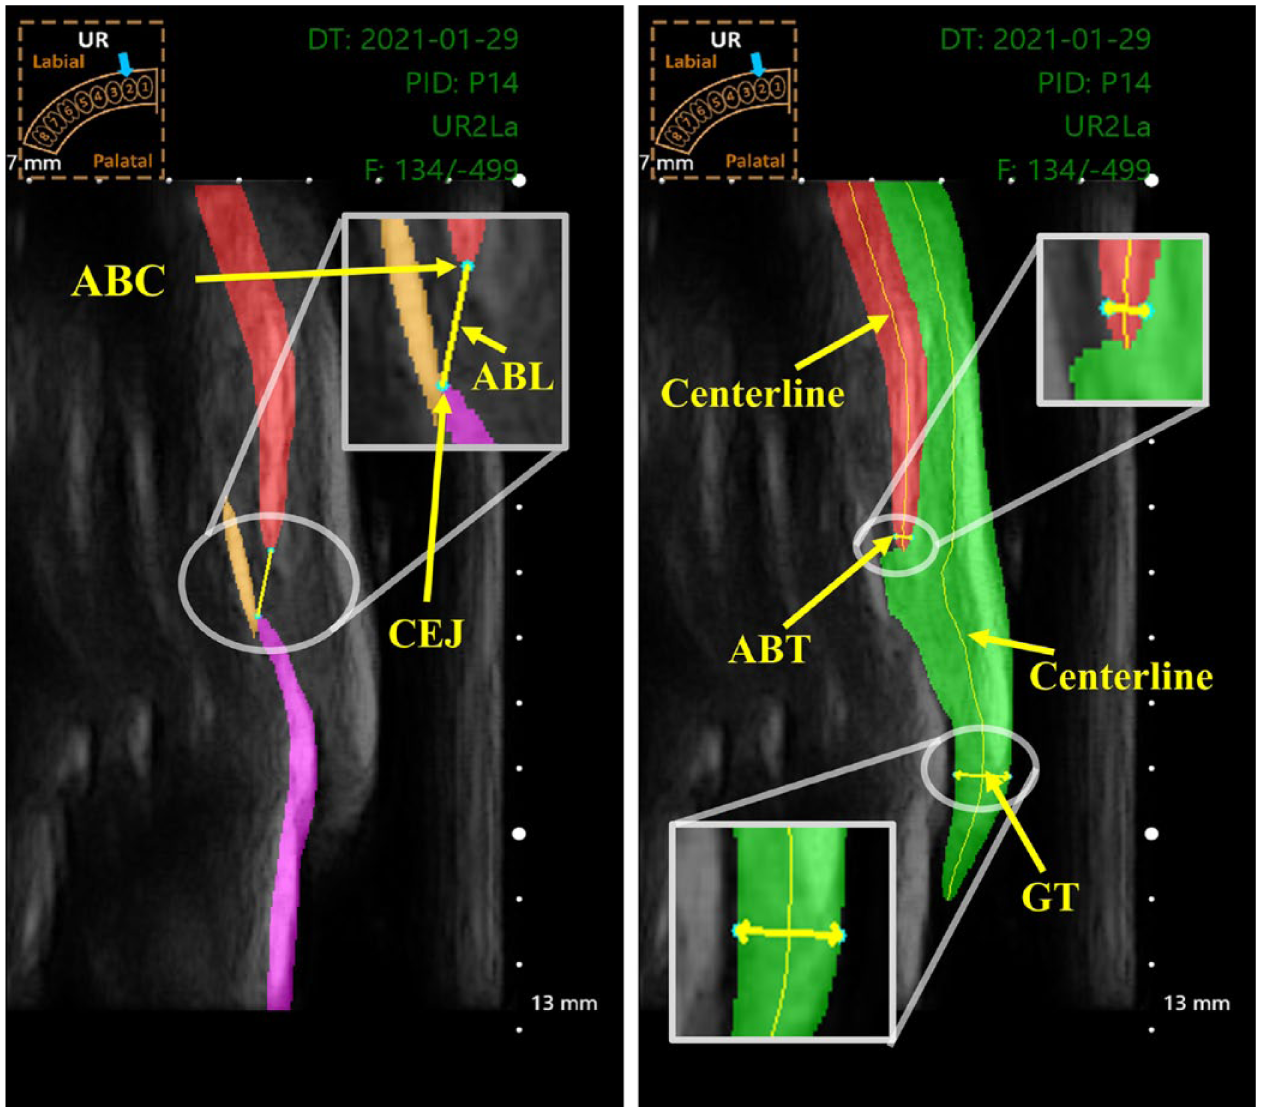
Representation of automatic measurements from the region of interest. (Left) The alveolar bone level (ABL) measurement is obtained by identifying the alveolar bone crest (ABC) at the tip of the bone and the cementoenamel junction (CEJ), where the enamel meets the cementum. (Right) The alveolar bone thickness (ABT) is measured at a point on the centerline that is 0.2 mm apical to the ABC, using a line drawn perpendicular to the centerline through that point of the bone structure. Similarly, gingiva thickness (GT) is measured at a point on the centerline that is 2 mm apical to the gingiva margin (GM), using a line drawn perpendicular to the centerline through that point of the gingival structure. A pictogram (top left) indicates the imaged tooth (UR- upper right).
Gingival thickness (GT)
To measure the GT, the gingival segmentation mask was skeletonized to extract the centerline using a parallel thinning algorithm, representing the central axis of the gingival structure (Zohranyan et al 2024). A measurement point was selected 2 mm apical to the gingiva margin along this centerline, following clinical guidelines (Lin et al 2021). At this point, a line perpendicular to the tangent of the centerline was drawn, and its intersections with the gingival boundaries were identified. The Euclidean distance between these 2 boundary points, multiplied by the physical pixel spacing t, was recorded as the GT.
Alveolar bone thickness (ABT)
The ABT was measured using a similar strategy. A point was chosen 0.2 mm apical to the alveolar bone crest (ABC) along the bone centerline. The thickness was determined by computing the perpendicular Euclidean distance across the segmented bone region at that location, then scaled by the pixel spacing t to convert the result to millimeters.
Alveolar bone level (ABL)
The ABL was estimated by identifying the ABC, the most coronal point of the segmented alveolar bone, and the CEJ, defined as the point at which the enamel meets the cementum. The Euclidean distance between these landmarks, again scaled by t, was used to compute the ABL.
Performance Metrics and Statistical Analysis
A separate test set comprising 20 IUS videos was used to evaluate the performance of the OralSAM network. All frames in these videos were segmented using the proposed network. From each video, 10 frames were randomly selected and compared against corresponding manual annotations provided independently by 2 expert raters (rater 1 and rater 2). The total number of frames assessed was greater than the minimum sample size indicated by power analysis (Wang and Ji 2020). Importantly, none of the test videos overlapped with those used in the training or validation sets, ensuring complete subject-level independence. Segmentation performance was assessed by comparing the network-generated masks with expert annotations using standard evaluation metrics: Dice similarity coefficient (DSC), Hausdorff distance (HD), sensitivity, specificity, and accuracy (refer to Appendix). Interrater agreement and reliability were evaluated across 3 pairwise comparisons: ML versus rater 1, ML versus rater 2, and rater 1 versus rater 2.
To assess the consistency of automated periodontal measurements, ML-derived values were compared with manual measurements using the interclass correlation coefficient (ICC [2,1]), which accounts for absolute agreement in a 2-way random-effects model. All statistical analyses were carried out using IBM SPSS Statistics (version 27). In addition, the mean absolute distance difference (MADD) was calculated between the automated and manual measurements (rater 1) to quantify measurement error. Bland–Altman plots were generated to visualize the agreement and identify any systematic biases between the automated and manual approaches, providing further validation of the network’s clinical applicability.
Results
Table 1 summarizes OralSAM segmentation results across 4 anatomical classes—gingiva, bone, cementum, and enamel—against the expert’s annotations. Against rater 1, the OralSAM network achieved a DSC of 91.4% for gingiva, 86.6% for bone, 82.6% for cementum, and 85.2% for enamel, respectively, with a corresponding HD less than 0.15 mm in all categories. The sensitivity values remained greater than 82% for all structures, while specificity exceeded 99.5% across the board. When compared with rater 2, the OralSAM network showed slightly reduced agreement across evaluation metrics, particularly in the cementum and enamel regions. The inter-rater agreement between rater 1 and rater 2 further confirmed the reliability of annotations, yielding DSC values of 85.2%, 84.4%, 77.4%, and 69.0% for gingiva, bone, cementum, and enamel, respectively. Notably, the OralSAM network outperformed the interrater agreement in all categories, exceeding it by 6.2% for gingiva, 2.2% for bone, 5.2% for cementum, and 16.2% for enamel, respectively. These findings emphasize that the OralSAM model performs within the range of expert variability (refer to Appendix Fig 2). Automated periodontal measurements including ABL, GT, and ABT demonstrated strong agreement with manual assessments performed by rater 1. ICCs (ICC [2,1]) indicated excellent reliability across all 3 metrics: ABL (ICC = 0.893; 95% CI, 0.864 to 0.915), GT (ICC = 0.918; 95% CI, 0.768 to 0.960), and ABT (ICC = 0.848; 95% CI, 0.806 to 0.880), underscoring the model’s robustness in extracting clinically relevant measurements. The MADD between the automated method and rater 1 remained within clinically acceptable limits: 0.23 ± 0.29 mm for ABL, 0.09 ± 0.06 mm for GT, and 0.04 ± 0.03 mm for ABT. Figure 3 presents qualitative examples of best, moderate, and worst-case segmentation outcomes in terms of DSC across different periodontal structures. Bland–Altman analysis further confirmed the strong agreement between the ML predictions and rater 1 measurements, with minimal bias and narrow limits of agreement. Agreement is generally considered acceptable when approximately 95% of differences lie within the limits of agreement (Giavarina 2015). For ABL, the mean bias was −0.063 mm with limits of agreement ranging from −0.771 to 0.646 mm, encompassing 93.67% of the measurements; for GT, the bias was also −0.063 mm (limits: −0.240 to 0.115 mm), with 95.41% of measurements falling within this range; and for ABT, the bias was −0.002 mm (limits: −0.104 to 0.100 mm), capturing 95.83% of the measurements, as shown in Figure 4.
Quantitative Segmentation Performance of Gingiva, Bone, Cementum, and Enamel with Rater 1, Rater 2, and Machine Learning on the Test Set.
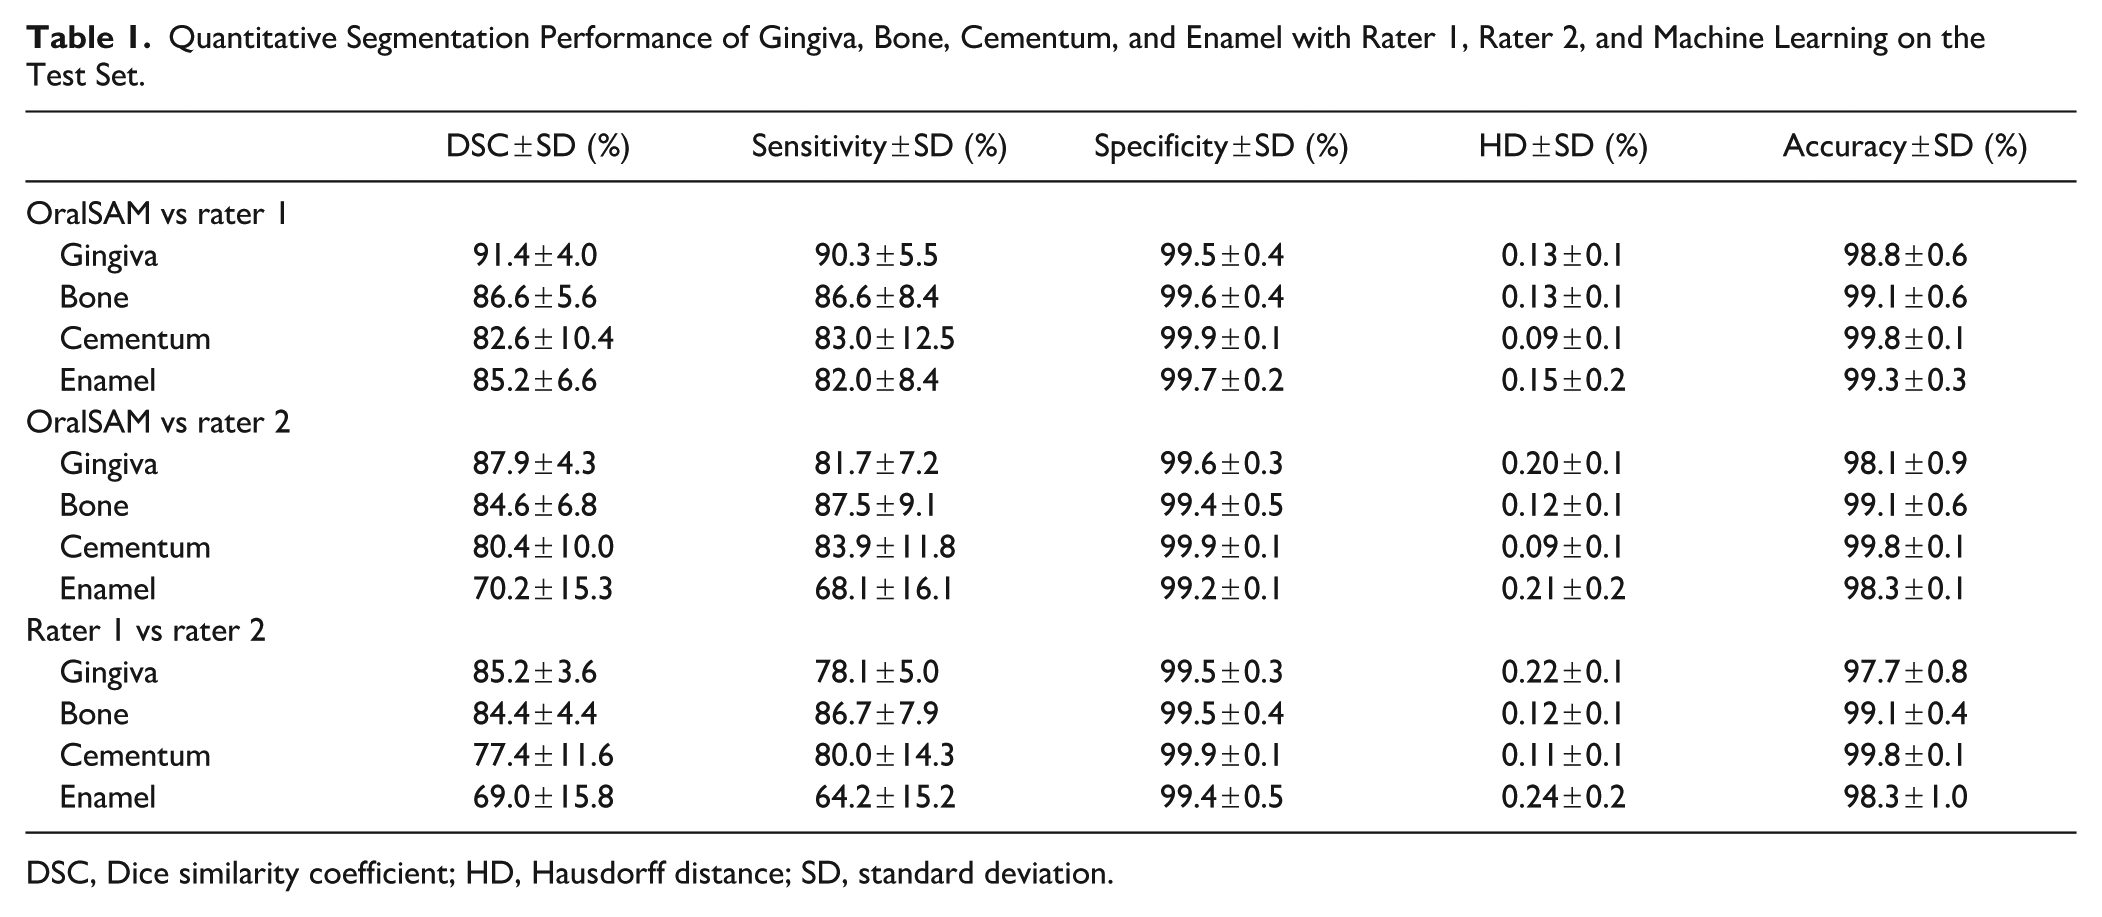
DSC, Dice similarity coefficient; HD, Hausdorff distance; SD, standard deviation.
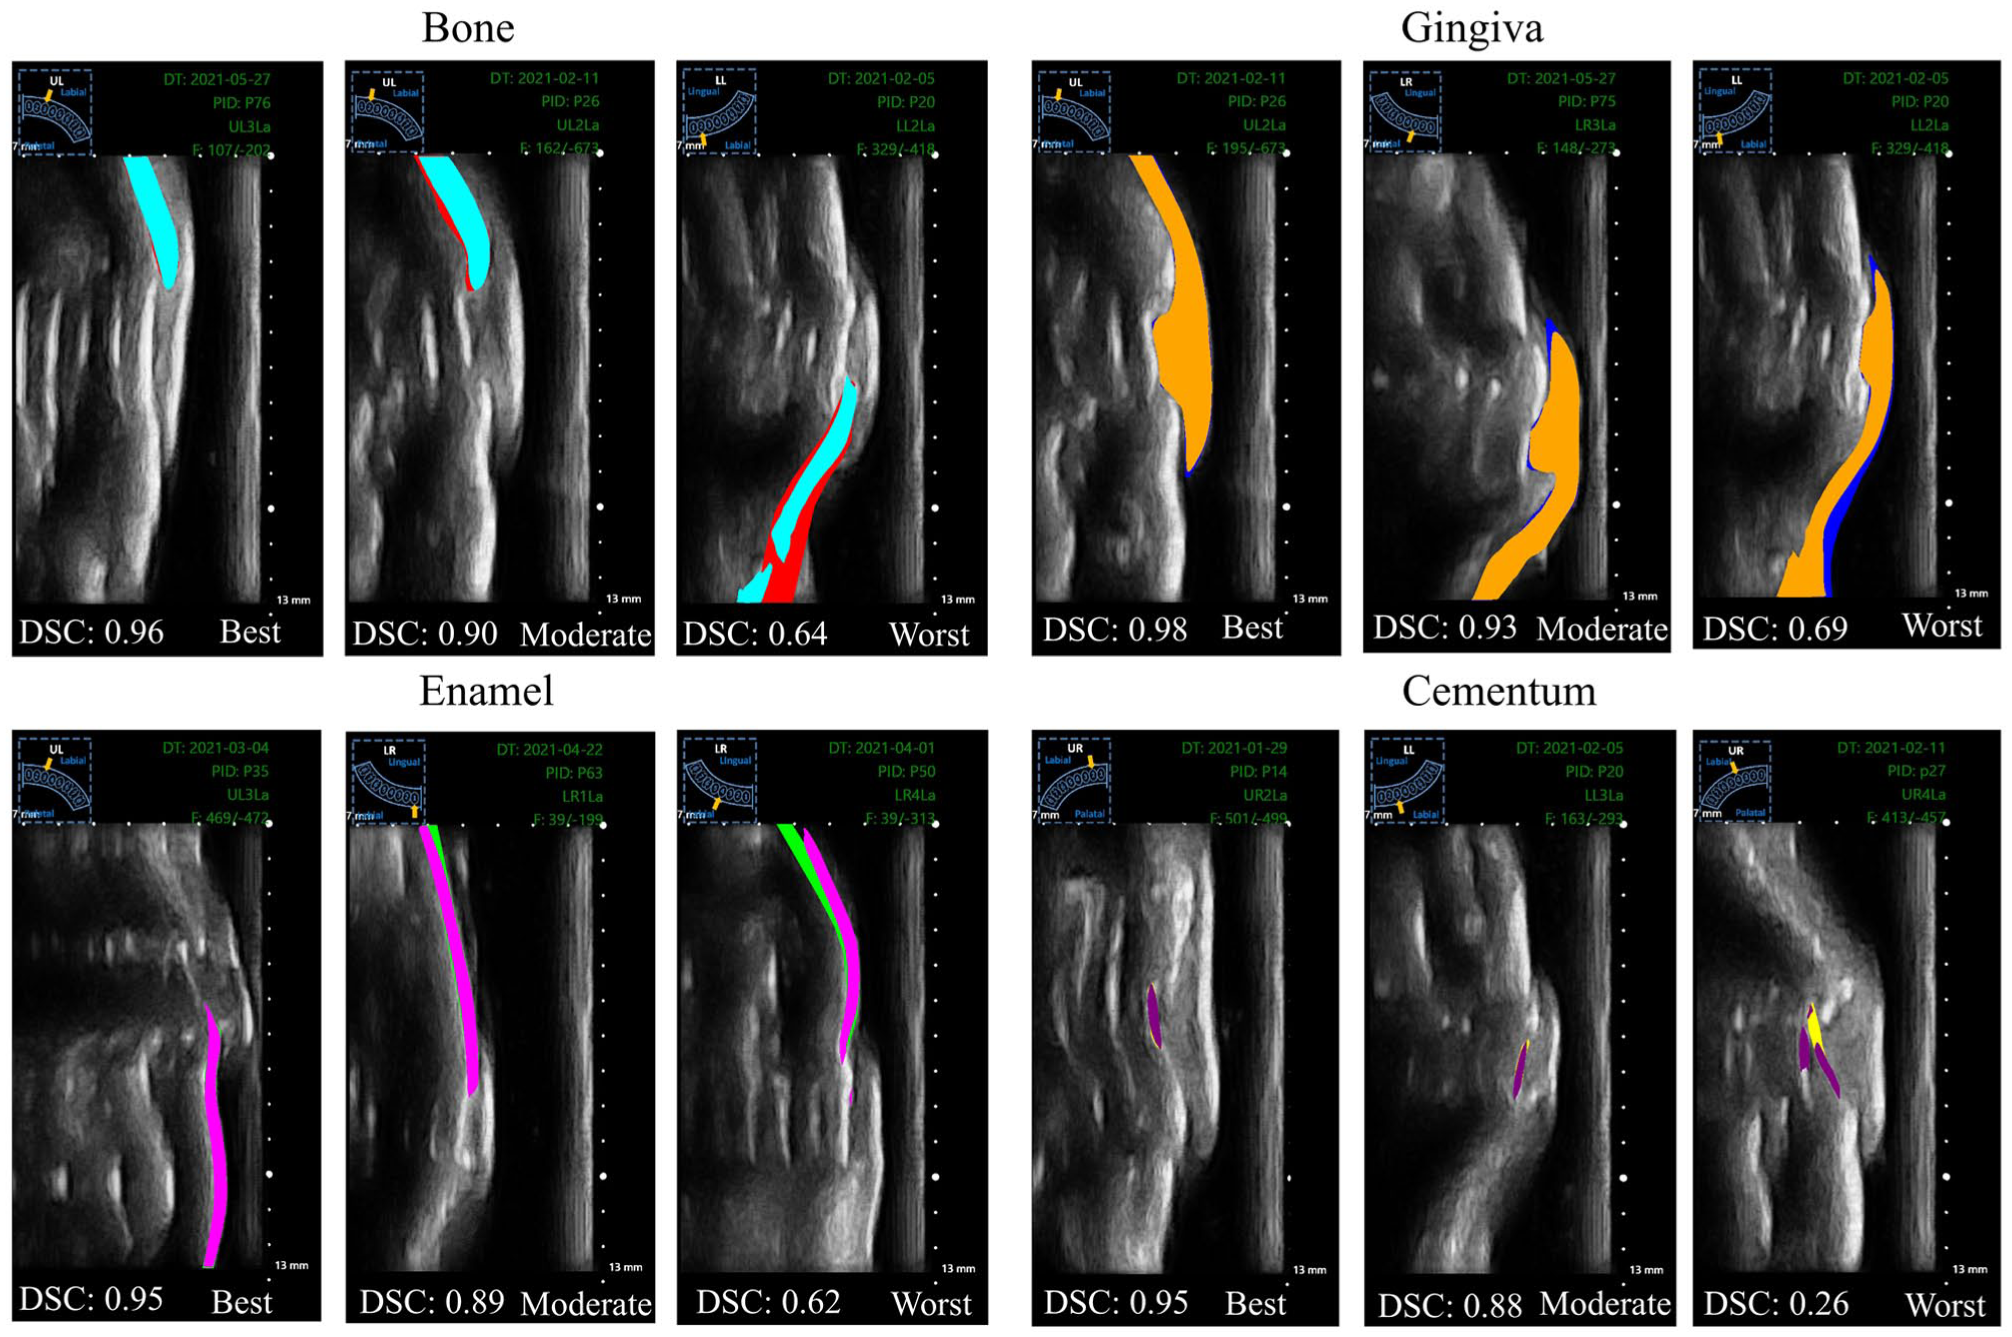
Qualitative segmentation results obtained using OralSAM across different periodontal structures (gingiva, enamel, cementum, alveolar bone). Shown are examples of best-case, moderate, and worst-case performance in terms of Dice similarity coefficient (DSC).
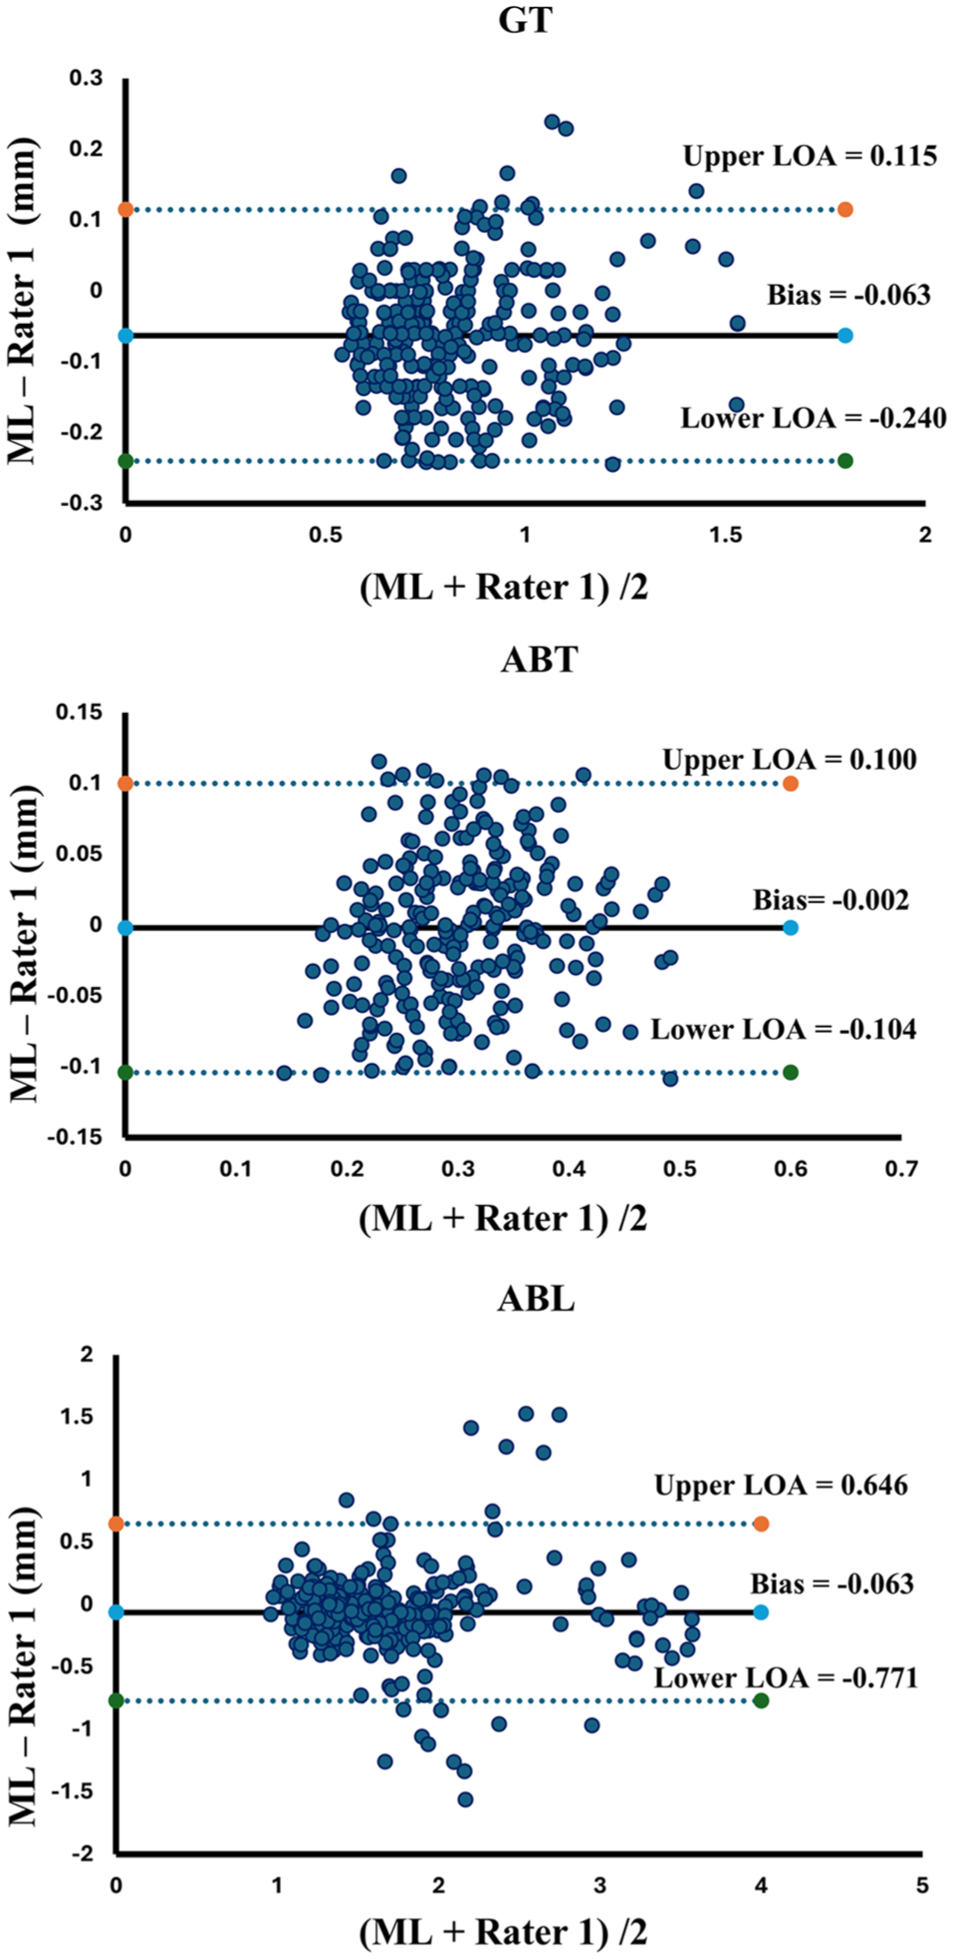
Bland–Altman plots comparing machine learning and rater 1 measurements for gingiva thickness (GT), alveolar bone thickness (ABT), and alveolar bone level (ABL). LOA, limit of agreement; ML, machine learning.
The network achieved high computational efficiency, segmenting frames at an average of 0.08 s per frame (~13 fps), allowing a 500-frame video to be processed in 38 s (refer to Appendix Fig 3). This meets real-time requirements for medical ultrasound, as prior work suggests 10 to 15 fps is sufficient for smooth intraoperative imaging (Huang and Zeng 2017), and even deep models such as Faster R-CNN are practical at 5 fps (Ren et al 2015). To further highlight the advantages of OralSAM, we compared its segmentation performance against existing methods, including U-Net, U-Net++, Attention U-Net, and SAM (refer to Appendix Table 1). OralSAM consistently outperformed all baseline methods across all periodontal structures, achieving the highest DSC and accuracy while maintaining competitive sensitivity, specificity, and inference time.
Discussion
This study presents OralSAM, an automated video-based IUS segmentation framework for periodontal assessment, including ABL, GT, and ABT. Unlike prior methods limited to static image analysis, OralSAM leverages the temporal richness of ultrasound video to dynamically delineate key periodontal structures, including the gingiva, enamel, cementum, and alveolar bone. This advancement bridges the gap between conventional qualitative interpretation of 2D ultrasound and quantitative, real-time periodontal diagnostics, offering a novel pathway for noninvasive, radiation-free chairside assessment. Temporal continuity offered by video data plays a pivotal role in enhancing anatomical clarity, especially in regions where single frames may inadequately capture complex structures. By processing continuous ultrasound sweeps, OralSAM improves structural identification and supports more accurate interpretation in ambiguous areas such as the CEJ. In this study, the CEJ was defined as the junction between the enamel and cementum, guided by expert annotations informed by our validated ultrasound studies (Nguyen et al 2023), which showed strong agreement with radiographic and anatomical standards. The echogenic interface between enamel and cementum in intraoral ultrasonograms provided consistent localization (Nguyen et al 2021). Unlike previous studies from our group, which focused solely on bone segmentation in static images (Nguyen et al 2020), this framework enables real-time quantification of multiple clinically relevant parameters including GT, ABT, and ABL on a per-frame basis.
Quantitatively, the model achieved high DSCs (>82%) across all anatomical classes, outperforming inter-rater agreement by human experts. Importantly, it demonstrated submillimeter agreement (mean deviation < 0.2 mm) with expert annotations, meeting or exceeding benchmarks from recent literature (eg, landmark bias < 250 μm for ABL estimation; Qi et al 2025). Using a 0.5-mm clinical tolerance derived from a periodontal probing reproducibility study (Laugisch et al 2021), OralSAM consistently produced valid and clinically interpretable results across the cohort. Moreover, the system maintained high specificity (>99.5%), underscoring its reliability and safety for clinical use by minimizing false-positive detections. In addition to its segmentation accuracy, OralSAM achieved a full analysis of a typical 500-frame ultrasound video in about ~40 s, making the system well-suited for integration into real-time clinical workflows. Such efficiency is particularly advantageous in busy dental or periodontal practices, where rapid interpretation can reduce chair time, streamline assessments, and support immediate clinical decision-making.
OralSAM maintained consistent performance on unseen patients from the test set, indicating resilience to the intersubject anatomical differences present in our data. In addition, the implementation of per-frame inference absent in previous ultrasound segmentation studies introduces a critical capability for dynamically tracking morphological changes across time (refer to Appendix Table 2). This temporal granularity is essential for applications such as healing assessment, disease progression monitoring, and personalized treatment planning. Due to high acoustic impedance of the bone interface with surrounding tissue and the high attenuation of bone tissue, ultrasound cannot penetrate through thick bone. Therefore, the lower segmented boundary region does not represent the true boundary of the bone tissue. The choice of a centerline 0.2 mm from the ABC was guided by prior work (Le et al 2023), which showed strong agreement with CBCT at this offset. The presence of metallic braces in 2 patients did not noticeably affect the overall imaging quality or the model’s general performance. Consistent with our previous study, the intraoral transducer reliably visualized critical anatomical landmarks such as the CEJ and alveolar bone even in the presence of metallic orthodontic appliances (Le et al 2024).
Nonetheless, several limitations should be acknowledged. The dataset used in this study was acquired from a specific patient population undergoing orthodontic treatment, potentially limiting its generalizability to other periodontal conditions or demographic groups. Variations in periodontal phenotypes, particularly thin versus thick biotypes and the presence of periodontal intrabony lesions, may also influence ultrasound penetration, anatomical landmark visibility, and measurement accuracy. However, our current model has not been explicitly trained to differentiate between such phenotypes or detect pathological deviations. Moreover, clinical settings with varying operator expertise, ultrasound transducer types, or imaging protocols could yield different results. These factors highlight the need for external validation in more diverse cohorts, including patients with a wider range of periodontal diseases and demographic backgrounds, to confirm the robustness and reproducibility of our findings across broader clinical contexts. Furthermore, due to the large footprint of the current ultrasound transducer, data acquisition was limited to the buccal surfaces of incisors, canines, and first premolars, excluding the posterior regions such as molars, and requiring a separate prompt for each structure adds an additional burden.
The observed ABL, GT, and ABT values in this study included both normal and potentially pathological ranges. Since the present study focused on automating measurements rather than classification, future research will aim to provide detailed clinical stratification and validation across larger, more diverse populations to better establish diagnostic utility. Furthermore, developing a graphical user interface tailored for dental practitioners will be essential for deploying the system in routine clinical workflows. Such an interface would enable intuitive, real-time interaction with per-frame quantitative outputs and facilitate longitudinal tracking of tissue morphology.
In summary, OralSAM represents a significant advancement in periodontal imaging, offering fully automated, accurate, and clinically meaningful segmentation and quantification of key anatomical structures from IUS video. By overcoming the limitations of static frame analysis and enabling real-time, per-frame measurement, this system lays the groundwork for a new era of dynamic, noninvasive, image-guided periodontal diagnostics.
Supplemental Material
sj-docx-1-jdr-10.1177_00220345251387713 – Supplemental material for Automatic Assessment of Periodontium Complex in Intraoral Ultrasound Videos
Supplemental material, sj-docx-1-jdr-10.1177_00220345251387713 for Automatic Assessment of Periodontium Complex in Intraoral Ultrasound Videos by L. Kumaralingam, M.H. Hoang, K.C.T. Nguyen, N.R. Kaipatur, H.B.V. Dinh, J. Alavi, K. Punithakumar, E.H.M. Lou, P.W. Major and L.H. Le in Journal of Dental Research
Author Contributions
L. Kumaralingam, contributed to conception and design, data analysis and interpretation, drafted and critically revised the manuscript; M.H. Hoang, contributed to design, data analysis and interpretation, drafted manuscript; K.C.T. Nguyen, contributed to data acquisition, analysis, and interpretation, critically revised the manuscript; N.R. Kaipatur, contributed to data analysis and interpretation, critically revised the manuscript; H.B.V. Dinh, contributed to interpretation, critically revised the manuscript; J. Alavi, contributed to data analysis, drafted the manuscript; K. Punithakumar, E.H.M. Lou, P.W. Major, contributed to data conception, critically revised the manuscript; L.H. Le, contributed to conception, data analysis and interpretation, critically revised the manuscript. All authors gave final approval and agree to be accountable for all aspects of the work.
Footnotes
Acknowledgements
The authors gratefully acknowledge Alberta Innovates, Canada, for the generous support of graduate studentship (L. Kumaralingam). This study was also supported by the National Research Council of Canada Industrial Research Assistance Program (IRAP), MITACS, and Alberta Innovates Accelerating Innovations into CarE (AICE) program (grant No. RES0056222).
Declaration of Conflicting Interests
The authors declared no potential conflicts of interest with respect to the research, authorship, and/or publication of this article.
Funding
The authors received no financial support for the research, authorship, and/or publication of this article.
A supplemental appendix to this article is available online.
References
Supplementary Material
Please find the following supplemental material available below.
For Open Access articles published under a Creative Commons License, all supplemental material carries the same license as the article it is associated with.
For non-Open Access articles published, all supplemental material carries a non-exclusive license, and permission requests for re-use of supplemental material or any part of supplemental material shall be sent directly to the copyright owner as specified in the copyright notice associated with the article.