
Abstract
Apical periodontitis (AP) is one of the most prevalent disorders in dentistry. However, it can be underdiagnosed in asymptomatic patients. In addition, the perioperative evaluation of 3-dimensional (3D) lesion volume is of great clinical relevance, but the required slice-by-slice manual delineation method is time- and labor-intensive. Here, for quickly and accurately detecting and segmenting periapical lesions (PALs) associated with AP on cone beam computed tomography (CBCT) images, we proposed and geographically validated a novel 3D deep convolutional neural network algorithm, named PAL-Net. On the internal 5-fold cross-validation set, our PAL-Net achieved an area under the receiver operating characteristic curve (AUC) of 0.98. The algorithm also improved the diagnostic performance of dentists with varying levels of experience, as evidenced by their enhanced average AUC values (junior dentists: 0.89–0.94; senior dentists: 0.91–0.93), and significantly reduced the diagnostic time (junior dentists: 69.3 min faster; senior dentists: 32.4 min faster). Moreover, our PAL-Net achieved an average Dice similarity coefficient over 0.87 (0.85–0.88), which is superior or comparable to that of other existing state-of-the-art PAL segmentation algorithms. Furthermore, we validated the generalizability of the PAL-Net system using multiple external data sets from Central, East, and North China, showing that our PAL-Net has strong robustness. Our PAL-Net can help improve the diagnostic performance and speed of dentists working from CBCT images, provide clinically relevant volume information to dentists, and can potentially be applied in dental clinics, especially without expert-level dentists or radiologists.
Keywords
Introduction
Apical periodontitis (AP) is one of the most prevalent inflammatory diseases in dentistry, posing a significant global burden (Chew et al. 2019). However, establishing reliable evaluation tools remains challenging. A direct sign of AP is the presence of a radiolucent area around the root apexes. In general, AP can be asymptomatic and found incidentally during routine radiographic examinations; without early detection and proper management, AP not only can affect the affected tooth and surrounding alveolar bone but may also have systemic consequences for the patient (van der Waal et al. 2015; Georgiou et al. 2023). Cone beam computed tomography (CBCT) has been reported to be more accurate than periapical radiographs in detecting periapical lesions (PALs) (Patel et al. 2007; de Paula-Silva et al. 2009; Kim et al. 2016). CBCT offers 3-dimensional (3D) anatomical details with a low radiation dose and provides the opportunity to evaluate PAL at the voxel level. However, in the clinic, diagnosing AP on root-filled teeth from CBCT tends to be challenging, with a sensitivity of 0.63 and a specificity of 0.69 (Kruse et al. 2019). In addition, clinical interpretations of the periapical region on CBCT can vary greatly (Parker et al. 2017). Furthermore, evaluating the lesion volume in 3D has a crucial impact on treatment planning, healing assessment, and outcome prediction for root canal therapy and endodontic microsurgery (van der Borden et al. 2013; Kim et al. 2016). Traditional methods involve the use of manual or semiautomatic annotation, which is a laborious and time-consuming process (van der Borden et al. 2013; Kim et al. 2016; Boubaris et al. 2022). Moreover, the segmentation results are highly dependent on clinicians’ knowledge and experience and suffer from inter- and intravariability problems (Aoki et al. 2015). Therefore, it is imperative to develop a well-validated tool to improve the performance in evaluating apical lesions from CBCT. A fully automated PAL segmentation pipeline that considers the 3D lesion volume is highly desired clinically.
Given the unprecedented advances in artificial intelligence (AI), there have been extensive investigations into extracting large amounts of data from medical information using automatic algorithms (Ho 2020; Pandey et al. 2022). Among the available AI techniques, deep learning (DL), particularly convolutional neural networks (CNNs), has gained increasing attention in dentistry in recent years (Khanagar et al. 2021; Lahoud et al. 2021; Shan et al. 2021). Although published papers on DL for the detection and segmentation of PALs in CBCT have demonstrated good performance (Orhan et al. 2020; Setzer et al. 2020; Zheng et al. 2021; Kirnbauer et al. 2022), the potential clinical implications are usually not investigated. Moreover, verification of the robustness and generalizability of the DL-based method by using appropriate external and heterogeneous data sets obtained from other dental facilities remains crucial (Schwendicke et al. 2021). Providing comprehensive, clinical-oriented results is indispensable for gaining the trust of dentists and facilitating the translation of research findings into clinical practice.
Based on the excellent performance of DL, in this article, we aimed to develop a clinically oriented operational CNN-based AI system for the accurate and time-efficient detection and segmentation of lesions associated with AP in 3D on CBCT images. A comparative analysis was conducted to evaluate the diagnostic performance of the AI system and a group of dentists, both with and without AI assistance. To the best of our knowledge, this study represents the first geographical evaluation of CNN-based methodologies for evaluating PALs in 3D, using CBCT images derived from multiple centers.
Materials and Methods
This retrospective diagnostic study was reported based on the checklist for AI in medical imaging (CLAIM) guidelines (Appendix Table 1) and topic-related recommendations (Schwendicke et al. 2021). The use of patient data and waivers of informed consent were approved by the Institutional Ethics Committee (project number 2022-B37). The methodology of this study is depicted in Figure 1.
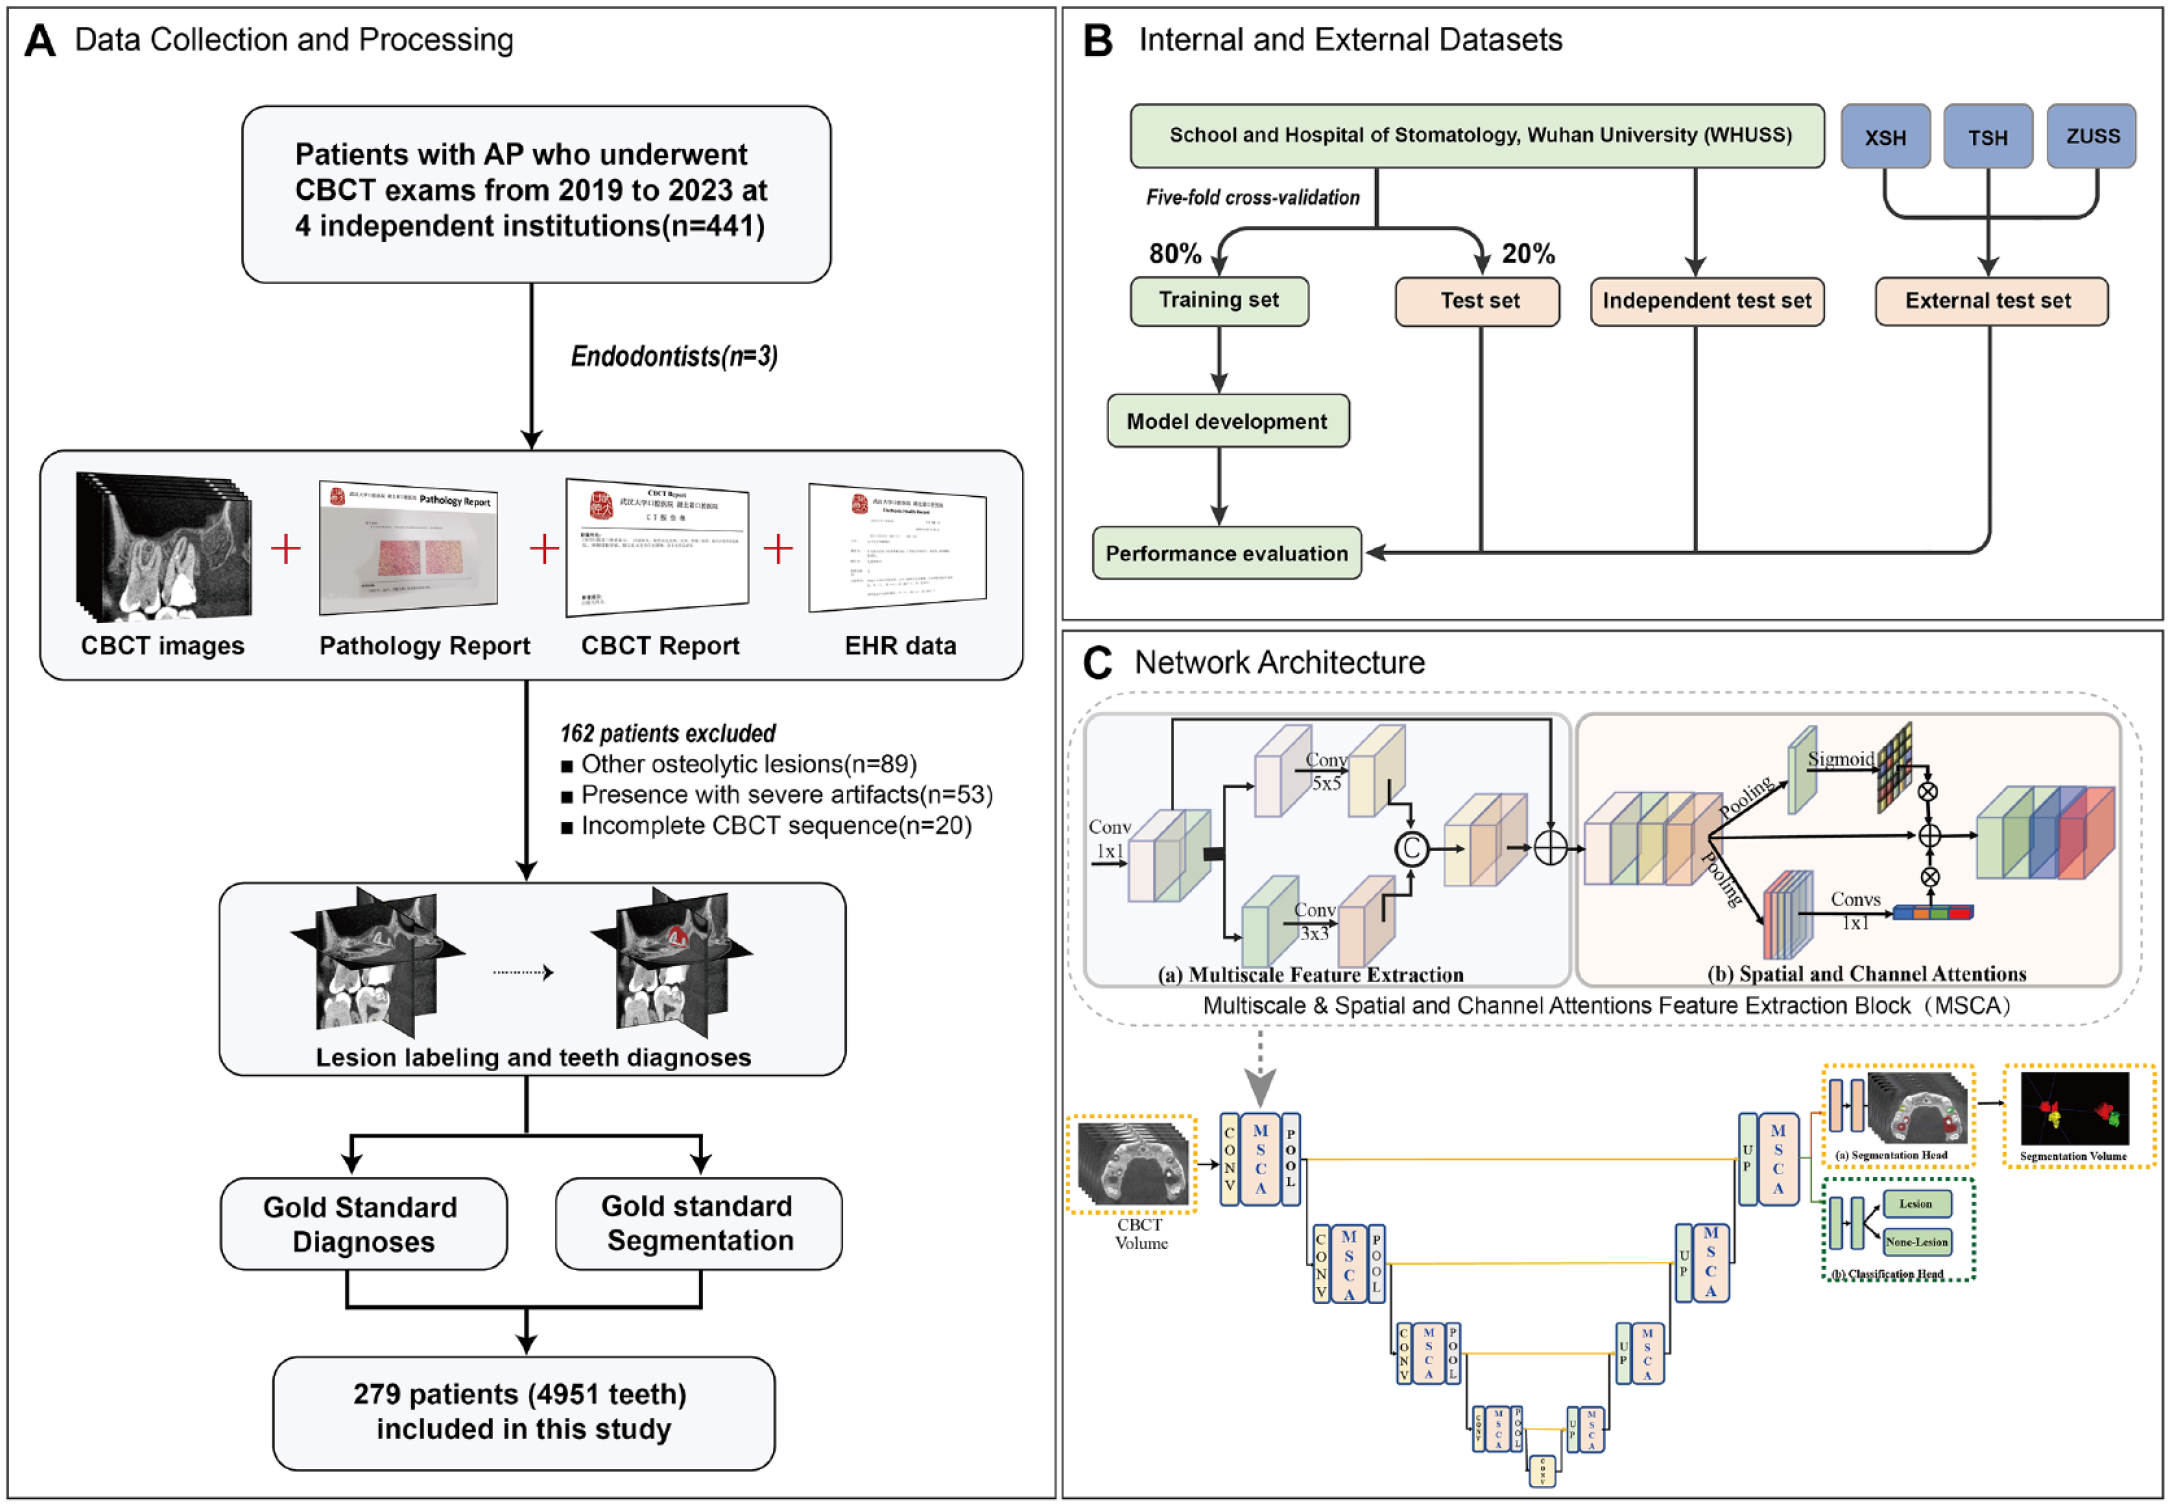
Overview of the study recruitment process, gold standard generation, and network architecture of PAL-Net. (
Data Acquisition and Preprocessing
The internal data set used for model training and testing included the CBCT images from patients who underwent endodontic treatment between 2019 and 2023 from the School and Hospital of Stomatology, Wuhan University (WHUSS). Digital Imaging and Communications in Medicine (DICOM)–format CBCT images were anonymously extracted from the database. Details about the CBCT machines are described in the Appendix. The internal data set was divided into 2 groups: 5-fold cross-validation set and independent test set. Based on the principle of the 5-fold cross-validation method, 80% of the CBCT data set was used for training and validation in each split fold, with the remaining 20% reserved for testing purposes. This process was repeated for each of the 5 folds, with a distinct subset of data designated as the test data set for each iteration. In addition, to mitigate any possible bias, a separate set of CBCT images that had not been included in model training was gathered and employed as an independent test set.
More strictly, to further assess the robustness of our model under real-world clinical conditions, we conducted external validation using 3 independent interregional data sets. The first data set was obtained from Xiangyang Stomatological Hospital (XSH) in Central China between 2019 and 2022, while the other 2 were collected from Tianjin Stomatological Hospital (TSH) in North China and Zhejiang University Stomatological School (ZUSS) in East China between 2019 and 2022.
Gold Standard Generation
This study included CBCT scans of permanent dentition with at least 1 tooth diagnosed as AP, providing a sufficient field of view (FOV) for visualizing the entire tooth structure and periapical region. Scans with severe artifacts caused by metal/implant restoration associated with regions of interest (ROIs), as well as those showing motion artifacts caused by excessive shaking or incomplete CBCT sequences, were excluded. In addition, scans with diagnoses of other osteolytic lesions, such as odontogenic keratocysts or dentigerous cysts, were also excluded.
Gold standard for diagnostic task
The gold standard diagnoses of AP were verified by 2 endodontists (W.T.F. and N.L.) using pathology and/or CBCT reports. Pathology reports, if available from subsequent endodontic microsurgery, were reviewed first (21 cases); otherwise, CBCT reports from the department of radiology combined with electronic health records were considered. Consensus diagnoses were made by joint discussions among 2 endodontists. In cases where consensus was not reached, a third expert (L.Y.M.) was consulted. The discussions were conducted until a consensus was made among the endodontists.
Gold standard for segmentation task
The gold standard segmentation of the ROIs was manually labeled by 2 well-trained endodontists (W.T.F. and N.L.) slice by slice at the voxel level using ITK-snap software (version 4.0.0; http://www.itksnap.org). All segmentation masks were double-checked jointly by the endodontists, and modifications were made, when necessary, by a third expert (L.Y.M.). The mean segmentation time for each CBCT was recorded.
Network Design and Configurations
To fully use the 3D spatial contextual information of the CBCT data for apical lesion detection and segmentation, in this article, we proposed a fully 3D CNN named PAL-Net. The architecture, implementation, and training details are provided in the Appendix.
Assessment, Validation, and Statistical Analysis of Model Performance
Evaluation of segmentation performance
To assess the segmentation performance of PAL-Net, we employed 3 commonly used evaluation metrics to quantify the volumetric overlap between the 3D segmentation outcomes and their corresponding gold standard segmentation—namely, the Dice similarity coefficient (DSC), precision, and F1-score. These metrics were computed at the patient level. The specific definitions and formulas for these metrics are presented in the Appendix.
Evaluation of diagnostic performance
To evaluate the diagnostic performance of PAL-Net, the following common metrics were used: sensitivity, positive predictive value (PPV), F1-score, and the area under the receiver operating characteristic (ROC) curve (AUC). The diagnosis was performed at the level of individual tooth in 3D. The details of these metrics are summarized in the Appendix. Time was recorded from the moment the algorithm received the DICOM files of the scan until a segmentation map was output.
To extensively evaluate the effectiveness of PAL-Net, we recruited 2 groups of dentists with varying levels of experience, including 10 junior dentists (less than 1 y of experience) and 10 senior endodontists (over 5 y of experience). After obtaining informed consent, the 20 dentists independently evaluated 100 randomly selected CBCT images from the 5-fold cross-validation set and 20 CBCT images in the independent test set with and without PAL-Net assistance. In the initial evaluation, the dentists independently made a diagnosis, and a week later, they reevaluated the testing set in a random order. During this interval, the dentists did not have access to the images from their initial diagnosis. Upon selecting a CBCT image, the PAL-Net software was opened, which subsequently displayed any detected apical lesions in red, indicating the affected area. Dentists were able to adjust the transparency of the outlined areas to compare PAL-Net’s results with their own diagnosis and thus made the definitive diagnoses. In addition, time was also recorded from receipt of the CBCT scan images to confirmation of the definitive diagnosis. Paired t test was used for the comparison of 2 groups before and after PAL-Net assistance.
To assess the interobserver and intraobserver agreement, 20 other randomly selected CBCT images, including 293 teeth (41 AP and 252 normal), were evaluated twice by the 20 dentists. Cohen’s κ (Cohen 1960) and Fleiss’s κ (Fleiss 1971) were calculated to assess intraobserver reliability of each dentist and interobserver reliability of 2 groups of dentists, respectively.
Robustness to lesions with different volumes
To evaluate the robustness of PAL-Net in detecting lesions of varying volumes, we compared the segmentation and detection results with the gold standard using DSC and accuracy metrics, respectively. The detailed definitions and calculation formulas of these metrics are described in the Appendix. All statistical analyses were performed with IBM SPSS statistical software Version 26.0. and Python Version 3.6.
Results
Baseline Characteristics
Among the 441 CBCT scans, 162 were eliminated based on the exclusion criteria. In summary, our internal data set used for 5-fold cross-validation included 2,841 teeth (381 AP, 2,460 normal) obtained from 178 patients. The independent test set included 324 teeth (36 AP, 288 normal) obtained from 20 patients. The external data sets from 3 independent dental facilities included 1,786 teeth (146 AP, 1,640 normal) obtained from 81 patients. Hence, the total sample size for the study is 4,951 teeth obtained from 279 patients. A detailed description of the demographic characteristics of the patients who were prescribed CBCT examination for each data set is presented in Table 1.
Demographic Characteristics of Patients Included in the Study.
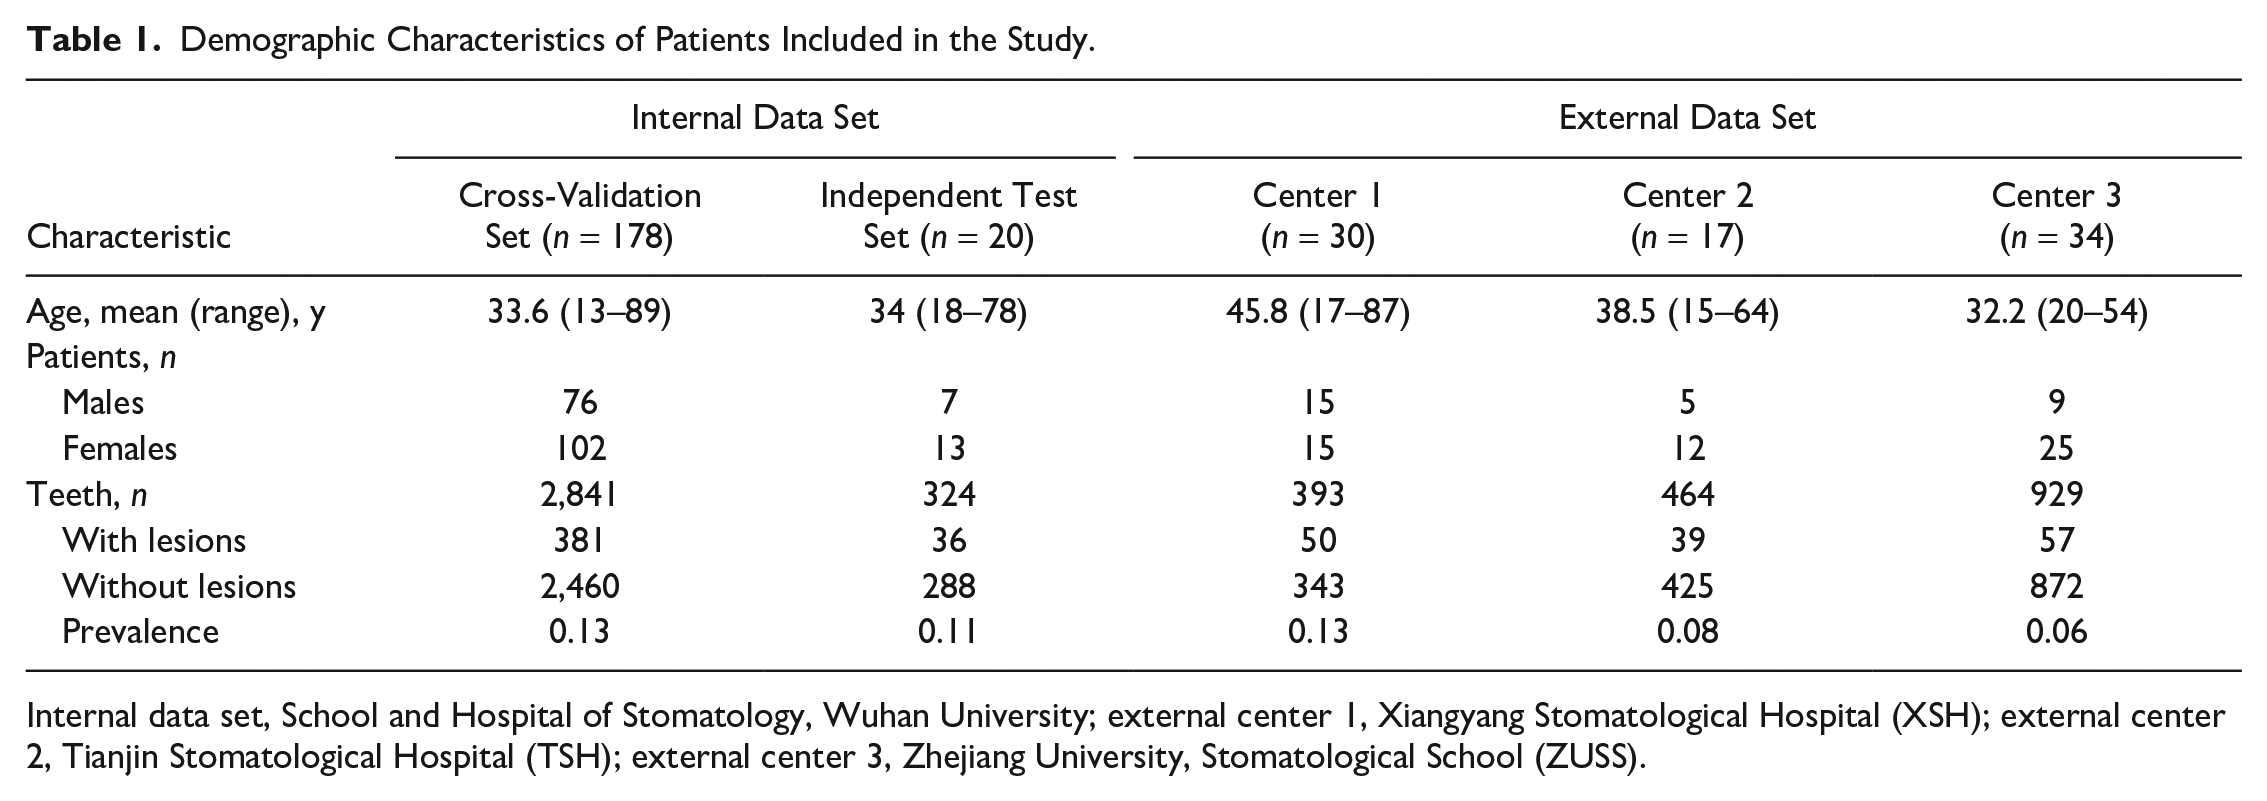
Internal data set, School and Hospital of Stomatology, Wuhan University; external center 1, Xiangyang Stomatological Hospital (XSH); external center 2, Tianjin Stomatological Hospital (TSH); external center 3, Zhejiang University, Stomatological School (ZUSS).
Performance of PAL-Net
Segmentation performance on the internal data set
The segmentation performances of PAL-Net on the internal data set are listed in Table 2. The results of our study demonstrate that PAL-Net achieved high segmentation performance, as evidenced by a mean DSC of 0.87 (95% CI, 0.85–0.88) and mean precision and F1-score values of 0.86 (95% CI, 0.83–0.88) and 0.85 (95% CI, 0.83–0.87), respectively, for 5-fold cross-validation. In the independent test set, PAL-Net achieved a mean DSC of 0.81 (95% CI, 0.73–0.88), with mean precision and F1-score values of 0.87 (95% CI, 0.82–0.93) and 0.83 (95% CI, 0.76–0.89), respectively (Table 2). The average time from uploading until segmentation result visualization was 22.56 ± 9.27 s, while the average time for expert manual segmentation was 23.80 ± 5.90 min. We also selected 3 representative apical lesions to visualize the heatmaps produced by PAL-Net. From Appendix Figure 1, we can see that PAL-Net focuses on the region of the lesion, which shows that our PAL-Net can accurately detect it, even for small lesions, and produce accurate segmentation results.
Evaluation of the Performance of PAL-Net on Internal and External Data Sets.
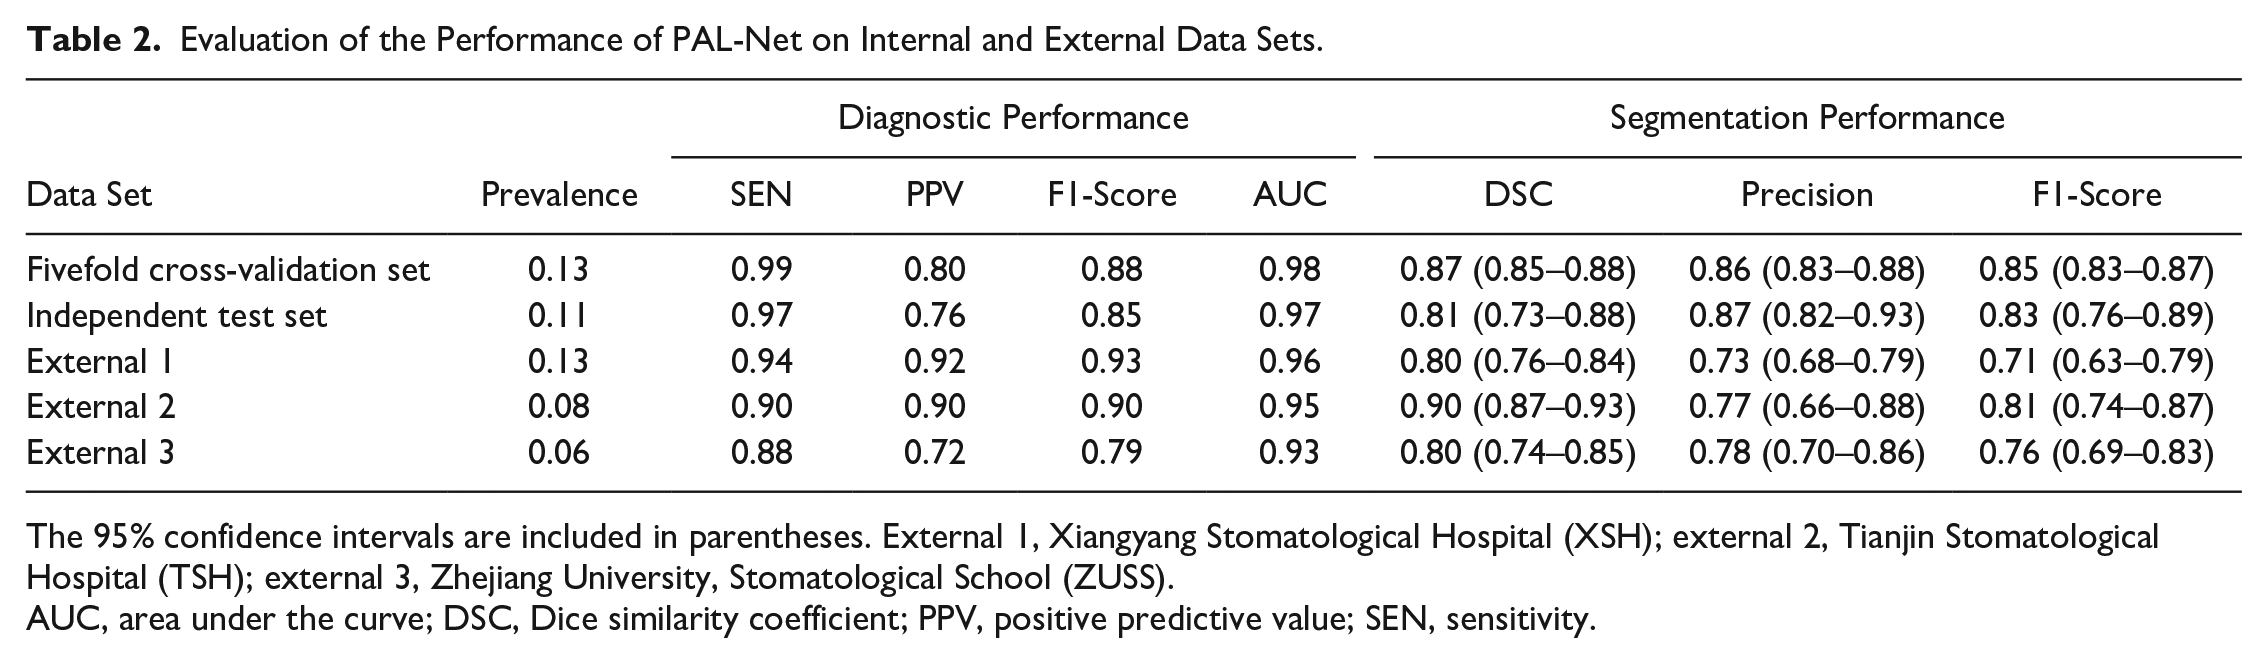
The 95% confidence intervals are included in parentheses. External 1, Xiangyang Stomatological Hospital (XSH); external 2, Tianjin Stomatological Hospital (TSH); external 3, Zhejiang University, Stomatological School (ZUSS).
AUC, area under the curve; DSC, Dice similarity coefficient; PPV, positive predictive value; SEN, sensitivity.
Diagnostic performance on the internal data set
In the 5-fold cross-validation set, PAL-Net achieved excellent performance in detecting PAL in tooth level, with a sensitivity of 0.99, PPV of 0.80, and F1-score of 0.88. (Table 2). With the aid of PAL-Net, except for the PPV of the senior dentists (Fig. 2Cb), the overall diagnostic performances of dentists were improved to some extent. The AUCs of PAL-Net also confirmed its superior performance over the most experienced dentist (AUC of 0.98 versus 0.93) (Appendix Fig. 2Ab). Moreover, PAL-Net only required a total of 64.2 min to evaluate 100 CBCT images, while the junior and senior dentists required an average of 208.5 min and 137.6 min, respectively. With the assistance of PAL-Net, the average time was reduced by 69.3 min and 32.4 min for the junior and senior dentists, respectively (Fig. 2Ad, Cd). Among 20 dentists, junior dentist 8 was most helped by the use of PAL-Net, with AUC increasing from 0.88 to 0.95 (Appendix Fig. 2Aa, c). However, the AUC of the senior dentist 10, who is the most experienced dentist with more than 10 y of endodontic clinical experience, was slightly reduced after using PAL-Net, from 0.93 to 0.92 (Appendix Fig. 2Ab, d).
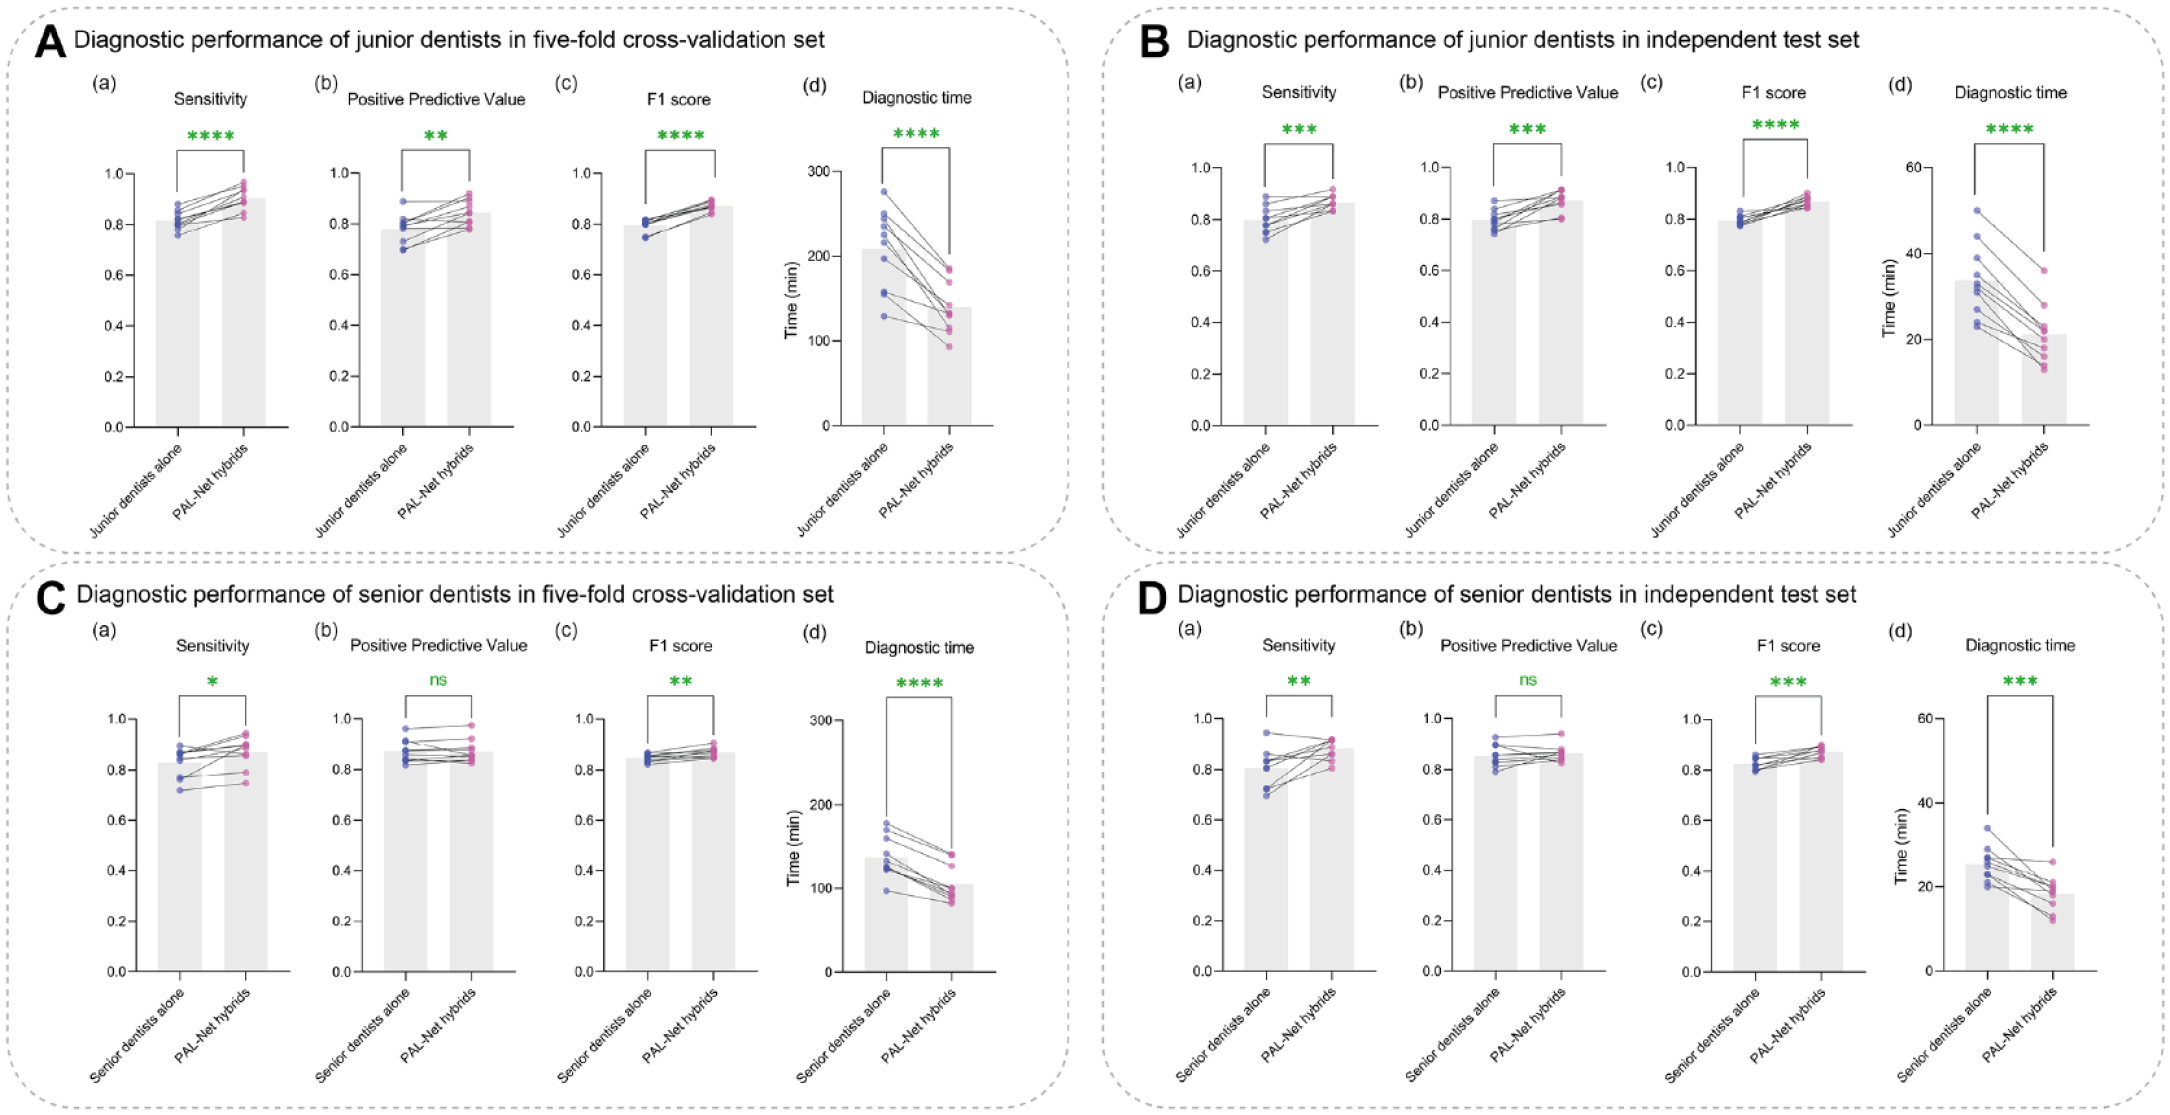
Comparison of performances with or without PAL-Net assistance. The diagnostic performances of junior dentists before and after PAL-Net assistance (
Moreover, the results of the independent test set were consistent with those of the 5-fold cross-validation, confirming the superior performance of PAL-Net. In terms of diagnostic performance, PAL-Net achieved a sensitivity of 0.97, PPV of 0.76, and F1-score of 0.85 (Table 2). With the assistance of PAL-Net, except for the PPV of the senior dentists (Fig. 2Db), the overall diagnostic performances of dentists improved to some extent, and the average time for diagnosing 20 CBCT images was reduced by 12.6 min and 7.1 min for the junior and senior dentists, respectively (Fig. 2B, D). The detailed confusion matrices and diagnostic performance of each data set are provided in the Appendix (Appendix Tables 2–6).
Sensitivity to small lesions
In clinical practice, it is common for dentists to overlook lesions with small volumes in asymptomatic patients. Our proposed PAL-Net, however, can detect such lesions with high accuracy. In this section, we classified lesions into 8 size-based categories, and Table 3 summarizes the performance of PAL-Net for each category. Our results demonstrate that PAL-Net can accurately detect lesions of all sizes, with high sensitivity to both small and larger lesions. In addition to reporting the accuracy of lesion detection, we also evaluated the segmentation performance of PAL-Net. Our experiments revealed that the proposed model is robust to both small and large lesions, further validating its high sensitivity.
Sensitivity to Different Volumes of Lesions.
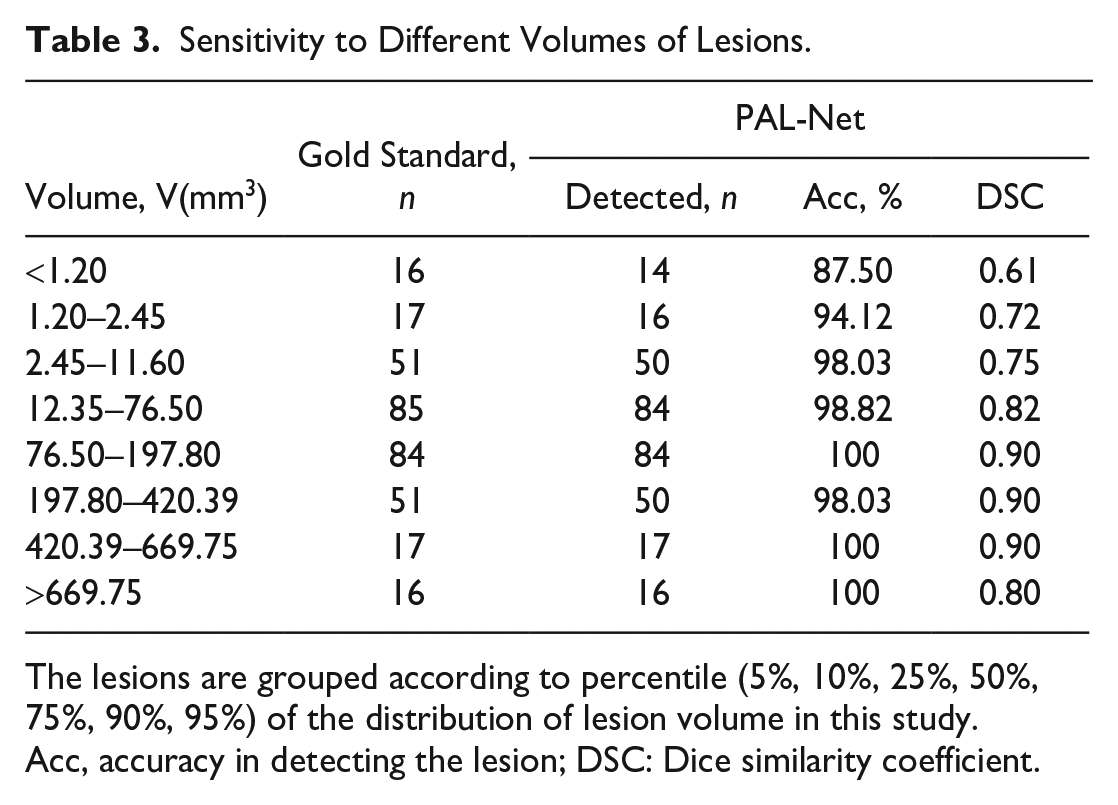
The lesions are grouped according to percentile (5%, 10%, 25%, 50%, 75%, 90%, 95%) of the distribution of lesion volume in this study.
Acc, accuracy in detecting the lesion; DSC: Dice similarity coefficient.
Robustness on 3 external data sets
To evaluate the robustness of PAL-Net in real-world clinical conditions, 3 external data sets were used to evaluate its performance (Table 2). PAL-Net achieved sensitivities of 0.94, 0.90, and 0.88; PPVs of 0.92, 0.90, and 0.72; F1-scores of 0.93, 0.90, and 0.79; and AUCs of 0.96, 0.95, and 0.93 in tooth level, demonstrating its high robustness in diagnosis (Appendix Fig. 3). In addition, our PAL-Net also achieved high segmentation performance, yielding DSCs of 0.80, 0.90, and 0.80 on the 3 external data sets. These experimental results show that our PAL-Net has high robustness in segmenting and detecting lesions associated with AP from CBCT images.
Interobserver and intraobserver agreement
Fleiss’s κ value for the interobserver agreement of the 10 junior and 10 senior dentists was 0.72 and 0.78, respectively. Cohen’s κ values indicated that the intraobserver agreement of each dentist was reliable, as summarized in Appendix Table 7.
Discussion
In this multicenter retrospective diagnostic study, a novel 3D deep learning model algorithm, named PAL-Net, was proposed for the automated detection and segmentation of PALs associated with AP from CBCT images. Based on 5-fold cross-validation, PAL-Net was developed with a relatively large training data set and evaluated in an independent test set. What’s more, its generalizability was geographically validated with 3 independent data sets. The experimental results proved the efficacy and accuracy of PAL-Net in detecting PALs associated with AP automatically. In the evaluation of PAL-Net, the system showed high accuracy in performing its tasks. In addition, we explored the clinical implication of PAL-Net in assisting dentists. Multiple experiments showed that PAL-Net outperformed dentists in diagnosing PALs associated with AP and may even match or surpass senior dentists in its ability to detect these lesions.
Furthermore, PAL-Net drastically improved the diagnostic performance of junior dentists, indicating its potential for integration into early career education and training programs for inexperienced dentists. In addition, PAL-Net could also help dentists make diagnoses quicker, relieving their clinical burden and reducing the amount of time that patients must wait clinically. However, senior dentists may be more cautious when receiving assistance from PAL-Net, leading to only marginal improvements or even a decrease in their diagnostic performance. In addition, PAL-Net provides quantitative information on the volume of apical lesions, a capability that traditional 2D radiography lacks. By quantifying pre- and postoperative volume changes, accurate segmentation can offer guidance for treatment planning, healing assessment, and outcome prediction for the clinicians (Boubaris et al. 2021). These findings highlight the potential of PAL-Net to assist dentists in detecting and diagnosing PALs associated with AP. What’s more, in order to lay the foundation for future research in this field, we have made the source code of PAL-Net publicly available, along with a portion of the data set.
PAL segmentation from CBCT scans has been attempted by several studies. However, our data set was far larger than those previously carried out, and we validated our algorithm differently. Our results showed that PAL-Net could outperform previously described methods (Appendix Table 8). For example, Orhan et al. (2020) employed a U-Net–like architecture to detect periapical pathosis. Their method involved the use of 2 separate convolutional neural networks and a series of postprocessing steps to localize the affected tooth and segment its condition and pathosis. Similarly, Setzer et al. (2020) used 5 U-Nets with shared parameters to segment PAL, with each U-Net focusing on a single slice. The features extracted from these 5 U-Nets were then integrated to segment the center slice. Zheng et al. (2021) adopted a dense U-Net with anatomical knowledge regularizations to automate dental CBCT segmentation and lesion detection, which outperformed the standard dense U-Net in terms of detecting lesions and the Dice indices. Kirnbauer et al. (2022) also proposed a 2-step method for PAL detection. Despite achieving remarkable results in automatic PAL detection, the performance in lesion segmentation is limited by the results of localization and identification, and the processing time required for multiple stages can be large, thereby limiting the model’s effectiveness. Although these methods achieved remarkable results, they are all based on single 2-dimensional (2D) slices from CBCT volumes or panoramic radiographs, leading to the neglect of 3D spatial information.
Considering the limitations of the aforementioned previous studies, we propose a novel 3D U-Net–based end-to-end segmentation method that incorporates 3D spatial information to further enhance the performance of PAL segmentation. Compared with existing related works, our proposed PAL-Net presents several key advantages. First, our PAL-Net is a fully 3D end-to-end network. Compared with existing 2D CNN-based methods, our PAL-Net can fully use 3D lesion volume information and improve the detection performance of both large and small lesions. Second, our PAL-Net is structurally innovative. It consists of a novel Multiscale & Spatial and Channel Attention Feature Extraction Block (MSCA), which combines a multiscale feature extraction module and spatial and channel attention module to extract information on small apical lesions and further solve the challenge of 3D CBCT images that cannot be directly segmented in 1 step. Third, external experiments have shown that our PAL-Net is more sensitive to lesions by introducing the novel attention mechanism, and it is more robust than other methods, which demonstrates the clinical value of our PAL-Net.
Despite the promising performance demonstrated by PAL-Net, a decrease in precision was observed when evaluating the third external data set. Several potential contributing factors can account for this phenomenon. Specifically, variations in imaging protocols influenced the quality and resolution of the images. The third data set predominantly consisted of medium to large FOV CBCT images with lower resolution, which contributed to diminished diagnostic accuracy. Furthermore, the overall prevalence of positive cases within the data set played a significant role. The lower overall prevalence in the third data set posed additional challenges for PAL-Net’s performance. Consequently, these factors should be considered when applying PAL-Net to diverse data sets, requiring cautious interpretation and further validation. What’s more, deep learning algorithms do not consistently outperform medical specialists in accurate diagnosis. The inherent complexity of the medical field, requiring a nuanced understanding of a patient’s medical history, symptoms, and signs, poses challenges for capturing all relevant information in a data set. In addition, the present data sets exclude any potential diseases other than lesions associated with AP, thereby focusing the algorithm’s training on this specific type of lesion. Considering a wide range of diseases in dentistry, accurately annotated data sets and multiple expert annotators are needed to achieve similar accuracy to a specialist in both diagnoses and differential diagnoses. Therefore, it is crucial to acknowledge that while our study demonstrates promising results for the detection of AP-related lesions, further research and validation are necessary to explore the algorithm’s performance in more complex clinical scenarios. These scenarios should involve data sets that encompass a wider range of dental diseases to ensure the algorithm’s generalizability and robustness in real-world clinical settings.
Conclusion
Given the limitations of this retrospective interregional diagnostic study, our novel proposed PAL-Net exhibited comparable performance to that of senior dentists in detecting lesions associated with AP while demonstrating excellent segmentation accuracy. The utilization of PAL-Net significantly enhanced the diagnostic performance among junior dentists, effectively reducing the time required for diagnosis. Moreover, the algorithm provided clinically relevant segmentation results that can assist clinicians in the treatment of AP-related lesions. Furthermore, PAL-Net exhibited its generalizability by geographical validation and demonstrated robustness in detecting lesions of varying volumes. Nevertheless, further research and validation are essential to establish the generalizability and reliability of the algorithm in real-world clinical scenarios.
Author Contributions
W.T. Fu, contributed to conception and design, data acquisition, analysis, and interpretation, drafted and critically revised the manuscript; Q.K. Zhu, contributed to design, data analysis and interpretation, drafted and critically revised the manuscript; N. Li, contributed to conception, data acquisition and interpretation, critically revised the manuscript; Y.Q. Wang, contributed to data analysis, drafted and critically revised the manuscript; S.L. Deng, H.P. Chen, J. Shen, contributed to data acquisition and interpretation, critically revised the manuscript; L.Y. Meng, contributed to conception and design, data acquisition and interpretation, drafted and critically revised the manuscript; Z. Bian, contributed to conception and design, data acquisition and interpretation, critically revised the manuscript. All authors gave their final approval and agree to be accountable for all aspects of the work.
Supplemental Material
sj-docx-1-jdr-10.1177_00220345231201793 – Supplemental material for Clinically Oriented CBCT Periapical Lesion Evaluation via 3D CNN Algorithm
Supplemental material, sj-docx-1-jdr-10.1177_00220345231201793 for Clinically Oriented CBCT Periapical Lesion Evaluation via 3D CNN Algorithm by W.T. Fu, Q.K. Zhu, N. Li, Y.Q. Wang, S.L. Deng, H.P. Chen, J. Shen, L.Y. Meng and Z. Bian in Journal of Dental Research
Footnotes
A supplemental appendix to this article is available online.
Declaration of Conflicting Interests
The authors declared no potential conflicts of interest with respect to the research, authorship, and/or publication of this article.
Funding
The authors disclosed receipt of the following financial support for the research, authorship, and/or publication of this article: Supported by grants (no. 81870761, 82071107, 82170944, 81970923) from the General Program of the National Natural Scientific Foundation of China and grant (no. 2022020801010498) from Wuhan Special Project on Knowledge Innovation.
Data and Materials Availability
More results and data are available in the Appendix. The whole data sets are not publicly available in order to preserve patient confidentiality. However, they can be offered from the corresponding authors on reasonable request. The source code and parts of experimental data are released. Source code: https://github.com/ahukui/Clinically_Oriented_CBCT_Periapical_Lesion_Evaluation_via_3D_CNN_Algorithm. Data and model weight: ![]()
References
Supplementary Material
Please find the following supplemental material available below.
For Open Access articles published under a Creative Commons License, all supplemental material carries the same license as the article it is associated with.
For non-Open Access articles published, all supplemental material carries a non-exclusive license, and permission requests for re-use of supplemental material or any part of supplemental material shall be sent directly to the copyright owner as specified in the copyright notice associated with the article.