
Abstract
Socioeconomic status (SES) measures one’s access to social resources across various dimensions. Traditionally, studies on SES commonly use principal component analysis (PCA), a data-driven method, to condense these dimensions into components, typically selecting the first component to represent SES. However, PCA may lack specificity for particular outcomes. Decision tree analysis (DTA), a knowledge-driven approach that identifies outcome-specific dimensions, may address PCA’s weaknesses but might not comprehensively capture SES. This study hypothesized that combining DTA and PCA to create SES predictors could enhance predictive accuracy more than using PCA alone could. It also explored whether the DTA-PCA combination, incorporating only significant loading indicators (SLIs) of the first component, could simplify SES predictors without compromising predictive accuracy. The study analyzed 12 SES indicators from the Study of Mothers’ and Infants’ Life Events Affecting Oral Health (SMILE) birth cohort study, involving 2,182 children. Five SES composites were created: 1 solely from DTA-identified indicators and 2 pairs combining values from either the entire first PCA component or SLIs with and without DTA. These composites served as predictors for predicting dental caries in 5 predictive models. Model accuracy was evaluated using root mean squared error with 5-fold cross-validation. SES composites derived from the DTA-PCA combination demonstrated superior predictive accuracy compared with those from the PCA-only approach. By incorporating only SLIs, this hybrid method generated SES predictors that not only outperformed those using the entire first component but also demonstrated noninferiority relative to the DTA-only method. This approach offers a promising framework for developing SES composites to predict dental caries, potentially improving the precision of predictive models. In addition, this method offers a practical framework for creating composite predictors from multi-item measurements across various outcomes. For future research using this method, a 3-step process is recommended: (1) identify relevant items using DTA, (2) determine their weights through PCA, and (3) generate a composite using the SLIs.
Keywords
Introduction
Socioeconomic status (SES), defined as one’s access to social and economic resources (Antonoplis 2023), is consistently reported as a macro-level factor that significantly influences nearly all health-related outcomes (Jones et al. 2019). SES studies typically involve multiple dimensional measurements, which are ultimately combined into an SES composite. Principal component analysis (PCA), a data-driven approach, is commonly used to reduce data dimensionality into a set of linearly uncorrelated principal components. These components are ordered by the amount of variance they capture, with the first component capturing the most information (Sarstedt and Mooi 2019; Gewers et al. 2021). Researchers often select the first component as the SES composite for further analysis.
However, PCA faces challenges in achieving specificity for predicting particular outcomes of interest (Vieira et al. 2022; Jaadi 2023), as different sets of indicators can construct varying components (Antonoplis 2023). The selection of indicators for creating SES composite remains controversial and lacks consensus (Long and Renbarger 2023). Therefore, it is crucial to seek alternative methods for developing SES composites that provide better predictive accuracy beyond PCA (Yost et al. 2001; Antonoplis 2023).
The recently introduced decision tree analysis (DTA) identifies SES indicators based on a knowledge and experience approach. DTA pinpoints relevant indicators by revealing the mechanisms linking SES to specific outcome of interest (Antonoplis 2023). While this method addresses the specificity weakness in PCA, it advocates for the individual use of SES indicators, which may limit their comprehensive predictive ability (Long and Renbarger 2023).
This study hypothesized that the DTA-PCA combination could yield SES components with better predictive accuracy for caries experience at age 5 than using PCA only. In addition, it aimed to evaluate whether the DTA-PCA combination, incorporating only a subset of indicators that significantly load onto the first PCA component, demonstrates better accuracy than using the entire first component and noninferior predictive accuracy compared with DTA alone.
The Study of Mothers’ and Infants’ Life Events Affecting Oral Health (SMILE) provides 12 key SES indicators along with clinical examinations for decayed, missing, and filled surfaces (dmfs) at age 5 offering a valuable opportunity to address these hypotheses. The ultimate goal of this study is to identify strategies for creating a robust SES predictor for specific outcomes. The analyses involved: (1) creating different SES composites using data informed by 3 approaches: DTA only, PCA only, and PCA with inputs from DTA; (2) evaluating the predictive accuracy of the created SES composites by applying predictive regression models; and (3) validating the predictive accuracy of these SES composites using K-fold cross-validation (Winoto and Roy 2023).
Methods
This study conformed to the STROBE guidelines.
SMILE
The SMILE study, funded by the National Health and Medical Research Council (NHMRC) project grant 1046219 (2013–2016), received ethical approval from the Southern Adelaide Clinical Human Research Ethics Committee (HREC), South Australian Women and Children Health Network HREC, and clinical governance clearance from the participating maternity hospitals (Do et al. 2014). SMILE recruited 2,182 mother-infant dyads from Adelaide’s 3 largest public hospitals between mid-2013 and mid-2014, exceeding the target sample of 1,700. Mothers consented within 48 hours postpartum, with incentives provided. More details of participant recruitment can be found elsewhere (Do et al. 2014). Follow-ups occurred at 3, 6, 12, 24, and 60 months, with participant responses detailed in Appendix Table 2. The study followed approved protocols for human subjects and did not involve animal samples.
SES indicators
At baseline, mothers or caregivers answered 21 SES-related questions adapted from validated items used from the Australian National Child Oral Health Study (Do et al. 2016). Eleven questions were grouped into 7 child/family indicators, while the remaining 10 formed 5 parental indicators, as detailed in Appendix Table 1. The final 12 SES indicators and their distributions are presented in Appendix Table 2.
Dental caries experience at age 5
Oral epidemiological examinations were conducted at 2 and 5 years of age to score for dmfs. The dmfs score was measured as count data, with each tooth surface exhibiting decay, being missing, or filled receiving a score of 1. The total dmfs score represents the sum of these scores for affected teeth. This study used dmfs score at age of 5 for the analysis.
Study Design
This study was conducted in 3 stages: first, DTA and PCAs (with and without DTA inputs) were conducted to create SES components; second, 5 SES composites were developed from these components; and third, predictive models were fitted and evaluated with K-fold cross-validation to determine the best SES composite predictor for dmfs scores (Figure 1).
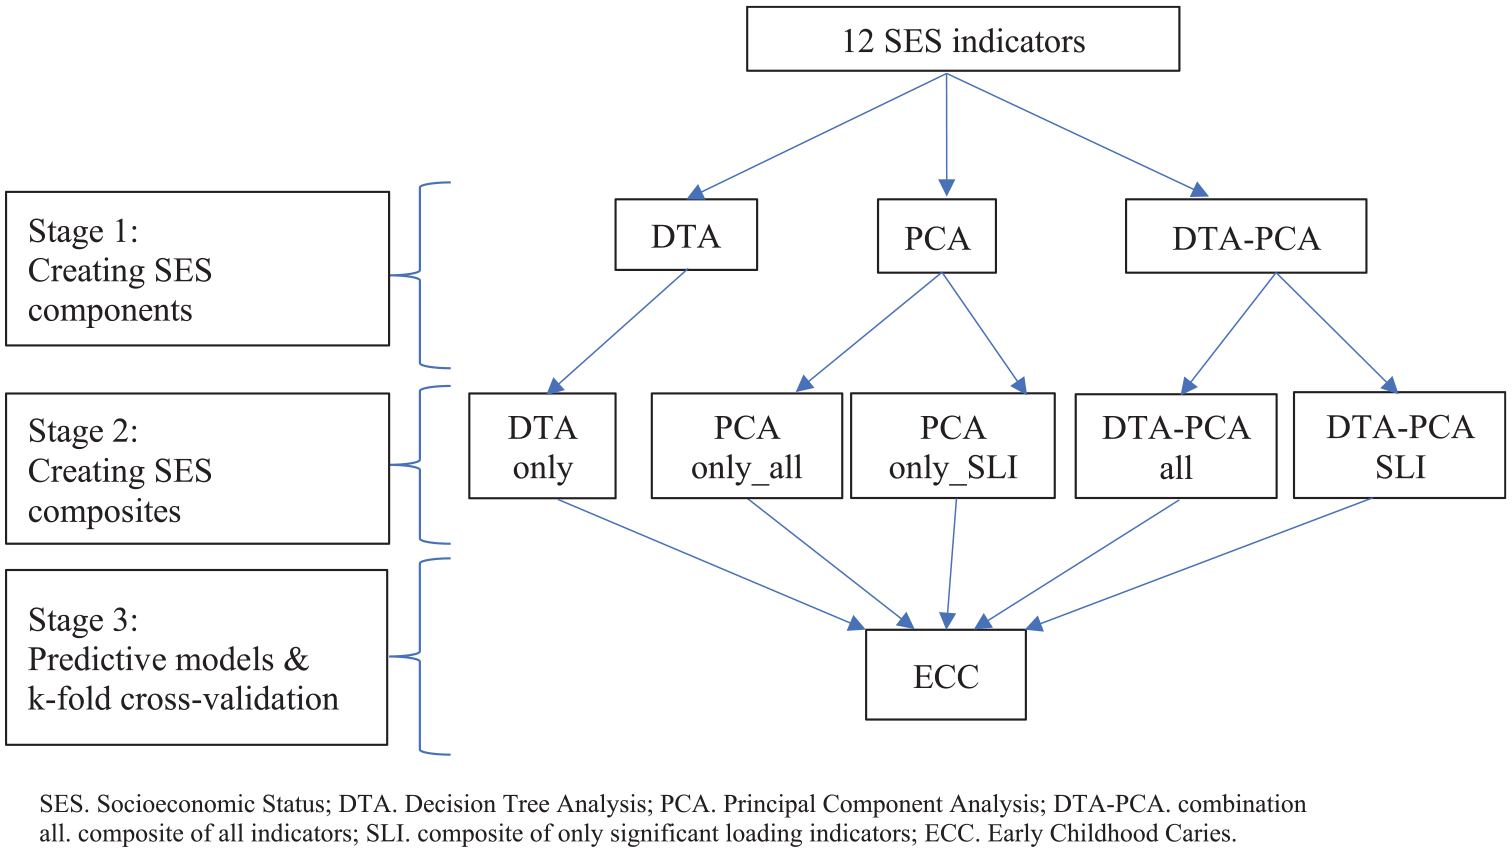
Flow chart of study design.
Stage 1: Creating SES components
The 12 SES indicators from the SMILE study were analyzed and categorized using 3 different methods: DTA, PCA, and DTA and PCA combination (DTA-PCA) to create SES components.
DTA
DTA was undertaken with 4 main steps of pathway analysis including specifying dmfs at age 5 as the outcome, exploring the main pathways/mediators linking SES to dmfs, translating the identified pathways into directed acyclic graphs, and matching the 12 available SES indicators from the SMILE study to each of the main mediators. Indicators that matched well with the identified mediators were kept for creating the SES-DTA composite in stage 2 and served as inputs for PCA.
PCA with and without DTA inputs
Two groups of PCA were conducted: PCA with DTA and PCA without DTA. In PCA with DTA, the only indicators identified from DTA were employed for PCA, while in PCA without DTA, all 12 SMILE variables were used. The process of conducting PCA, both with and without DTA, followed the 5 main steps (Jaadi 2023).
Standardize values of the 12 SES indicators
Compute the covariance matrix of these 12 SES indicators
Estimate eigenvalues to preliminarily have an idea of how many components should be retained (eigenvalues ≥ 1)
Evaluate 3 criteria to decide the number of components to retain, including the cumulative variance (≥0.5), unexplained variance (≤0.5), and the adequacy of sample size (Kaiser-Meyer-Olkin ≥0.5)
Identify factor loadings of the indicators in the first component and identify which indicators load significantly in this component (factor loadings ≥ 0.3)
Stage 2: SES composites
In this stage, 5 SES composites were created based on the SES components derived from DTA, PCA, and the combined DTA-PCA approaches. Specifically, 1 composite created by summing values of indicators identified solely from DTA; 2 composites summing all 12 indicators used for PCA, weighting them by their factor loadings of the first component, 1 with and 1 without DTA combination; and 2 composites using only significant loading indicators of the first components, again with and without DTA combination.
Stage 3: Predictive regression modeling, model evaluation, and validation
Predictive regression models
The 5 SES composites created in stage 2 were used as predictors to fit 5 predictive models where dmfs at age 5 y served as the outcome. Given that 76.6% of the dmfs score skews toward the zero value, zero-inflated regression models were applied. Sugar intake trajectories, plaque index at ages 2 and 5 y, and the number of dental visits in the first 5 y of a child’s life were controlled in model fits. Sugar intake was categorized into “low and moderate increase” and “high increase” based on group-based trajectory modelling (Ha et al. 2023). The plaque index, used as indicator of oral hygiene (Toledo Reyes et al. 2023; Ugolini et al. 2023), was classified into 4 levels: 0 (no plaque) to 3 (abundance of plaque), and the number of dental visits was used as a cumulative count variable. As a rule of thumb, only responses from these study variables, excluding missing values, were used to conduct the regression models.
Model evaluation
Root mean squared error (RMSE) is a common metric to evaluate the accuracy of the predictive models due to its sensitivity to errors and its intuitive interpretation (Max Kuhn 2013). RMSE measures the average magnitude of prediction errors by calculating the square root of the mean squared error (MSE) between predicted and observed values. This approach gives more weight to larger errors, which helps in identifying models that may underperform on extreme values. RMSE is expressed in the same units as the response variable, making it easy to understand. A lower RMSE value indicates a better model fit and less prediction error. RMSE is particularly suited for continuous outcome variables and is commonly used in regression analyses (Chai and Draxler 2014). For this study, RMSE was estimated postmodeling to assess the predictive accuracy of SES predictors.
The equations of MSE and RMSE are as follows:


where n represents the number of observations, yi the actual observed value of the outcome, and yhati represents the predicted values of the outcome.
K-fold cross-validations
K-fold cross-validation is a technique in which the entire data set is randomly divided into approximately k-equal folds. Each fold is used once as the test set, while the remaining k − 1 folds are used for training. For each iteration, the model is trained on k − 1 folds and tested on the remaining fold. This approach helps to validate the reliability of predictive regression models by reducing bias associated with a single train-test split and providing a more stable estimate of model performance through multiple train-test splits (Max Kuhn 2013).
In this study, the SMILE dataset was split into 5 folds, and RMSE values were calculated for each test set based on the training set parameters. The average RMSE values from the 5 test sets were compared. The model with the lowest average RMSE was deemed the most accurate for predicting dmfs at age 5.
Results
DTA
Appendix Figure 2 illustrates the use of DTA to identify pathways linking SES to dmfs at age 5 y. Three primary mediators were identified between SES and dmfs including the disadvantages of the area where the child lives (Armfield 2007), the financial and health care constraints of the family (Kumar et al. 2014), and the family’s cultural and educational disparities (Pezo Lanfranco and Eggers 2012). Among 12 SES indicators from the SMILE study, 10 were found to closely contribute to these mediators and were thus retained for creating SES composites and serving as inputs for PCA.
PCA
The number of responses for each of the 12 SES indicators, along with their distributions (mean, standard deviation, minimum, and maximum values) before and after standardisation (Appendix Table 5). The correlation matrix among the 12 indicators (Appendix Table 6) revealed significant correlations mainly among health insurance, income, occupation, education, English as a first language, attitude about family financial status, and the number of parents in the household.
PCA results, with and without DTA inputs, consistently indicated that 3-component models were more suitable than 2-component models. The eigenvalue thresholds for up to 3 components (Appendix Table 7), were all ≥1, and scree plots (Appendix Fig. 3) showed stabilization around an eigenvalue of 1. Model fit metrics (Appendix Table 8) also favored 3-component models, with cumulative variances meeting the >0.5 threshold better than those of 2-component models (PCA only: 0.58 vs. 0.46; DTA-PCA: 0.62 vs. 0.51). In addition, the unexplained variances for 3-component models met the <0.5 threshold better than those of 2-component models (PCA only: 0.42 vs. 0.54; DTA-PCA: 0.32 vs. 0.41). Consequently, only the first components of the 3-component PCA models were used for further analyses.
In PCA without DTA, 6 of the 12 indicators significantly loaded into the first component, while in PCA with DTA, 5 of the 10 indicators did so. Details of these indicators and their factor loadings are presented in Figure 2 and Appendix Table 9.
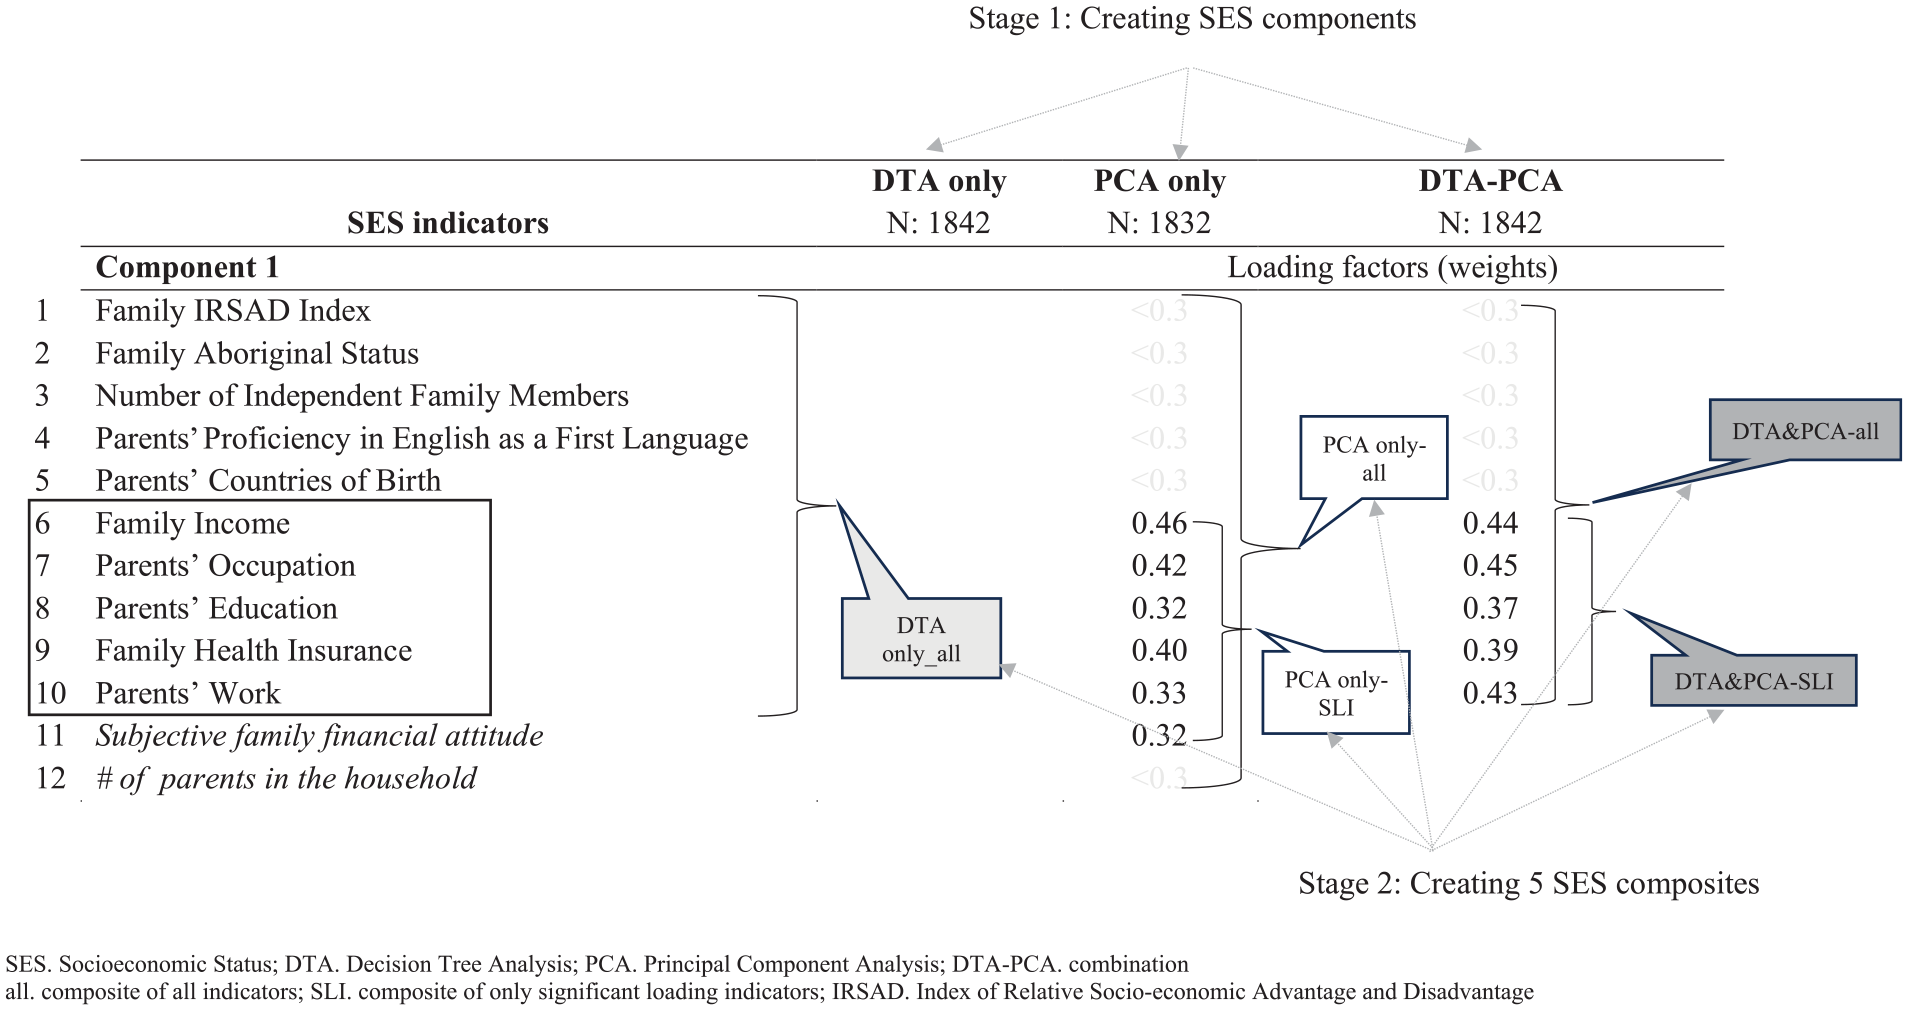
Creating socioeconomic status (SES) components and composites (principal component analysis).
SES composite creations
Figure 2 visualizes the creation of 5 SES composites: SES-DTA, which is a composite of the 10 indicators identified by DTA; SES-all (PCA only), which sums 12 indicators weighted by their factor loadings from PCA; SES–significant loading indicator (SLI) (PCA only), a composite of 6 significant loading indicators weighted by PCA factor loadings; SES-all (DTA-PCA), which includes 10 indicators identified by DTA, weighted by factor loadings from DTA-PCA; and SES-SLI (DTA-PCA), a composite of 5 significant loading indicators weighted by DTA-PCA factor loadings. These 5 SES composites were used as predictors for fitting predictive regression models.
Predictive Regression Models
The distribution of dmfs at age 5 was highly skewed, with a skewness of 6.45 and kurtosis of 58.64. Up to 76.6% of the observations scored 0, while the mean dmfs was 1.34 with a standard deviation of 4.54, reflecting a wide range from 0 to 60 (Table 1, Appendix Fig. 1 and Appendix Table 3). Five zero-inflated regression models were initially conducted without controlling for confounders and later adjusting for them. Since participants had the right to decline participation at any round or stage of the survey or to refuse to answer any questions, only completed cases for both SES information and clinical examination at age 5 were included for each of these 5 regressions, respectively.
Distribution of SES Predictors, Confounders, and Outcome of the Predictive Models.

DTA, decision tree analysis; PCA: principal component analysis; SD, standard deviation; SES, socioeconomic status; SES-all, SES of 12 indicators; SES-SLI, SES distilled from only 5 significant loading SES indicators.
10−9.
10−10.
Skewness: 6.45, kurtosis: 58.64, median: 0, 75th percentile: 0.
Of the 2,182 participants at baseline, 1,842 completed the SES indicators for the DTA-only composite, while 1,832 and 1,873 completed PCA-only indicators for SES-all and SES-SLI, respectively. For the DTA-PCA combination, 1,842 and 1,878 participants completed the SES-all and SES-SLI indicators, respectively (Table 1). Among the 830 participants clinically examined at age 5, 761, 758, 765, 761, and 767 completed SES information of these 5 SES composites, respectively (Table 2 and Appendix Table 4). The comparison of participants who remained at age 5 y versus those who were at the baseline revealed the remainers had higher standardized SES composite scores (0.55 vs. 0.15; P < 0.001, t test) (Appendix Table 10).
Root Mean Square Errors of 5 Predictive Models.

DTA, decision tree analysis; DTA-PCA, combination between DTA and PCA; N, sample size of the entire data set; n, sample size of the train set; PCA, principal component analysis; RMSE: root mean square error; SES, socioeconomic status; SLI, significant loading indicator.
The results showed that all 5 SES composites significantly predicted dmfs at age 5 (Fig. 3). However, the DTA-PCA combination consistently demonstrated better predictive accuracy, with lower RMSE values (Table 2). For SES-all, the RMSE was 1.97 versus 2.04 (unadjusted) and 1.70 versus 1.72 (adjusted). For SES-SLI, it was 1.86 versus 1.88 (unadjusted) and 1.67 versus 1.73 (adjusted). SES composites from DTA-PCA using only significant loading factors of the first component showed even better accuracy than those using the entire component. Notably, this composite outperformed SES-DTA in the unadjusted model (RMSE: 1.86 vs. 2.52) and was comparable in the adjusted model (RMSE: 1.67 vs. 1.68).
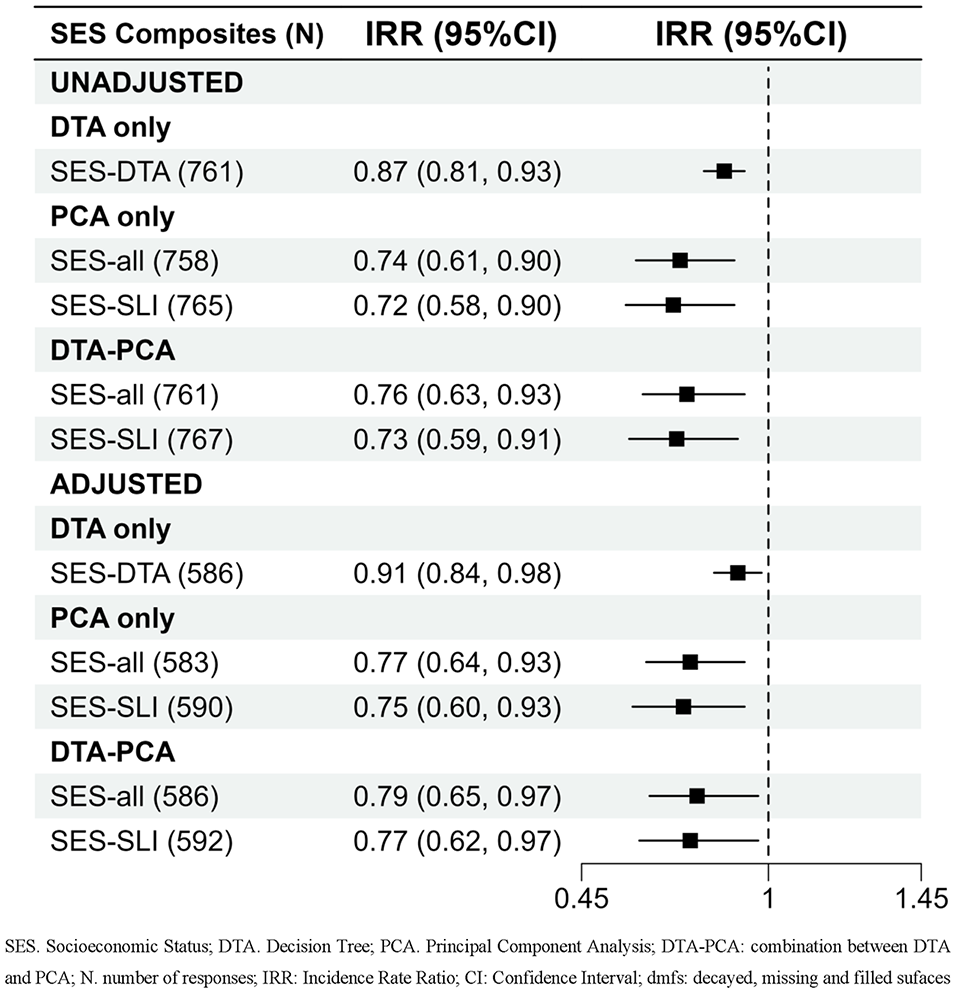
Results of regression models using 5 SES composites to dmfs at the age of 5 y. DTA, decision tree analysis; DTA-PCA, combination between DTA and PCA; PCA, principal component analysis; SES, socioeconomic status; SLI, significant loading indicator.
K-fold cross-validations
Results of the regression models using the entire data set and those with spliting data (K-fold cross-validation) (Table 2, Appendix Table 10 and Table 11) supported these findings, reinforcing that SES composites from the DTA-PCA combination exhibited superior predictive accuracy compared with PCA alone. RMSE values for SES-all and SES-SLI were consistently lower for DTA-PCA than for PCA only, in both unadjusted and adjusted models. In addition, DTA-PCA composites with significant loading indicators showed better predictive accuracy than those using the entire first component and noninferior accuracy compared with the SES-DTA in the adjusted models.
Discussion
This study investigated effective strategies for creating robust SES predictors to forecast dental caries. Five SES composites were developed using different methods: DTA alone, PCA with and without DTA, and combinations including either the entire first loading component or only significant loading factors. The results indicated that the SES composites created from the DTA-PCA combination exhibited better predictive accuracy than those from PCA alone method. Specifically, using only significant loading indicators from the DTA-PCA combination yielded superior accuracy than the entire first component and was comparable with the DTA-only model.
These findings support the hypothesis that combining a data-driven method and expert knowledge enhances the model accuracy, aligning with recent trends in predictive modeling (Hasidi et al. 2024). Incorporating only significant loading indicators maintains model accuracy while simplifying it, supporting the parsimony approach (Antonoplis 2023) and the recommendation for strategic item selection while employing multi-item SES measurements (Long and Renbarger 2023).
Traditional methods for creating SES composites struggle with weighting indicators (Office of Behavioral and Social Sciences Research Access 2024, https://obssr.od.nih.gov/sites/obssr/files/Measuring-Socioeconomic-Status.pdf). While PCA addresses this issue (Vieira et al. 2022), it often falls short in creating outcome-specific composites (Vyas and Kumaranayake 2006). Although DTA addresses PCA’s limitations by incorporating expert judgment, it may not capture the full variance of the study variables (Antonoplis 2023). This study demonstrates that combining DTA and PCA effectively tackles these challenges, providing a nuanced understanding of SES and its impact on dental caries (Vyas and Kumaranayake 2006; Max Kuhn 2013).
Previous SES research has typically used either data-driven (Gewers et al. 2021; Klosterman 2021) or knowledge-driven approaches (Antonoplis 2023). This study extends the field by showing that a hybrid approach offers superior predictive accuracy compared with the data-driven method alone, supporting the growing recognition of hybrid strategies in machine learning (Li and Chu 2023). It also reaffirms the importance of the “big three” SES measures including income, education, and occupation, commonly reported overtime (Shavers 2007; Majumder 2021), which were significant in both PCA and DTA approaches.
The study’s strength lies in advocating for the hybrid DTA-PCA approach, which achieved comparable predictive accuracy to DTA alone but with fewer indicators. This combination leverages the knowledge-driven strengths of DTA while enhancing efficiency through PCA. In addition, k-fold cross-validation ensured robust model evaluation, mitigating overfitting and underfitting risks (Max Kuhn 2013). The consistent predictive accuracy observed in both standard and 5-fold cross-validated models underscores the effectiveness of this approach.
DTA, as a knowledge-driven strategy, is particularly suitable for studies such as ours, in which prior knowledge about relevant features is available (Antonoplis 2023). It incorporates this knowledge to create a pathway linking SES exposure to Early Childhood Caries (ECC) outcomes, ensuring only meaningful SES indicators within the pathway are included. In contrast, random forest, a purely data-driven method, relies on multiple randomly created decision trees to identify patterns and is better suited for cases lacking prior knowledge of relevant features (Klosterman 2021).
The use of only significant loading indicators for creating SES composites allows for efficient questionnaire design and provides guidance on essential indicators in contexts in which extensive data collection is challenging. Specifically, this study recommends including at least 5 key SES indicators (income, occupation, education, work, and health insurance) for predicting dental caries.
The study’s birth cohort design faced participant attrition, leading to differences between those who remained and dropped out. However, this likely had minimal impact, as low-SES mothers were oversampled at baseline (Do et al. 2014). Evidence supports this approach, as the dmfs score at age 5 y in SMILE (1.34, 95% confidence interval [CI]: 1.0–1.6) aligns with the South Australian population (1.40, 95% CI: 1.0–1.6), with comparable proportions of children affected (23.4%, 95% CI: 20.6–26.4 vs. 25.3%, 95% CI: 20.5–30.8) (Appendix Table 12) (Do et al. 2016). In addition, the remaining sample sizes used for modeling were verified with G*Power software (Faul et al. 2009) (Appendix Fig. 4), achieving 100% statistical power across all models (Appendix Table 13–16).
Future research should adopt a 3-step process to develop composite predictors from multidimensional measurements: first, identify relevant indicators using DTA; second, determine their weights with PCA; and third, generate a composite predictor using significant loading items. In addition, the model, developed in a low-caries population, should be validated in high-risk groups for generalizability.
Conclusion
The DTA-PCA combination, using significant loading indicators, offers a robust method for creating accurate SES composites to predict dental caries. This approach achieved performance similar to the decision tree model with fewer indicators. It enhances SES measurement precision and provides a practical framework for developing composite predictors from multi-item measures.
Author Contributions
A.T.M. Dao, contributed to conception, design, data acquisition, analysis, and interpretation, drafted and critically revised the manuscript; L.G. Do, N. Stormon, H.V. Nguyen, D.H. Ha, contributed to conception, design, data interpretation, critically revised the manuscript. All authors gave final approval and agree to be accountable for all aspects of the work.
Supplemental Material
sj-docx-1-jdr-10.1177_00220345251324494 – Supplemental material for Enhancing Socioeconomic Status Prediction for Cavities: A Hybrid Method
Supplemental material, sj-docx-1-jdr-10.1177_00220345251324494 for Enhancing Socioeconomic Status Prediction for Cavities: A Hybrid Method by A.T.M. Dao, L.G. Do, N. Stormon, H.V. Nguyen and D.H. Ha in Journal of Dental Research
Footnotes
Acknowledgements
We would like to express our gratitude to the research team of the SMILE for their efforts in securing the study grant and coordinating and implementing the surveys. We also thank the SMILE participants for providing information and taking part in clinical examinations. In addition, we would like to thank the Oral Health Centre (OHC) at the University of Queensland for their technical support of the present manuscript.
Declaration of Conflicting Interests
The authors declared no potential conflicts of interest with respect to the research, authorship, and/or publication of this article.
Funding
The authors disclosed receipt of the following financial support for the research, authorship, and/or publication of this article: This study used data from the Study of Mothers’ and Infants’ Life Events Affecting Oral Health (SMILE), which was conducted under the Project Grant APP1161581 support by the NHMRC. The authors received no financial support for authorship, and/or publication of this article.
A supplemental appendix to this article is available online.
References
Supplementary Material
Please find the following supplemental material available below.
For Open Access articles published under a Creative Commons License, all supplemental material carries the same license as the article it is associated with.
For non-Open Access articles published, all supplemental material carries a non-exclusive license, and permission requests for re-use of supplemental material or any part of supplemental material shall be sent directly to the copyright owner as specified in the copyright notice associated with the article.