
Abstract
The regeneration of periodontal, periapical, and pulpal tissues is a complex process requiring the direct involvement of cells derived from pluripotent stem cells in the periodontal ligament and dental pulp. Dental pulp stem cells (DPSCs) and periodontal ligament stem cells (PDLSCs) are spatially distinct with the potential to differentiate into similar functional and phenotypic cells. We aimed to identify the cell heterogeneity of DPSCs and PDLSCs and explore the differentiation potentials of their specialized organ-specific functions using single-cell transcriptomic analysis. Our results revealed 7 distinct clusters, with cluster 3 showing the highest potential for differentiation. Clusters 0 to 2 displayed features similar to fibroblasts. The trajectory route of the cell state transition from cluster 3 to clusters 0, 1, and 2 indicated the distinct nature of cell differentiation. PDLSCs had a higher proportion of cells (78.6%) at the G1 phase, while DPSCs had a higher proportion of cells at the S and G2/M phases (36.1%), mirroring the lower cell proliferation capacity of PDLSCs than DPSCs. Our study suggested the heterogeneity of stemness across PDLSCs and DPSCs, the similarities of these 2 stem cell compartments to be potentially integrated for regenerative strategies, and the distinct features between them potentially particularized for organ-specific functions of the dental pulp and periodontal ligament for a targeted regenerative dental tissue repair and other regeneration therapies.
Introduction
The periodontal apparatus and the dental pulp are complex structures that comprise both soft and hard tissues and are responsible for the primary masticatory function of the tooth (Caton et al. 2018). Regeneration of these specialized tissues requires multipotent stem cells to differentiate into various functional cells (Williams et al. 2021). Periodontal ligament stem cells (PDLSCs) and dental pulp stem cells (DPSCs) are the primary sources of the multipotent stem cells responsible for maintaining the homeostasis of dental and periodontal tissues (Krivanek et al. 2020). While both DPSCs and PDLSCs can differentiate into similar cell types (e.g., osteoblasts, cementoblasts, and fibroblasts) (Alves et al. 2022; Sowmya et al. 2015), they are distinct populations in separate compartments (Alves et al. 2022; Huang et al. 2009; Krivanek et al. 2020). Understanding the unique characteristics of DPSCs and PDLSCs is essential for their roles in embryonic development and regeneration of lost tissues due to dental and periodontal infections.
Current methods to define specific cell populations are mainly based on defined cell-surface markers (Saeys et al. 2016). Recent advances in single-cell RNA sequencing (scRNA-seq) have enabled a comprehensive analysis (Zhao et al. 2021) for the discovery of specific phenotypic markers of differentiation of PDLSCs into osteoblasts, cementoblasts, and periodontal ligament fibroblasts to provide a basis for identifying the functionally distinct PDLSC and DPSC subgroups and cell type–specific biomarkers for targeted therapy (Iwata et al. 2010; Yang et al. 2013). To achieve these, we performed scRNA-seq of DPSCs and PDLSCs to understand their heterogeneity at the single-cell level and directly sequenced the samples without cell culture before sequencing to avoid a biased representation of the cell populations. We hypothesized that the PDLSCs and DPSCs contain subgroups involved in similar regenerative processes, and distinct gene expression in these clusters is responsible for organ-specific functions (dental pulp vs. periodontal ligament). Using state-of-the-art bioinformatics, we characterized different cell populations, including expression profiles of featured genes and differentiation potentials, and applied a novel and unique strategy to implicate functions of cell clusters by collecting and bulk-RNA-sequencing the differentiated cells from PDLSCs and DPSCs.
Materials and Methods
PDLSC and DPSC Isolation from Human Teeth
Biobanked cells were isolated from extracted and previously characterized teeth at The Forsyth Institute (Albuquerque-Souza et al. 2020). Informed consent was approved by the Institutional Review Board at The Forsyth Institute (IRB #14–10). Teeth from 3 systemically healthy individuals (aged 21–27 y, 1 female and 2 males) were used with an indication for third molar extraction with intact periodontium, roots, and pulp, without periodontal inflammation, caries, and dental calculus. Samples from the 3 individuals were pooled together to have enough cells for single-cell sequencing analysis. The periodontal ligament (PDL) and dental pulp (DP) tissue samples were obtained from the same teeth using the previously described protocol (Iwata et al. 2010; Yang et al. 2013) (Fig. 1A). An overview of the primary cell isolation and analysis is shown in Fig. 1B-H.
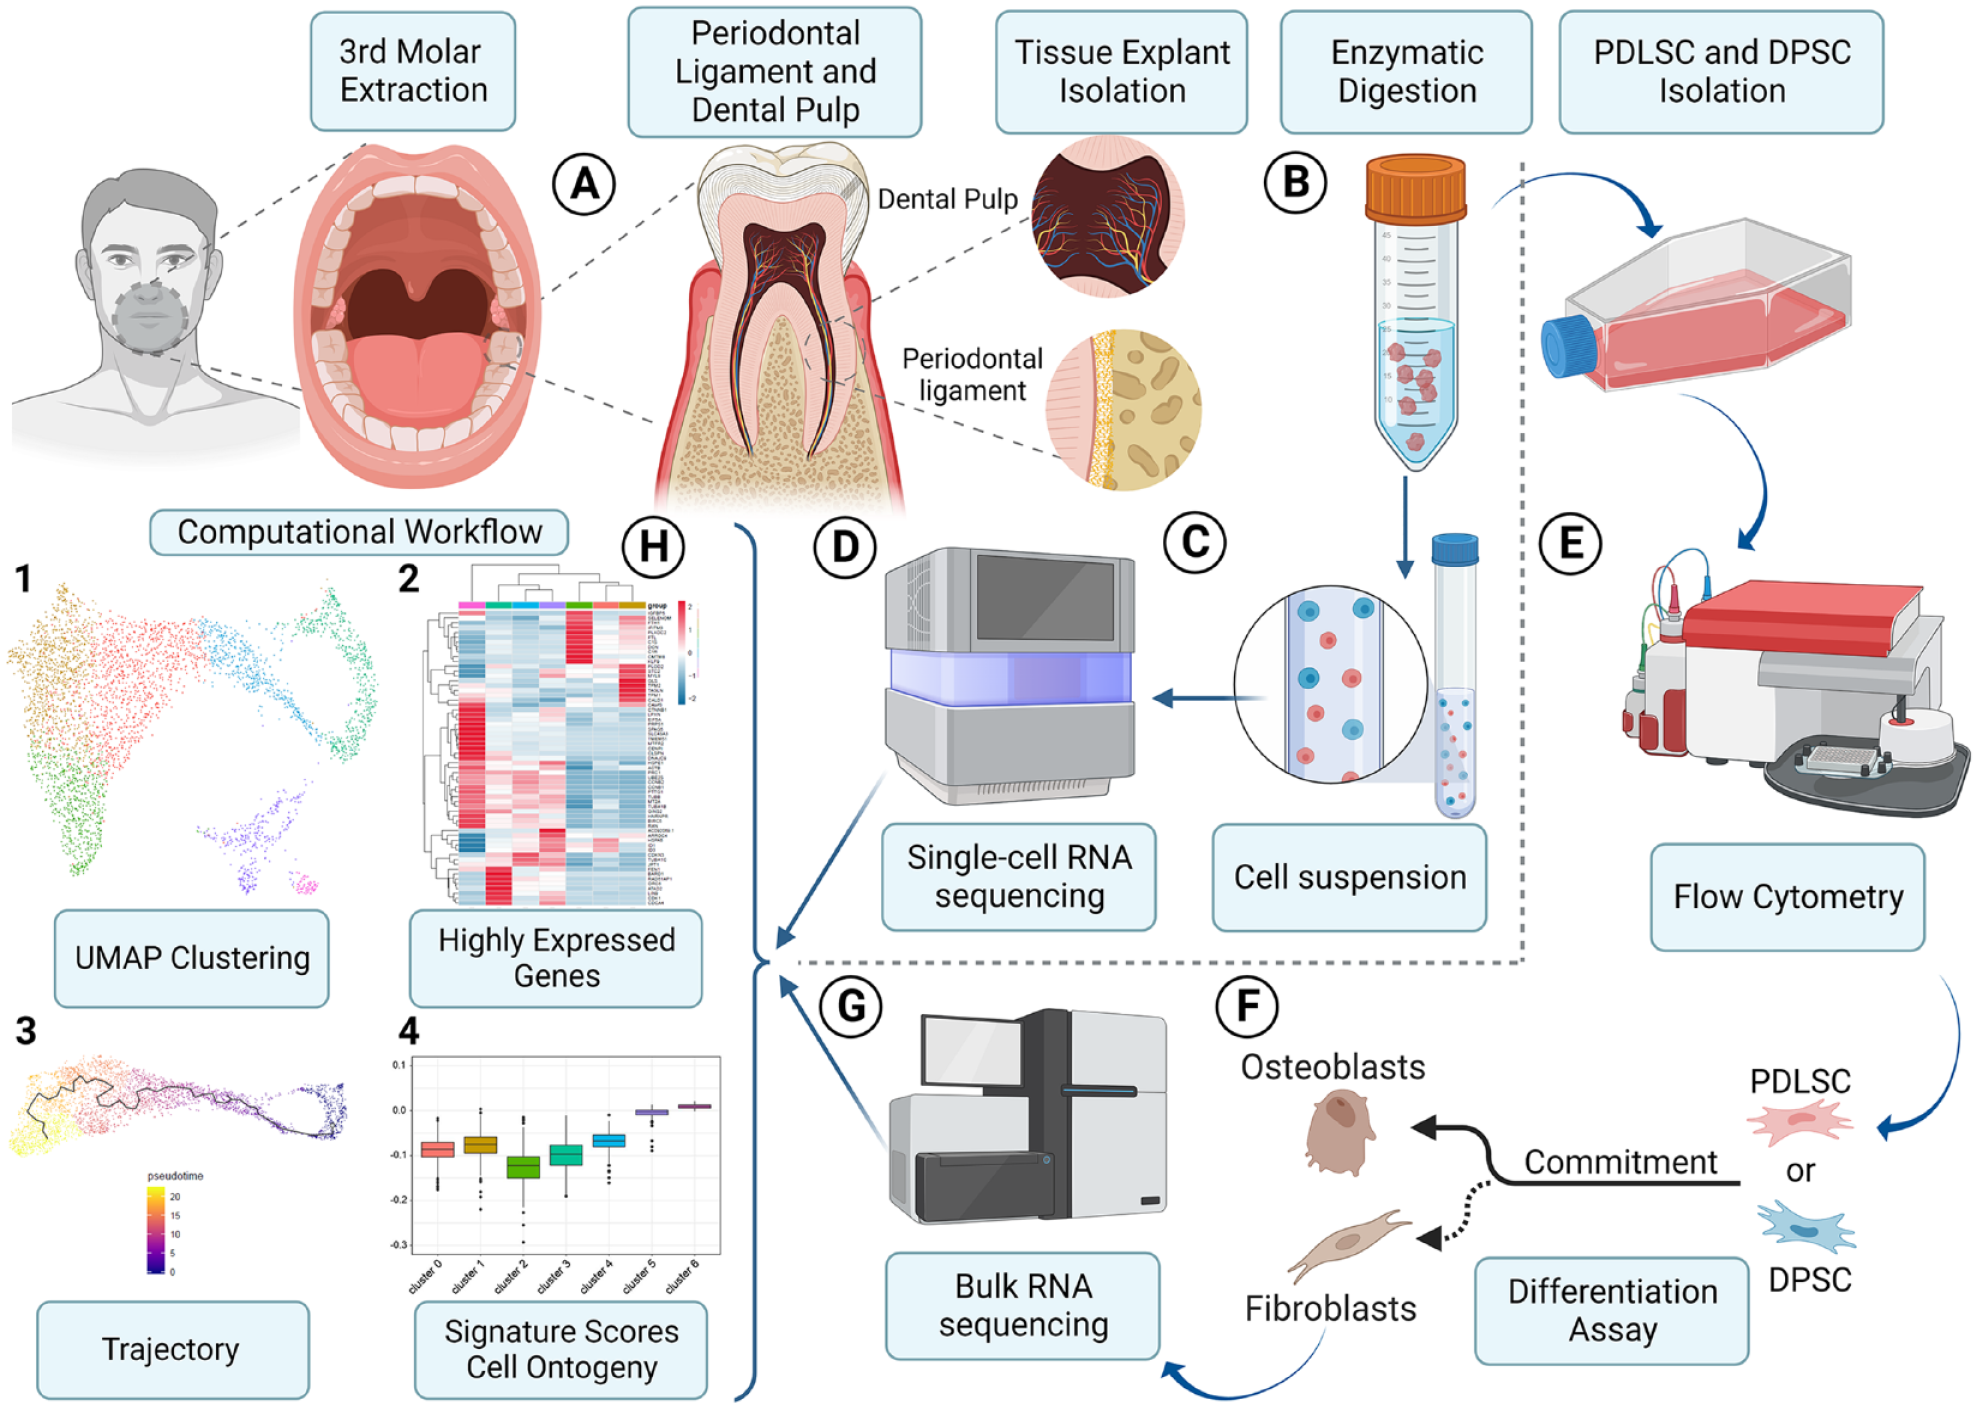
Human periodontal ligament and dental pulp cell isolation, bulk and single-cell RNA sequencing workflow. (
Phenotyping was performed through flow cytometry using CD11b, CD44, CD45, CD73, CD90, CD105, HLA-ABC, Oct-4, and Sox-2. The stemness characterization of these cells was confirmed, as previously explained in full detail and published by our group (Albuquerque-Souza et al. 2020).
Single-Cell Preparation and scRNA-seq Data Generation
Fresh-frozen samples were prepared at The Forsyth Institute and shipped within the same day to University of North Carolina at Chapel Hill (UNC-CH) for sequencing. No cell culture was performed before sequencing. The 10X GENOMICS Chromium System was used to characterize the transcriptome of individual DPSCs and PDLSCs. Illumina HiSeq 3000 was used for deep sequencing. Very deep sequencing was achieved with >380 million reads per sample. The raw reads were aligned to the human reference genome GRCh38, and gene expression was quantified using Cell Ranger. A total of 2,363 and 2,098 cells were obtained in DPSC and PDLSC samples, respectively.
Bioinformatic Analysis of scRNA-seq Data
Data from scRNA-seq were analyzed using Seurat v3 (Stuart et al. 2019). First, low-quality cells that expressed fewer than 200 genes and low-expressed genes that were expressed in fewer than 3 cells were filtered out. The cells having >10% mitochondrial counts were also removed from the data sets. After filtering, 2,266 and 1,955 high-quality cells of DPSC and PDLSC samples, respectively, were used for the downstream analysis. Integration anchors were identified and used for merging the 2 data sets. Clustering was performed on the integrated data set with a resolution parameter of 0.3. Differential expression analyses were performed among different clusters using the FindMarkers function of the Seurat package. Only the genes expressed in at least 25% of cells in either of the 2 tested groups were used for the analysis. The genes with a log-scaled fold change >0.25 and adjusted P < 0.05 were considered statistically significant (differentially expressed genes [DEGs]). The functional importance of the DEGs was assessed via enrichment analysis of Gene Ontology (GO) and Kyoto Encyclopedia of Genes and Genomes (KEGG) pathways using the clusterProfiler package (Yu et al. 2012). To further explore the difference between DPSCs and PDLSCs, for DPSCs and PDLSCs, respectively, differential expression analysis was also performed for each cluster over all the other cells from the corresponding sample by the FindMarkers function as mentioned above, and the top upregulated genes of each cluster were visualized by heatmaps.
The differentiation potential of the cells from each cluster was quantitatively measured by single-cell entropy (scEntropy) score using the SLICE package with default parameters (Guo et al. 2017). SLICE first estimated functional gene clusters based on the GO annotations from the DAVID database so that genes could be assigned to a functional gene cluster (Guo et al. 2017;
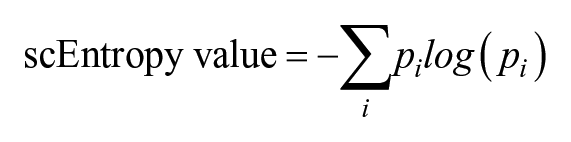
Cells with high scEntropy values were considered “undifferentiated” with high heterogeneity and potential to be differentiated into multiple cell fates. Those with lower scEntropy values were considered more differentiated cells. Single-cell trajectory analysis was carried out using Monocle v3 to investigate the putative cell transition among different cell clusters (Qiu et al. 2017).
Bulk RNA-seq of Differentiated DPSCs and PDLSCs for Cell-Type References
Bulk RNA-seq data were generated from 2 main differentiated cell types (osteoblasts and fibroblasts) from the corresponding DPSCs and PDLSCs to build their corresponding cell type–specific gene expression references. Adapter contamination and low-quality ends whose base quality was less than 20 were trimmed from each of the raw sequencing reads using Trim Galore (https://www.bioinformatics.babraham.ac.uk/projects/trim_galore). Clean reads were mapped to the human reference genome GRCh38 using STAR (Dobin et al. 2013). The fibroblast signature genes were defined as the DEGs when comparing fibroblasts to osteoblasts using edgeR (Robinson et al. 2010), with a |log2(fold-change)| (logFC) threshold of 1 and adjusted P value cutoff of 0.05. We computed the expression Signature Scores to infer the concordance between cell clusters identified in scRNA-seq data and bulk fibroblast and osteoblast samples (Lim et al. 2009). For each cell in each cluster, a Signature Score was computed to measure the concordance of that cell within fibroblasts and osteoblasts via the expression of these signature genes in the cells of the cluster, following the equation shown below:

where for each signature gene g,
Results
Characterization of Cell Clusters Captured in DPSCs and PDLSCs by scRNA-seq
We identified 7 distinct cell clusters (Fig. 2A, Table), each exhibiting different gene expression patterns (Fig. 2B, Appendix Table 1) and pathways ( Appendix Tables 2 and 3). Cluster 3 showed the most significant difference between DPSCs and PDLSCs. Figure 2B presents the cluster-specific signature genes differentially expressed across the 7 clusters. To gain further insight into the functional characteristics of each cluster, we compiled a list of genes known to be expressed in PDLSCs and DPSCs from scRNA-seq studies (Chiba et al. 2020; Pagella et al. 2021), GeneCards (Stelzer et al. 2016), Protein Atlas (Uhlen et al. 2015), and ImmGen (Immunological Genome 2020), and created a dot plot for comparative profiling (Fig. 2C, Appendix Table 1).
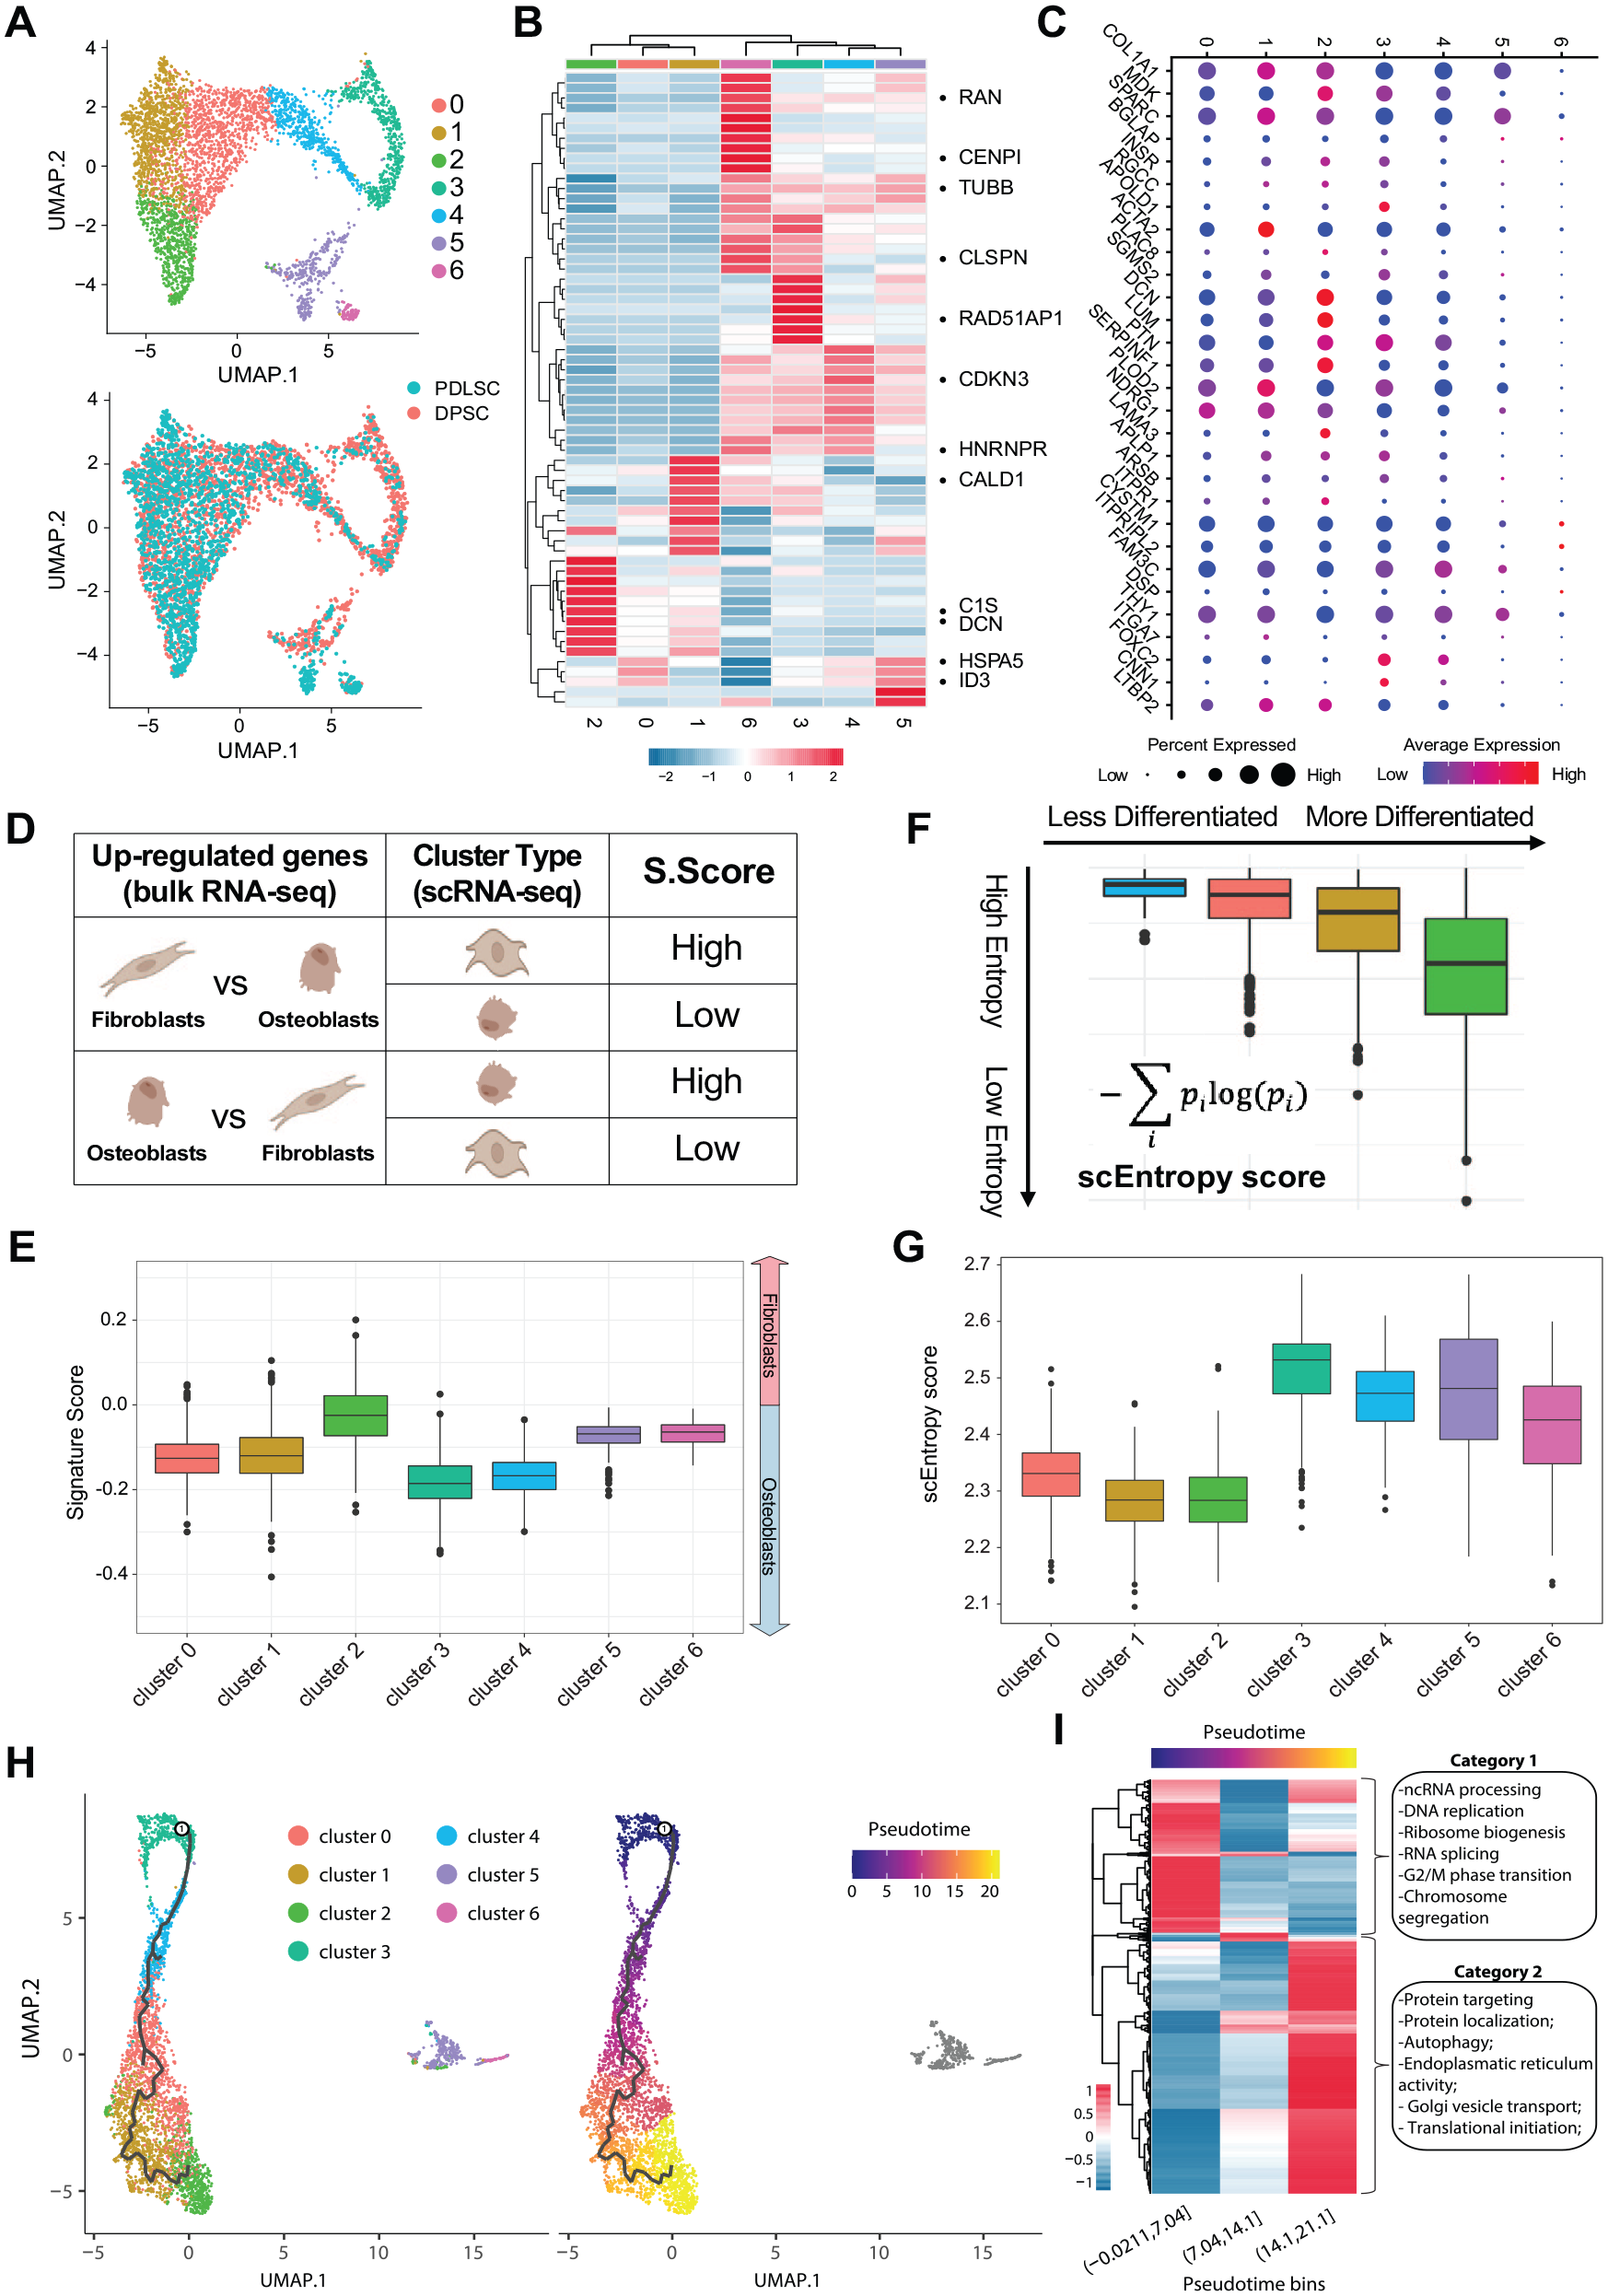
Cluster composition and gene signatures in periodontal ligament stem cells (PDLSCs) and dental pulp stem cells (DPSCs). (
Number of Cells by Clusters.
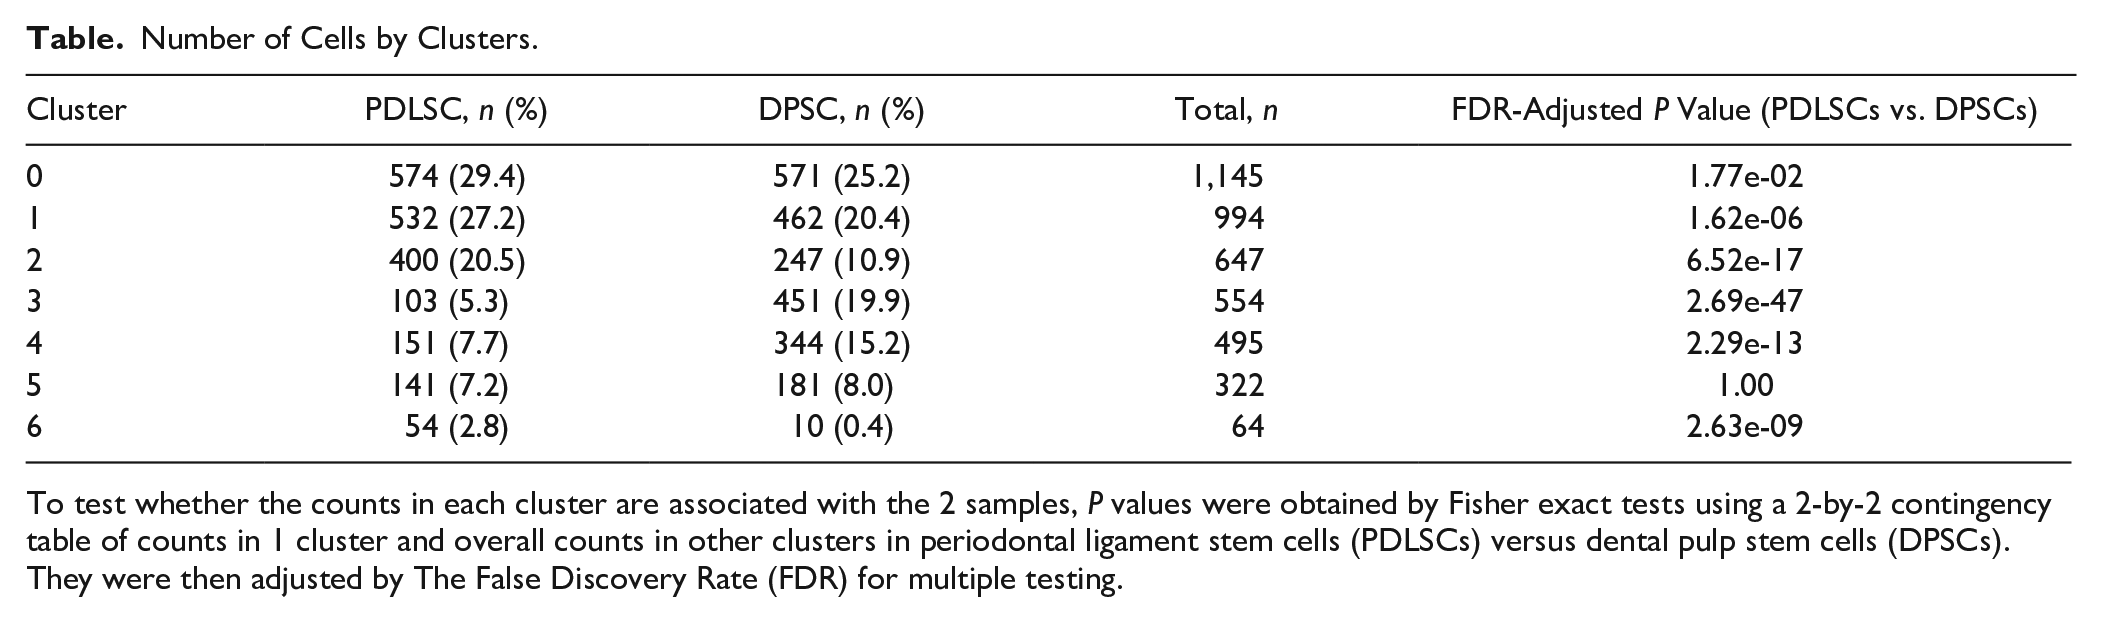
To test whether the counts in each cluster are associated with the 2 samples, P values were obtained by Fisher exact tests using a 2-by-2 contingency table of counts in 1 cluster and overall counts in other clusters in periodontal ligament stem cells (PDLSCs) versus dental pulp stem cells (DPSCs). They were then adjusted by The False Discovery Rate (FDR) for multiple testing.
Putative differentiation potentials and trajectory analysis
We analyzed the putative differentiation potentials of the identified clusters and performed trajectory analysis. To quantify the similarity among cell clusters to fibroblasts and osteoblasts, we computed the Signature Score of fibroblasts (vs. osteoblasts)using scRNA-seq data and the bulk RNA-seq data of fibroblast and osteoblast samples differentiated from the same subjects as the scRNA-seq samples (Fig. 2D). Cluster 2 exhibited the highest Signature Score of fibroblasts (Fig. 2E), suggesting the highest transcriptional similarity to fibroblastic gene signatures, while cluster 3 showed the highest scEntropy scores, indicating a higher differentiation potential than the other clusters (Fig. 2F, G).
Trajectory analysis uses scRNA-seq data to build a lineage or tree structure of cells to show the transition relationships among cell clusters; it is particularly suitable for understanding stemness in cell clusters for stem cell–enriched samples because the scRNA-seq data capture the different cell differentiation lineage along the estimated pseudotime of cell transitions associated with stemness in cells. Therefore, we further performed trajectory analysis on all the individual cells and revealed a temporal pathway course with cluster 3 and cluster 2 at the 2 ends (Fig. 2H). According to their difference in stemness, cluster 3 could be the earliest point in the pseudotime, consistent with stemness in the less mature stage. Clusters 4, 0, 1, and 2 followed a trajectory toward sequentially later differentiation stages, suggesting that these clusters were either already committed to or already differentiated into other cell types (Fig. 2H). In total, 9,516 genes were found to be differentially expressed over pseudotime ( Appendix Tables 4 and 5). These genes were assigned into 2 categories according to their expression profiles. Functional enrichment analysis revealed that category 1 genes were related to differentiation, stemness, and basic cell housekeeping processes, consistent with the stem cell phenotype expected in the early stages. On the contrary, category 2 genes reflected a phenotype of well-differentiated or already committed cell types (Fig. 2I). SPARC is also highly expressed in category 2. The smooth continuous trajectory curves in Figure 2H strongly support the complete capture of stem cell differentiation lineage rarely seen in more mature cell populations. Clusters 3 and 4 displayed biological features related to the cell cycle and relatively higher stemness and were labeled as “stem-like” clusters. In contrast, cluster 2 exhibited the highest similarity to fibroblasts and was labeled the “fibroblast-like” cluster. Clusters 0 and 1 were denoted as “intermediate” clusters for convenience, as they were at the intermediate stage of the trajectory between the “stem-like” and “fibroblast-like” clusters (Fig. 2H). Clusters 5 and 6 may be linked to either undergoing cell death or the inflammasome-related pyroptotic pathways based on their overexpressed genes. Therefore, it is unsurprising that clusters 5 and 6 do not trajectory-align with the stem cell differentiation lineage of DPSCs and PDLSCs.
Comparison of cell cluster-specific features between DPSCs and PDLSCs
We then compared the proportions of DPSCs and PDLSCs in each cluster, which revealed significant differences in clusters 0, 1, 2, 3, 4, and 6 (Fig. 3A, B and Table). Notably, PDLSCs had more “fibroblast-like” cells (cluster 2), while DPSCs had more “stem-like” cells (clusters 3 and 4). The Uniform Manifold Approximation and Projection (UMAP) visualization demonstrated diverse expression patterns across the various clusters (Fig. 3B). We identified the cluster-specific biomarkers in DPSCs ( Appendix Table 6) and PDLSCs ( Appendix Table 7) and compared the top biomarker genes in each cluster between the 2 cell populations. Although DPSCs and PDLSCs shared similar expression profiles of canonical markers for each cluster (Fig. 3C), there were important differences in the expression of certain genes (Fig. 3D, E). We found that ID1 and ID3 were more upregulated in cluster 0 than other clusters in both DPSCs and PDLSCs, followed by cluster 4 (ID1) or cluster 2 (ID3) in both samples (Fig. 3D, E). For cluster 1, high CALD1, TPM1, and TPM2 expression are shared in the 2 samples; SLC2A1 is among the top genes in only PDLSCs. For cluster 2, a transcription factor gene SOX4 for cell fate and embryonic development is among the top genes in DPSCs but not in PDLSCs. For the most stem-like cluster (cluster 3), DPSCs and PDLSCs shared unique cluster-specific genes CDCA5, ORC6, and RAD51AP1; CDC6 for cell division is among the top genes in DPSCs but not in PDLSCs. Cluster 3 also has common genes with cluster 4, including TUBA1C, CCNB1, and CCNB2.
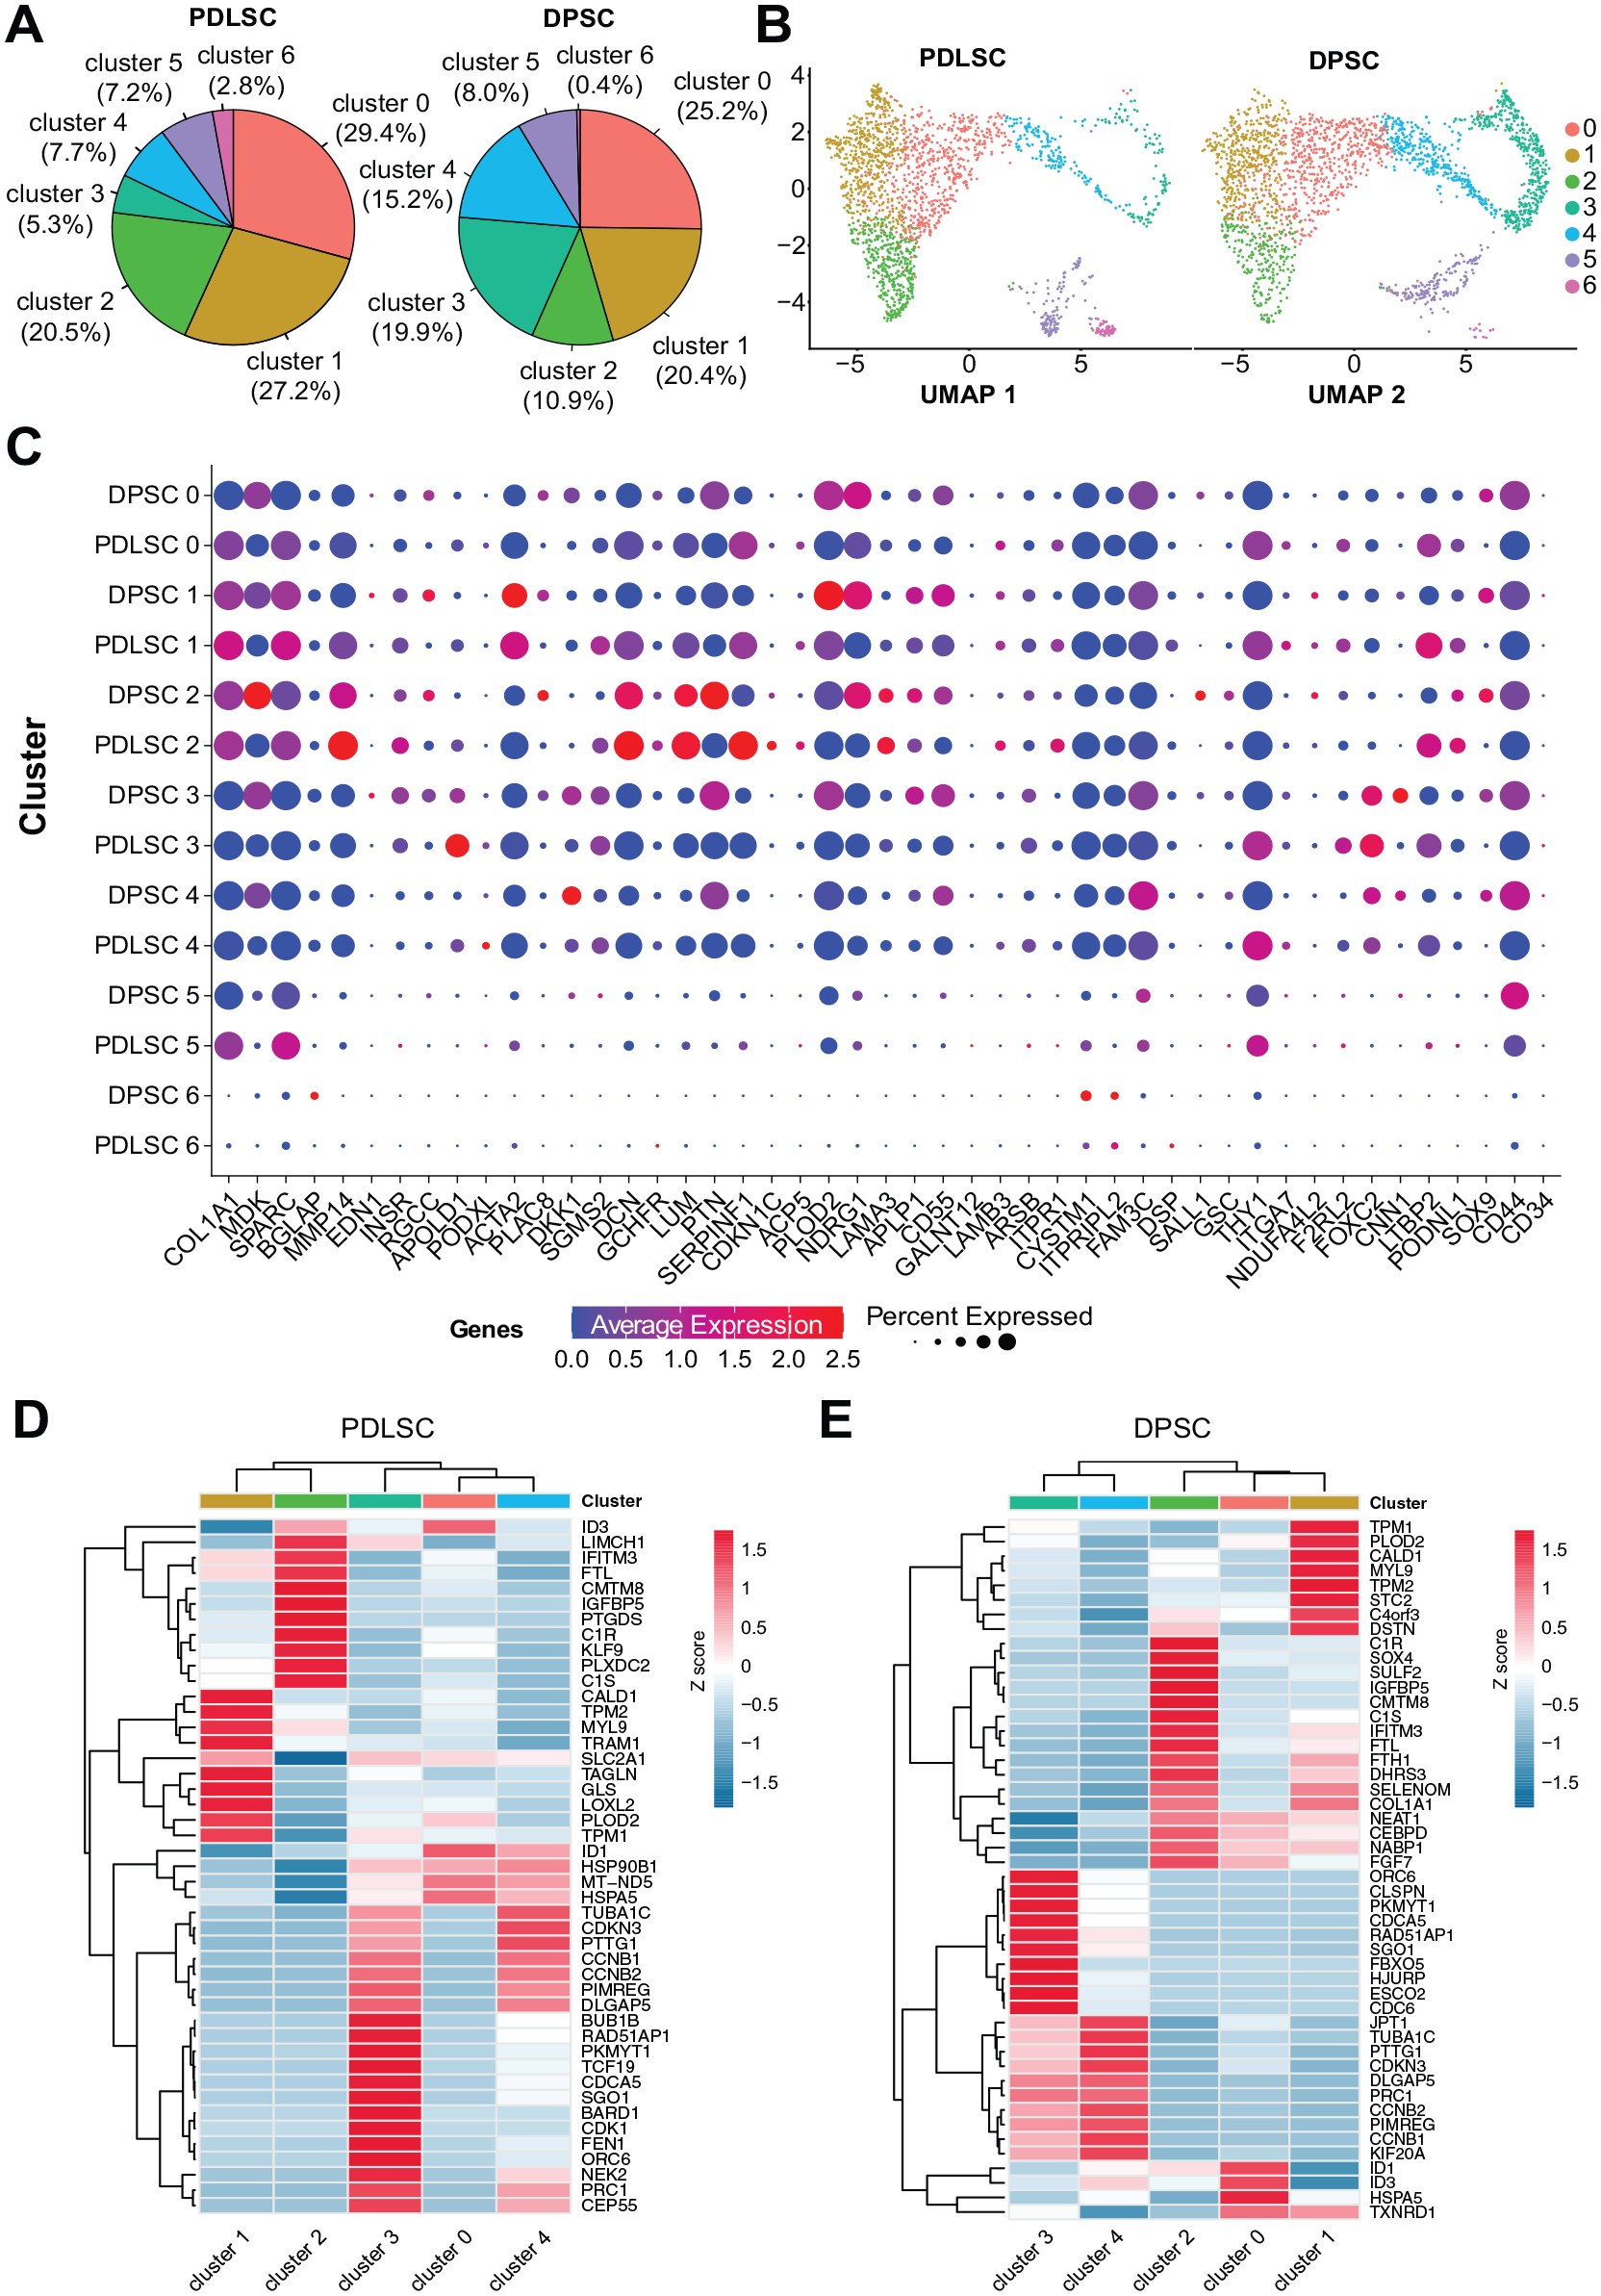
Annotation of the cell clusters in periodontal ligament stem cells (PDLSCs) and dental pulp stem cells (DPSCs). (
PDLSCs and DPSCs present fibroblastic and osteoblastic gene signatures
To further investigate the differentiation capability of DPSCs and PDLSCs, we quantified the fibroblastic/osteoblastic Signature Scores, cell cycle scores, and sEntropy scores for each cluster in DPSCs and PDLSCs. We observed the highest fibroblastic Signature Score exhibited in cluster 2 for both cell populations (Fig. 4A). We also observed a higher proportion of PDLSCs in the G1 phase and a higher proportion of DPSCs in the S and G2/M phases (Fig. 4B). Cluster 3 exhibited the highest scEntropy scores for PDLSCs and DPSCs, suggesting a stemness feature (Fig. 4C). The higher proportion of cluster 3 and lower fibroblastic signature scores in DPSCs and higher scEntropy scores in cluster 3 indicated a higher stemness in DPSCs than PDLSCs.
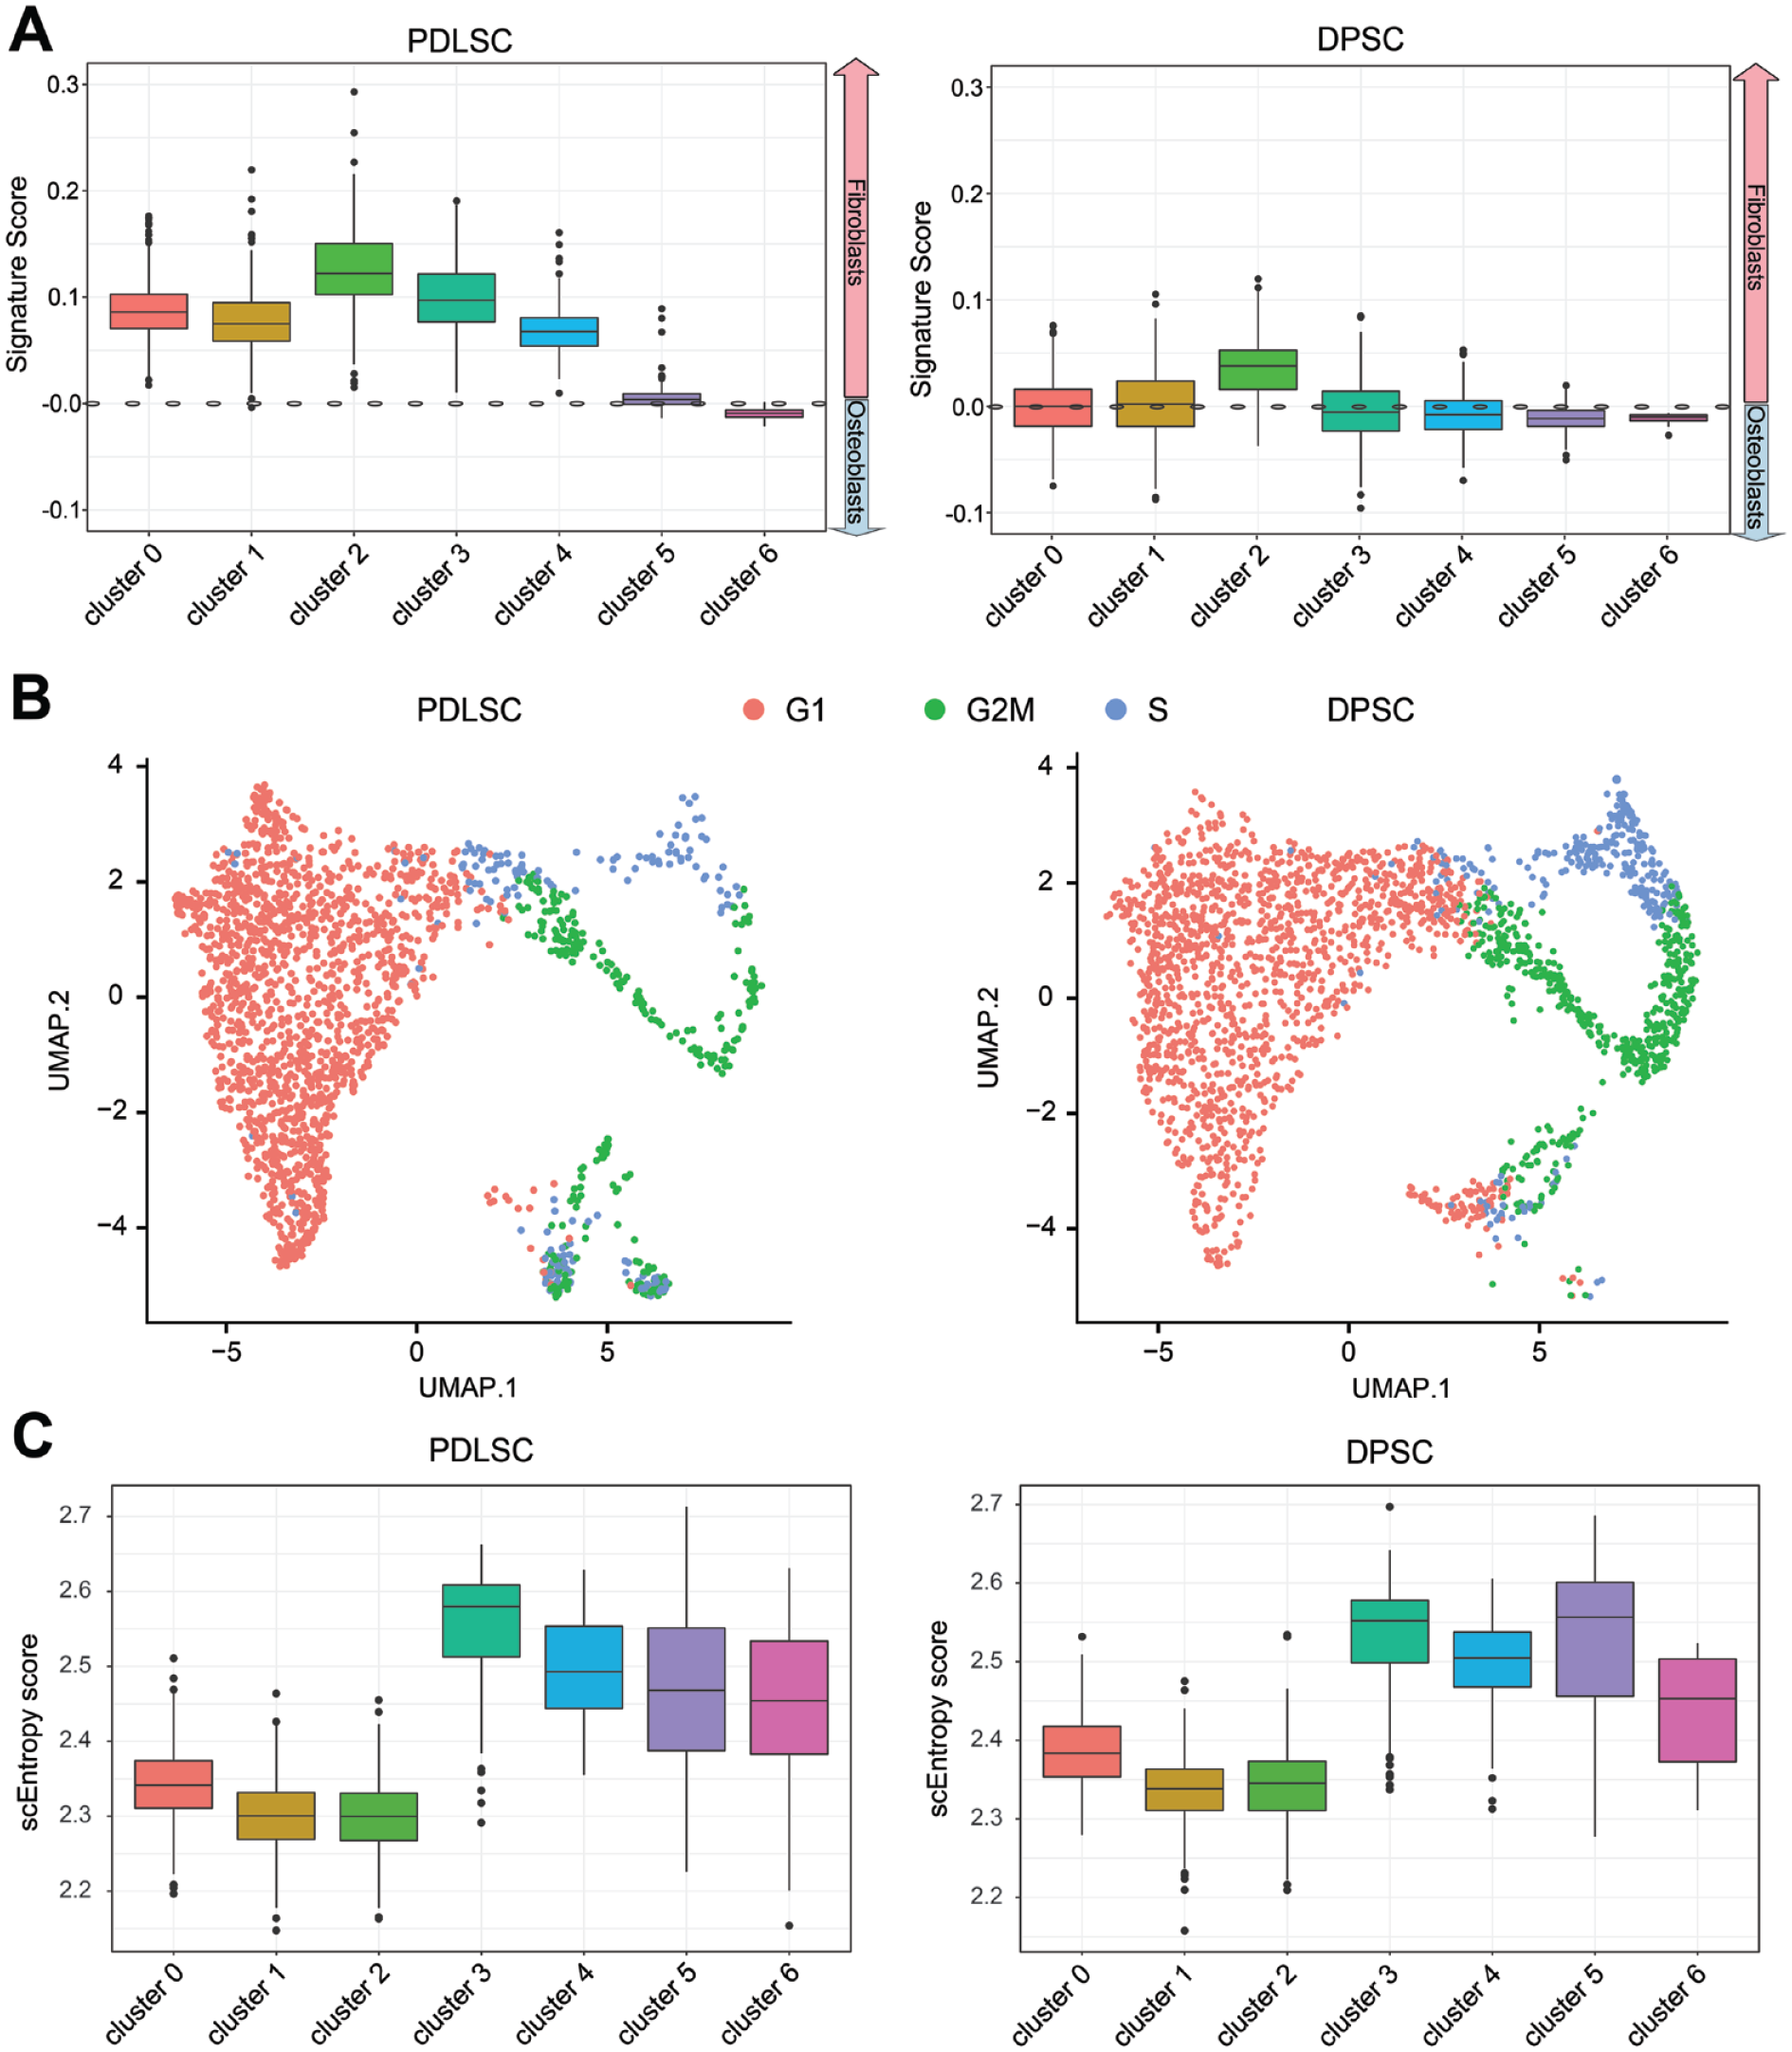
Differentiation potentials of cells trajectory analysis of the cell clusters in periodontal ligament stem cells (PDLSCs) and dental pulp stem cells (DPSCs). (
Discussion
In this study, we employed scRNA-seq to investigate the heterogeneity of 2 key stem cell populations in the periodontal/dental pulp interface, DPSCs, and PDLSCs. To comprehensively understand whole-tissue compositions at the cellular level, scRNA-seq presented an ideal tool for analyzing and comparing stem cell populations. We uniquely 1) used samples for scRNA-seq without cell culture before sequencing to avoid biased cell compositions, 2) matched DPSCs and PDSCs from the same individuals to avoid confounding factors, 3) used bulk RNA-seq of the differentiated cell types of the same individuals for cluster annotation, and (4) employed advanced bioinformatics methods of estimating scEntropy, cell cycles, and cell type signature scores to study stemness. We identified 7 clusters and their corresponding gene biomarkers. We then used bulk RNA-seq data to annotate/validate the scRNA-seq findings. Specifically, to annotate stem cell clusters to functional cell types, we creatively used bulk RNA-seq from the 2 corresponding differentiated cell types by projecting their cell type–specific gene expression to the scRNA-seq cell clusters using Signature Scores by assuming that the cell type–specific gene expression was retained during their differentiation from stem cells.
The identified key cluster-specific genes and pathways suggest the roles of each cell cluster. For example, clusters 3 and 4 displayed higher similarity to osteoblasts and were 2 “stem-like” clusters. Cluster 3 was enriched in cell proliferation, migration, and pluripotency; had higher entropy; and was the earliest point in the trajectory route. Cluster 2 had lower entropy and was at a later differentiation stage enriched in ossification, response to hormone or growth factors, extracellular matrix organization, and tissue remodeling (Seo et al. 2004; Kotova et al. 2021) with higher similarity to fibroblasts than osteoblasts in Signature Scores. PDLSCs displayed more mature cell features due to the larger proportions of stem-like clusters 3 and 4 in DPSCs than in PDLSCs based on the trajectory analysis and entropy scores. While a direct comparison cannot be made, PDLSCs had a higher proportion of cluster 2 and a lower proportion of clusters 3 and 4, suggesting that PDLSCs were more fibroblastic, collectively shedding new light on the complex landscape of oral stem cell functions and the potential therapeutic applications of PDLSCs and DPSCs in regenerative medicine (Kotova et al. 2021). Overall, the difference in stemness between DPSCs and PDLSCs was primarily due to their different compositions of the common cell clusters, including those with high stemness. Unsurprisingly, there were hardly any genes expressed differently between DPSCs and PDLSCs in the same clusters due to the typical scRNA-seq procedure we performed to identify cell “clusters on the integrated data set” with a relatively high number of clusters. A high number of clusters suggested a high homogeneity within a cell cluster where each cluster included cells with similar gene expression, no matter which samples these cells were from.
Our strategy was to use the DPSCs and PDLSCs directly after they were obtained from the extracted teeth without culturing them further to study an “untouched” population for identifying the clusters by the single-cell RNA-seq. Previous work by others (Lee et al. 2022) presented data on cultured samples using comparable cells per sample. Thus, the number of cells in our work was comparable to the other scRNA-seq studies of oral stem cell–enriched populations without culturing the cells before sequencing, providing a more direct approach to avoid potential bias in identifying the clusters of stem cell–enriched populations before sequencing. An earlier scRNA-seq technique platform, SmartSeq, suggested that a few hundred total cells were enough to identify main cell types (Baran-Gale et al. 2018). The Single Cell LT v3.1 platform from 10X Genomics that we used in this study is designed to target between 500 and 10,000 cells per sample (Haque et al. 2017); thus, the number of cells (about 500 cells per cluster in main clusters 0–4) was adequate for the unbiased characterization of their distinct features among cell clusters (Table).
It is essential to acknowledge the limitations faced in the study. First, expression can be influenced by the cell cycle, metabolic function, and differentiation stage. These factors make it challenging to assign cell clusters to specific cell types. Our study addressed this limitation by using bulk RNA-seq data from differentiated cell types (fibroblasts and osteoblasts) derived from DPSCs and PDLSCs as a reference for cluster annotation. However, it is essential to note that comparing these cell signatures to additional cell types derived from the same sources (DPSCs and PDLSCs) would enhance the precision of cell-type annotations. Second, tissue samples or procedures to obtain samples sequenced for scRNA-seq may differ. A recent study used scRNA-seq of cultured DPSCs and PDLSCs from passage 3 (Lee et al. 2022), while our DPSC and PDLSC samples were not cultured before sequencing to maintain the full spectrum of cells and were derived from previously characterized teeth (Albuquerque-Souza et al. 2020). There were similarly identified cluster-specific extracellular matrix organization pathways. However, we focused on stemness using trajectory analysis and entropy scores instead of a purely biomarker-dependent strategy to annotate cell clusters. We used bulk RNA-seq of the differentiated 2 cell types (osteoblasts and fibroblasts) from the sample-matched DPSCs and PDLSCs. By incorporating bulk RNA-seq data from the 2 differentiated cell types (osteoblasts and fibroblasts) derived from the same DPSC and PDLSC samples, we were able to provide additional context for interpreting the scRNA-seq results. This integrative approach allowed us to gain insights into the dynamics of stem cell populations within the dental pulp and periodontal ligament and their potential differentiation trajectories.
Two recent studies on DPSC and PDLSC characterization used the culture of samples without scRNA-seq for heterogeneity analysis of the differentiation potential of these cells (Wu et al. 2020; Kotova et al. 2021). A higher differentiation rate (Wu et al. 2020) and a faster proliferation rate were observed in PDLSCs (Kotova et al. 2021). We used entropy score and trajectory analysis to define stemness in scRNA-seq data. We tested uncultured and undifferentiated specific cell types to identify early full-spectrum profiles. We used different definitions (differentiation rate vs. stemness), providing a comprehensive whole-genomics approach comparing single cells with bulk RNA sequencing rather than selecting specific genes to investigate the stemness potential into specific cell types.
Collectively, our data demonstrated the unique characteristics found in the composition of clusters from 2 different adult stem cell sources in the periodontal/pulp interface. Understanding these distinct gene signatures is an important step toward a comprehensive overview of the population composition and differentiation of cell fate in specialized functional periodontal and pulp tissues.
Author Contributions
Y. Yang, T. Alves, M.Z. Miao, G. Li, J. Lou, contributed to data analysis, drafted and critically revised the manuscript; Y.C. Wu, contributed to data acquisition, drafted and critically revised the manuscript; H. Hasturk, contributed to conception, design, data acquisition and interpretation, drafted and critically revised the manuscript; T.E. Van Dyke, contributed to conception, design, data interpretation, drafted and critically revised the manuscript; A. Kantarci, D. Wu, contributed to conception, design, data acquisition, analysis, and interpretation, drafted and critically revised the manuscript. All authors gave final approval and agree to be accountable for all aspects of the work.
Supplemental Material
sj-docx-1-jdr-10.1177_00220345231205283 – Supplemental material for Single-Cell Transcriptomic Analysis of Dental Pulp and Periodontal Ligament Stem Cells
Supplemental material, sj-docx-1-jdr-10.1177_00220345231205283 for Single-Cell Transcriptomic Analysis of Dental Pulp and Periodontal Ligament Stem Cells by Y. Yang, T. Alves, M. Z. Miao, Y.C. Wu, G. Li, J. Lou, H. Hasturk, T.E. Van Dyke, A. Kantarci and D. Wu in Journal of Dental Research
Supplemental Material
sj-tif-1-jdr-10.1177_00220345231205283 – Supplemental material for Single-Cell Transcriptomic Analysis of Dental Pulp and Periodontal Ligament Stem Cells
Supplemental material, sj-tif-1-jdr-10.1177_00220345231205283 for Single-Cell Transcriptomic Analysis of Dental Pulp and Periodontal Ligament Stem Cells by Y. Yang, T. Alves, M. Z. Miao, Y.C. Wu, G. Li, J. Lou, H. Hasturk, T.E. Van Dyke, A. Kantarci and D. Wu in Journal of Dental Research
Footnotes
Declaration of Conflicting Interests
The authors declared no potential conflicts of interest with respect to the research, authorship, and/or publication of this article.
Funding
The authors disclosed receipt of the following financial support for the research, authorship, and/or publication of this article: This work was supported by NIH/NIA (AG062496), NIH/NIDCR (DE025020) grants, University of North Carolina Computational Medicine Program Award 2020. T. Alves holds a J. William Fulbright scholarship (CAPES—finance code 001). M.Z. Miao is supported by the Intramural Research Program of the National Institutes of Health, National Institute of Dental and Craniofacial Research ZIA DE000719 and ZIE DE000727.
A supplemental appendix to this article is available online.
References
Supplementary Material
Please find the following supplemental material available below.
For Open Access articles published under a Creative Commons License, all supplemental material carries the same license as the article it is associated with.
For non-Open Access articles published, all supplemental material carries a non-exclusive license, and permission requests for re-use of supplemental material or any part of supplemental material shall be sent directly to the copyright owner as specified in the copyright notice associated with the article.