
Abstract
We examined individual, regional, and cultural differences in household debts and identified residential mobility as a key socioecological variable at multiple levels of analysis. Study 1 found that American households’ debt rates were higher than Japanese debt rates. Across 76 countries, household debts were higher in residentially mobile countries than those in residentially stable ones (Study 2). Next, across 144 U.S. cities, residents of residentially mobile cities had more credit card debts than those of residentially stable cities (Study 3). We further replicated the international and U.S. findings across 366 districts in India (Study 4). Study 5 found that American participants were more residentially mobile and more willing to borrow than Japanese participants, and the willingness to borrow was partly explained by the personal history of residential mobility. Study 6 found that residentially mobile individuals felt less indebtedness/gratitude than residentially stable individuals; the study also found how indebtedness/gratitude impacted individuals’ credit card debts and willingness to borrow.
With the proliferation of credit lines, people living in an economically developed country can borrow money relatively easily to achieve their lifestyle. However, this was not always the case; 50 years ago, middle-class Americans did not have easy access to credit cards (Mandell, 1990). Now, with unprecedented access to credit cards, people are able to purchase luxury goods even when their cash reserve is low. Credit card purchasing means that “transactions for future goods can be completed with future wealth in the present moment” (Palitsky et al., 2016, p. 87). According to T. A. Sullivan et al. (2000), Americans are buying larger and more luxurious cars, complete with sound systems, computer monitoring devices, and four-wheel drive . . . But, the breathtaking prices of these gleaming machines require most middle-class buyers to incur hefty debt, repayable over ever-longer periods at higher interest rates. (p. 3-4)
Although credit cards have proliferated in many parts of the world, there seems to be an observable cultural difference between Americans and others in terms of their attitudes toward debts, that is, Americans, on an average, appear to be more at ease with borrowing money than others.
In a series of studies, we explore socioecological and psychological explanations for willingness to borrow to live the lifestyle of choice. Following the socioecological approach (e.g., Oishi, 2014; Oishi & Graham, 2010; Yamagishi, 2010), we examine cross-national and within-nation variations in financial debts focusing on a socioecological variable: residential mobility (the frequency in which people change their residence).
Residential Mobility and Indebtedness
Since Colonial times, the United States has been a highly residentially mobile society (Long, 1992; Oishi, 2010). As explicated by Fredrick Jackson Turner (1921), the United States experienced territorial expansion and economic growth during the 18th and 19th centuries. The opening of the frontier gave rise to large domestic migrations. Many Americans could borrow money, start a new life elsewhere, and pay it back later when they found a better job in a new town. Although American residential mobility has declined recently (Buttrick & Oishi, 2021), the rate of residential mobility has been consistently higher than that of many other developed nations, such as the United Kingdom, Germany, France, Italy (Sanchez & Andrews, 2011), and Japan (Oishi, 2010).
One specific psychological mechanism that might be associated with residential mobility and willingness to borrow is the feeling of indebtedness. In a sense, the feeling of indebtedness is an indicator of how much more one is willing to borrow. If someone is already heavily indebted (say, $100,000 in debt), this person is likely to avoid further indebtedness. If someone is not heavily indebted (say, $10,000 in debt), this person can borrow and still repay later. Thus, a simple prediction is that the more indebtedness one feels, the less willing this person is to borrow. This is in part because at the core of the feeling of indebtedness is the feeling of obligation to repay, which is clearly an adverse state (Greenberg & Shapiro, 1971). The feeling of indebtedness could originate in nonmonetary sources as well. For example, people tend to feel indebtedness toward their parents not only because of the monetary support they received, but also (and mainly) because of the emotional support received. Our assumption is that when someone feels indebted, regardless of the source, they will be likely to avoid borrowing money in order to avoid accumulating the feeling of indebtedness further.
But why should residential mobility be associated with less indebtedness? Here, it is important to use psychological imagination to link a socioecological factor with a psychological one (cf. Mills’s [1959/2000] sociological imagination). When one stays in the same town for a long time, their relationships become more interdependent, much like kinships (Adams, 2012). Those living in the same town for a long time could rely on a neighbor for an emergency baby or dog sitter, just as one would rely on their family members. Accordingly, when one’s neighbors need help, one would feel an obligation to assist them. In other words, relationships in a residentially stable area are bound to be obligation based. Individuals are likely to already owe something to the same group of neighbors and friends and are thus reluctant to ask for help. In short, individuals in a residentially stable area are likely to be sensitive to what one ought to do for others and what others did for them in return. As a result, they are likely to feel chronically indebted to others. This chronic sense of indebtedness then discourages them from engaging in activities that increase their feeling of indebtedness, including borrowing from an institution.
In the literature on social support seeking, researchers found replicable cultural differences between North Americans (presumably residentially mobile) and East Asians (presumably residentially stable). In a seminar paper, Taylor et al. (2004) found that Koreans were much less likely to spontaneously seek social support at the time of great stress than Americans. A subsequent study found that relational concerns explained why Asians might be reluctant to seek social support (Kim et al., 2006), that is, Asians appear to be concerned that seeking social help could result in criticism or negative evaluation by others, embarrassment, and shame, and ultimately harm their relationships. Another paper also found that the Japanese were more reluctant to seek explicit social support than European Americans and that the Japanese reported feeling more shame and guilt receiving support than European Americans (Ishii et al., 2017). The authors did not measure indebtedness, but these findings are consistent with our theorizing in that in a residentially stable society, people are more reluctant to seek help, including borrowing from others, in part because they already feel indebted to others and are concerned about the negative relationship consequences of help seeking. Nevertheless, despite the reluctance to seek support from close others, people in a residentially stable society such as Japan are more reluctant to seek professional help than people in a residentially mobile society such as the United States, and thus end up seeking help from close others (Mojaverian et al., 2013). These findings suggest that people in a stable society avoid relying on institutions for money, which results in lower levels of financial debts.
Now, we can imagine a person who has moved numerous times. In previous towns, such a person might have owed some favors to various people. Psychologically speaking, when one forms new relationships in a new town, they can start fresh with fewer debts. Furthermore, residentially mobile individuals tend to have larger social networks than stable individuals (D. Sullivan et al., 2015), diluting a sense of obligation akin to the feeling of indebtedness. Thus, we hypothesized that residential mobility is inversely associated with the feeling of indebtedness. The more frequently an individual moves, the more they reset their interpersonal indebtedness, and the less they likely are to feel indebted. This relative lack of feeling indebted might afford them to engage in activities that evoke indebtedness, including borrowing. A cross-cultural study found that Canadian participants (presumably residentially mobile) were more likely than Hong Kong participants (presumably residentially stable) to accept a gift in a supermarket in part because Canadians did not feel indebted when receiving the gift as much as Hong Kong participants (Shen et al., 2011). Thus, the relative lack of feeling indebted could lead to willingness to accept a gift and to perhaps borrow money from others. Alternatively, people in a residentially mobile society would rather rely on institutions for borrowing than rely on family and friends. Borrowing from an institution evokes a less intense feeling of indebtedness than borrowing from close others, which in turn makes it easier for individuals to borrow more.
Monetary debts or not, the feeling of indebtedness is experienced by an individual when someone else does something special for them at a significant cost (Watkins et al., 2006). In that sense, the feeling of indebtedness is similar to gratitude, as it is also experienced when one recognizes that one is the beneficiary of someone’s kindness (Emmons & McCullough, 2003). Previous research suggests that gratitude is also inversely associated with the willingness to borrow to achieve the lifestyle of one’s choice. For instance, DeSteno et al. (2014) found that inducing the emotion of gratitude significantly increased financial patience, or willingness to wait for a larger gain later. A subsequent daily diary study showed that daily experience of gratitude predicted financial patience in a temporal discount task (Dickens & DeSteno, 2016). These findings, then, suggest that individuals feeling gratitude are less impulsive to buy something they cannot afford and less likely to borrow money to achieve their ideal lifestyle. Thus, in addition to indebtedness, gratitude might be associated with less willingness to borrow.
In sum, we hypothesized that countries, cities, and individuals with high residential mobility are more willing to borrow than those with low residential mobility. We further hypothesized that the link between residential mobility and willingness to borrow is in part explained by a relative lack of the feeling of both indebtedness and gratitude toward others.
Study 1: The U.S.–Japan Differences in Household Debts
Study 1 tested whether residents of a country with a high level of residential mobility are more willing to borrow money to achieve one’s ideal lifestyle than residents of a country with a low level of residential mobility. To this end, we decided to compare available data of household debts in the United States with those of Japan between 1965 and 2015, that is, we compared household debts as percentage of gross domestic product (GDP) for 50 years (N = 50 for Japan; N = 50 for the United States). Just as a single-item scale is less reliable than a multiple-item scale, household debts in one year could be influenced by various year-specific factors (e.g., housing price, recession, stock market). In Study 1, we obtained household debt data in these two countries for 50 years. Thus, we were able to test whether household debts as percentage of GDP were different between the United States and Japan on average across 50 years. We chose these two countries because they are comparable in terms of GDP per capita, but different in terms of residential mobility: the United States is much more residentially mobile than Japan (Oishi, 2010).
Method
All data, materials, and code used to conduct all analyses in this article are posted at https://osf.io/wq4mh/. These studies were not preregistered.
Household Debts
The Bank of International Settlement’s data (https://fred.stlouisfed.org/series/QUSHAM770A) include household debts indicated as percentage of GDP for the United States and Japan.
Control Variables
Economic growth data were taken from The World Bank (United States: http://data.worldbank.org/indicator/NY.GDP.MKTP.KD.ZG?locations=JP-US; Japan: http://data.worldbank.org/indicator/NY.GDP.MKTP.KD.ZG?locations=JP). Interest rate data were taken from the Federal Reserve St. Louis (United States: https://fred.stlouisfed.org/series/INTDSRUSM193N#0; Japan: https://fred.stlouisfed.org/series/INTDSRJPM193N#0). The sample size was determined by availability of the data. The post hoc power for the household debt data (d = .49, two-tailed alpha = .05) was .69.
Results & Discussion
The Bank of International Settlement’s data showed that, between 1965 and 2015, Americans had higher rates of household debts indicated as percentage of GDP than the Japanese (Mus = 62.52% of GDP vs. MJapan = 54.33% of GDP, t[100] = 2.442, p = .016, d = .49).
There are, of course, many economic factors that make Americans’ attitudes toward debts different from others, such as the availability of easy credits and general economic prosperity (Mann, 2002). Certainly, in the United States, credit cards are easily obtainable. In addition, long-term economic growth over the previous decades suggests that borrowing to invest in housing, stocks, and other investment products is a rational choice for many Americans. It should be noted, however, that credit cards are equally available in developed countries, such as Japan and Korea, and increasingly so in emerging economies, such as India. Furthermore, the aforementioned differences between the United States and Japan in borrowing remained significant when controlling for economic growth (borrowing: t[99] = 5.683, p < .001). In addition, it is rational to borrow to invest elsewhere if the interest rate is low. The aforementioned U.S.–Japan differences in borrowing and saving, however, remained significant when controlling for the interest rate as well, borrowing: t(99) = 6.27, p < .001. Thus, Americans’ proclivity toward borrowing could not be easily explained away by easy access to credit cards, long-term economic growth, or low-interest rate.
Study 2: International Differences in Residential Mobility and Household Debts
Study 1 found support for our hypothesis. However, because of the two-country design, generalizability of the findings was quite limited. We conducted Study 2 to examine more directly whether cross-national differences in household debts are associated with cross-national differences in residential mobility across 76 countries.
Method
We tested our hypothesis using the International Monetary Fund (IMF) Global Debt Database across 76 countries. The sample size was determined by availability of the data. According to G*Power 3.19, the number of countries included in the analysis (N = 76) had 80% power to detect the effect size r = .31 (alpha = .05, two tailed).
Residential Mobility
We obtained the country-level aggregation of the number of people who reported they moved within country in the Gallup World Poll for the years between 2012 and 2016. We chose these 4 years to match the same years for which debt data and control variables were gathered.
Debt
Debt data were retrieved from the IMF Global Debt Database 2012 to 2016 (Mbaye et al., 2018). A higher debt score implies a greater total stock of loans and debt securities of households as a share of GDP of a country.
Control Variables
As control variables, we added GDP Purchasing Power Parity (PPP) per capita (current US$) from The World Bank (2021) and the number of banks per 100,000 (International Monetary Fund, 2021). The control variables were averaged for 2012 to 2016 to align with the approximate years of the predictor and outcome variable.
Results & Discussion
As shown in Table 1, people living in mobile countries hold greater household debts than those living in residentially stable countries (see also Figure 1).
Descriptive Statistics and Key Correlations (Study 2).
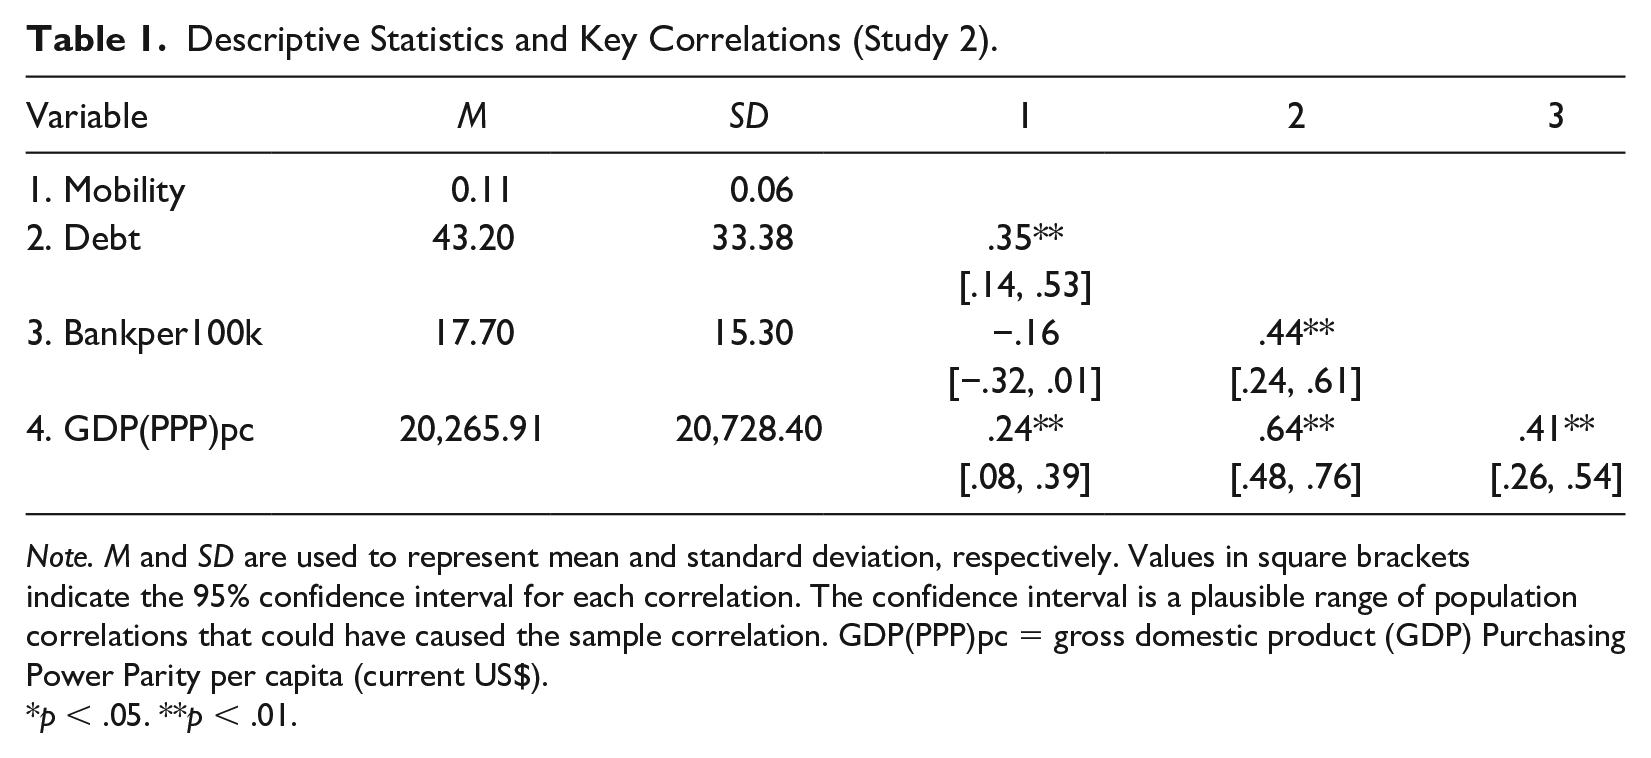
Note. M and SD are used to represent mean and standard deviation, respectively. Values in square brackets indicate the 95% confidence interval for each correlation. The confidence interval is a plausible range of population correlations that could have caused the sample correlation. GDP(PPP)pc = gross domestic product (GDP) Purchasing Power Parity per capita (current US$).
p < .05. **p < .01.
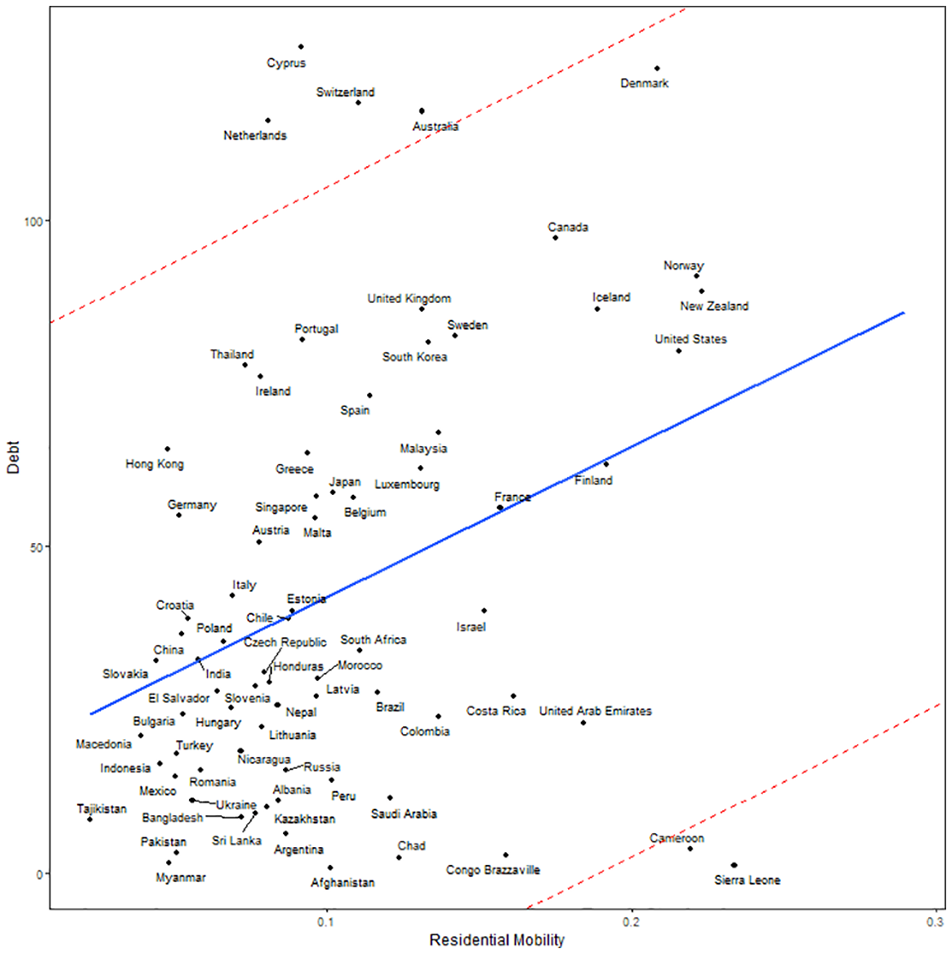
The Correlation Between 5-Year Rate of Residential Mobility (Within Country) and the Mean Household Debt Per Gross Domestic Product (% of Gross Domestic Product) Across 76 Countries
The link between mobility and debts might also be attributed to other factors, such as wealth and the availability of banks. This means that in a high-income country, residents can borrow more because they have a higher capability of paying it off compared to residents of a poorer country. Similarly, in a country where there are many banks, residents can borrow more because there are more banks that are willing to lend than in a country with fewer banks. To check these alternative explanations, we ran a multiple regression analysis testing the residential mobility effect on debt, controlling for GDP(PPP) and the number of banks per capita. As shown in Table 2, residential mobility remained a significant predictor even after controlling for GDP(PPP) and banks per capita.
Regression Results Using Debt as the Criterion (Study 2).
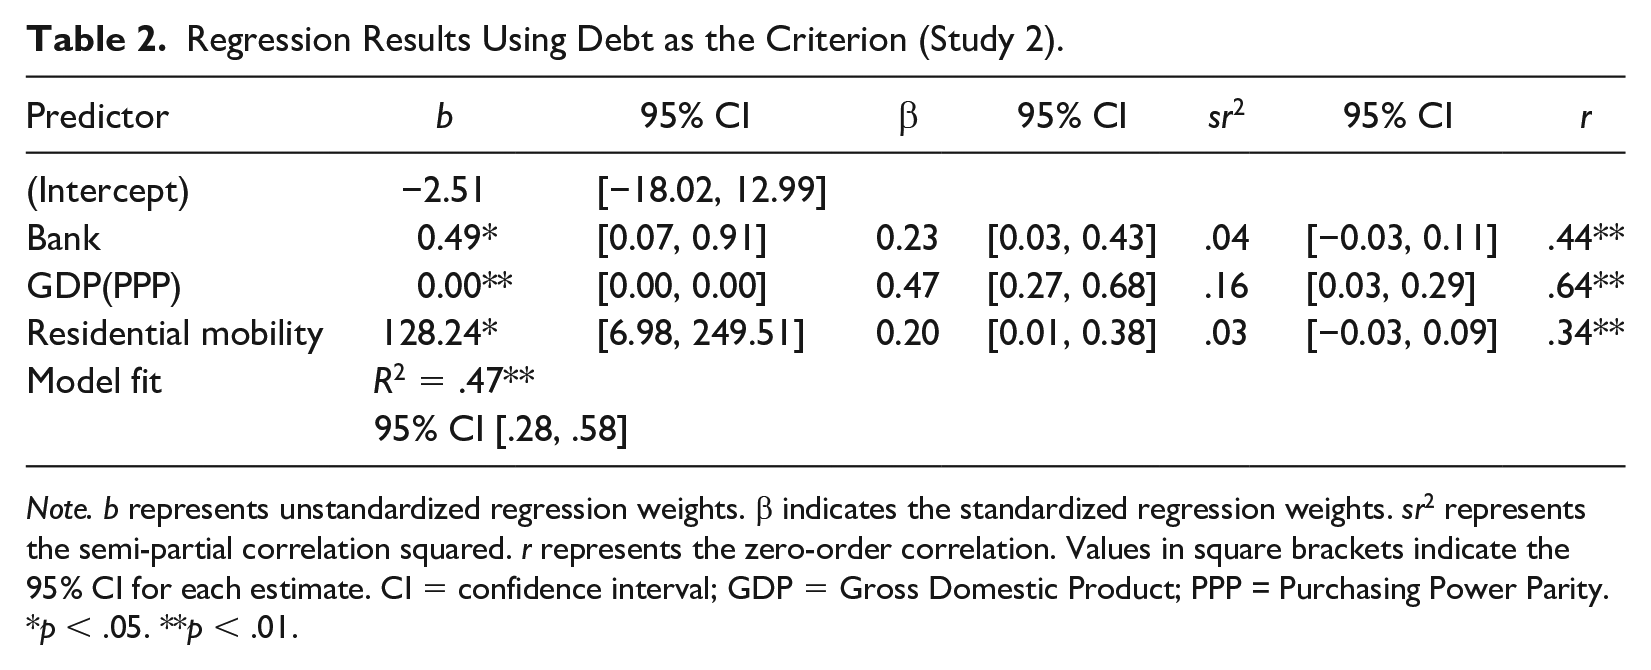
Note. b represents unstandardized regression weights. β indicates the standardized regression weights. sr2 represents the semi-partial correlation squared. r represents the zero-order correlation. Values in square brackets indicate the 95% CI for each estimate. CI = confidence interval; GDP = Gross Domestic Product; PPP = Purchasing Power Parity.
p < .05. **p < .01.
Study 3: Within-U.S. Variations in Propensity to Be Financially Indebted
Studies 1 and 2 were between-country comparisons. Although residential mobility appears to be uniquely associated with more willingness to borrow in both studies, there are many country-level third variables that were not tested (e.g., language, history, financial literacy, availability of credit cards). Methodologically speaking, within-country comparisons provide a more stringent test because a single country shares with itself its national history, language, financial literacy, and availability of credit cards. In Study 3, we tested the association between residential mobility and debts within a single country: the United States.
Method
We used personal debt data from Experian (a credit report company) on 144 U.S. cities and three types of residential mobility from the U.S. Census: percentage of residents whose current home address was different from the previous year, percentage of residents who lived in a different county 1 year earlier, and percentage of residents who lived in a different state 1 year earlier. The sample size was determined by the availability of the data. Study 2 showed a medium effect size (r = .35) for the borrowing data. The statistical power to detect Study 2’s effect size (r = .35, two-tailed test with α = .05) was 99% for the current data (df = 142).
Residential Mobility
Residential mobility was calculated by the percentage of people who lived in a different address in 2009 than where they lived in 2010 (i.e., percentage of people who moved between 2009 and 2010) based on the Census’s 2010 American Community Surveys. Of 147 cities, residential mobility data were available for 144 cities (M = .1705, SD = .03166, ranging from .0966 to .2567). Because this residential mobility could include moves within the same neighborhood, which are unlikely to change one’s social relationships, we also calculated residential mobility based on moves from different counties (M = .0629, SD = .0177) and different states (M = .0288, SD = .01349). These three indices of residential mobility are similar, however: r (142) = .749, p < .001 between different houses and different counties; r (142) = .542, p < .001 between different houses and different states; and r (142) = .665, p < .001 between different counties and different states.
Debts
We obtained the city-level personal debts data from http://www.experian.com/live-credit-smart/state-of-credit-map.html. These data were concerned with the personal debts in 2012, as this was reported in the state of credit 2013 report by Experian. There was information regarding 147 cities. The mean personal debt was $24,340.42 (SD = 1,361.464).
Control Variables
We obtained the city-level control variables from the U.S. Census’s 2010 American Community Surveys. The population data were available for all the 147 cities (M = 390,025.55, SD = 787,650.53). The median income data were available for 144 cities (M = $50,309.35, SD = 8,326.593). The unemployment rate data were available for 142 cities (M = 8.87, SD = 2.066). The foreclosure data were reported by the Experian along with the debt data for 143 cities (M = 375.38, SD = 692.153). The box plot analyses did not detect any severe outliers in either residential mobility different address (skewness = .291; kurtosis = −.298), residential mobility different county (skewness = .438; kurtosis = .937), residential mobility different state (skewness = 1.647; kurtosis = 5.300), or personal debts (skewness = .374; kurtosis = 1.72; see also Figure 2).
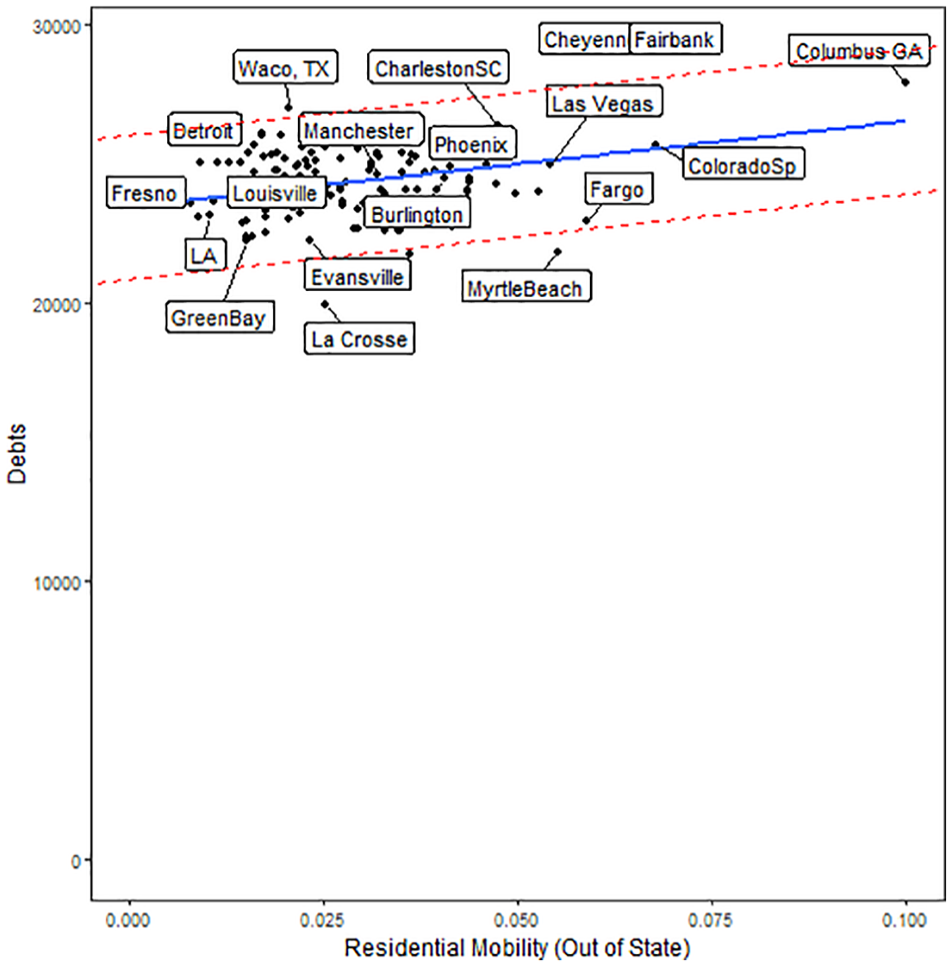
The Correlation Between 1-Year Rate of Residential Mobility (Moving From Another State) and the Mean Personal Debts Across 144 U.S. Cities
Results & Discussion
As predicted, there was a positive correlation between the 1-year rate of residential mobility (different home addresses) and the amount of the average personal debts at the city level, r (142) = .23, p = .006. When we used residential mobility based on out-of-county moves, the correlation was stronger, r (142) = .28, p < .001. Moreover, when we used residential mobility based on out-of-state moves, the correlation between mobility and personal debts was even stronger, r (142) = .30, p < .001 (see Figure 2). For instance, residentially mobile cities such as Fairbank, Alaska, and Columbus, Georgia, had more personal debts on average than residentially stable cities such as La Crosse, Wisconsin, and Fresno, California.
We then tested the robustness of this association via multiple regression analysis, in which the average personal debt was predicted by total population, median income, unemployment rate, the number of foreclosures, and residential mobility (see the far-right columns of Table 3). Residential mobility remained significantly associated with the amount of personal debts, above and beyond other control variables, b = 11,955.606 (SE = 3,660.616), β = .280, t(132) = 3.27, p = .001. A 1% increase in 1-year residential mobility was associated with roughly $120 more average personal debt.
City-Level Personal Debts and Its Correlations (and Standardized Regression Coefficients) With Other Key Variables in Study 3.
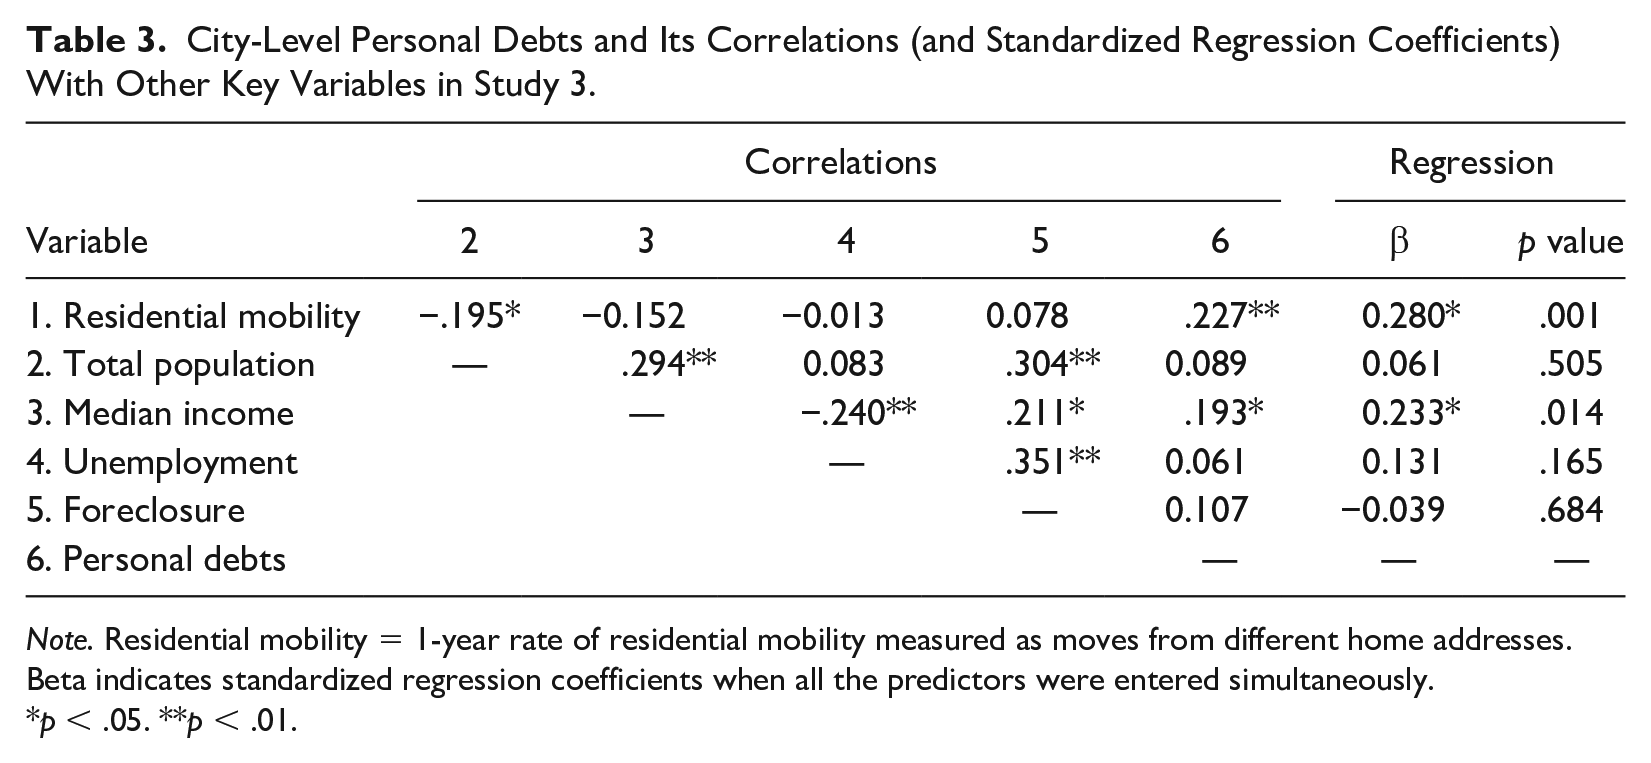
Note. Residential mobility = 1-year rate of residential mobility measured as moves from different home addresses. Beta indicates standardized regression coefficients when all the predictors were entered simultaneously.
p < .05. **p < .01.
The results were similar when two other indices of residential mobility were used instead of residential mobility as different home addresses. Specifically, residential mobility measured as the rate of out-of-county moves was also associated with the amount of personal debts, above and beyond other control variables, b = 27,058.86 (SE = 6,445.25), β = .36, t(132) = 4.20, p < .001. A 1% increase in 1-year out-of-county residential mobility was associated with approximately $270 more average personal debt. Likewise, residential mobility measured as the rate of out-of-state moves was also associated with the amount of personal debts, above and beyond other control variables, b = 35,212.864 (SE = 8,288.13), β= .35, t(132) = 4.25, p < .001. A 1% increase in 1-year out-of-state residential mobility was associated with $352 more average personal debt.
In summary, the objective consumer debt data indicate that residentially mobile cities had more personal debts on average than those of residentially stable cities. This was true when controlling for the size of the city, the wealth of the city, unemployment rate, and the number of foreclosures. We replicated these findings using three different types of residential mobility data based on moves to different addresses, moves to different counties, and moves to different states (see Supplementary Materials at https://osf.io/wq4mh/).
Study 4: A Replication in India
Although Study 2 included several non-WEIRD samples (e.g., Sierra Leone), the strongest evidence so far is from Study 3, which was conducted in the United States. In Study 4, we sought to test our hypothesis with regard to within-country variations in willingness to borrow in India, a non-WEIRD country. As one of the fastest urbanizing economies, India affords regional variances in mobility and borrowing. The first credit score system in India started in 2001 and has shifted the sources and amounts of borrowing (Guérin et al., 2012). Borrowing from social relations has decreased, whereas more households are increasingly borrowing from financial institutions such as banks and microfinance, as well as the government (Desai & Vanneman, 2015).
Method
We combined the Census of India with a representative survey dataset at the district level. The district in India is a regional unit comparable to the county in the United States, holding a 1.95 million of population on average. Out of the 640 districts in total, we used all the districts (N = 366) with available debt and mobility data, covering 57.19% of districts. Our final sample size exceeds 99% power for the weighted mean effect size from Studies 2 and 3, r = .30 (Faul et al., 2009).
Residential Mobility
Residential mobility for each district was obtained from the 2011 Census of India (https://censusindia.gov.in/2011-Common/Archive.html). Residential mobility was calculated by the percentage of people who moved in or out of a district between 2010 and 2011. The mean residential mobility score across the districts was 7.15% (SD = 3.76).
Debts
Debt data were obtained from the 2011 to 2012 India Human Development Survey-II (IHDS-II; https://ihds.umd.edu/). This survey is nationally representative and sampled 42,152 households in India. We adopted all debt data available for our dependent variables. Our main outcome variable was the outstanding debt of a household (M = 48.98K, SD = 48.21K Indian Rupee; 49.98K Rupee is approximately $640). Furthermore, we used six yes–no questions as additional outcome variables (debt from bank; debt from microfinance; debt from money lender; debt from employer; debt from relatives/friends; debt from other sources).
Control Variables
As control variables, we again used the IHDS-II household dataset to calculate the mean household income and proportion of urban residents at the district level. To manage the skewness of the variables of interest, variables in the analyses were log transformed.
Results & Discussion
As shown in Table 4, residential mobility was, again, positively correlated with outstanding debt, r (364) = .21, p < .001. To check the robustness, we ran a multiple regression analysis predicting outstanding debt from residential mobility, household income, and percentage urban simultaneously (R2 = .16, F = 22.21, p < .001). The analysis revealed that the residential mobility effect persisted after controlling for household income and urbanization, β = .16; t(362) = 3.16; p < .001, 95% CI [.16, .67], Cohen’s f2 = .024.
Descriptive Statistics and Correlations Between Variables in Study 4.
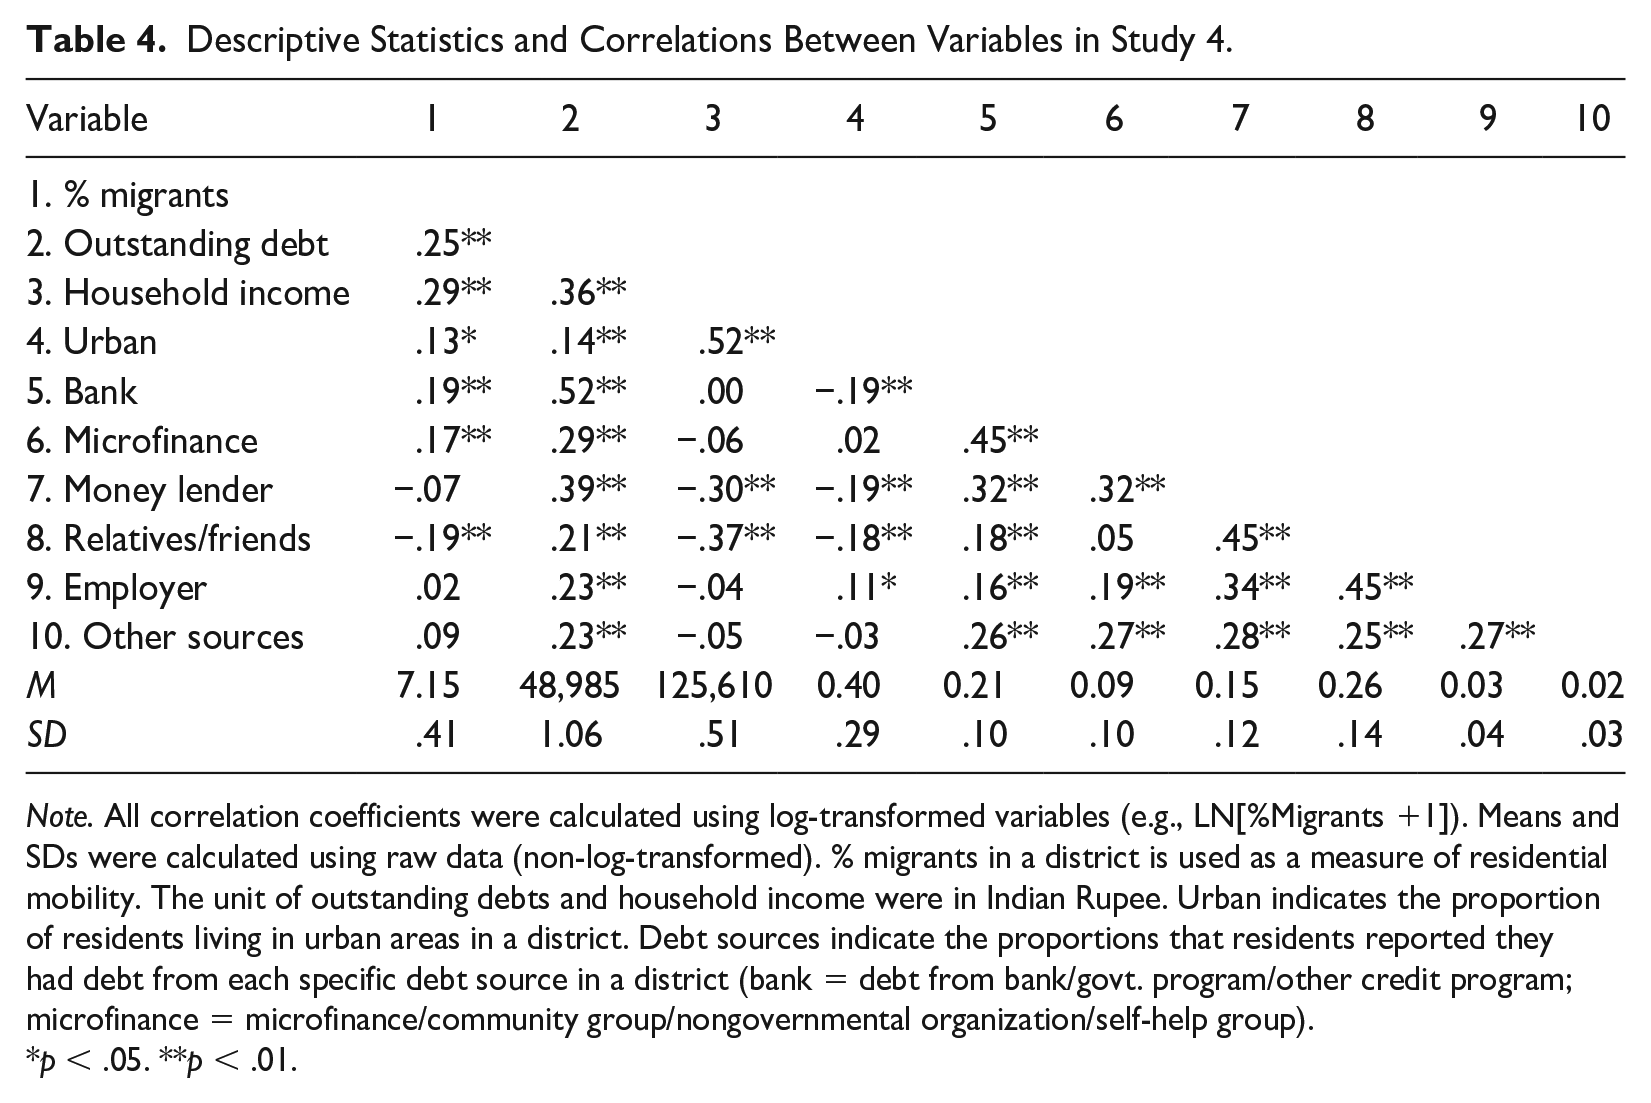
Note. All correlation coefficients were calculated using log-transformed variables (e.g., LN[%Migrants +1]). Means and SDs were calculated using raw data (non-log-transformed). % migrants in a district is used as a measure of residential mobility. The unit of outstanding debts and household income were in Indian Rupee. Urban indicates the proportion of residents living in urban areas in a district. Debt sources indicate the proportions that residents reported they had debt from each specific debt source in a district (bank = debt from bank/govt. program/other credit program; microfinance = microfinance/community group/nongovernmental organization/self-help group).
p < .05. **p < .01.
We further analyzed the associations between debt sources and residential mobility (controlling for the effects of household income and percentage urban). Interestingly, residential mobility positively predicted the proportion of people who borrowed from both small and large financial institutions, bank: β = .20; t(362) = 3.87; p < .001, 95% CI [.03, .08], f2 = .039; microfinance: β = .21; t(362) = 3.83; p < .001, 95% CI [.02, .08], f2 = .04. In contrast, residential mobility was marginally negatively correlated with borrowing from social relations such as friends and relatives, relatives/friends: β = –.09; t(362) = –1.82; p = .070, 95% CI [–.066, .003], f2 = .008. Other sources of debt were not correlated with residential mobility.
Overall, Indian data replicated the international data (Study 2) and city-level data in the United States (Study 3). Household debts were larger in residentially mobile districts than those of residentially stable districts. Furthermore, residential mobility was more strongly associated with borrowing from an institution rather than friends or relatives. This is consistent with the idea that an individual feels less gratitude and indebtedness toward an institution than toward a friend or relative, which makes it easier to borrow from an institution than from a friend or relative.
Study 5: U.S.–Japan Differences in Willingness to Borrow
Studies 1 to 4 were concerned with the aggregate-level association between residential mobility and debts (i.e., country level in Studies 1 and 2, city level in Study 3, district level in Study 4). It would be an ecological fallacy to simply assume that the patterns of the association between residential mobility and willingness to borrow found in Studies 1 to 4 would apply at the level of individual. To avoid the ecological fallacy, in Study 5, we directly examined the association between the individual-level mobility and willingness to borrow.
Method
Participants
The effect size on the U.S.–Japan difference in borrowing was d = .49 in Study 1. In order to achieve 95% of statistical power (two-tailed p = .05) to detect a group difference with this effect size, the total sample size should be 220. Thus, we sought to recruit 110 participants in the United States and Japan. By the end of the semester of the data collection, we were able to recruit 109 students at a prefectural public university in Japan (73 men, 36 women). By the end of the semester, we were able to recruit 267 students (86 men, 176 women, 2 did not specify) at a large public university in the United States. The obtained sample size had the statistical power of 98% to detect the effect size d = .49 (Faul et al., 2009). This study was approved by the University of Virginia’s Institutional Review Board for the Social and Behavioral Sciences (IRB-SBS) (Protocol #2014005000).
These students participated in this study in exchange for partial research credits. Out of the 267 U.S. participants, 172 self-identified as Caucasian, 13 as African American, 9 as Hispanic, 32 as East Asian, 13 as South Asian, 8 as Middle Eastern, and 17 as “other” (3 did not indicate their race). Japanese participants completed the survey in Japanese.
Materials and Procedures
Participants completed a survey online. To make their borrowing intention more vivid, we first assessed their ideal lifestyle as follows: “Imagine you are now 40 years old, married with a child in elementary school. What kind of lifestyle would you want to have?”
An Ideal Lifestyle
Participants were asked to pick the type of house, cars, income, and so on they desire in future: (a) House: (1) a two-bedroom apartment rental, (2) a two-bedroom condominium, (3) a three-bedroom/two-bath house (about 1500 sq. ft), (4) a four-bedroom/three-bath house (about 2500 sq. ft), (5) a 5+ bedrooms/three+ bathrooms (about 5000 sq. ft), and (6) larger house. (b) Number of cars: (1) no car, (2) one car, (3) two cars, (4) three cars, or (5) more cars. (c) Type of car you want to be driving: (1) subcompact car (e.g., Hyundai Accent), (2) compact car (e.g., Honda Civic), (3) midsize car (e.g., Toyota Camry), (4) sports car (e.g., Nissan Z) (coded as 4), (5) luxury car (e.g., BMW) (coded as 4), (6) SUV (e.g., GM Suburban) (coded as missing), (7) minivan (e.g., Honda Odyssey) (coded as missing), (8) truck (e.g., Ford F-150), or other types (coded as missing), (d) Annual household income (in current dollars), (1) $20–30K, (2) $30–50K, (3) $50–80K, (4) $80–100K, (5) $100–150K, (6) $150–200K, (7) $200–250K, (8) $250–300K, (9) $300–400K, (10) $400–500K, (11) $500–750K, (12)$750K to $1 million, (13) $1–2 million, (14) $2 million or more. (e) Annual vacation: (1) one domestic trip (costing < $2000), (2) a few domestic trips (costing between $2000 and $5000), (3) one international trip (costing $5000–$10,000), (4) a few international trips (costing $10–$50K), (5) several trips (costing $50K or more). (f) Eating out: (1) eat out in a nice restaurant once a month or less, (2) once every other week, (3) once a week, (4) a few times a week, and (5) almost every day. (g) Grocery shopping: (1) a discount chain store (e.g., Walmart, Kroger), (2) an average chain store (e.g., Harris Teeter), and (3) a luxury grocery store (e.g., Whole Foods). We calculated the mean of the responses to these seven items to form the luxury lifestyle score (United States: α = .67; Japan: α = .70. According to the box plot, there was no outlier.
Willingness to Borrow
After indicating their ideal life in future, participants were asked two questions regarding postgraduate education: How much participants are willing to invest in postgraduate education (e.g., MBA, law degree, medical degree) and how much in student loans they are willing to take. After making the ideal lifestyle and necessary education vivid, we asked our main questions (dependent variable). Now imagine that you completed all the necessary postgraduate education, but your household income at age 40 is not enough to allow for the lifestyle of your choice. Indeed, in order for you to achieve the lifestyle you chose above, you must earn far more than what you are making (e.g., at least twice as much). How much are you willing to borrow to achieve the lifestyle of your dream?
1 = Not at all. I would rather completely scale down the lifestyle of my dream to fit my income, 2 = Not much. I would rather scale down the lifestyle of my dream by about 80% and achieve a lifestyle slightly more luxurious than my income allows by borrowing a bit (assuming that my income will sufficiently grow in the next 5 years or so), 3 = Somewhat. I would scale down the lifestyle of my dream by about 50%, but achieve about half of the lifestyle of my dream by borrowing (assuming that my income will sufficiently grow in the next 5 years or so), 4 = Very much. I would scale down the lifestyle of my dream by about 20%, but achieve most of the lifestyle of my dream by borrowing heavily (assuming that my income will sufficiently grow in the next 5 years or so), or 5 = Definitely. I would not scale down the lifestyle of my dream, but achieve it by borrowing heavily (assuming that my income will sufficiently grow in the next 5 years or so). The final question was “How large of a loan would you be willing to take out in order to achieve your dream lifestyle?” 1 = none, 2 = less than $50K, 3 = $50K to $100K, 4 = $100K to $200K, 5 = $200K to $400K, 6 = $400K to $600K, 7 = $600K to $800K, 8 = $800K to $1Mill, 9 = $1Mill to $2Mill, 10 = $2Mill or more. We took the average of responses to these two items to form the willingness to borrow scale (United States: α = .77; Japan: α = .59). According to the box plot, there was one outlier (6.5, whose z-score was 3.85). This observation was recoded to five, the next highest observation.
Residential Mobility
The personal history of residential mobility was assessed by asking them to indicate how many times they moved to a new town or city during elementary school, how many times they moved to a new town or city during middle school, and how many times they moved to a new town or city during high school, then adding the three numbers. According to the box plot, there were two extreme outliers (those who moved 12 and 13 times, z-score = 4.08 and 4.55, respectively). We recoded these two cases to the next highest observation, or 10.
Exploratory/Control Variables
We also assessed relational mobility and life satisfaction. Relational mobility was included because it is considered a more subjective and proximal variable of residential mobility (see Oishi et al., 2015). Life satisfaction was included because individuals who are satisfied with their current lives might desire less materially in future. The participants also completed the 12-item relational mobility scale (Yuki et al., 2007); α = .829 among Japanese; α = .861 among Americans and the Satisfaction With Life Scale (SWLS; Diener et al., 1985; α = .837 among Japanese; α = .900 among Americans). Sample items of the relational mobility scale include “It is easy for them to meet new people” and “These people are able to choose the groups and organizations they belong to.” Finally, we asked participants to indicate their socioeconomic status (SES) as follows: (1) lower/working, (2) lower-middle, (3) middle, (4) upper middle, (5) upper. We included SES because those from higher SES might desire a more wealthy lifestyle and are willing to borrow more.
Results and Discussion
Main Hypothesis Testing
As expected, Americans moved more frequently than the Japanese before entering college (Mus = 4.05, SD = 1.58, Mjapan = 1.13, SD = 1.73), t (372) = 15.78, p < .001, d = 1.80. Consistent with the Bank of International Settlement’s borrowing data, American participants were more willing to borrow to achieve their ideal lifestyle than the Japanese (Mus = 2.47, SD = 1.12; Mjapan = 1.71, SD = .89), t (373) = 6.39, p < .001, d = .73. In addition, Americans desired a greater luxurious lifestyle than did the Japanese (Mus = 3.79, SD = .82; Mjapan = 2.53, SD = .66), t (374) = 14.43, p < .001, d = 1.64.
Next, we examined our main hypothesis regarding residential mobility and willingness to borrow. As predicted, the personal history of residential mobility was positively associated with willingness to borrow, r (372) = .25, p < . 001. In other words, the more frequently an individual moved during childhood, the more willing one was to borrow to achieve their ideal lifestyle.
Alternative Explanations
We next tested alternative explanations. Willingness to borrow was also associated with other variables. First, those who desire a luxurious lifestyle were more willing to borrow, r (373) = .32, p <. 001. Furthermore, self-reported SES was positively associated with the desire for a luxurious lifestyle, r (371) = .55, p < .001. In our sample, female participants had a higher number of residential moves than those of male participants (M = 3.61, SD = 2.02 vs. M = 2.64, SD = 2.08), t (372) = 4.52, p < .001, d = .47. This is due to the fact that there were far more female American participants than Japanese female participants, that is, the proportion of Americans was much higher among female participants than among male participants. In addition, American participants rated their SES higher than the Japanese (Mus = 3.65, SD = .88 vs. Mjapan = 2.09, SD = .82), t (371) = 15.91, p < .001, d = 1.81. Thus, we included the desire for a luxurious lifestyle, gender, and SES as control variables in the following analyses.
In the key analyses below, we predicted willingness to borrow from nation (Japan = 0; United States = 1), the number of residential moves, gender, SES, and desire for a luxury lifestyle. Once we statistically controlled for gender, SES, and desire for the luxury lifestyle, as well as the number of moves, the U.S.–Japan difference became nonsignificant, b = .209 (SE = .204), β = .085, t (367) = 1.02, p = .307. Meanwhile, the personal history of residential mobility marginally predicted willingness to borrow, b = .059 (SE = .033), β = .111, t (367) = 1.78, p = .076. Likewise, the desire for a luxury lifestyle remained a significant predictor of willingness to borrow, b = .199 (SE = .073), β = .172, t (367) = 2.73, p = .007. These findings suggest that the U.S.–Japan difference in willingness to borrow was explained in part by residential mobility and the desire for a luxurious lifestyle (see Supplementary Materials ahttps://osf.io/wq4mh/ for additional controls including relational mobility and life satisfaction).
Mediation Analysis
Next, we formally tested mediation effects using a bootstrapping technique with 5,000 resamples. The model is depicted in Figure 3. We tested whether the U.S.–Japan differences in willingness to borrow could be explained by the personal history of residential mobility and the desire for a luxury lifestyle while controlling for participants’ gender and SES. The indirect effect of residential mobility was marginal, .187 (SE = .114), 95% CI = −.025; .426. The indirect effect of the desire for a luxury lifestyle was significant, .189 (SE = .084), 95% CI = .020; .352.
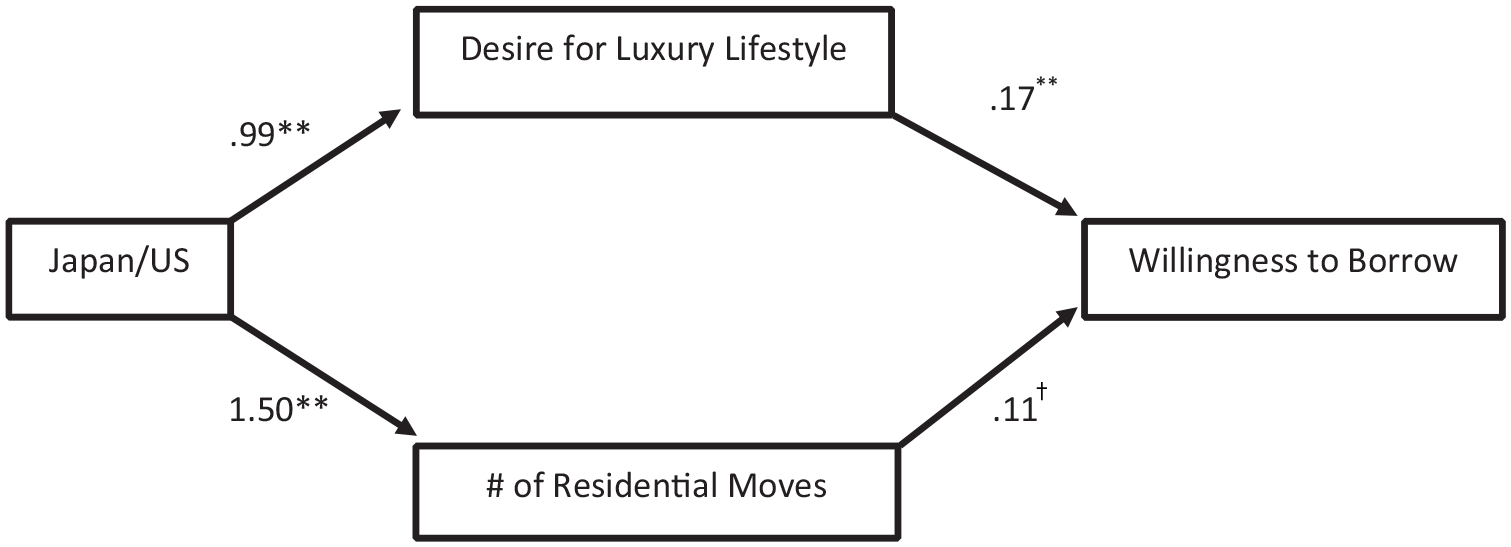
The Multiple-Mediator Model
In summary, Study 5 showed that American participants were more willing to borrow to achieve the lifestyle they desired than the Japanese participants. In addition, these cross-national differences were explained in part by residential mobility and the desire for a luxury lifestyle.
Study 6: Residential Mobility, Gratitude/Indebtedness, and Personal Debts
Studies 1 to 5 established the association between residential mobility and debts at the level of nation (Studies 1 and 2), city (Study 3), district (Study 4), and individual (Study 5). In Study 6, we examined whether feelings of gratitude and indebtedness, as a psychological mechanism, underlie the link between residential mobility and financial debts in another non-Western country. We hypothesized that individuals who chronically feel grateful and indebted to others are less likely to borrow from others because they presumably already feel indebted and feel that they must pay others back, whereas individuals who do not feel indebted or grateful toward others might feel that they do not have anything to pay back and could borrow more. Previous research among Koreans found that gratitude is tightly associated with indebtedness (Oishi et al., 2019). We thus combined gratitude and indebtedness in our measurement below.
Method
Participants
Participants were panel members of Macromill Embrain, a nationwide online research panel in South Korea. Macromill Embrain’s panel has more than one million individuals, aged 18 and above. They received monetary incentives in return for the completion of surveys. Data for this study were obtained as part of a larger longitudinal study on social judgment, and the measures for this study were presented with other measures that are irrelevant to this research. The study involved two waves of online surveys. The items related to residential mobility were added in the second round. Therefore, we analyzed the data from the second round of the survey. A total of 1,466 participants (49.2% female, Mage = 41.09 years) participated in this study. The mean income was 4.68 (SD = 1.90), where monthly income of $0 to $999 was coded as 1, $1,000 to $1,999 as 2, $2,000 to $2,999 as 3, $3,000 to $3,999 as 4, $4,000 to $4,999 as 5, $5,000 to $5,999 as 6, $6,000 to $6,999 as 7, and $7,000 or more as 8. The mean level of education was 5.51 (SD = 1.05), where 1 = never attended school or only attended kindergarten, 2 = completed elementary school, 3 = completed middle school, 4 = completed high school, 5 = completed at least 2 years of college, 6 = completed 4-year college, 7 = master’s degree, 8 = doctoral degree.
All questions were administered in Korean. This sample size had the statistical power of 97% to detect a small effect size (r = .10) and the statistical power of 99% to detect the effect size obtained from Study 5 (r = .254; Faul et al., 2009). This study was approved by the University of Illinois Urbana-Champaign Champaign’s Institutional Review Board (Protocol #16237).
Current Credit Card Debt
Participants were asked to report their current credit card debt as another financial behavior. They were asked to choose one of the six categories: $0, at least $1 less than $1,000, at least $1,000 less than $5,000, at least $5,000 less than $10,000, at least $10,000 less than $20,000, over $20,000. According to the box plot, there was no outlier.
Willingness to Save Money
We measured participants’ willingness to save money as a financial behavior to examine whether residential mobility predicts how people allocate their money: saving versus spending. The participants were asked to imagine that they had received $3,000 as their tax refund and report how they would distribute $3,000 across three categories that were adopted from past research: adding to savings, spending on necessities, and spending on something nice (Dholakia et al., 2016). For the key saving item, according to the box plot, there was no outlier.
Attitude Toward Taking a Loan
Afterward, the participants reported their attitude toward taking a loan on a 7-point scale (1 = strongly disagree, 7 = strongly agree) using the 17-item scale (Lea et al., 1995). Sample items include “Taking out a loan is a good thing because it allows you to enjoy life,” “It is a good idea to have something now and pay for it later,” and “Being in debt is never a good thing” (α = .82). According to the box plot, there was no outlier.
Personal Savings Orientation
We also measured participants’ attitudes toward saving money on a 7-point scale (−3 = strongly disagree, 3 = strongly agree) using the nine-item scale developed to measure chronic tendencies to save money (Dholakia et al., 2016). Sample items include “I do not spend money thoughtlessly, I would rather save it for a rainy day,” and “Putting money into personal savings is a habit for me” (α = .86). The box plot showed that there were four extreme outliers (with two outliers having the same value) (−2.11, −2.33, −2.56; z-score = −4.34, −4.64, −4.94, respectively). We recoded these four cases to the next lowest observation, or −1.78.
Feelings of Gratitude and Indebtedness
We asked participants to report to what extent they experience each of the three feelings (grateful, thankful, indebted; α = .88) in their everyday life, which were presented with other irrelevant feelings (joyful, resentful, obligated) on a 7-point scale (1 = not at all, 7 = very much). According to the box plot, there was no outlier. Consistent with previous research (Oishi et al., 2019), the high level of Cronbach’s alpha with only three items demonstrated that indebtedness and gratitude were closely experienced among our Korean participants.
Residential Mobility
We measured participants’ personal history of residential mobility before college, during which time identity and personality are largely shaped, as in Study 5. Participants reported the number of times that they had moved during elementary school, middle school, and high school. Moves across the three different time periods were summed for an index for personal history of residential mobility (M = 1.84, SD = 2.20; skewness = 2.07, kurtosis = 6.13). According to the box plot, there were seven outliers (those who moved 13, 14, 15, and 16 times; z-score = 5.16, 5.62, 6.08, 6.55, respectively). These cases were recoded to 12, the next highest score.
Demographics
Finally, participants’ age, gender (1 = female, 0 = male), income, and education were measured. We report the results without these control variables, but all results were virtually identical when these variables were included.
Results & Discussion
Consistent with our hypothesis, residential mobility was associated with the amount of current credit card debt participants had, r = .10, p < .001. It should be noted that the current credit card debt cannot be confounded with the debt accumulated during the move itself, as the personal history of residential move was measured during the participants’ schooling years (elementary, middle, and high schools; thus, the costs associated with moves were mostly likely incurred by their parents, not themselves) and most participants were assessed years after high school graduation (the average age was 41 years).
The association between personal history of residential mobility and credit card debt was robust against other potential variables associated with credit card debt, such as income, education, gender, and age. Controlling for all these variables simultaneously, personal history of residential mobility predicted credit card debts, b = .06 (SE = .015), β = .10, t (1,460) = 3.82, p < .001.
In addition to credit card debt, we explored the association between residential mobility and saving. As predicted, the more frequently participants had moved in the past, the less tax refund they were likely to save, r = −.07, p = .006. Like credit card debt, controlling for income, education, gender, and age did not eliminate this association, b = −1.97 (SE = .801), β = −.06, t (1,460) = −2.459, p = .014. Contrary to our predictions, residential mobility was not correlated with two self-report measures of borrowing and saving attitudes: attitude toward taking a loan, r = .03, p = .26, or with personal savings orientation, r = −.02, p = .43.
We also found that personal history of residential moves was marginally negatively correlated with feelings of gratitude and indebtedness (a mean of grateful, thankful, and indebted). The more frequently participants had moved in the past, the marginally less likely they were to experience gratitude, thankfulness, and indebtedness, 1 r = −.05, p = .075.
Sequential Mediational Analyses
We next tested whether the link between residential mobility and credit card debt is explained via feelings of gratitude/indebtedness (mediator 1), which in turn is associated with attitudes toward a loan (mediator 2) using a bootstrapping technique with 1,000 resamples, controlling for income, education, gender, and age. The more frequently participants had moved in the past, the less marginally likely they were to experience feelings of gratitude/indebtedness, b = −.02, SE = .01, t = −1.86, p = .06. Then, the less likely they were to experience feelings of gratitude/indebtedness, the more positive attitudes they were likely to hold toward taking a loan, b = −.11, SE = .02, t = −6.16, p < .001. Finally, the more positive attitudes they had toward taking a loan, the greater the amount of credit card debt they were likely to have, b = .33, SE = .05, t = 7.02, p < .001. When these two mediators were included in the path model, the direct link between residential mobility and credit card debt remained significant,b = .06, SE = .01, t = 3.79, p < .001. Thus, the link between residential mobility and credit card debt was partially mediated by feelings of gratitude/indebtedness and attitudes toward a loan, indirect effect = .0008, 95% biased-corrected confidence interval = .0001 to .0019.
Residential Mobility, Feelings of Gratitude, Attitude Toward Taking a Loan, and Willingness to Save Tax Refund
Because residential mobility was inversely associated with savings from tax refunds, we next tested whether this association was explained in part by feelings of gratitude/indebtedness and attitudes toward a loan for a sequential mediation using a bootstrapping technique with 1,000 resamples, controlling for income, education, gender, and age. The more frequently participants had moved in the past, the marginally less likely they were to experience feelings of gratitude/indebtedness, b = −.02, SE = .01, t = −1.86, p = .06. Then, the less likely they experienced feelings of gratitude/indebtedness, the more positive attitudes they were likely to hold toward taking a loan, b = −.11, SE = .02, t = −6.16, p < .001. The more positive attitudes they had toward taking a loan, the less tax refund they were likely to save, b = −24.38, SE = 2.52, t = −9.68, p < .001. When feelings of gratitude/indebtedness and attitudes toward a loan were included in the model, the direct link between residential mobility and tax refund saving remained significant, b = −1.85, SE = .78, t = −2.38, p = .02. Thus, the link between residential mobility and tax refund saving was partially explained by feelings of gratitude/indebtedness and attitudes toward a loan, indirect effect = −.0590, 95% biased-corrected confidence interval = −.1346 to −.0003.
In summary, the personal history of residential moves is positively associated with the amount of current debt and negatively associated with saving. In addition, these associations were partially mediated through feelings of gratitude/indebtedness and attitudes toward taking a loan, though the first link between residential mobility and gratitude/indebtedness was marginal.
General Discussion
We started this research with questions such as “Why are Americans on average more willing to borrow to achieve the lifestyle of their choice than others?” “Are there systematic regional differences within the United States in borrowing behaviors?” “Are there systematic individual differences in borrowing behaviors?” and, finally, “What kind of socioecological and psychological factors might explain these individual, regional, and cultural differences?”
We conducted six studies to shed light on these questions. Study 1 found that American households had higher rates of debt and lower rates of saving than Japanese households between 1965 and 2015. We then found a positive association between residential mobility and household debts across 76 countries (Study 2), 144 U.S. cities (Study 3), and 366 districts in India (Study 4). In Study 5, we found that cultural differences in willingness to borrow money were explained in part by personal history of residential mobility and desire for a luxury lifestyle. In Study 6, we found that residential mobility was associated with more credit card debts and less saving, and these associations were in part explained by gratitude and indebtedness and more positive attitudes toward loans. It should be noted, however, that the link between residential mobility and the feelings of gratitude/indebtedness was weak in effect size and statistically marginal.
The Socioecological Approach to Debts
Excessive borrowing could cause personal pains and interpersonal and family strains (T. A. Sullivan et al., 2000). Many forms of debt, ranging from credit card debts to student loans, have a significant impact on one’s career choice, marital decision, and family planning. In the past, most explanations for financial debts have been at the level of individual: a person’s age, education, income, financial knowledge, and personality (Brown & Taylor, 2014; Crocker & Luhtanen, 2003; Norvilitis et al., 2006; Nyhus & Webley, 2001). For instance, extraverts and sensation seekers with little financial literacy are more likely to accumulate financial debts than introverts and nonsensation seekers. While these findings provide important insight into individual differences in debts, previous research has not explored whether regional or cultural differences in debts could be explained by these individual difference variables. The main contribution of our studies was to shed new light on a socioecological factor and its psychological correlates regarding why some people are so eager to borrow.
We found that individuals living in a residentially mobile city, region, and country tend to be more willing to borrow than those living in a residentially stable area. We further found a weak link between residential mobility and the feeling of indebtedness and gratitude such that those who have moved around while growing up tend to feel less indebtedness and gratitude toward others, and the less indebtedness and gratitude they feel, the more money they are willing to borrow.
Alternative Explanations
The first alternative explanation for regional and cultural differences in willingness to borrow is regional and cultural differences in well-known individual-level factors. For instance, some regions are populated with more sensation seekers and extraverts than others (e.g., Bleidorn et al., 2016; Rentfrow et al., 2008). These regional variations in personality could in turn contribute to regional variations in debts. 2
The second alternative explanation is materialism. In Study 5, we found that Americans desire a more luxurious lifestyle than the Japanese. Furthermore, the more luxurious the lifestyle people desire, the more they are willing to borrow. It might be that residential mobility increases materialism because people who moved to an area with more economic opportunities are exposed to a new, more luxurious lifestyle. The more they are exposed to the new luxurious lifestyle, the more they desire such a lifestyle, and the more they are willing to borrow. Although we are not aware of direct evidence for this line of thinking, previous studies found that residential mobility is causally related to a decrease in religious involvement (e.g., Bibby, 1997). To the extent that religiosity is inversely associated with materialism (e.g., Burroughs & Rindfleisch, 2002), residential mobility might indeed be associated with materialism. Finally, materialism is characterized by envy, greed, and admiration of the rich (Belk, 1985). Thus, it is possible that residential mobility increases one’s tendency for envy, greed, and admiration of the rich. The more envy, greed, and admiration of the rich, the more money people are willing to borrow to achieve a luxurious lifestyle.
The third alternative explanation for American proclivity for borrowing is that the institutionalization of borrowing made borrowing less guilt and shame provoking. The United States has a history of high residential mobility (Tocqueville, 1840/2003; Turner, 1921). People move to a new city in search of a better life. To start a new life, most have to borrow heavily first. Banks and lenders have played a prominent role in the United States since its foundation. For instance, Alexander Hamilton established the first bank in the United States in 1780 (Hammond, 1985). With the proliferation of banks, borrowing in the United States has become quite normative and less shameful (cf. Cohen, 2003). Whereas borrowing from close friends or family members could evoke indebtedness, guilt, and shame, borrowing from an institution does not. The less guilt and shame borrowers feel, the easier it is to borrow more. These speculations need to be tested explicitly in future.
Limitations and Future Directions
Before closing, it is important to note the limitations of our research. First, although Studies 1 to 4’s cross-national and regional variations had a moderate effect size, Study 6’s individual difference findings were small in effect size. Second, Study 6 revealed feelings of gratitude and indebtedness toward others as the process underlying the focal effect in South Korea. The generalizability of this mechanism has yet to be tested in other populations. Finally, given that all of the reported studies are correlational studies, interpretation of the causal relationships should be made with caution. Future research should examine whether induced gratitude and indebtedness will reduce willingness to borrow (cf. DeSteno et al., 2014). If that is the case, various gratitude interventions (e.g., Emmons & McCullough, 2003) might encourage people to live within their means or encourage experiential consumption rather than material consumption (Walker et al., 2016).
Financial debt is a significant personal, interpersonal, and societal issue for many people and communities. Much academic and public intellectual discourse revolves around ease of access to credits, predatory lending, and materialism (e.g., T. A. Sullivan et al., 2000; Williams, 2005). There is no question that willingness to borrow is determined by multiple factors: one’s desires for a particular lifestyle, one’s optimism about future earnings, one’s threshold for financial risk-taking, and ease of obtaining a loan (see also Cohen et al., 2021 for religious–cultural factors). The present research points to other unusual suspects: Distal ecological factors such as residential mobility and a few psychological mechanisms such as indebtedness and gratitude could play an important role in people’s willingness to borrow to achieve the lifestyle of their choice. It is also important to explore various alternative psychological mechanisms such as envy, greed, admiration of the rich in the context of residential mobility and financial debts.
Footnotes
Acknowledgements
This research was funded by the John Templeton Foundation, Grant No. 61513. The authors would like to thank Sae Kim for the help with data visualization and editting.
Author Contributions
S.O. conceived the research ideas; S.O., A.K., M.K., Y.C., and R.K. collected data; S.O., M.K., and Y.C. analyzed data; R. K. checked the results; S.O. wrote the first draft; and A.K., M.K., Y.C., and R.K revised it.
Declaration of Conflicting Interests
The authors declare no potential conflicts of interest with respect to the research, authorship, and/or publication of this article.
Funding
The authors disclosed receipt of the following financial support for the research, authorship, and/or publication of this article: This research was funded by the John Templeton Foundation, Grant No. 61513.
Supplemental Material
Supplemental material for this article is available online.