
Abstract
This study presents new theory and evidence on the repertoire of electoral intimidation, suggesting that threats can be used to deter rival party supporters from voting but also to mobilize citizens to vote for a particular party. We expect these strategies to unfold in the same electoral context, but differ in targeting and incidence; while threats to demobilize are concentrated in closely contested areas and occur more frequently overall, threats to mobilize target fewer voters and are centered in parties’ own strongholds. Recognizing the difficulty of surveying citizens about sensitive experiences, we combine qualitative material from local news with evidence from a list experiment embedded in an original survey conducted after the 2019 elections in the Indian state of West Bengal. Our empirical findings corroborate our expectations: areas without overt violence may nevertheless be highly coercive, underlining the importance of studying the full repertoire of electoral violence.
Introduction
Violence against voters during electoral campaigns and on election day is a pervasive and deeply troubling feature of the electoral contest in many countries. Violence in elections comes in many shapes and forms, ranging from threats and intimidation to rioting and lethal violence (Birch, Daxecker, and Höglund 2020). Current efforts to unpack the causes and consequences of electoral violence discuss how threats, intimidation, and coercion are used to shape how citizens participate in elections—whether they vote and whom they vote for. Studies that systematically examine empirical patterns of voter intimidation at the individual level are rare, meaning that assumptions central to current theorizing remain untested at the micro-level.
Current literature presents different views on the strategic purpose of threats and intimidation. Most scholarship assumes that coercion is primarily used to convince citizens to abstain from voting. Yet some work also suggests that violence can be levied strategically to convince people to turn out on election day and cast their vote for the perpetrating party. Existing literature provides a weak foundation for adjudicating between these perspectives, as most micro-level work has emphasized one of these strategic logics. Moreover, most studies have focused on overt manifestations of violence and left more covert manifestations, such as threats and intimidation, aside. Whereas most research proposes that demobilization is the modal form of violence, carefully presented case studies from places like Zimbabwe, Burundi, and Nigeria also support the argument that violence is sometimes used for mobilization and to enhance turnout for the perpetrating party (Bratton 2008; LeBas 2006; Travaglianti 2014). It may be that the strategic purpose of violence against voters is heterogeneous across the countries and elections being studied. Just as plausible, though, is that current data, which is heavily tilted towards event reports of overt, physical violence, has made it challenging to consider variation in threats and intimidation in the same context, limiting our understanding of whether and how strategic logics might co-exist.
This study presents a novel effort to consider coercive threats of voter demobilization and mobilization within the same theoretical and empirical framework. To this end, we combine descriptive evidence on the logic of mobilization and demobilization threats coded from 20 local newspapers with novel data from a survey conducted after the 2019 elections in West Bengal in India. This is a state that has seen intense and oftentimes violent competition between political parties, with much of the violence directly or indirectly aimed at voters. Mindful that electoral violence is a sensitive topic, we ask survey respondents about their experiences using list experiments, a well-established technique for soliciting truthful answers. Building on existing literature, we argue that threats to mobilize voters will be levied selectively against specific individuals for the purpose of in-group policing, seeking to deter larger defection within the parties’ electoral stronghold. Intimidation aimed at threatening citizens to abstain from voting, on the other hand, will be more prevalent in closely contested areas where electoral uncertainty creates large pay-offs from coercive strategies, but lack of information and control makes more selective strategies of violent in-group policing infeasible. In this context, we expect intimidation to manifest itself as broader targeting aimed at directly demobilizing a larger segment of voters.
Our empirical analysis corroborates our expectations. The analysis of local news reports shows that when intimidation is used to mobilize, it is aimed at voters at risk of defecting in parties’ own strongholds. In contrast, threats to demobilize are aimed at rival party voters and seem to be more common in competitive constituencies. Results from our list experiment combined with election data at both the aggregate (parliamentary constituency) and local level (polling station) confirm and nuance these patterns. Threats to deter voters affect a higher number of citizens, compared to threats for mobilization purposes. Whereas both of these strategies unfold in parallel within the same electoral contest, the patterns of intimidation differ. We find that threats to mobilize votes are more prevalent in non-competitive districts, but only in those where the incumbent party—the Trinamool Congress (TMC)—prevails. We do not find a similar effect for opposition strongholds, that is areas controlled by the Bharatiya Janata Party (BJP). We speculate that the state incumbent party has a greater capacity to mobilize through coercion, stemming from the TMC’s more extensive party networks and state control over the police. This is in line with the logic of our theoretical argument that suggests that mobilization only works where actors have the information and capacity to selectively target individuals and to credibly monitor compliance. Demobilization threats, on the other hand, are more prevalent in fiercely contested parliamentary constituencies, where the margin of victory between the winner and runner-up is small, compared to party strongholds. At the local level, however, demobilization is also common in stronghold areas, indicating that demobilization seems to be a useful tool for political actors both in their strongholds and in areas where they face competition.
We highlight three contributions. First, we contribute to the literature on political violence by explaining variation in the patterns—or what Gutiérrez-Sanín and Wood (2017) aptly term repertoires—of electoral intimidation. We establish that intimidation varies in targeting and frequency. It is used not only to punish rival partisans, that is the already disloyal, but also to ensure continued compliance from supporters whose loyalties are in doubt. We show that threats aimed at ensuring continued loyalty from supporters are more common in party strongholds, which is an important corrective for a body of literature that has largely ignored non-lethal forms of violence and assumed that such violence is most prevalent in contested areas.
Second, we show that micro-level accounts are crucial for demonstrating variation in intimidation, which sheds light on why effects on turnout and vote choice may not be discernible at more aggregate levels. Our results show that voters in strongholds are often threatened to vote for a particular candidate, while those in competitive areas experience very few mobilization threats and predominantly deterrent threats. If threats and violence are effective at mobilizing and demobilizing citizens, respectively, effects on turnout at national (or even sub-national) levels could be zero. This is one plausible explanation for why studies have found limited (or mixed) effects of election violence on turnout (Bekoe and Burchard 2017; Hafner-Burton, Hyde, and Jablonski 2018).
Third, we contribute to the study of covert forms of violence, which, compared to more overt forms (inflicting physical harm), have received far less attention. Within the growing literature on electoral violence, existing research has prioritized the study of overt and lethal forms, where data has been more readily available, rather than covert and non-lethal forms. 1 This omission is unfortunate, because harassment and intimidation appear prevalent (Straus and Taylor 2012, 17-18, 24). Importantly, the absence of overt violence does not imply the absence of coercion, since locations without observable violence could be entirely coercive or non-coercive (Mares and Young 2016, 270). Distinguishing between these scenarios requires micro-level accounts of intimidation that are often hard to come by, but which we provide in our study. Examining variation in the targeting and frequency of intimidation in a single context, we are able to hold context constant while establishing distinct empirical patterns across different types of voters and in the intensity of intimidation. The finding that strongholds can be free of overt violence yet nevertheless highly coercive is especially important for policymakers who—similar to academic research—have centered their efforts on overt manifestations of electoral violence.
Existing Research
Electoral violence is violence used by political actors to “purposefully influence the process and outcome of elections” (Birch, Daxecker, and Höglund 2020). 2 While the targets of electoral violence can be diverse, including political candidates and election workers, a significant share tends to be directly targeted at voters with the purpose of influencing their voting behavior. 3 Violence against voters can be levied strategically to influence both whether citizens vote and whom they vote for. 4 Scholars who study voter intimidation often make counter vailing claims regarding the specific purpose of the violence and its manifestations. Whereas some build their work on the assumption that violence is used primarily to demobilize voters likely to support the rival party, a few scholars have also proposed that violence can be used as a mobilizing tool to coerce people to vote in a particular way. We elaborate on these two perspectives below.
Most scholars, albeit often implicitly, assume that electoral violence is a tool to demobilize voters (e.g., Asunka et al., 2017; Epperly et al., 2020; Gonzalez-Ocantos et al., 2020; Gutiérrez-Romero, 2014; Müller-Crepon, 2022; Rauschenbach and Paula, 2019). Deterring individuals from voting is generally held to be more feasible than using coercive strategies to sway people to cast their vote for a particular party or candidate. The secrecy of the ballot makes it much harder to monitor vote choice compared to turn-out, the argument goes, which incentivizes violent political actors to focus on the latter. Empirical evidence to support this claim is primarily indirect. Based on the assumption that violence is used to disenfranchise voters, scholars predict, for example, that voters in opposition strongholds will report higher fear of exposure to electoral intimidation (Rauschenbach and Paula 2019, 2) and that electoral violence will be most prevalent in the electoral stronghold of rival parties and target “swing-” or moderate voters specifically (Gutiérrez-Romero, 2014). Similar expectations are derived from theoretical models that tend to contrast incentives for coercive strategies of voter suppression with the use of positive economic inducements for voter mobilization (see e.g., Collier and Vicente 2012; Robinson and Torvik 2009).
The demobilization perspective has been supported by some studies showing a relationship between electoral violence and lower turnout at the macro level. Anchored in psychological theories of how fear triggers withdrawal and disengagement, research suggests that insecurity leads to lower political participation (Valentino et al., 2011). Because threats and coercion in the electoral environment further add to the costs of political engagement, actors can effectively use violence to reinforce the likelihood of voter abstention. Borzyskowski, Daxecker, and Kuhn (2022), amongst others, take the relationship between fear of electoral violence and lower turnout as support that electoral violence seeks to demobilize the vote. Studies have also shown that violence alienates voters, reducing the likelihood that they will vote for a said candidate (Gutiérrez-Romero and LeBas, 2020; Rosenzweig, 2023; Siddiqui, 2022) and enhancing the likelihood of voting for an opposing one (Burchard 2020). Whereas this is consistent with the notion that one can more easily deter voting using violence, studies may conflate the observed effect with what was the intended purpose for those perpetrating violence. Bratton (2008, 627), for example, finds evidence that violence de facto demobilized voters in the 2007 elections in Nigeria. He notes, however, that there are strong reasons to believe that campaign repression was also levied to control the party’s own membership, but that “contrary to leaders’ presumed intentions, violence was associated with lower levels of electoral support”. Moreover, the evidence regarding the relationship between electoral violence and turnout suggests a more ambiguous relationship. There is no consistent macro-level evidence to support that more violent elections see lower levels of turnout overall, as one would assume if violent demobilization provided the complete picture (Bekoe and Burchard 2017; Hafner-Burton, Hyde, and Jablonski 2018).
A different perspective on the strategic logic of electoral violence is suggested by a handful of studies describing how it is directed against voters to mobilize them both to turn out to vote and to cast their vote in favor of the perpetrator. In addition to Bratton (2008), whose work on Nigeria points to the presence of coercive mobilization, there is research from Zimbabwe and Burundi suggesting that threats and intimidation were levied against specific members of the party’s own electoral constituency to enforce broader turnout and deter voter defection to the opponent. Drawing on evidence from Burundi, Travaglianti (2014, vii-2) notes that “political parties used violence to signal their strength and their ability to protect supporters, punish political defectors, and coerce political opponents within the same ethnic group” and notes that in areas most affected by violence, more people went to the polls. LeBas (2006, 429) makes similar observations when studying the prevalence of government intimidation in Zimbabwe in the early 2000s, which occurred largely where the ruling party was already strong. She notes that violence was a strategy to consolidate power and that it had symbolic value in terms of fostering obedience and expanding control in the regime’s own areas of support.
There is also cross-national evidence that speaks to repression and coercion as a tool of mobilization. Hafner-Burton, Hyde, and Jablonski (2018), for example, explain the association between regime-perpetrated electoral violence and the higher likelihood of incumbent victory as evidence that repressive regimes can be efficient in “persuading” voters to turn out and vote in their favor. There is related work on economic threats and voter mobilization. Mares and Young (2018), for example, argue that where ballot secrecy makes it difficult to monitor vote choice, party brokers are more likely to target core supporters not only with positive inducements, but also with threats. They propose that core supporters receive privileged access to entitlements and that parties mobilize these voters at the time of election by threatening to withdraw access to these income streams.
In sum, existing research recognizes two contrasting perspectives on the strategic use of electoral coercion against voters. Although no study rejects the notion that voter demobilization and mobilization could exist alongside each other, existing work has neither theorized nor analyzed these within a joint framework as separate manifestations of violence with distinct logics and patterns. This is what we will do next.
Unpacking the Repertoire of Electoral Violence: Why and When (De)mobilization Occurs
In the following section, we unpack the repertoire of electoral violence by making a central distinction between two distinct forms. 5 We propose that violent strategies to demobilize and mobilize voters can unfold in parallel within the same electoral contest and are used in tandem by the same actors, but expect them to follow a different logic and thus produce distinct patterns—both when it comes to the targeting and frequency of intimidation. While demobilization threats—using intimidation to keep voters from the ballots—is a strategy primarily aimed at enhancing the perpetrator’s electoral fortunes by removing votes for other parties, mobilization threats—using intimidation to sway people to vote for them—is aimed both at increasing vote share and consolidating control within the perpetrators’ own constituency (also beyond immediate electoral outcomes). Which strategy, or combination thereof, actors choose, depends on the information and capacities available to them, alongside structural factors that determine the costs and benefits attached to each strategy. 6
Mobilization as a Tool of in-Group Policing in Strongholds
Where actors have information about voters’ disposition and behavior, and, even more importantly, the party can rely on strong networks for social control and for monitoring the electoral base, we expect to see threats and intimidation to mobilize votes. 7 Such information and capacities are primarily available in areas where one political party dominates, and so we expect threats and intimidation to mobilize votes to be used to target individuals within the perpetrator’s own electoral base within its own stronghold. While parties in such contexts can be relatively certain that a large proportion of the local population will vote for them, uncertainty remains as to how large this segment will be and whether individuals may defect and cast their vote in favor of the opposition. While demobilization threats to keep opposition voters from the ballots could be utilized to keep vote loss as small as possible, political control provides informational and structural advantages that permit parties to rely also on coercive mobilization. Specifically, political control allows for two aspects that make mobilization threats more efficient: the selective targeting of potential defectors and the monitoring of compliance.
From the literature on contentious politics, we know that coercive behavior is unlikely to attract the support of the opposing side. If anything, threat and coercion directed against opponents are associated with backlash effects that enhance the support for the opponent (e.g., Mason and Krane 1989; Sutton, Butcher, and Svensson 2014). Yet, selective targeting of actual or potential defectors carries a much lower risk of backlash. Where large segments are already voting in favor of the perpetrating party, mobilization threats may be seen as an appropriate tool for in-group policing. Violence can be used to selectively sanction defection from within the parties’ own constituency, forging compliance in the broader group. This carries less risk of backlash. Existing work on motivated reasoning highlights that individuals often justify, rather than blame, misconduct by others who share their social identity (e.g., Silverman 2019; Solaz, De Vries, and Geus 2019). Co-partisans might even perceive mobilization threats as a signal of strength and resolve (De Vries and Solaz, 2017; Gutiérrez-Romero and LeBas, 2020; Vaishnav, 2017; Winters and Weitz-Shapiro, 2013), and reward, rather than punish it, at the polls.
In strongholds, political parties not only have information and capacity to selectively target dissenters, they also have the capacity to monitor compliance. In comparison to contested areas where different political loyalties are manifest, actors can more easily follow up on mobilization threats in contexts where their party networks are dense and local dominance often comes with control over police and other agencies. When parties are able to identify and follow up on the electoral behavior of potential dissenters, they send a signal to a wider audience than the target that defection is risky and will be punished. The dangers associated with defection can thus be signaled more credibly, 8 which also reduces the risk of side-switching or defiance among the broader group of voters that are bystanders to threats and intimidation. Using this strategy, reputation costs and the risk of back-fire will be modest, but benefits in terms of deterring further defection and enhancing the cohesion of the own electoral base are high (e.g., Travaglianti 2014; Wahman and Goldring 2020). Mobilization threats, therefore, have symbolic value, not only likely to generate electoral support, but to solidify the control of the dominating party more generally (LeBas 2006; Travaglianti 2014). This makes it a relatively cheap but powerful tool for in-group policing.
Demobilization as a Tool of Disenfranchisement in Contested Areas
In politically contested areas, however, actors do neither possess the information nor the capacities required to selectively target individuals. Electoral contestation—meaning that multiple parties have substantial support and actively compete for votes—places limits on both the information political actors have about individual vote intention and on actors’ capacities to monitor compliance. This restricts the use of selective threats for mobilization purposes. Where political control is fragmented and uncertain, actors do not possess the networks and control over local populations and law enforcement to identify voters’ dispositions and preferences at the individual level and are also not able to verify whether voters complied with mobilization threats or not. Even if actors would opt to violently mobilize opponents, there are viable alternative party options for individuals to vote for. In contrast to strongholds, this also means that coercion can backfire, as voters targeted with intimidation can more easily choose to switch their loyalties.
Perpetrators would like to avoid unintentionally demobilizing those who intend to vote in their favor by violently mobilizing them, or—even worse—for repression to backfire and produce even larger vote shares for the opponent. This makes mobilization violence an unattractive strategy in contested areas, where it sends a different signal compared to party strongholds. It is more likely to alienate voters—both within the party’s own constituency, the opponent’s constituency, and among undecided voters—pushing them (further) into the arms of the opponent. At the same time, compliance is also unlikely to be monitored, making it a less credible and thus less effective threat.
We thus expect very little mobilization violence to occur in contested areas, where the expected margin of victory is small. Instead, and in line with previous work, we believe parties to rely predominately on demobilization threats to disenfranchise voters who support the rival party or whose political allegiance is—at least—uncertain (c.f. Rauschenbach and Paula 2019; Daxecker and Rauschenbach 2023). Parties weigh the costs associated with demobilizing voters against its likely benefits. While demobilization is likely to also occur in non-contested areas (unless there is complete domination by a political party and no viable opposition whatsoever), the pay-offs from efforts to strategically disenfranchise voters are particularly high where electoral results are uncertain, and abstention of parts of the electorate can swing the vote towards the own party.
We, therefore, expect demobilization to manifest itself as collective targeting in these areas. In other words, we expect threats to be levied strategically on the collective of voters deemed most likely to vote for the opponent based on their group affiliations, such as their social identity or geographical residence. Demobilization violence is less likely to backfire at the polls because it can more easily be monitored and non-compliance credibly punished even where parties lack political control. Just as demobilization itself follows a group-selective targeting logic, so does the punishment of non-compliance. By observing turnout, actors can get an estimate as to whether their threats have been complied with. Voters thus know that if election turnout suggests non-compliance, those issuing demobilization threats are likely to punish the same collective of voters that they intended to demobilize in the first place—independent from individual culpability. This creates incentives to comply.
We do not only anticipate that threats and intimidation to demobilize rival party supporters are more common in contested areas than in party strongholds, but also that these are more prevalent than mobilization violence overall. All parties in contested areas face similar incentives—increasing their own electoral fortunes by reducing votes for opponents—which implies that both incumbent and opposition have incentives to levy threats and violence against those supporting the other side. This can escalate into clashes between rival parties and their supporters, as well as competing claims and counterclaims about culpability.
It follows from this that the numbers of voters threatened to abstain from voting will be higher than the number of voters threatened to vote for a particular party, and that the two forms of intimidation will dominate in different electoral settings. We summarize our arguments in the following hypotheses:
Threats to deter citizens from voting will be more prevalent than threats to mobilize citizens within the electorate.
Voters in electoral constituencies where one party dominates have a higher risk of being targeted with threats to vote for a candidate or party (mobilization) compared to voters in closely contested constituencies.
Voters in electoral constituencies that are closely contested have a higher risk of being targeted with threats to refrain from voting (demobilization) compared to voters in electoral constituencies where one party dominates.
Empirical Context
Case Selection
We test our expectations in the Indian state West Bengal. West Bengal is one of 28 states, located in the country’s Northeast. It is the fourth most populous state with 91 million people estimated by the most recent census. We conducted our face-to-face survey after the 2019 elections for the national parliament (Lok Sabha), which took place over six phases between April 11 and May 12 in West Bengal. 9 In the 2019 elections, the state-incumbent party Trinamool Congress (TMC) and the national-incumbent party Bharatiya Janata Party (BJP) were widely seen as the primary competitors.
West Bengal is a suitable case for testing our hypotheses for two reasons. First, elections see considerable violence aimed directly or indirectly at voters. The 2019 national elections and local elections held a year earlier experienced high levels of violence, with more than 75 people killed in total. 10 Second, despite frequent violence, elections at various levels are nevertheless competitive and have been conducted regularly. 11 The incumbent party TMC dominates electoral competition since coming to power in 2011, but opposition parties contest elections at all levels, elections are closely contested in several districts, and some districts are controlled by opposition parties. These features are important for our theory since, in a closed authoritarian environment, incumbents could simply unilaterally repress the opposition without considering backlash or voters switching their loyalties.
Describing Mobilization and Demobilization Threats in West Bengal
This section presents qualitative evidence from newspaper reports to document the presence of mobilization and demobilization threats in West Bengal. We rely on local—that is, district-level— newspapers as the primary source; this is the best source because West Bengal has a long and rich tradition of having many local newspapers located across the state (Basu 2013). 12 We gathered reports on threats and violence in the 2019 elections from 20 newspapers, covering all districts. We complement local reporting with national news. 13
We begin with threats to mobilize voters, which should be concentrated in parties’ strongholds and aim to deter defection. We provide evidence of threats from several constituencies, including TMC and BJP strongholds. In Jadavpur, an urban TMC stronghold with a 21 percent victory margin in 2019, journalists reported that citizens were forced to vote for the TMC. One incident made national news because threats to vote for TMC were filmed; as the Times of India reports, a TMC polling agent was caught on camera while instructing voters “to press the button number 4 for TMC.” 14 In Bhangar (an assembly constituency located in Jadavpur), local news reported threats by the TMC against their own party workers and supporters to deter defection. 15
In Jaynagar, a rural constituency won by the TMC with a 23 percent winning margin, local news described threats by TMC officials against their own voters. During a party meeting, the leader of the local village council said that “all the votes in the ten regions of Bhangor must be cast in favor of the Trinamool.” 16 Before elections, threats by the TMC were also reported in a local college, 17 and violence killing three TMC party workers was seen as an attempt to enforce intra-party cohesion. 18 Similar incidents were reported in Diamond Harbour, an urban constituency that the TMC won with a margin of 22 percent. In Budge town in this constituency, a local TMC leader was recorded telling voters “that if you work for any other political party; your accounts will be opened. Lok Sabha polls will be held in the same manner as Panchayat elections were rigged.” 19 Reports from these three constituencies confirm that the incumbent employs threats selectively as a tool for in-group policing.
Compared to the incumbent party, TMC, the BJP controls fewer constituencies, and its control of those localities is weaker. There is, however, some evidence of mobilization threats in its strongholds. For example, the BJP won Purulia constituency with 15 percent of the vote in 2019. In Haratan village of this constituency, citizens were threatened by the BJP as follows: “They have to join the BJP if they want to live in the village, he threatened. With that demand, the two people were tied to a pole by cloth and rope and beaten up, after an hour the BJP leaders and workers left the area.” 20
We proceed to describe demobilization threats in several constituencies. Compared to coercive mobilization, violence and intimidation directed at non-supporters in competitive districts are better documented in media and other reporting. This is because parties and their local networks exert weaker control in those areas. We focus on three constituencies with very narrow victory margins. Consistent with expectations, intimidation and violence against rival party voters were common in competitive areas. For example, violence in Malda South, a constituency decided with a margin of less than 1 percent, involved clashes between local leaders and supporters of the two primary parties, which are likely to have a deterrent effect on voters. 21 Candidates and party workers also directly intimidated rival party voters. 22 Opposition parties accused the incumbent of threatening their voters in Malda South, alleging that “the ruling party is threatening in the name of door-to-door campaign.” 23
Similarly, in Bardhaman-Durgapur constituency, a constituency decided with a vote margin of less than 1 percent, election officials said that voters fled a polling station in Jemua town after being threatened not to vote. 24 In Bud town in the same constituency, local newspapers also reported intimidation of opposition party voters by the TMC. 25 Elections in Krishnanagar constituency were also closely contested, with elections decided by a vote margin of less than 5 percent. The BJP accused the TMC of booth jamming and threatening people not to cast their vote in large parts of the district, including Chapra, Dompukur, and Hatisala areas. 26 The TMC, in contrast, alleged that the BJP was engaging in threats and violence. In Betai village in Tehatta, for example, a TMC worker was beaten, allegedly by the BJP. 27 Accusations of violence between the parties continued after the elections. For example, the TMC was accused of violence against BJP workers and supporters in Elangir town. 28
The above examples indicate that political parties in West Bengal use coercion as a tool for mobilization and demobilization. When intimidation is used to mobilize, it is aimed at voters at risk of defecting in parties’ own strongholds. In contrast, threats to demobilize are aimed at rival party voters and seem to be more common in competitive constituencies. In the following sections, we present the research design and findings that establish these patterns more systematically.
Research Design
The Survey and List Experiment
To measure violent mobilization and demobilization, we embedded a list experiment in a survey whose overall purpose was to obtain information about citizens’ views of and experiences with the 2019 general elections, as well as democracy and governance more broadly. The sample is representative of West Bengal’s population based on the last available census data (2011), and was conducted just after the conclusion of the 2019 general election in collaboration with the Lokniti Program at the Center for the Study of Developing Societies (CSDS). 29 Within West Bengal, we sampled ten districts based on probability proportional to size (PPS). 30 After blocking on rural/urban locations, we used PPS to sample nine locations within each district (wards in urban areas and villages in rural areas). In each location, we interviewed 12 respondents, who were randomly assigned either the control list, the list with the mobilization treatment, or the list with the demobilization treatment. Households within these locations were chosen based on a random walk, and individuals in households based on a simple random selection technique in combination with a 50/50 gender quota. The survey was paper-based and interviews were conducted face-to-face in either Hindi (92 percent) or Bengali (8 percent), depending on the respondents’ preferences. 31 We discuss ethical considerations in the Appendix.
Asking individuals about experiences with coercion during elections is sensitive and likely to be subject to social desirability bias. Admitting to having been threatened to vote for a particular party or not voting at all might be seen as sensitive if respondents believe that compliance to such threats violates norms of democratic and peaceful electoral conduct. 32 We thus leverage a list experiment, also referred to as the item-count technique, that is explicitly designed to reduce social desirability bias (e.g., Blair and Imai 2012; Corstange 2009; Imai 2011; Kuklinski, Cobb, and Gilens 1997). We follow a wealth of studies that have used this technique to elicit truthful answers to sensitive questions and randomly assign individuals to one of three equally sized experimental conditions. The full list of items is included in the Appendix. First, a control group received a list of four experiences that people in West Bengal commonly make during elections, and that are non-sensitive. Second, a treatment group received a list that also included a fifth and sensitive item asking about violent threats to vote for a party or candidate (see Appendix, Box 1, marked bold). Third, a treatment group that received the same list of non-sensitive items, but a different fifth sensitive item asking about threats to refrain from voting. After receiving the list, all respondents are asked to state the number of items they have personally experienced during the election, but not which ones. 33
The list experiment rests on the assumption that individuals understand the anonymity granted by it. Since they only report the number of items they have experienced but not which ones, it is impossible to identify whether they have been exposed to electoral intimidation. 34 Because individuals are randomly assigned to each of the three experimental conditions, we can estimate the proportion of individuals having experienced mobilization and demobilization threats by taking the difference in the average number of items chosen in the control group to the average number of items chosen in each of the two treatment groups. 35
We also include a direct question asking individuals whether they have experienced violent intimidation both for mobilization and demobilization purposes (see Appendix, Box 2), which allows us to further estimate to what extent individuals may hide this experience by comparing the proportion of individuals that report having been threatened in the direct question to the proportion estimated based on the list experiment. To avoid priming respondents, we include the direct question after the list experiment and pose a number of unrelated questions in between (Eady 2017). We provide evidence in the appendix that our list experiment seems to satisfy the underlying assumptions and that there are no major concerns about the random nature of treatment assignment (see section C).
List Experiment Results: Patterns of Voter Coercion
Hypothesis 1 – Prevalence of Violent (de)mobilization, List Experiment.
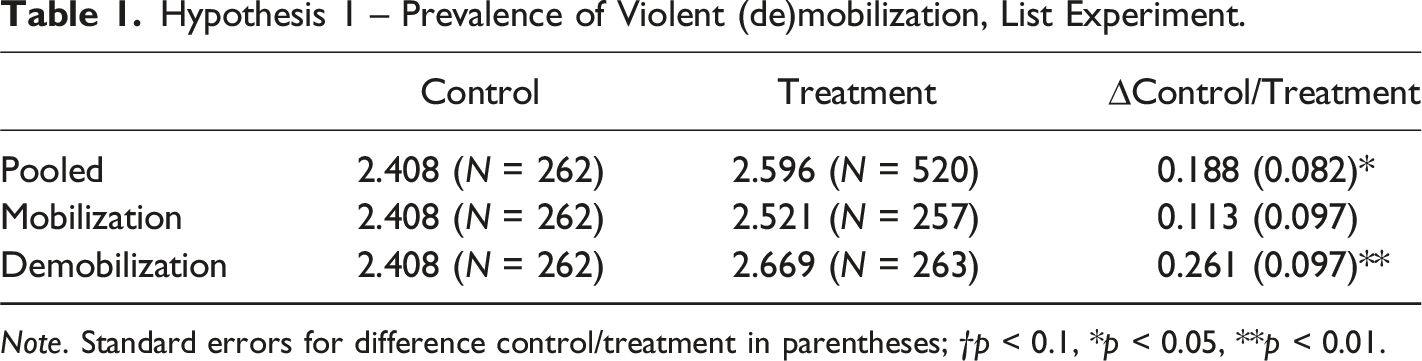
Note. Standard errors for difference control/treatment in parentheses; †p < 0.1, *p < 0.05, **p < 0.01.
To test our first hypothesis, we disaggregate the results by the type of intimidation. In support of our expectation, we find that demobilization threats are much more common than mobilization threats within the electorate in West Bengal. Respondents receiving the demobilization treatment choose, on average, 2.669 items (Table 1), translating into an estimated 26.1 percent of the sample having had experienced threats to refrain from voting. In comparison, only 11.3 percent of respondents experienced threats to vote for a candidate or party. This difference of 14.8 percent points is statistically significant and consistent with our argument that threats of mobilization, in contrast to demobilization, are likely to be more selective and target specific individuals. This indicates that it is used to deter defection and as a tool of in-group policing rather than aiming to sway a large number of voters.
To test hypotheses 2 and 3, we examine how a locality’s electoral geography predicts the risk that individual respondents are being targeted with threats for mobilization versus demobilization purposes. We expect that strongholds experience more mobilization threats, while voters in contested areas experience more demobilization. We anticipate that this argument operates at several geographic levels in West Bengal (Chatterjee and Basu 2020). On the one hand, state-level politicians decide overall campaign strategies—including coercive campaigning—at aggregate levels such as the constituency. On the other hand, politicians rely on local party networks for the implementation of these strategies at the neighborhood or village level. In India and West Bengal, the smallest electoral units are polling stations, and it is well established that parties strategize at aggregate and local levels (Chatterjee and Basu 2020; Jha 2017). 37 We, therefore, anticipate that the competitiveness of constituencies and polling stations affects demobilization and mobilization threats against voters and explore both empirically below.
Parliamentary Constituency Results
We draw on parliamentary constituency data for electoral outcomes from the 2019 election to examine the effect of aggregate electoral geography on respondents’ experiences with threats. For each constituency, we record the difference in vote shares between the winner and the runner-up and use geo-referenced information about survey respondents’ PSU to identify the electoral geography of their locality. 38 We choose to rely on the 2019 election results, cognizant that final vote tallies also be influenced by the patterns of intimidation that we study. The last comparable election results are from 2014, and over this 5-year period, the BJP has gained significantly in political influence in West Bengal and stood as the TMC’s main contender as the elections in 2019 approached. Whereas the 2019 results may be influenced by threats and intimidation, we assume that this impacts vote shares at the margin and that the main locations of electoral dominance and contestation are known to the actors.
We classify a parliamentary constituency as being closely contested if the margin of victory for the party that received the most votes is equal to or below the 25th percentile of the vote margin’s distribution (i.e., =< 6.21 percent). We classify it as a party stronghold if the margin of victory for the party that received the most votes is above the 25th percentile. 39 Here, we differentiate between BJP and TMC strongholds to explore whether the prevalence of violence differs across the incumbent and main opposition parties in West Bengal. As there is no other party besides TMC and BJP that receives a sufficient vote share in a constituency to be classified as a party stronghold, these three variables are mutually exclusive and cover all respondents in our sample. Our sample includes 23 out of West Bengal’s 42 parliamentary constituencies. We classify six as contested, eleven as TMC strongholds, and six as BJP strongholds. This is comparable, though not identical, to the distribution of non-sampled parliamentary constituencies, which include nine contested, four BJP and six TMC strongholds. While not being strictly representative of all of West Bengal’s constituencies, our sample thus provides a relevant cross-section.
Hypotheses 2 & 3 – Subgroup Analysis of Victims of Mobilization and Demobilization, List Experiment.
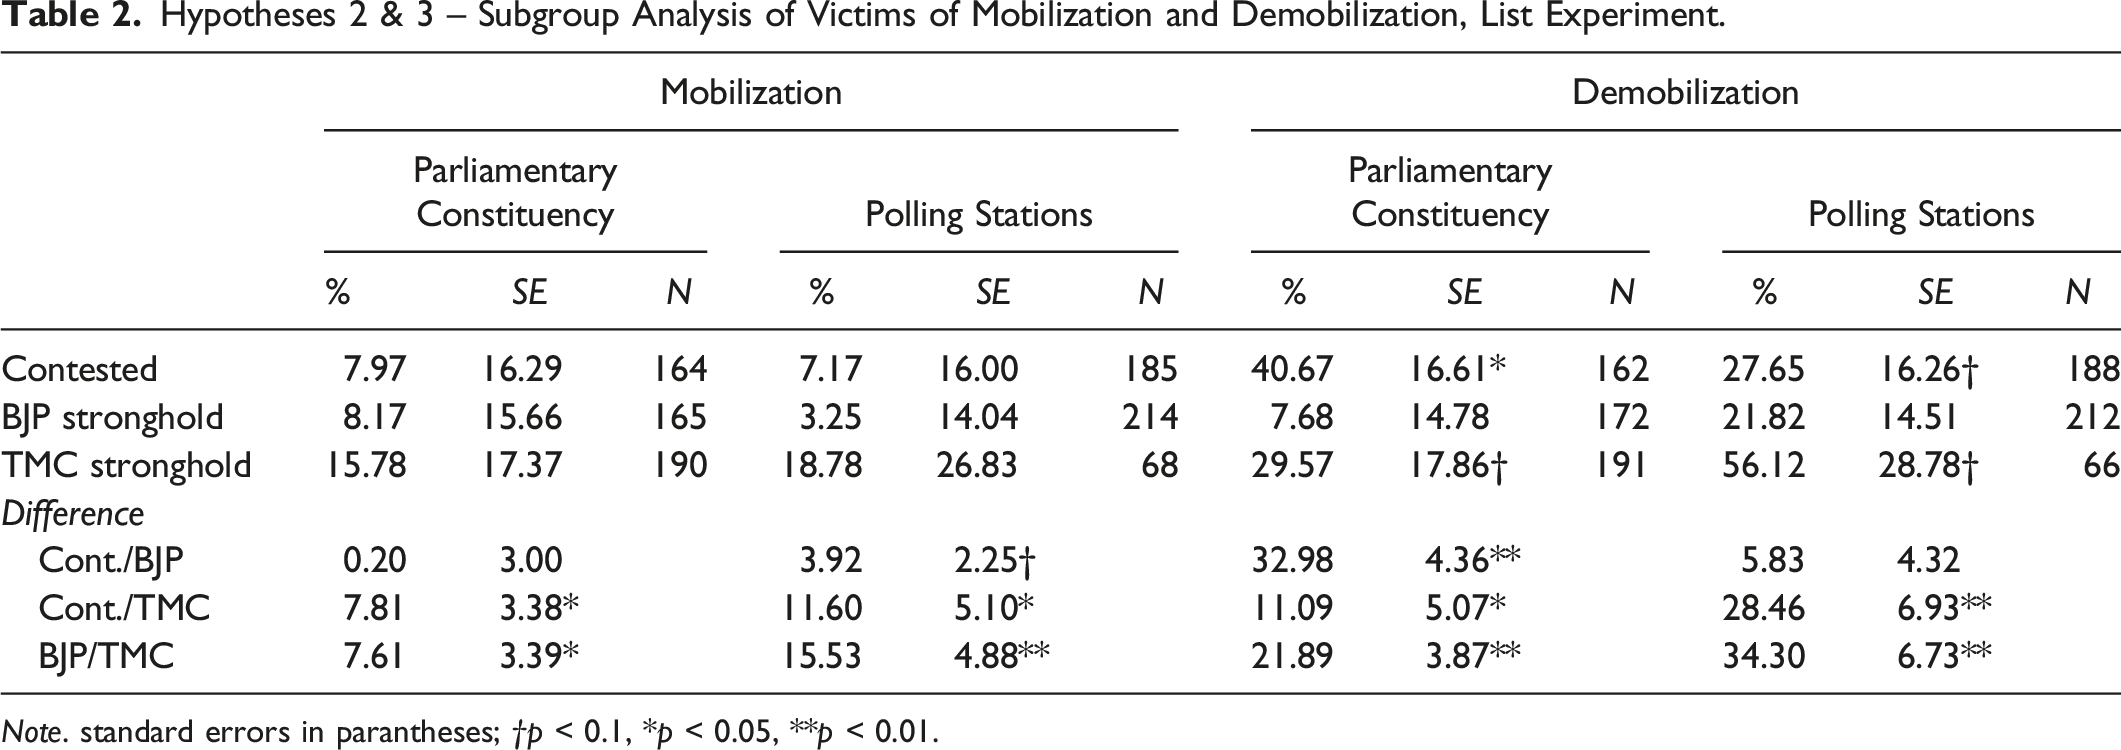
Note. standard errors in parantheses; †p < 0.1, *p < 0.05, **p < 0.01.
Polling Station Results
We draw on 2019 election results at the polling station level to explore how local electoral geography affects targeting with mobilization and demobilization threats. In the 2019 elections in West Bengal, there were approximately 78,000 polling stations of up to 1,500 voters per station. The Election Commission of India publishes polling-station-level results from which we extract data on vote shares and total votes, using these to calculate victory margins for each booth. We link polling stations to respondents in our survey by identifying the five closest polling stations within a 1.7-km radius of each respondent location. We describe data sources and variable construction in detail in the appendix. We classify an area covering the five closest polling stations as a party stronghold if a party has won at least three polling stations with a margin of above the 25th percentile of the vote margins distribution (>11.43 percent). 40 All other areas are coded as closely contested.
Results for mobilization threats are very similar to the parliamentary constituency analysis (Table 2). With 18.78 percent, mobilization threats are most prevalent in the stronghold of the incumbent party (TMC), while the prevalence is much lower in, and statistically different from, both BJP strongholds (3 percent) and contested areas (7 percent). Contested areas also see a much higher prevalence of demobilization threats (27.65 percent) compared to mobilization threats (7 percent), which is comparable to the analysis at the parliamentary constituency level. Yet, different from the more aggregate analysis, we find that the proportion of respondents who report demobilization threats is, with 56.21 percent, the highest in incumbent strongholds. While this is not in line with hypothesis 3, which expected demobilization threats to be most common in contested areas, it might not be surprising, seeing that threats to demobilize voters are, in general, much more common across the electorate in West Bengal (Table 1).
Overall, descriptive results at the parliamentary constituency and polling station level lend support to our theoretical expectations. Threats to mobilize voters are most prevalent in incumbent strongholds, and while demobilization threats also occur in these areas they are much more common than mobilization threats in contested areas. Thus, while demobilization seems to be a useful tool for political actors both in their strongholds and in areas where they face competition, the use of mobilization is much more restricted and predominantly occurs in areas where parties have political control, as well capacities to effectively issue threats and monitor and punish compliance.
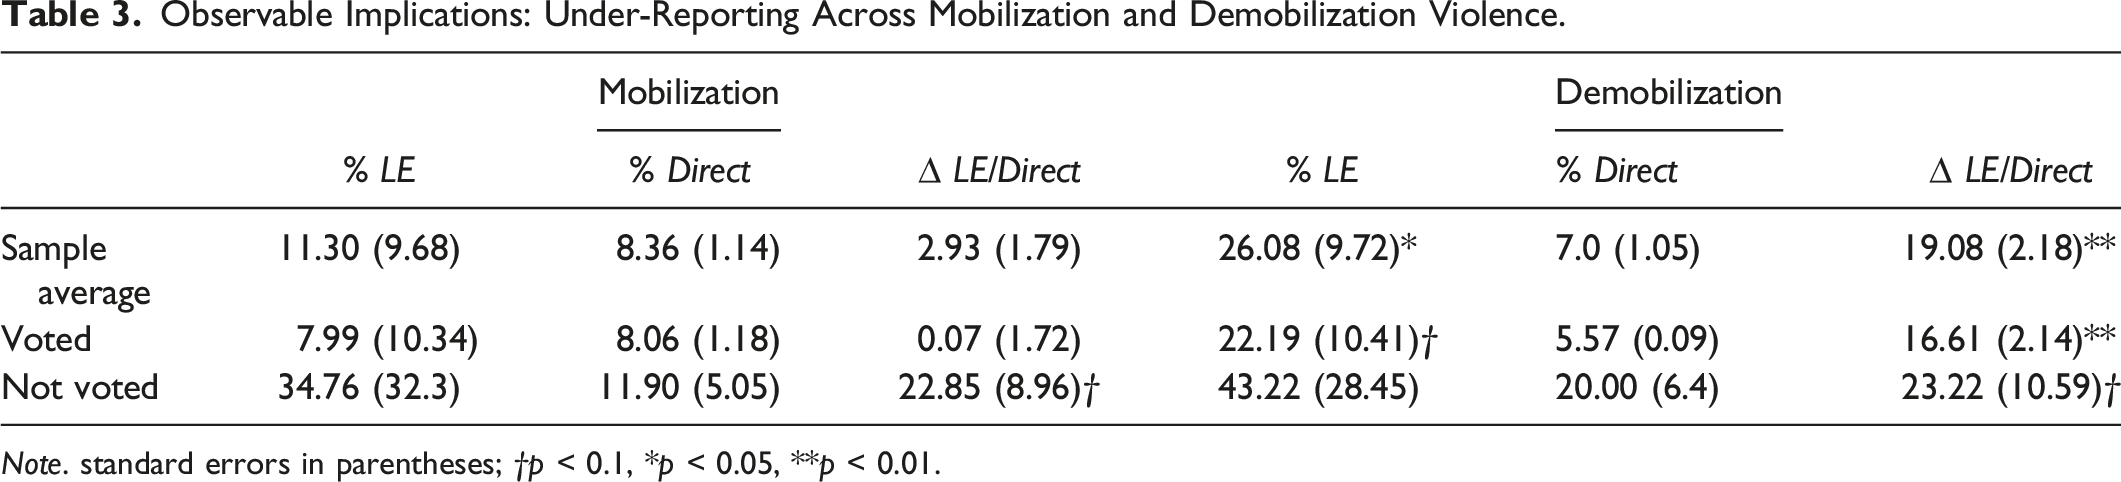
Observable Implications: Under-Reporting Across Mobilization and Demobilization Violence.
Note. standard errors in parentheses; †p < 0.1, *p < 0.05, **p < 0.01.
Conclusion
In this study, we propose a theoretical framework for understanding the micro-foundations of covert forms of election violence. We suggest that intimidation comes in two forms. On the one hand, intimidation is often used to deter citizens from voting and on the other hand, intimidation is also levied to mobilize people to vote for the perpetrating party. Empirically, we combine descriptive evidence on the logic of mobilization and demobilization threats coded from 20 local newspapers with novel data from a list experiment embedded in a post-election survey conducted in the Indian state of West Bengal. This design allows us to study the patterns and frequency of threats to mobilize and demobilize voters within the same electoral contest. We argue that demobilization threats will conform to collective patterns of targeting and thus affect more voters than mobilization threats, which, on the other hand, are more likely to be selective and levied strategically against individual voters. Corroborating this argument in West Bengal, we find that although both strategies were used against voters, the former is much more prevalent and occurs in contested areas, while the latter affects parties’ own strongholds, especially for the incumbent.
We expect to find similar patterns of mobilization and demobilization threats in other contexts, in particular other competitive authoritarian regimes. Elections in West Bengal remain competitive yet are increasingly dominated by the state incumbent party, leading to the uneven playing field typical for hybrid regimes (Levitsky and Way 2002). In power since 2011, the incumbent has the party networks and coercive control necessary for intimidating supporters in its own strongholds, while demobilizing the opposition in competitive areas. Evidence from other competitive authoritarian regimes, particularly those in which coercion remains a common campaign strategy, is suggestive. In Nigeria and Zimbabwe, for example, incumbents rely on coercion and other forms of manipulation to tilt the electoral playing field (Omotola 2010; Turnbull 2021). In both countries, qualitative accounts highlight the incidence of threats against incumbent supporters in their own strongholds (Bratton 2008; LeBas 2006), while quantitative assessments—relying on observational data—show that coercion happens in areas with weaker incumbent control (Daxecker and Rauschenbach 2023; Rauschenbach and Paula 2019). While in need of more systematic study, these patterns are consistent with our findings; moreover, they corroborate the need for micro-level and qualitative data in order to understand the full landscape of political violence. Our findings should thus bear relevance for a range of places and contexts where dominant incumbents have incentives to both keep voters from the ballots, and to force voters to them.
We conclude with two implications for scholarship and policy. First, strategies to mobilize and demobilize voters have to be studied in the same analytical and empirical framework to draw meaningful conclusions. Our study is the first effort to address this gap in our understanding of important assumptions in existing work on the logic of electoral violence. We show that areas commonly expected to experience little violent contention—incumbent strongholds—may very well be coercive electoral contexts where political actors use threats and intimidation to force citizens to vote for them. While our study confirms previous research showing that intimidation to keep people from voting is the dominant form of election violence in West Bengal, it also nuances existing work by showing how a smaller yet sizable part of the electorate is violently mobilized. Our study thus serves as a reminder for those tasked to deal with election violence—e.g., electoral management bodies and observers—that addressing intimidation for mobilization purposes should be seen as a crucial cornerstone in the quest for electoral integrity.
Second, our focus on covert forms of election violence, rather than overt forms that are commonly studied, is important not just for scholars of political violence but also for the study of democratic politics. Threats and intimidation can more easily become part of the repertoire of politics than overt violence, but they have not been subject to the same academic scrutiny. Intimidation may be portrayed as a regular feature of political and social life and become “mainstreamed” (Staniland 2021, 268–269), resulting in the normalization of coercion in both the electoral context and beyond. This may threaten to subvert democracy from within, a problem that concerns many other countries across the world. As such, our findings should be informative for those who seek to understand the micro-foundations of democratic retrenchment.
Supplemental Material
Supplemental Material - Voter Intimidation as a Tool of Mobilization or Demobilization? Evidence from West Bengal, India
Supplemental Material for Voter Intimidation as a Tool of Mobilization or Demobilization? Evidence from West Bengal, India by Ursula Daxecker, Annekatrin Deglow, and Hanne Fjelde in Journal of Conflict Resolution
Footnotes
Declaration of Conflicting Interests
The author(s) declared no potential conflicts of interest with respect to the research, authorship, and/or publication of this article.
Funding
The author(s) disclosed receipt of the following financial support for the research, authorship, and/or publication of this article: European Research Council (852439), Knut och Alice Wallenbergs Stiftelse (2017.0141), and the Royal Swedish Academy of Letters, History and Antiquities.
Data Availability Statement
The replication files for this article are available at: Daxecker, Deglow and Fjelde (2024).
Supplemental Material
Notes
References
Supplementary Material
Please find the following supplemental material available below.
For Open Access articles published under a Creative Commons License, all supplemental material carries the same license as the article it is associated with.
For non-Open Access articles published, all supplemental material carries a non-exclusive license, and permission requests for re-use of supplemental material or any part of supplemental material shall be sent directly to the copyright owner as specified in the copyright notice associated with the article.