
Abstract
This research highlights a neglected paradox of migration policies: whereas narratives on migrants as a security threat in their countries of destination find little support in empirical studies, forcing migrants to return may increase violence and crime back home. Using migrants’ exposure to deportation threats at destination as an exogenous source of identification, this paper traces the long shadow of immigration enforcement on violent crime in Mexico, recipient of more than 3.5 million deportees from the US over the period 2000–2015. Enforced return is associated with more homicides and a stronger presence of cartels in migrants’ municipalities of origin, as well as a higher sense of insecurity among the population and a higher probability of being assaulted. Identifying these local effects of enforced return are a first step towards unpacking the various direct and indirect channels through which immigration enforcement generates unintended negative outcomes in migrants’ communities of origin.
Introduction
Dominant narratives often portray migrants as posing a security threat in their countries of destination. This research takes a different perspective by examining a neglected paradox of migration policies: while narratives on migration as a relevant driver of violence and crime in countries of destination rest on weak empirical grounds (see Abramitzky et al. 2023 for the case of the US), forcing migrants to return may cast a long shadow on their countries of origin in terms of violent crime. The vulnerability of the twice displaced – first as emigrants from their home countries and then as deportees – interacts with the social, economic and institutional conditions they encounter upon return and feeds into local dynamics of violent crime.
Enforcing the return of migrants may generate conflict and violence back home through several direct and indirect mechanisms. These are not mutually exclusive and may reinforce each other. First, upon return, migrants may become victims of the violence they tried to escape, as reported for instance for the case of deportees to Central America (Bender 2019; Human Rights Watch 2020). Second, qualitative research has documented how criminal groups in Mexico specifically target deportees who can easily be coerced into criminal activities due to the economic precariousness and stigma they face upon return (Slack 2019). In contrast to life-cycle models in which migrants decide to return after achieving their savings or human capital targets (e.g. Dustmann 1997), deportees are usually unprepared for their return. As a result, they often lack the human or physical capital necessary for successful labor market integration. In addition to effects on deportees themselves, enforced return may also have negative externalities on local labor markets (Bandiera et al. 2023) and family members (Menjívar, Morris, and Rodríguez 2018). Deportations deprive both families and communities of transnational support systems in the form of migrant remittances, and of access to a migration network. Moreover, deported migrants often return with outstanding debt from having financed migration (Carling and Hernandez Carretero 2008, 410). Overall, forced return potentially adds to social and economic precariousness back home that may heighten the momentum towards crime and violence.
The US–Mexico deportation corridor provides an ideal setting to examine the effect of immigration enforcement on violent crime at origin. The United States deported almost five million migrants between 2000 and 2015, with a peak of almost 440 thousand annual deportations in 2013 (US Department of Homeland Security, various years). Mexico bears the lion’s share of US immigration enforcement: over the years 2000–2015, Mexico received almost 3.5 million deportees, making up 71 percent of all deportations from the United States over the period, equivalent to some 3 percent of its population size of roughly 120 million at the end of this period. 43 percent of the more than 11 million Mexican-born individuals in the US do not have legal residence status and are thus vulnerable to deportation (Gonzalez-Barrera and Krogstad 2019). At the same time, indicators of crime and violence in Mexico are high: in 2020, the country registered close to 30 homicides per 100 thousand persons, compared to an OECD average of 5 (UN Office on Drugs and Crime). Violent crime escalated after then-president Felipe Calderón declared war on the cartels in 2006, driven by the expansion of existing cartels and the formation of new criminal groups as well as an increasing diversification of crime from the narcotics trade towards other criminal activities including oil theft and human trafficking (Beittel 2019). In 2010, Mexico was home to nine major drug trafficking organizations that generated an annual cash flow from the US to Mexico estimated at 19 to 29 billion USD (Department of Homeland Security (DHS) 2010). Homicide rates have increased threefold since the beginning of the century. More than 150,000 murders since 2006 have been attributed to organized crime, in addition to more than 40,000 disappeared Mexicans over the same period (Calderón Laura et al., 2019).
Qualitative post-deportation literature has mainly studied individual trajectories and the difficulties faced by migrants who return against their will or in response to adverse conditions in their host countries (Brotherton and Barrios 2009; De Bree, Davids, and De Haas 2010; Mojica Madrigal 2017; Schuster and Majidi 2013; Silver 2018). However, the broader effect of deportations beyond individual trajectories is relatively scarce. With respect to the link between forced return and violent crime, Blake (2014) and Ambrosius and Leblang (2020) find that the deportation of convicts from the United States is associated with an increase in homicide rates in migrants’ countries of origin. In case studies on El Salvador, Sviatchi (2019) and Kalsi (2018) use the timing of deportations and different degrees of exposure across cohorts to estimate the effect of gang-related violence on education outcomes; and Sviatchi (2022) observes that incarceration rates are higher among those adults that had been exposed to the arrival of deportees during childhood. Ambrosius (2021) traces the contagion of violence along migration corridors between El Salvador and the United States. Finally, Rozo, Anders, and Raphael (2021) identify an increase in violence around repatriation centers in Mexico during years when deportations surged.
Building on this nascent literature on the effect of deportations on violence and crime in migrants’ countries of origin, this paper makes several contributions. First, it extends research on the consequences of deportation policies beyond the Central American case and shows that a systematic causal effect of immigration enforcement on violent crime seems to hold under different settings. While drug cartels are a main driver of violent crime in Mexico, the juvenile gangs that lie behind much of the escalating violence in Northern Central America play a minor role in Mexico. Second, the methodological approach in this paper complements and goes beyond previous studies. Whereas the study by Rozo, Anders, and Raphael (2021) on the case of Mexico focuses on repatriation centers, a first point of arrival for deportees, this paper observes the effect of enforced return in the more than 2,000 Mexican municipalities where migrants actually settled after their return.
To identify a causal effect of forced returns, the identification strategy exploits variation in migrants’ exposure to deportation threats at their destination as a plausibly random source of variation in a shift-share instrumental variable design, combining consular data on the distribution of Mexican migrants across the US territory with information on migration policies implemented at the level of US states. Over the period of study from 2000–2015, two programs were implemented with the intention to facilitate deportations. By means of Secure Communities, local law enforcement agencies shared data with US Immigration and Customs Offices (ICE). Based on this data, ICE then decided to take further immigration enforcement steps. Via the 287(g) Taskforce Agreement program, state and local police officers collaborated with the federal government to enforce federal immigration laws. Their selective and staggered implementation at the level of US states creates variation in migrants’ exposure to deportation risk. Using several alternative indicators of crime and violence from household surveys and municipal level data, the study shows that residents in municipalities whose migrants were more exposed to deportation threats at their destination suffer more homicides, face a stronger likelihood of cartels operating in their municipality, have a higher likelihood of being assaulted, and feel more insecure. These results contrast with those by Bucheli, Fontenla and Waddel (2019) who find that return migration to Mexico reduced violence and improved social indicators, but who ignore the heterogeneity of return conditions.
The rest of the paper is organized as follows: The next section explains and illustrates the key explanatory variable of this research, namely migrants’ exposure to deportation threats at destination. I then explain the empirical strategy and discuss the underlying assumptions, followed by municipal level results and evidence from household level panel data. The final section concludes.
Exposure to Enforcement Policies and Deportation Risk
Figure 1 plots the adoption of two immigration enforcement programs at the US state level over the period 2000 to 2015; Secure Communities and the 287(g) Taskforce Agreement (based on data from Gelatt, Bernstein, and Koball 2017). Both programs were implemented with the goal of facilitating the deportation of migrants. Secure Communities is a federal data-sharing program through which the FBI shares fingerprints it receives from local law enforcement agencies with immigration enforcement agencies for checks against immigration databases. Depending on the results, immigration officials decide whether to take enforcement action, such as issuing a detainer request. States that have a 287(g) Taskforce Agreement in place deputize local law enforcement officers to perform certain federal immigration functions. This policy is based on Section 287(g) of the Immigration and Nationality Act (INA) and includes accessing federal immigration databases so as to facilitate arresting and detaining individuals for suspected immigration violations. The vertical axis shows the share of all states that employed these policies in a given year. Secure Communities ran from 2008–2014 and was mandatory after 2012 before being temporarily abandoned between 2014 and 2017. The task force model ended in 2012. An increase in the share of states that applied these measures over the period 2000 to 2015 coincides with an increasing trend in overall deportations, shown on the right-side vertical axis. Deportations peaked in 2013 at almost 440 thousand in that year. Over the entire 15-year period, more than 4.9 million migrants were deported, 71 percent of whom were Mexican-born (US Department of Homeland Security, various years). State-Level Enforcement Policies and Deportations. The graph shows the share of all states that employed the immigration enforcement policies Secure Communities and 287(g) Task Force Agreements in a given year, as well as total annual deportations (right-side vertical axis). See text for details.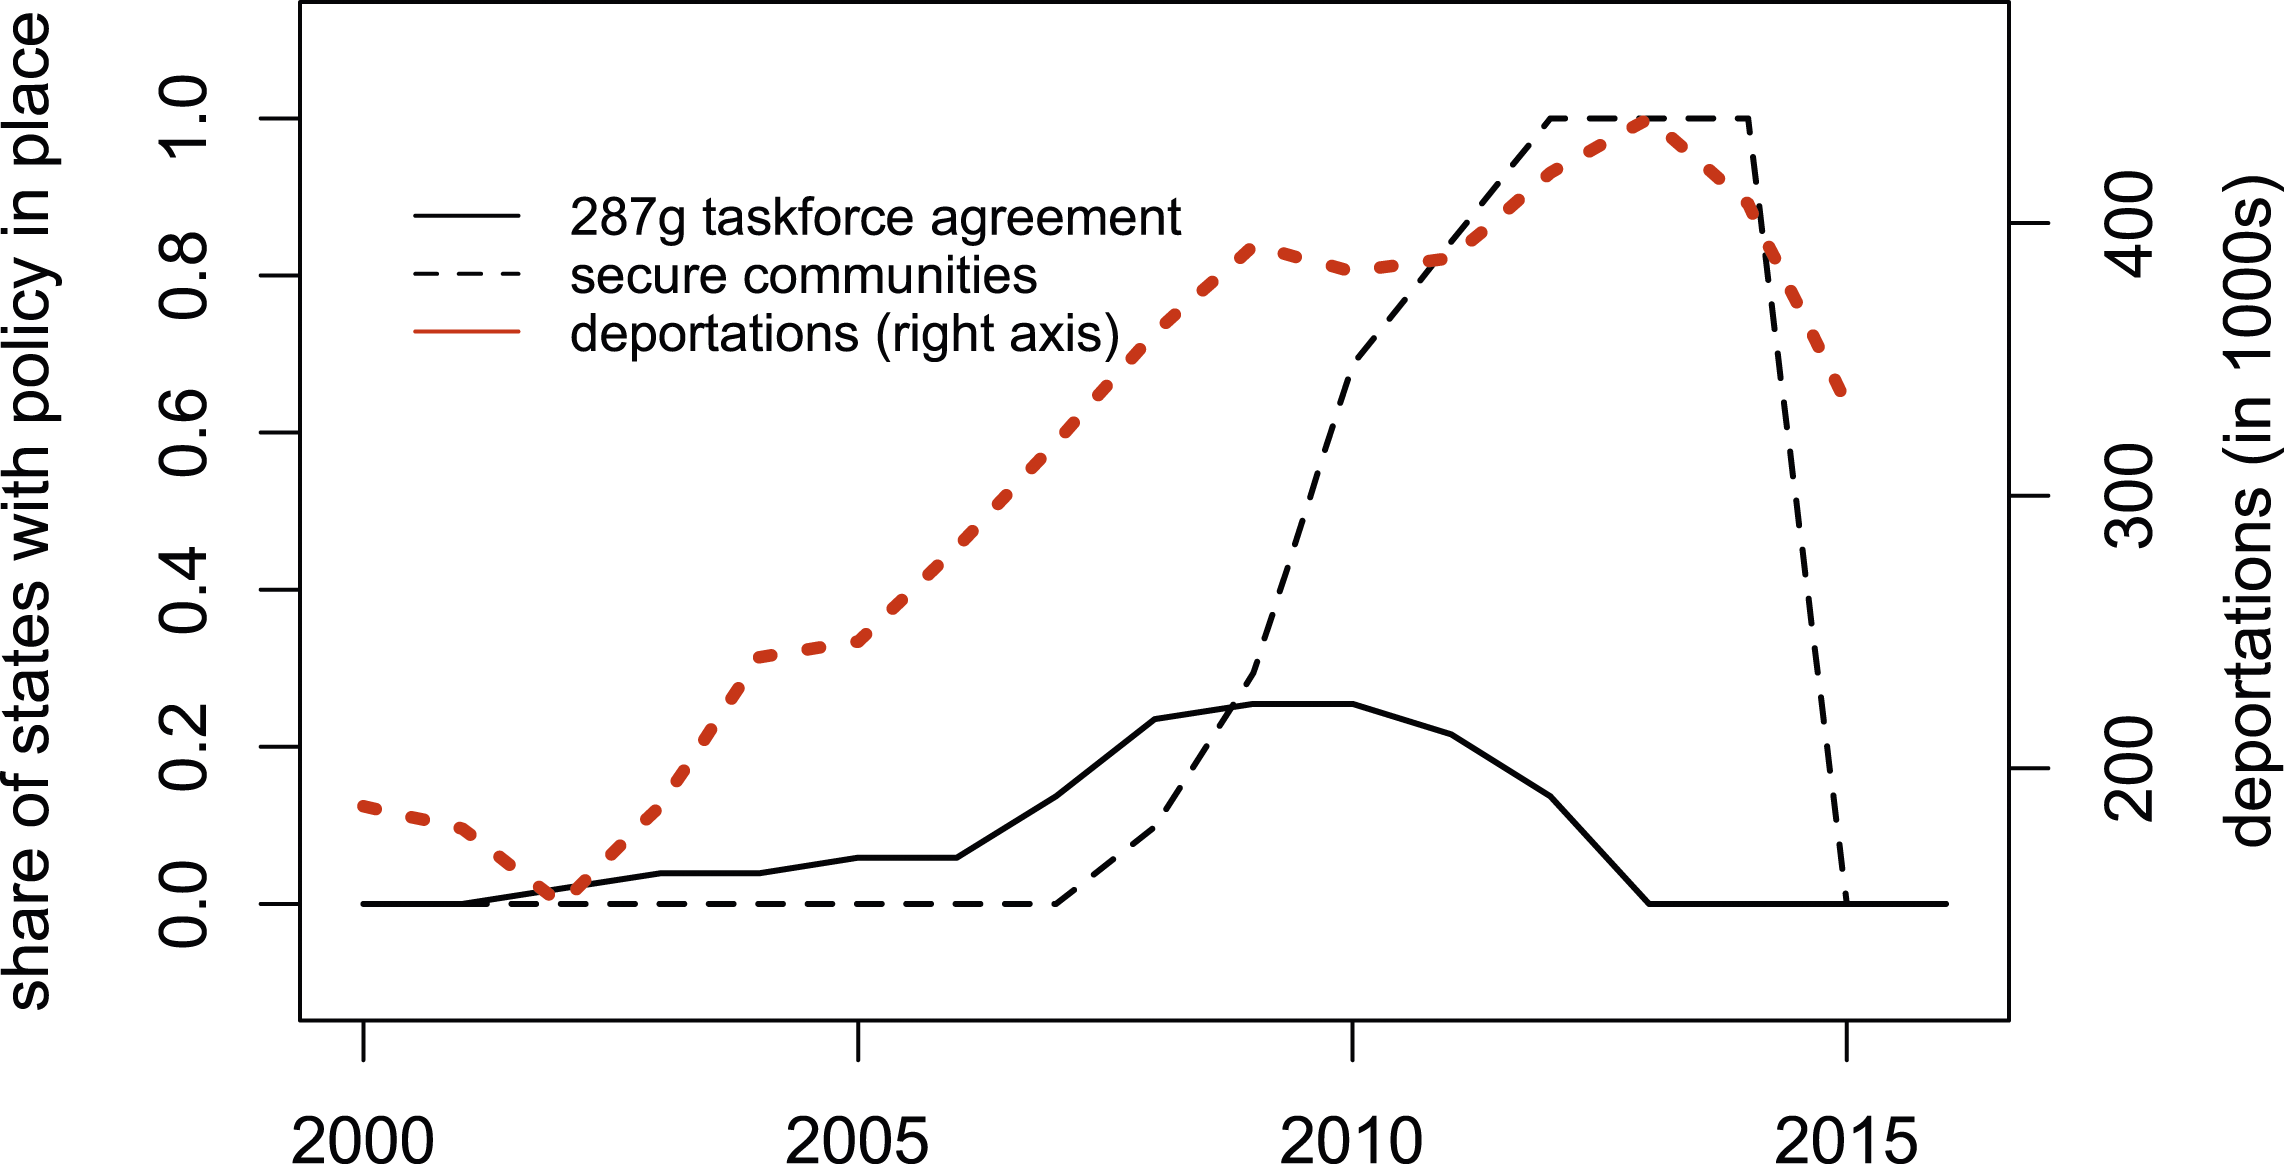
Immigration Enforcement and Annual Deportations at the Level of US States (2003–2015).
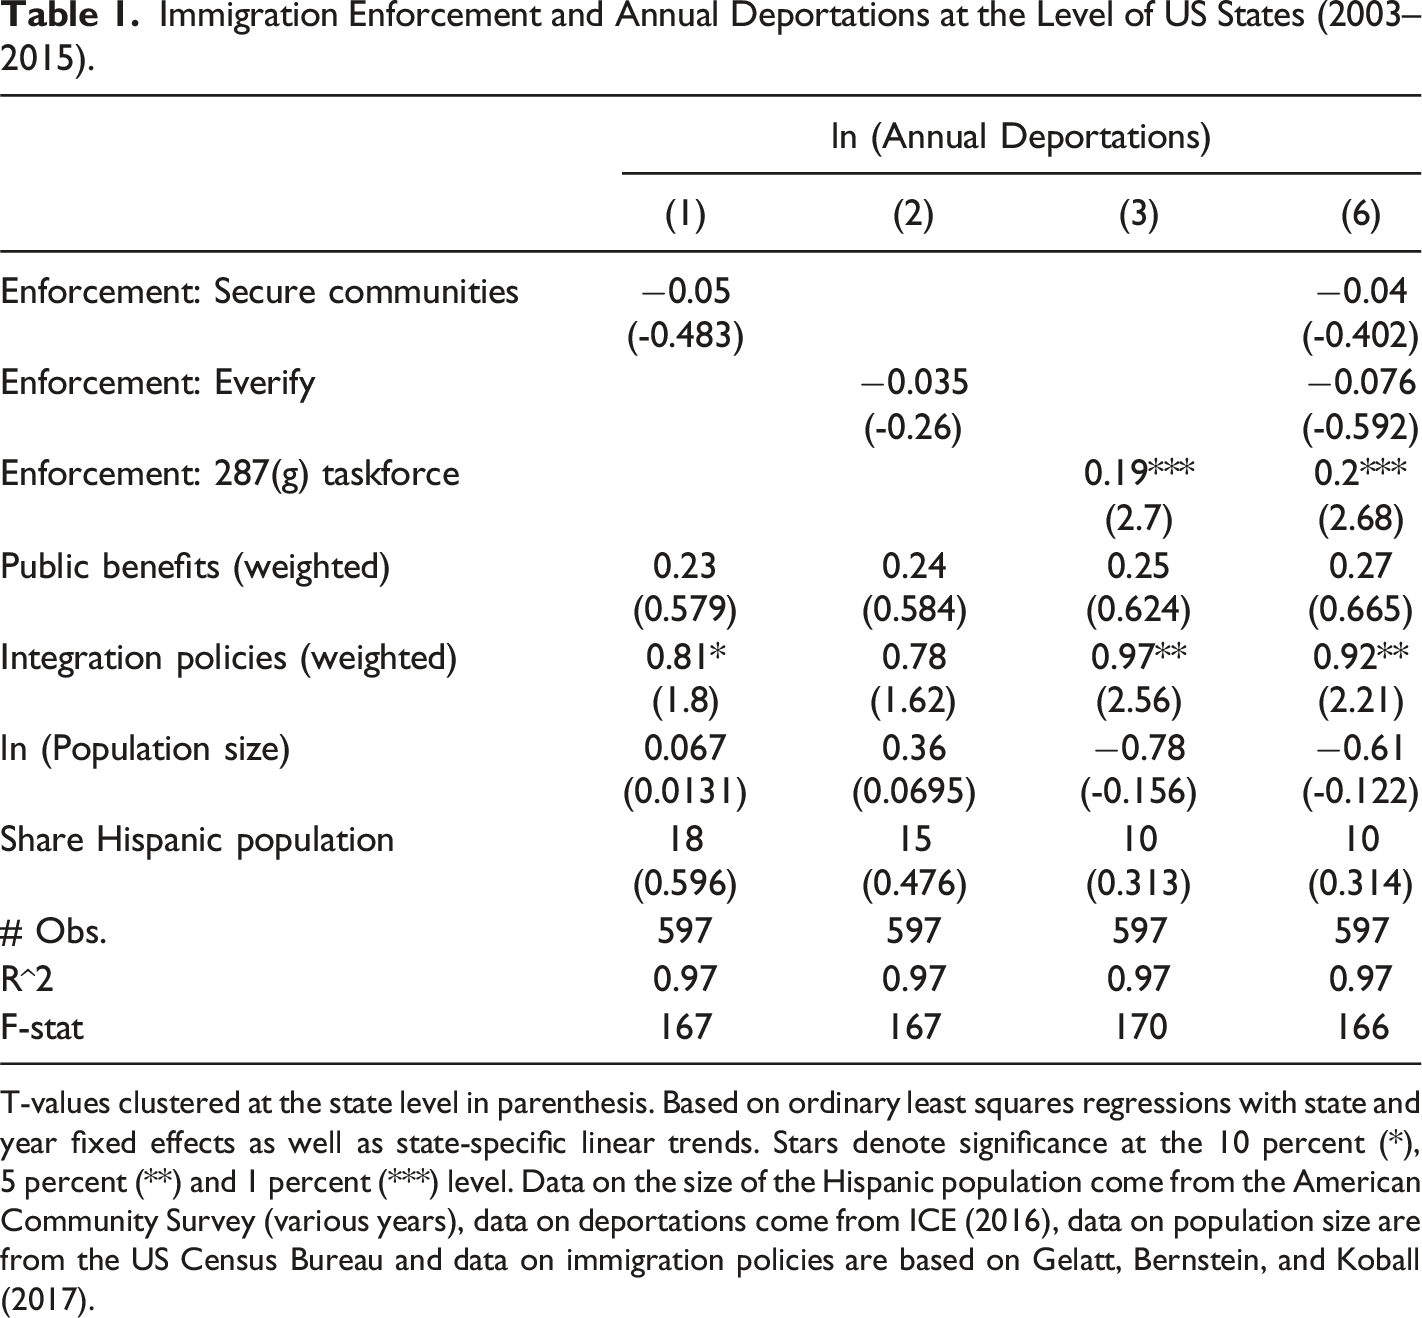
T-values clustered at the state level in parenthesis. Based on ordinary least squares regressions with state and year fixed effects as well as state-specific linear trends. Stars denote significance at the 10 percent (*), 5 percent (**) and 1 percent (***) level. Data on the size of the Hispanic population come from the American Community Survey (various years), data on deportations come from ICE (2016), data on population size are from the US Census Bureau and data on immigration policies are based on Gelatt, Bernstein, and Koball (2017).
In addition to enforcement policies, Table 1 also evaluates two other indicators on migration policies. A first variable aggregates public benefits granted to migrants along three groups of indicators; whether immigrants are beneficiaries of any of several medical aid programs, whether some of them are covered by public health insurance, and whether some kind of program of in-kind or cash transfers is provided to needy families. Most – though not all of them – are targeted towards legal permanent residents (LPR). A second composite variable measures integration policies along five indicators of access to university education, loans and driving licenses for undocumented migrants, among others (see Gelatt, Bernstein, and Koball 2017 and data description in Annex 1). 1
Following previous literature (e.g., Ambrosius 2019; Ambrosius and Meseguer 2020; Bucheli, Fontenla, and Waddell 2019; Caballero, Cadena, and Kovak 2018), migration corridors at the level of Mexican municipalities and US states are estimated using consular documents issued by Mexican Consular Offices in the United States. These so called Mátriculas Consulares de Alta Seguridad facilitate the obtention of driving licenses and loans by undocumented migrants. Because they include information on migrants’ place of residence in the US and their municipalities of birth, the Matriculas provide an opportunity to connect conditions that migrants face at destination with variables at origin. Based on 4.8 million consular documents emitted between 2002 and 2008, exposure to deportation risk is calculated according to the formula
For each Mexican municipality
Estimation Strategy
Studying the local effects of forced return on indicators of violence and crime faces two main challenges. First, population count data at the local level only registers the total number of all returnees. This heterogenous group of returnees includes both deportees and migrants who return voluntarily for a variety of other reasons. Second, regressions of return migration on indicators of violence and crime are likely biased. On the one hand, migrants self-select into their municipalities of residence upon return. Indicators of violence at origin may affect these decisions, either because returnees are reluctant to settle in more violent neighborhoods or because the stigma and exclusion that migrants face upon return may restrict and influence their settlement choices. On the other hand, correlations between return migration and violence could be a sign of reverse causality. For instance, violent neighborhoods expel more migrants (Clemens 2021) which could also cause higher rates of forced return in subsequent periods.
In response to these challenges, this research proposes a two-step strategy in which exposure to deportation risk is used as an instrument for return migration. As a first step, rates of return are predicted as a function of migrants’ average exposure to deportation risk at destination. In the second step, predicted rates of return are used to estimate the effect of (enforced) return on violence and crime in their municipalities of origin. At the core of the identification strategy lies the idea that the staggered and unequal implementation of enforcement policies across US states created variation in terms of migrants’ exposure to deportation threats, depending on historic migration networks that connect origin municipalities and destination states. If migrants happen to live in US states that tighten their immigration enforcement policies, their deportation risk increases, and this is expected to affect conditions in their municipalities of origin. Figure 2 illustrates the identification setup for a reduced form relationship of migrants’ exposure to deportation threat at destination and violence in their municipalities of origin. Grey shades indicate municipalities’ exposure to the implementation of the 287(g) Taskforce Agreement in US states where migrants reside (left axis). 50 percent of municipalities fall within the dark grey area, and 95 percent of municipalities fall within the light grey area. The median value in the year of highest exposure (2017) was 0.22. Lines compare average homicide rates (right axis) for two groups of municipalities: Municipalities drawn in blue had an exposure above 0.54 at least once, equivalent to 10 percent of the most exposed municipalities in 2007. Dark lines depict average homicide rates for all others. Prior to exposure, both groups shared similar trends. While overall violence rose after the mid-2000s, the increase was more pronounced among municipalities whose migrants were more exposed to the adoption of 287(g) Taskforce Agreements. This suggests that deportation threats may have added “fuel to fire” in a context of spiraling violence in Mexico. Trends in Violence, Pre- and Post-Exposure to 287(g) Task Force Agreements. The blue lines show average trends in homicide rates (right axis) in municipalities who had a rate of exposure to 287(g) Task Force Agreement above a value of 0.54 at least once, compared to all others (black lines). The left axis depicts trends in average exposure rates. 95 percent of municipalities fall within the grey areas, and 50 percent of municipalities fall within the dark grey area.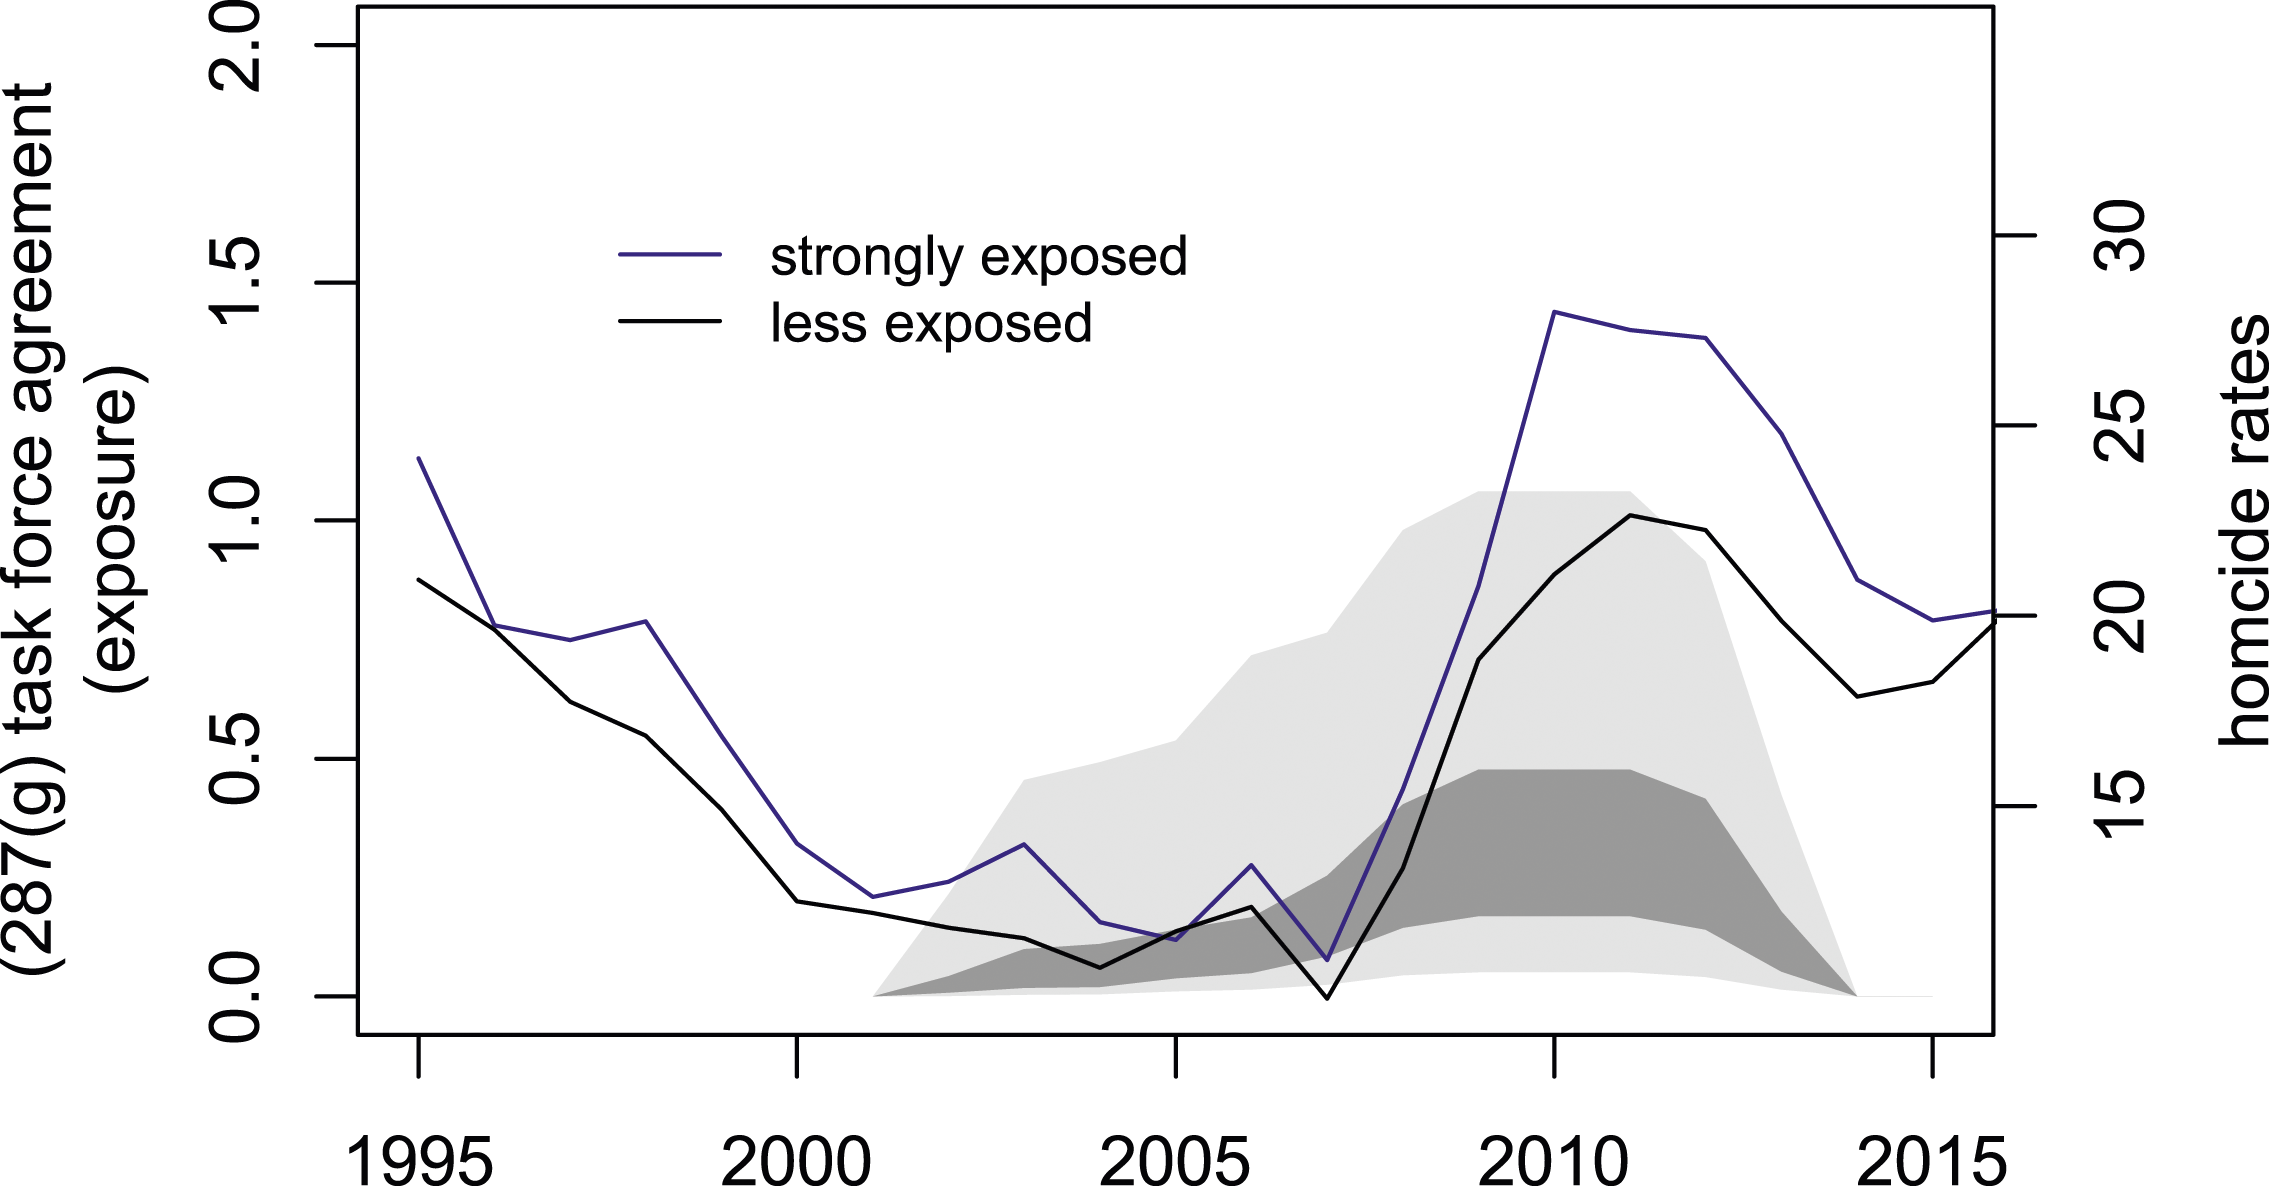
Using migrants’ exposure to deportation threats as a source of identification has two benefits: First, it allows to identify those who returned in response to deportation threats among the larger pool of returnees. This group includes actual deportees but also migrants who returned, for example, in anticipation of a deportation order and those who follow other deported family members (see Masferrer, Hamilton, and Denier 2019 for the case of minors with US citizenship). Second, the instrumental variable exploits quasi-random variation in terms of migrants’ exposure to deportation risk at destination and therefore allows to estimate plausibly causal effects of deportation threats on violence and crime in Mexico.
Exposure to enforcement policies at the level of US states can be seen as part of a larger family of shift share (“Bartik”) instruments, that use shares or weighting variables in order to create variation by units (Bartik 1991; cp. Goldsmith-Pinkham, Sorkin, and Swift 2020). The shifting variable in this case derives from short-term changes in policies at the level of US states. The share variable is defined via historically grown migration corridors that create spatial variation in terms of migrant’s distribution across the US. Formally, the two step regressions are implemented using the following formulas:

In the first equation (equation (2)),
Deportation Risk in equation (2) is the instrument that captures migrants’ exposure to the two indicators of state-level policies intended to facilitate the deportation of migrants, as described in the previous section, Secure Communities and 287(g) Task Force Agreements.
The second step of the regression (equation (3)) estimates the effect of predicted return on indicators of crime.
Crime is measured using two alternative indicators at the level of municipalities. The main institutions of organized crime in Mexico are drug cartels. Based on data from Coscia and Ríos (2012), a first indicator measures whether cartels are operating in the municipality in year
Model Assumptions
The two-stage approach builds on two assumptions: First, the first step correctly identifies those who return in response to deportation threats from within a larger pool of returnees. Second, the instruments fulfill the exclusion restriction; that is, they are assigned quasi-randomly with respect to the outcome variables in the second step (crime and violence).
With respect to the first assumption, the identification strategy relies on separating those who return as the result of an exogenous enforcement shock from others who return as a deliberate choice of life-cycle optimization strategies. This assumption would be violated if policies that affect voluntary return decisions were correlated with deportation threats. For instance, unemployment increases may lead to higher rates of voluntary return among migrants who face job loss and adapt their life-cycle strategies, but they may also cause a stricter application of enforcement policies. To take such possible confounders into account in the first step, the regressions control for three additional destination country variables. An indicator of the change in unemployment rates over the previous 3 years captures changes in economic conditions faced by migrants, using data from the US Bureau of Labor Market Statistics (2021). Two indicators – the same indicators that are included in Table 1 – capture other migration policies defined at the level of US states: a composite indicator on the granting of social benefits to immigrants (whether they are beneficiaries of medical aid; whether they are covered by public health insurance; and whether they are considered for in-kind or cash transfer programs), and a composite indicator of integration policies (access by undocumented migrants to higher education, loans, and driving licenses, among others). 4 All these variables are measured as exposure variables using the weighting formula from equation (1) that was applied to the variables of immigration enforcement.
The second assumption (exogeneity of the instruments) can be thought of as having two distinct elements. First, the treatment variable (deportation threats) is quasi-random; and second, the postulated effect operates via enforced migration and not through other variables that are correlated with treatment assignment. Regarding the former, this paper builds on the framework on shift-share instruments as laid out by Borusyak et al. (2021), where exogenous variation comes from the “shifts” rather than from the “shares” (see Goldsmith-Pinkham, Sorkin, and Swift 2020 for a discussion of the classic setup that relies on exogeneity in the shares). The weighting variable calculated from migration corridors provides the shares that are used to map enforcement policies to migrants’ communities of origin. Because migration corridors are defined before the policy changes, the instrument should not be affected by short-term sorting of migrants into destinations, in particular the possibility that migrants may avoid states that employ more hostile policies. 5 Institutional legacies, geographical variables such as closeness to the border and other time-constant variables are captured through country fixed effects. Quasi-randomness therefore resides in the identifying assumption that migration policy decisions at the level of US states where migrants reside – the shifts – is exogenous with respect to subsequent trends in violence or emigration rates in migrants’ municipalities of origin. This assumption holds if enforcement policies are not anticipating trends in migrants’ communities of origin; and as long as they are not related to a third unobserved variable that affects both enforcement policies and violence in migrants’ communities of origin. Placebo regressions of leading values for the instrument assuage concerns about reverse causalities, for instance the possibility that higher violence leads to more migration, and that more migration then translate into more deportations. Only past exposure to deportation risk should increase present rates of violent crime, but not vice versa. Online Appendix 7 evaluates whether enforcement policies respond to an increase in crime rates in the US. This could be a source of concern, for instance, if transnational organized crime affects both destination and origin communities at the same time. There is no evidence for overall crime affecting the probability of stricter enforcement. Among specific indicators, the most serious offenses - murder, rape and aggravated assault – have a negative sign. Only robberies are correlated with a higher likelihood of adoption. This is in line with assessments in the literature that immigration enforcement responds primarily to domestic constraints such as the availability of policing resources (Jaeger 2016) or strategic interaction between federal and local actors (Ciancio and García-Jimeno 2019). It is unlikely that these are related to trends in violent crime in migrants’ communities of origin.
With respect to the second element of the exclusion restriction, a stronger exposure to deportation threats is likely to affect conditions back home through other channels too, not only via the forced return of migrants. For instance, enforced return may be accompanied by a drop in remittances or by lower rates of out-migration because deportations signal more difficult conditions at destination to potential migrants. Concerns about these alternative channels are addressed by including several time-varying variables measured at the level of Mexican municipalities that could be related to violence and crime. The Human Development Indicator at the municipal level is used as an indicator of socioeconomic conditions (PNUD 2014). Per capita public spending at the municipal level (INEGI 2021) is used as additional indicator of economic conditions. The share of the population aged between 15 and 29 years and male-to-female gender ratios are included as demographic controls. The log of population size is used as an indicator of changes in population size and density (INEGI 2021). See Online Appendix 1 for a description of these variables and their sources.
Although the inclusion of a battery of control variables mitigates concerns about omitted variable bias related to alternative mechanisms, some relevant variables may remain unobserved. In particular, remittances and out-migration cannot be directly controlled for. 6 The interpretation and discussion of empirical patterns take into account the possible existence of alternative mechanisms that may come together with enforced return. For this reason, the regression results below put a main emphasis on reduced form regressions, that is, the direct effect of the instruments on violence and crime. Whereas enforced return is a main observable mechanism, reduced form coefficients capture other mechanisms too.
Effects of Enforced Return on Violent Crime in Mexico: Municipal Level Results
Exposure to Deportation Threats and Violent Crime. Reduced Form Regressions: Bi-Annual Panel.
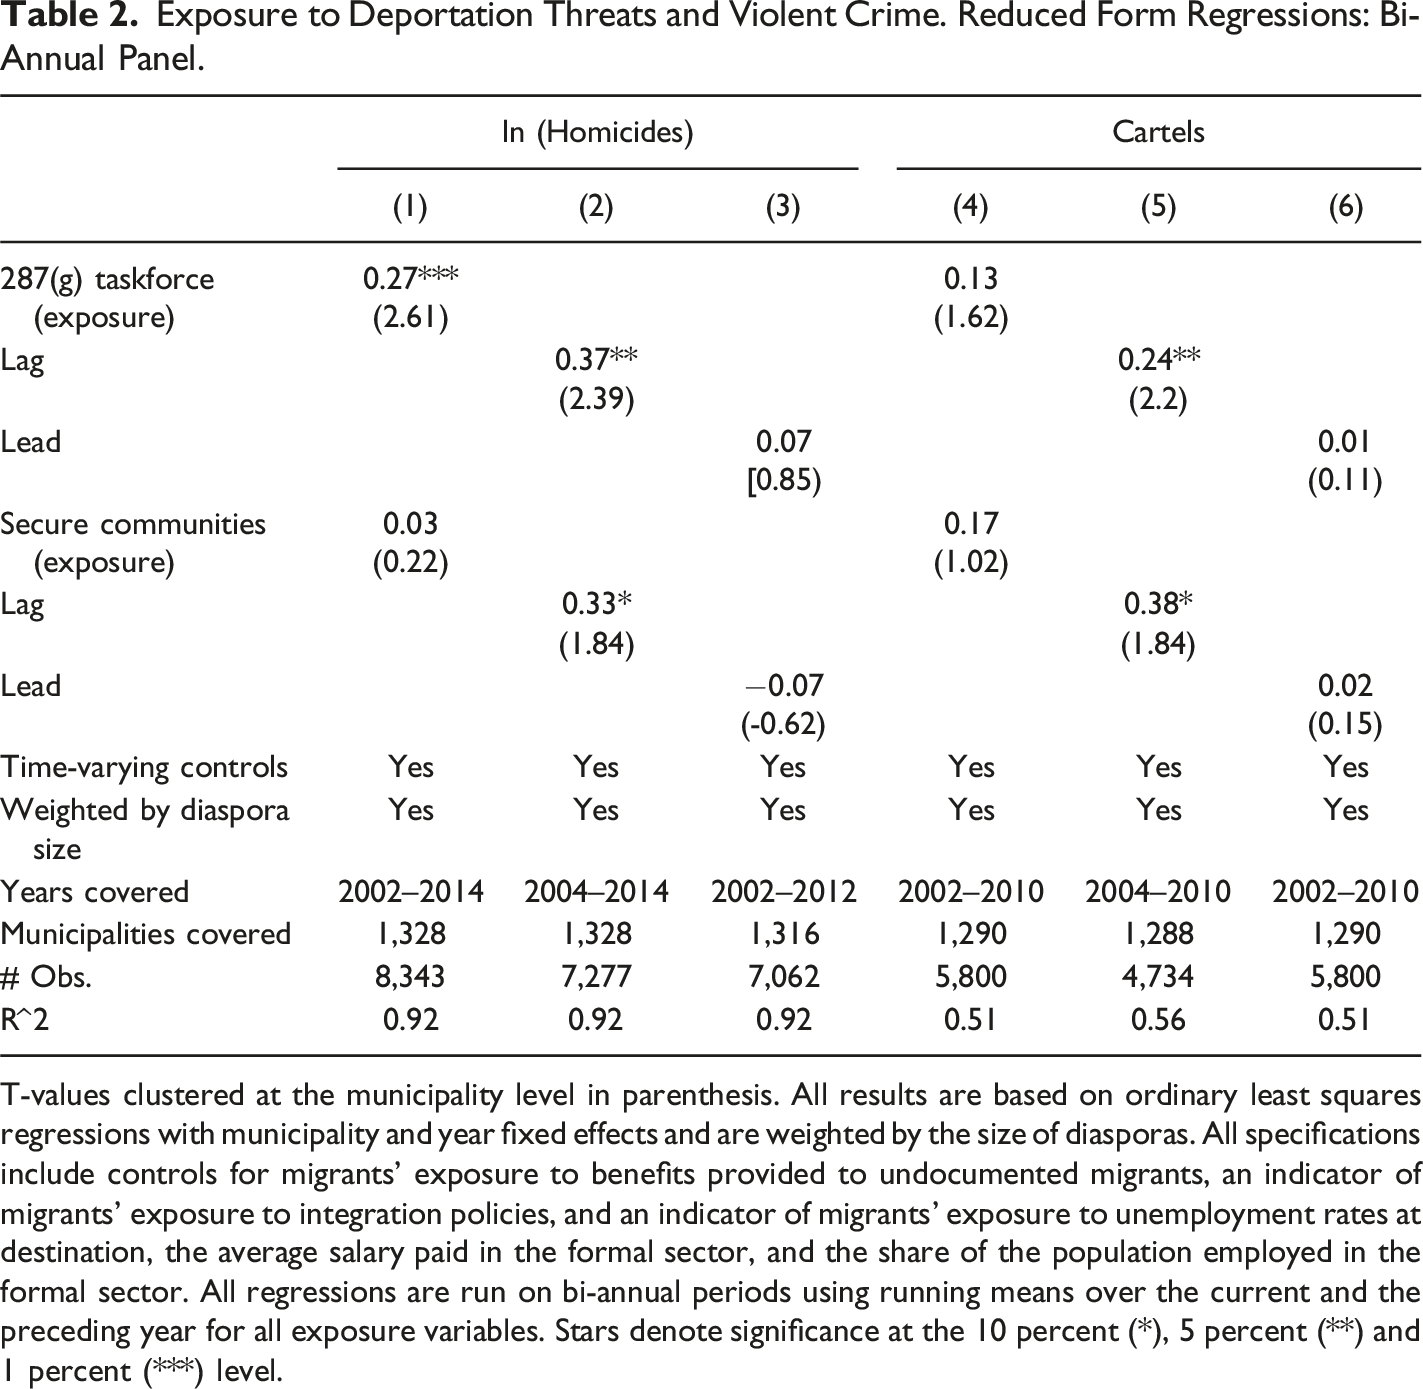
T-values clustered at the municipality level in parenthesis. All results are based on ordinary least squares regressions with municipality and year fixed effects and are weighted by the size of diasporas. All specifications include controls for migrants’ exposure to benefits provided to undocumented migrants, an indicator of migrants’ exposure to integration policies, and an indicator of migrants’ exposure to unemployment rates at destination, the average salary paid in the formal sector, and the share of the population employed in the formal sector. All regressions are run on bi-annual periods using running means over the current and the preceding year for all exposure variables. Stars denote significance at the 10 percent (*), 5 percent (**) and 1 percent (***) level.
The coefficients in Table 2 were estimated using ordinary least squares for up to 1,328 municipalities with available data and for which migration corridors are defined (i.e., all municipalities of birth whose migrants requested consular documents between 2000 and 2008). All specifications include municipality and year fixed effects and are weighted by the size of migrant populations abroad, proxied by the aggregated sum of consular documents requested by migrants originating in municipality
Several messages can be obtained from Table 2. First, exposure to the 287(g) Taskforce Agreement has a consistent and strong effect on violence back home. In Column 1, an exposure rate of 1 corresponding roughly to the 5 percent of the most exposed municipalities in 2007 on a scale from 0 to 2 is associated with a ≈ 27 percent increase in homicides; and an exposure rate of 0.5 - comparable to the blue line in Figure 2 – is associated with a ≈ 13 percent increase in homicides. This effect is even larger for the lagged effect in Column 2 (≈ 37 percent and ≈ 17 percent respectively). In contrast, the effect of exposure to Secure Communities on violence is less robust, and (weakly) statistically significant only for the lagged effect in Column 2. This observation is consistent with regressions at the level of US states in Table 2. Apparently, the adoption of Secure Communities – when measured at the level of US states - did not have the same clearly identified effect on either deportations or on violence as observed for exposure to the 287(g) Taskforce Agreement. The likely reason is that states had discretion over its adoption only during a few years, and that its actual implementation – irrespective of formal adoption – was not uniform across states. This makes Secure Communities less suitable for the estimation of a treatment effect. The following tables therefore rely on exposure to the 287(g) Taskforce Agreement in order to estimate plausibly causal effects. Finally, Table 2 also reveals that while lagged effects of deportation threats seem to be important, the leading values are statistically insignificant and close to zero. This adds support to the assumption that causality indeed runs from deportation threats to violence and not vice versa. The same regressions are run on the likelihood of cartel presence in Columns 3 to 5. Patterns are consistent with regressions on homicide rates. However, due to fewer observations and a relatively crude (binary) measure of cartel activity, the effect is statistically significant only for lagged exposure to the task force agreement. 7
Migrants’ Exposure to Deportation Threats and Rates of Return to Mexico. First Step Results.
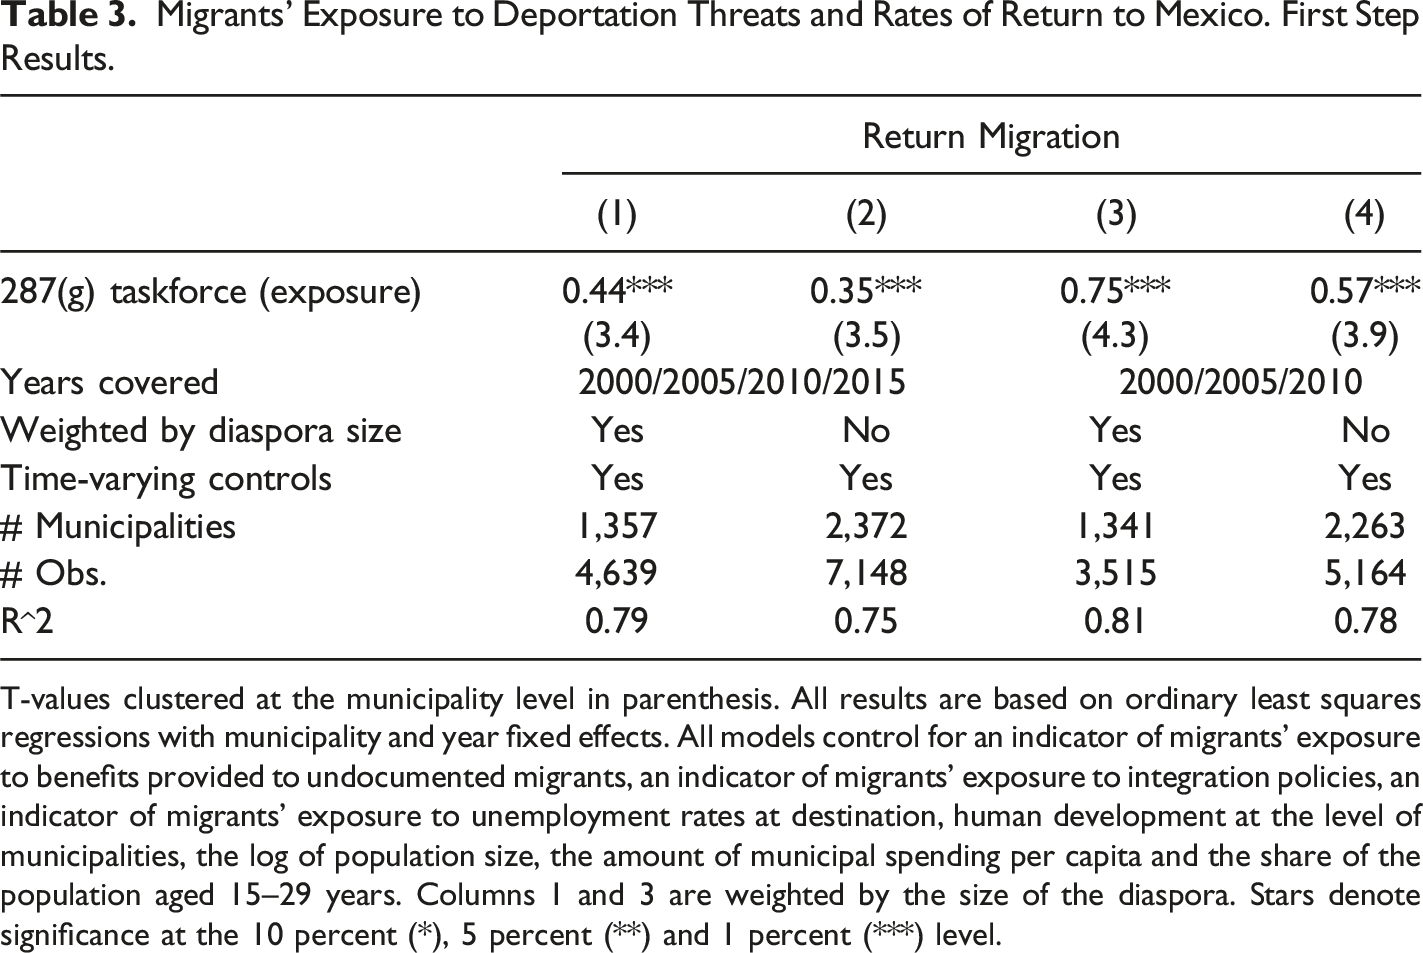
T-values clustered at the municipality level in parenthesis. All results are based on ordinary least squares regressions with municipality and year fixed effects. All models control for an indicator of migrants’ exposure to benefits provided to undocumented migrants, an indicator of migrants’ exposure to integration policies, an indicator of migrants’ exposure to unemployment rates at destination, human development at the level of municipalities, the log of population size, the amount of municipal spending per capita and the share of the population aged 15–29 years. Columns 1 and 3 are weighted by the size of the diaspora. Stars denote significance at the 10 percent (*), 5 percent (**) and 1 percent (***) level.
Effect of Enforced Return on Homicide Rates and Presence of Cartels. Instrumented Results.
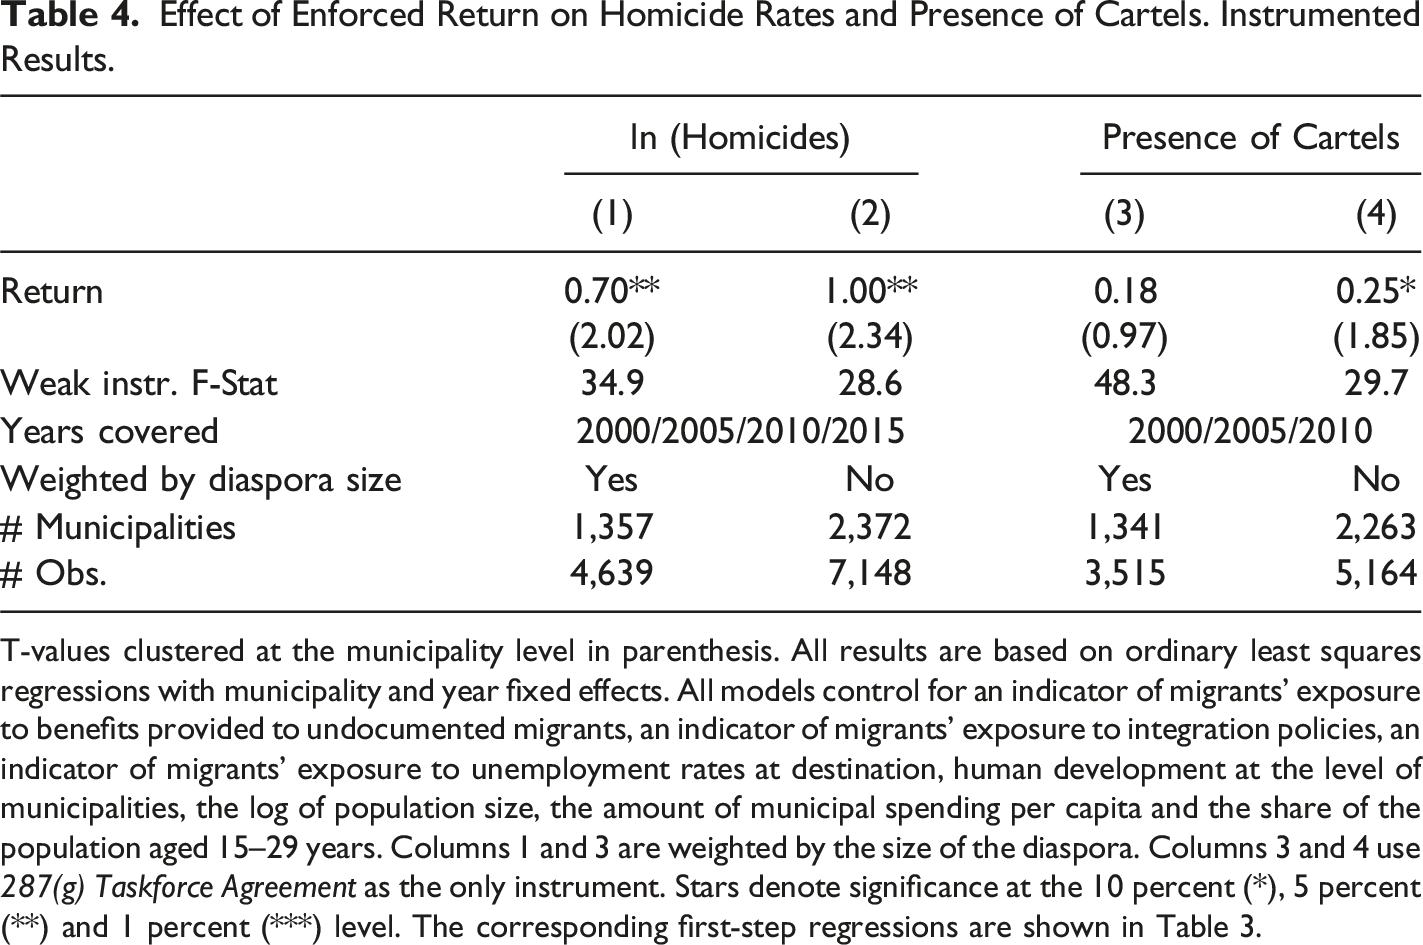
T-values clustered at the municipality level in parenthesis. All results are based on ordinary least squares regressions with municipality and year fixed effects. All models control for an indicator of migrants’ exposure to benefits provided to undocumented migrants, an indicator of migrants’ exposure to integration policies, an indicator of migrants’ exposure to unemployment rates at destination, human development at the level of municipalities, the log of population size, the amount of municipal spending per capita and the share of the population aged 15–29 years. Columns 1 and 3 are weighted by the size of the diaspora. Columns 3 and 4 use 287(g) Taskforce Agreement as the only instrument. Stars denote significance at the 10 percent (*), 5 percent (**) and 1 percent (***) level. The corresponding first-step regressions are shown in Table 3.
Taken together, these models indicate that deportation threats cast a long shadow on migrants’ municipalities of origin via increases in violent crime, and that the effect is sizable. The instrumental variable estimates suggest that this effect operates via enforced return, although this does not exclude the possibility that deportation threats may also affect violence and crime through other mechanisms we are not able to observe (e.g., drops in remittances and lower rates of out-migration). The Online Appendix 10 explores some of these potential mechanisms. As suspected, a larger exposure to deportation threats is associated with fewer remittances and worse outcomes in terms of human development, whereas no effect on labor market indicators is observed. 10
Coefficients for OLS regressions without using instruments are shown in Online Appendix 11. Coefficients for return migration have the opposite sign to those in Table 4 and are statistically nonsignificant. This is likely the consequence of two effects. First, returnees are expected to self-select into less violent neighborhoods. Both effects bias the coefficient for return migration in the un-instrumented regressions downwards. Second, the group of returnees in regressions without instruments includes different types of returnees, both voluntary and involuntary. A crime-increasing effect is only expected for those who return as the result of enforcement policies, not for those who return voluntarily. Due to different selection patterns as well as because of an exogenous interruption of consumption smoothing over the life cycle, both groups are expected to differ in terms of their impact back home. The lack of distinction between voluntary and enforced return may also explain why Bucheli, Fontenla, and Waddell (2019) observe a positive effect of return migration on the security situation in Mexico.
Household Level Analysis: Perceptions of Violence and Crime
In addition to the municipal-level analysis, the effect of exposure to deportation threats is estimated on a panel of 5,010 Mexican households from the multi-thematic Mexican Family Life Survey MxFLS. The more fine-grained indicators at the household level allow a more nuanced picture to be drawn of how enforced return affects experiences of crime and violence on other dimensions. Moreover, survey data has the advantage of not being affected by the reporting bias that makes aggregate administrative data on reported crime often unreliable. The fact that the same households were interviewed in both survey rounds allows controlling for unobserved household heterogeneity using household fixed effects and measuring changes in the perception of violence and victimization as a result of deportation threats. The MxFLS is a nationally representative survey that follows the original households for up to three waves, originally scheduled for the years 2002, 2005, and 2009. The two survey rounds in 2005/2006 (MxFLS-2) and another survey round undertaken between 2009 and 2012 (MxFLS-3) cover the period of increasing violence as well as the rise in deportations that occurred over these years. The MxFLS was sampled from 150 localities situated in 150 different municipalities across the country which permits crossing survey data with the municipal-level indicator on migrants’ exposure to deportation threats. Results at the household level are provided for the reduced form only: For one, population count data to measure rates of return in 2005 and 2010 do not exactly match survey years that were stretched over several years in the case of the last survey round. Second, variation at the municipal level comes from 150 locations only. This leaves first step regressions below critical threshold for weak instruments.
The following regressions are estimated at the household level:
The variable
Effect of Enforced Return on Household Level Perceptions of Safety and Likelihood of Assault. Reduced Form Regressions.
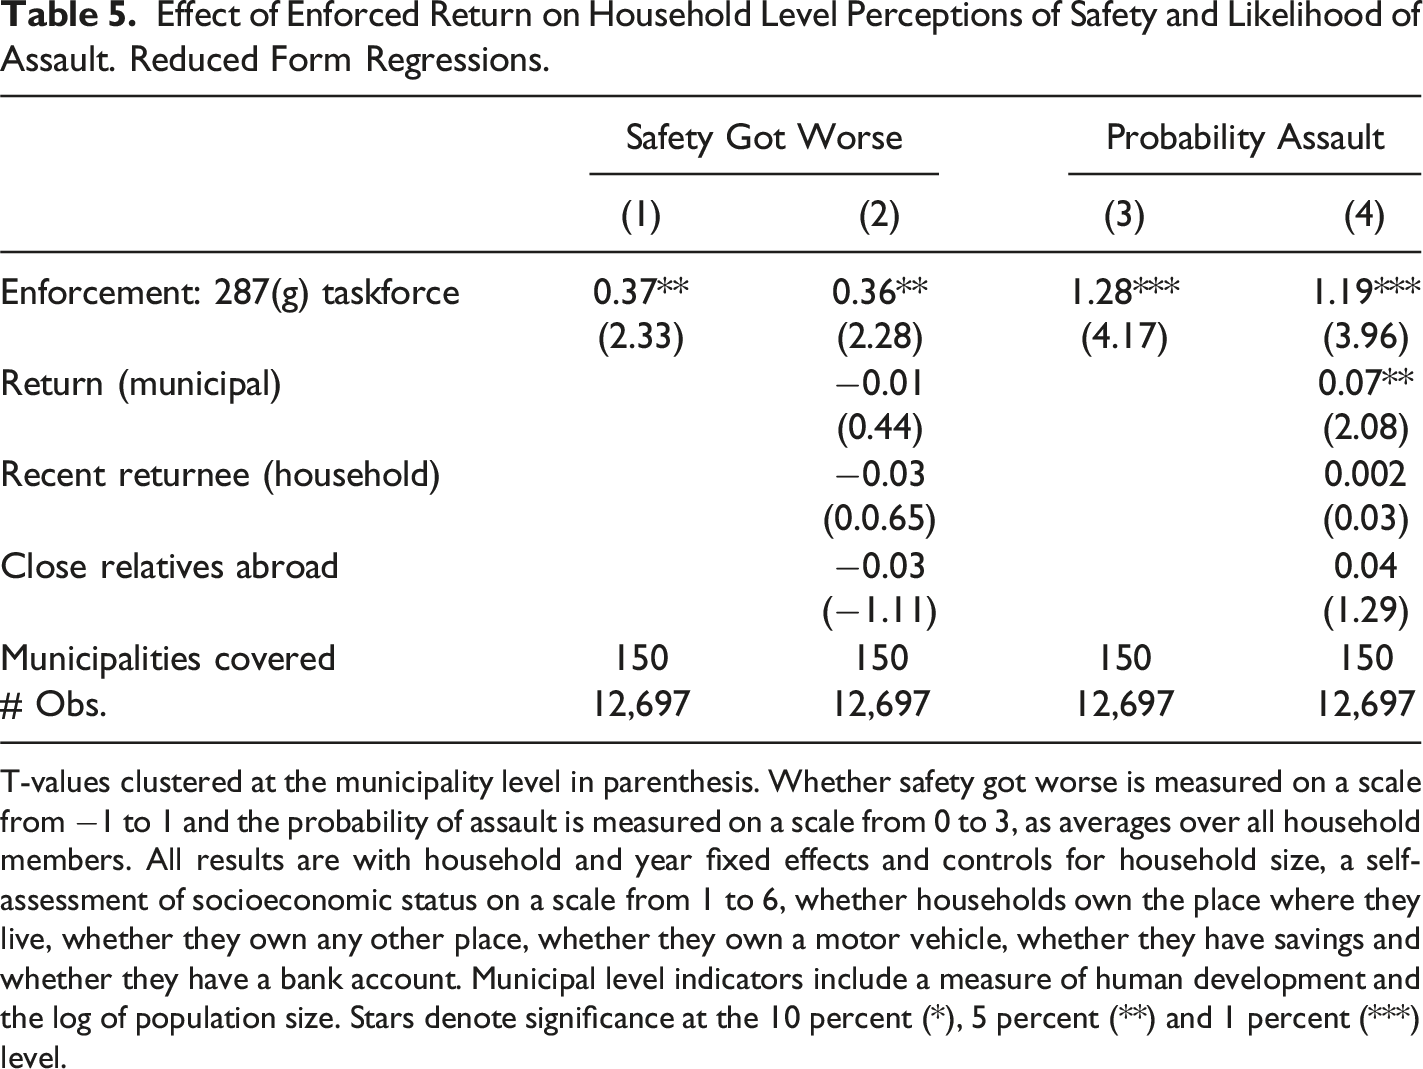
T-values clustered at the municipality level in parenthesis. Whether safety got worse is measured on a scale from −1 to 1 and the probability of assault is measured on a scale from 0 to 3, as averages over all household members. All results are with household and year fixed effects and controls for household size, a self-assessment of socioeconomic status on a scale from 1 to 6, whether households own the place where they live, whether they own any other place, whether they own a motor vehicle, whether they have savings and whether they have a bank account. Municipal level indicators include a measure of human development and the log of population size. Stars denote significance at the 10 percent (*), 5 percent (**) and 1 percent (***) level.
Results from Table 5 are in line with results from aggregate municipal level data in the previous section and support the finding of a crime-increasing effect of enforced return. Households living in municipalities whose migrants were more exposed to the adoption of 287(g) Task Force Agreement believe that they have a higher likelihood of being assaulted over the next year and that the security situation in their neighborhoods worsened over the previous 4 years. To provide a sense of the magnitude, the most exposed municipality had a value close to “1”. Compared to the least exposed municipality, the expected sense of insecurity increased 0.36 points (on a scale from −1 to 1), and the perceived likelihood of assault by 1.2 points on a scale from 0 to 3. These effects seem not to be driven by the migratory status of households; if anything, households with either emigrants or returnees have a more positive assessment of their security situations. Also, the inclusion of additional household level control variables hardly affects the results.
Conclusion
In support of recent literature (Ambrosius 2021; Ambrosius and Leblang 2020; Kalsi 2018; Rozo, Anders, and Raphael 2021; Sviatschi 2022), this study showed that the forced return of migrants generates sizeable negative effects in migrants’ communities of origin. Using deportation risk at destination as an exogenous determinant of enforced return, the empirical analysis revealed that higher deportation threats led to more returns, which in turn increased homicides and cartel expansion in Mexico. These results at the municipal level are backed by an analysis of survey data at the level of households. Households in municipalities that registered an increasing inflow of enforced return migration felt more insecure and sensed a higher probability of being assaulted.
The policy implications of these observations are a concern not only for migrants’ countries of origin. The export of violence via deportation regimes may facilitate the trans-nationalization of crime. This in turn triggers new waves of out-migration (Clemens 2021; Sviatschi 2022). At the same time, empirical evidence gives little support to the widespread narrative of immigrants as drivers of violence and crime at destination (see Abramitzky et al. 2023 for a long-term view of the US case). With respect to the intended and unintended consequences of deportations in the US, the literature shows a null effect of deportations on crime and violence in the US (Hines and Peri 2019; Miles and Cox 2014) and lower reporting of crime by immigrants out of fear of deportation (Becerra et al. 2017). Besides, native born workers in the United States suffered from a decrease in employment shares and hourly wages, likely as a result of increased labor costs, lower aggregate consumption and less job creation (East et al. 2022). Deportations do not seem to be a zero-sum game in which enforcement improves outcomes at destination at the expense of conditions in migrants’ countries of origin. This generates a paradox for migration policies. While policies of immigration enforcement respond to a narrative that is empirically largely unfounded, they risk globalizing violence with important unintended negative outcomes that may come back to haunt destination countries as well. This study has focused on violent crime; but recent literature has started to explore other dimensions of unintended outcomes of enforced return including Anti-Americanism (Ambrosius and Meseguer 2023), labor market outcomes (Bandiera et al. 2023; Pearson 2022) and schooling (Caballero 2021).
Open questions and extensions are left for future research. While this research made a first step in addressing the negative effects of immigration enforcement at origin, the exact mechanisms call for additional research. Effects on violence could be the result of the targeting of deportees and their recruitment by criminal groups but they could also be due to other negative externalities from deportations, such as the loss of income from remittances or debt from financing migration. More fine-grained data are necessary to distinguish the direct effects of immigration enforcement on trajectories of (returning) migrants from its indirect effects on households and communities, and to study the precise channels through which deportation regimes interact with violent crime at origin. Second, the results are based on the Mexican case, where a diversified structure of organized crime finds a large pool of potential recruits among those unabsorbed by labor markets. In combination with weak institutions of law enforcement, this poses fertile ground for violent crime. Whether a systematic pattern of enforced return on crime and violence holds beyond the Mexican or Latin American context is left for future research.
Supplemental Material
Supplemental Material - Violent Crime and the Long Shadow of Immigration Enforcement
Supplemental Violent Crime and the Long Shadow of Immigration Enforcement by Christian Ambrosius in Journal of Conflict Resolution
Supplemental Material
Supplemental Material - Violent Crime and the Long Shadow of Immigration Enforcement
Supplemental Violent Crime and the Long Shadow of Immigration Enforcement by Christian Ambrosius in Journal of Conflict Resolution
Footnotes
Author’s Note
This paper benefitted from very helpful comments by Covadonga Meseguer, Sandra Ley, Kai Gehring, David Escamilla-Guerrero, participants at the 17th Conference of the Households in Conflict Network (Göttingen, Online), the third Conference on Globalization and Development (Göttingen, Online), the research colloquium on the Economies of Latin America at Freie Universität Berlin, the first Meeting of the Humans-LACEA network at the Interamerican Development Bank; as well as the editors of the special feature Sarah Langlotz, Patricia Justino, Tilman Brück and Philip Verwimp and anonymous referees. Most of the research was done while the author was visiting professor at the National Autonomous University of Mexico in Mexico City with funding from the German Academic Exchange Service DAAD.
Declaration of Conflicting Interests
The author(s) declared no potential conflicts of interest with respect to the research, authorship, and/or publication of this article.
Funding
The author(s) received no financial support for the research, authorship, and/or publication of this article.
Supplemental Material
Supplemental material for this article is available online.
Notes
References
Supplementary Material
Please find the following supplemental material available below.
For Open Access articles published under a Creative Commons License, all supplemental material carries the same license as the article it is associated with.
For non-Open Access articles published, all supplemental material carries a non-exclusive license, and permission requests for re-use of supplemental material or any part of supplemental material shall be sent directly to the copyright owner as specified in the copyright notice associated with the article.