
Abstract
Many of the world’s major cities have recently seen large episodes of social unrest. What is the relationship between the changes these cities have experienced, particularly in the form of gentrification, and urban riots? We address this question by examining how local gentrification affected participation in the 2011 London riots. We use an instrumental variable strategy that exploits exogenous variation in the amount of local destruction caused by the Blitz; this is a strong predictor of local gentrification in London in 2001–2011. We find that gentrifying neighborhoods had a lower participation rate than other areas; this was a result of changes in the type of resident (a composition effect) and in the context in which the residents made their participation decisions (a contextual effect). Our findings are consistent with qualitative evidence from the United Kingdom and the United States, and highlight the effect that urban change can have on social order.
Introduction
Many of the world’s major cities have recently experienced large episodes of social unrest. This unrest has taken place against a backdrop of large urban change, particularly in the form of gentrification. Since gentrification affects many factors commonly associated with social unrest, including the social composition of a neighborhood, it is likely that the two are linked. 1 Yet the possible relationship between gentrification and social unrest has received limited attention in the literature.
This article examines the causal relationship between gentrification and urban riots. 2 We focus on gentrification because it is one of the most significant changes currently taking place in the world's major cities. 3 Our hypothesis is that gentrification reduces participation in urban riots, and that it does so in two ways. First, it changes the social composition of an area, replacing working-class residents with middle-class individuals. In so far as the new residents are less likely to riot, this will cause participation to fall. Second, the residents of a gentrifying area will experience a change in their context, for example they will have fewer working-class neighbors and may see improvements in public services, and this may affect their decision to participate in a riot.
To examine the empirical validity of our hypothesis we look at the relationship between the amount of gentrification experienced in 2001–2011 by different London neighborhoods and the participation of their residents in the 2011 London riots. 4 The riots began in north London when police shot and killed a suspected drug dealer, but then spread to become the largest episode of social unrest the country had seen in a generation. The unrest was followed by a large police operation that made extensive use of CCTV footage to identify and arrest over 3500 participants. We use data on these arrested individuals, including their residential addresses and whether they were charged, and match it to two measures of local gentrification: the increase in the fraction of professionals and the decrease in council-owned (i.e. public) housing in their neighborhood of residence. 5 The first measure captures the flow of middle-class residents into an area (e.g. Atkinson 2000), while the second reflects the displacement that results from the reduction in the supply of affordable housing.
London is a very mixed city, with most areas housing individuals from a variety of ethnic and socio-economic backgrounds (Manley and Johnston 2014); this gives us substantial variation in our variables without introducing cross-city or cross-country confounders. An additional advantage is that reverse causality is not a serious concern: gentrification before the riots is unlikely to have been a consequence of how likely an area was to be affected by the riots. However, gentrification is not randomly assigned: some of the factors that determine whether an area gentrifies may also have affected participation. We address this issue by using an instrumental variable strategy that exploits an exogenous source of variation in the potential for gentrification: the fraction of each neighborhood that was destroyed during the Blitz. Bombing during the Blitz was not very precise, so that within an area the exact location where a bomb fell can be considered to be random (Feller 1968). These bombs continue to affect how London develops today: because of Britain’s strict planning and heritage laws, only relatively new buildings can be refurbished or demolished to make way for the new housing developments that have driven the gentrification process since the year 2000. 6 Many of these relatively new buildings sit on former bomb sites (Houghton 2018; Watts 2015); therefore the amount of bombing an area experienced during the war is correlated with its gentrification in 2001–2011.
We find that local gentrification reduced participation in the 2011 London riots; these effects are large and statistically significant. Looking at the change in the fraction of professionals, we find that a one standard deviation increase in gentrification leads to a decrease in participation that is 2.7 times the magnitude of the mean participation rate across neighborhoods. Looking at the change in the fraction of council housing, we find that a one standard deviation in gentrification leads to an effect that is equal in magnitude to the average participation rate across neighborhoods. We also provide evidence that these results are due to changes in both the composition of a neighborhood and the context in which its residents decided whether to participate in the riots.
This article contributes to a large literature that examines the factors that cause urban riots (e.g. Olzak and Shanahan 1996; Myers 1997; Kawalerowicz and Biggs 2015; Wilkinson 2004, 2009). Most of the literature treats these factors as exogenous, says little about what causes them to vary, and does not address the endogeneity problem. Our work is closely related to Dancygier (2010), who examines immigration riots in the UK, but differs in that we focus on the effect of gentrification and explicitly address the endogeneity problem. In a qualitative study, Moutselos (2020) examines the role of large social housing estates in facilitating the eruption of the 2005 French riots. Newburn (2011) and Kawalerowicz and Biggs (2015) emphasize the role of deprivation, Newburn et al. (2018) examine how resentment of the police helped drive participation in the 2011 riots, and Baudains, Johnson, and Braithwaite (2013b) examine the patterns of diffusion and how they were affected by the location of police. Baudains, Braithwaite, and Johnson (2013a) examine target choice and find that population turnover made locations more vulnerable to looting. In contrast to these studies, we focus on the causal role of gentrification and employ an identification strategy that enables us to address the endogeneity problem. 7
We are the first to examine quantitatively the link between gentrification and riots. Our finding that gentrification affects the participation of an area’s residents contributes to a literature that shows that exposure to other groups can alter people’s political choices (Enos 2017). 8 Our findings are also consistent with a qualitative literature that finds that gentrification can have a positive effect on the lives of the original residents who remain in the neighborhood. A 2013 report found high and increasing levels of satisfaction in the gentrifying parts of the London borough of Hackney, even among residents who had lived in the area for more than 10 years (Page 2013). This echoes what Freeman (2006) found in New York City, where many residents of Harlem and Clinton Hill benefited from gentrification. Paton (2014)’s study of the Glasgow Harbour redevelopment in Scotland confirms that the original residents of a gentrifying area may see some benefits from the process, with the young in particular welcoming the changes and aspiring to the lifestyle of the gentrifiers. 9
Framework and Hypothesis
We define gentrification as the arrival of middle-class residents into a working class neighborhood. This often results in the displacement of the area’s existing residents (Glass 1964). This process affects participation by changing an area’s social composition and the context in which residents decide whether to participate.
Participants in many riots, including those in London in 2011, are typically poor, young, and from ethnic minority backgrounds (Singh et al. 2011). Consistent with this, a number of studies have shown that poverty and deprivation (e.g. Aidt and Leon 2016; Kawalerowicz and Biggs 2015; Myers 1997; Olzak and Shanahan 2003; Scacco 2016), demographic factors like the number of young men (e.g. Urdal 2006; Campante and Chor 2012; Nordås and Davenport 2013) and ethnic and religious diversity (e.g. Myers 2000; Wilkinson 2004, 2009; Scacco 2016) can all increase unrest. Therefore a process like gentrification that displaces poor, young men from ethnic minority backgrounds and replaces them with white middle-class residents could reduce participation.
The arrival of gentrifiers can also have a contextual effect on the behavior of the neighborhood’s working-class residents. It does this by changing a number of structural factors that affect participation, including those related to motivation, organization and repression: people need a reason to participate, riots often require a critical mass of participants and this can be achieved through local organization, and the possibility of repression can affect people’s decision to participate (Aidt and Leon-Ablan 2022). We now consider each in turn.
Gentrification can bring some benefits to the working-class residents of a neighborhood. For example, it can attract new jobs to the area (Meltzer and Ghorbani 2017), and it often leads to improvements in the provision of public services including supermarkets, parks and sports centers (Freeman and Braconi 2004; Brummet and Reed 2019). The prosperity of a neighborhood, as measured by tenure and social status, has also been shown to improve the satisfaction of residents (Mohan and Twigg 2007). Furthermore, these changes reduce competition for resources between groups, an important factor behind many urban riots in the United States and the United Kingdom (Myers 1997; Olzak, Shanahan, and McEneaney 1996; Olzak and Shanahan 2003; Dancygier 2010). All of these changes help reduce individuals’ motivation to participate. On the other hand, the arrival of the gentrifiers may be threatening to those who fear they might be displaced in the near future, while the increased inequality may generate grievances that could increase participation.
Riots often require some local organization, and gentrification could make this more difficult. The view that organization is important dates back to resource mobilization theory (McCarthy and Zald 1977; McAdam 1982), which emphasizes the role of associations and the rationality of actors in organizing collective action. For example, Morris (1981) highlights the importance of the internal organization of a movement, Minkoff and McCarthy (2005) focus on the role of organizational decision-making, and Dahlum, Knutsen, and Wig (2019) argue that the industrial and middle classes are best placed to lead a successful movement because they stand to see the benefits (motivation) and have the ability to coordinate (organization). A number of studies have found that leaders also play an important role in social unrest (e.g. Strang and Soule 1998; Vasi 2011; Aidt and Leon-Ablan 2022). In turn, gentrification could make it more difficult for potential rioters to organize. Gangs appear to have played an important part in mobilizing rioters during the 2011 London riots (Morrell et al. 2011), and their organization is likely to have been weaker in areas that had recently gentrified. For instance, gang members may have been displaced, resulting in smaller and possibly leaderless gangs. On the other hand, the community’s ability to organize to control criminal behavior could have also been undermined.
Finally, gentrification often leads to a local increase in repression, which in turn can affect participation in social unrest. A number of studies have found that police make more arrests in gentrifying areas, often because the new residents are more willing to report crime and can lobby for more police (Legewie and Schaeffer 2016; Laniyonu 2018). 10 At the same time, the gentrifiers can invest in private methods of deterrence like alarms and private security (Farrell et al. 2011; Autor, Palmer, and Pathak 2019). And the presence of middle-class individuals can cause working-class residents to self-censor their behavior (Fassin 2013). However, studies differ in their findings as to whether repression increases or decreases social unrest; for example, DiPasquale and Glaeser (1998) and Wilkinson (2004, 2009) show that repression can decrease it, while Opp and Roehl (1990) and Suh, Vasi, and Chang (2017) find that it can increase it. This is consistent with the idea in the threats and opportunities literature that repression may trigger more unrest (threat), but the lack of repression may allow for it (opportunities).
Overall, our arguments suggest that the changes in social composition brought about by gentrification will decrease participation. The changes in context, although less clear-cut, are likely to also result in lower participation. This motivates our hypothesis:
Gentrification reduces the likelihood that the residents of an area participate in a riot.
The Setting
The 2011 London Riots
On 4 August 2011 armed agents of the Metropolitan Police shot and killed Mark Duggan, a suspected drug dealer. His death led to a small peaceful protest that turned into a riot and then spread to other parts of the city. A wide-reaching police operation and a large number of arrests brought the riots to an end on 11 August. This was followed by a comprehensive police investigation that used footage from London’s extensive CCTV network to identify rioters: 500 officers watched approximately 20,000 hours of footage in an attempt to identify as many participants as possible (Metropolitan Police Service 2012). Over 3500 participants were arrested and many faced heavy penalties for their actions (Travis and Rogers 2011). Figure 1(a) shows the distribution of arrests across LSOAs in London, while Figure 1(b) highlights the boroughs that were the site of most riot-related incidents (in black). The maps show that the riots and the rioters were spread through much of central, south and north London. The 2011 London riots. The triangles in panel (a) show the location of the riots. The darker LSOAs in panel (a) had a larger fraction of residents charged for riot-related offenses. The dark boroughs in panel (b) had the largest number of individuals charged for riot-related offenses.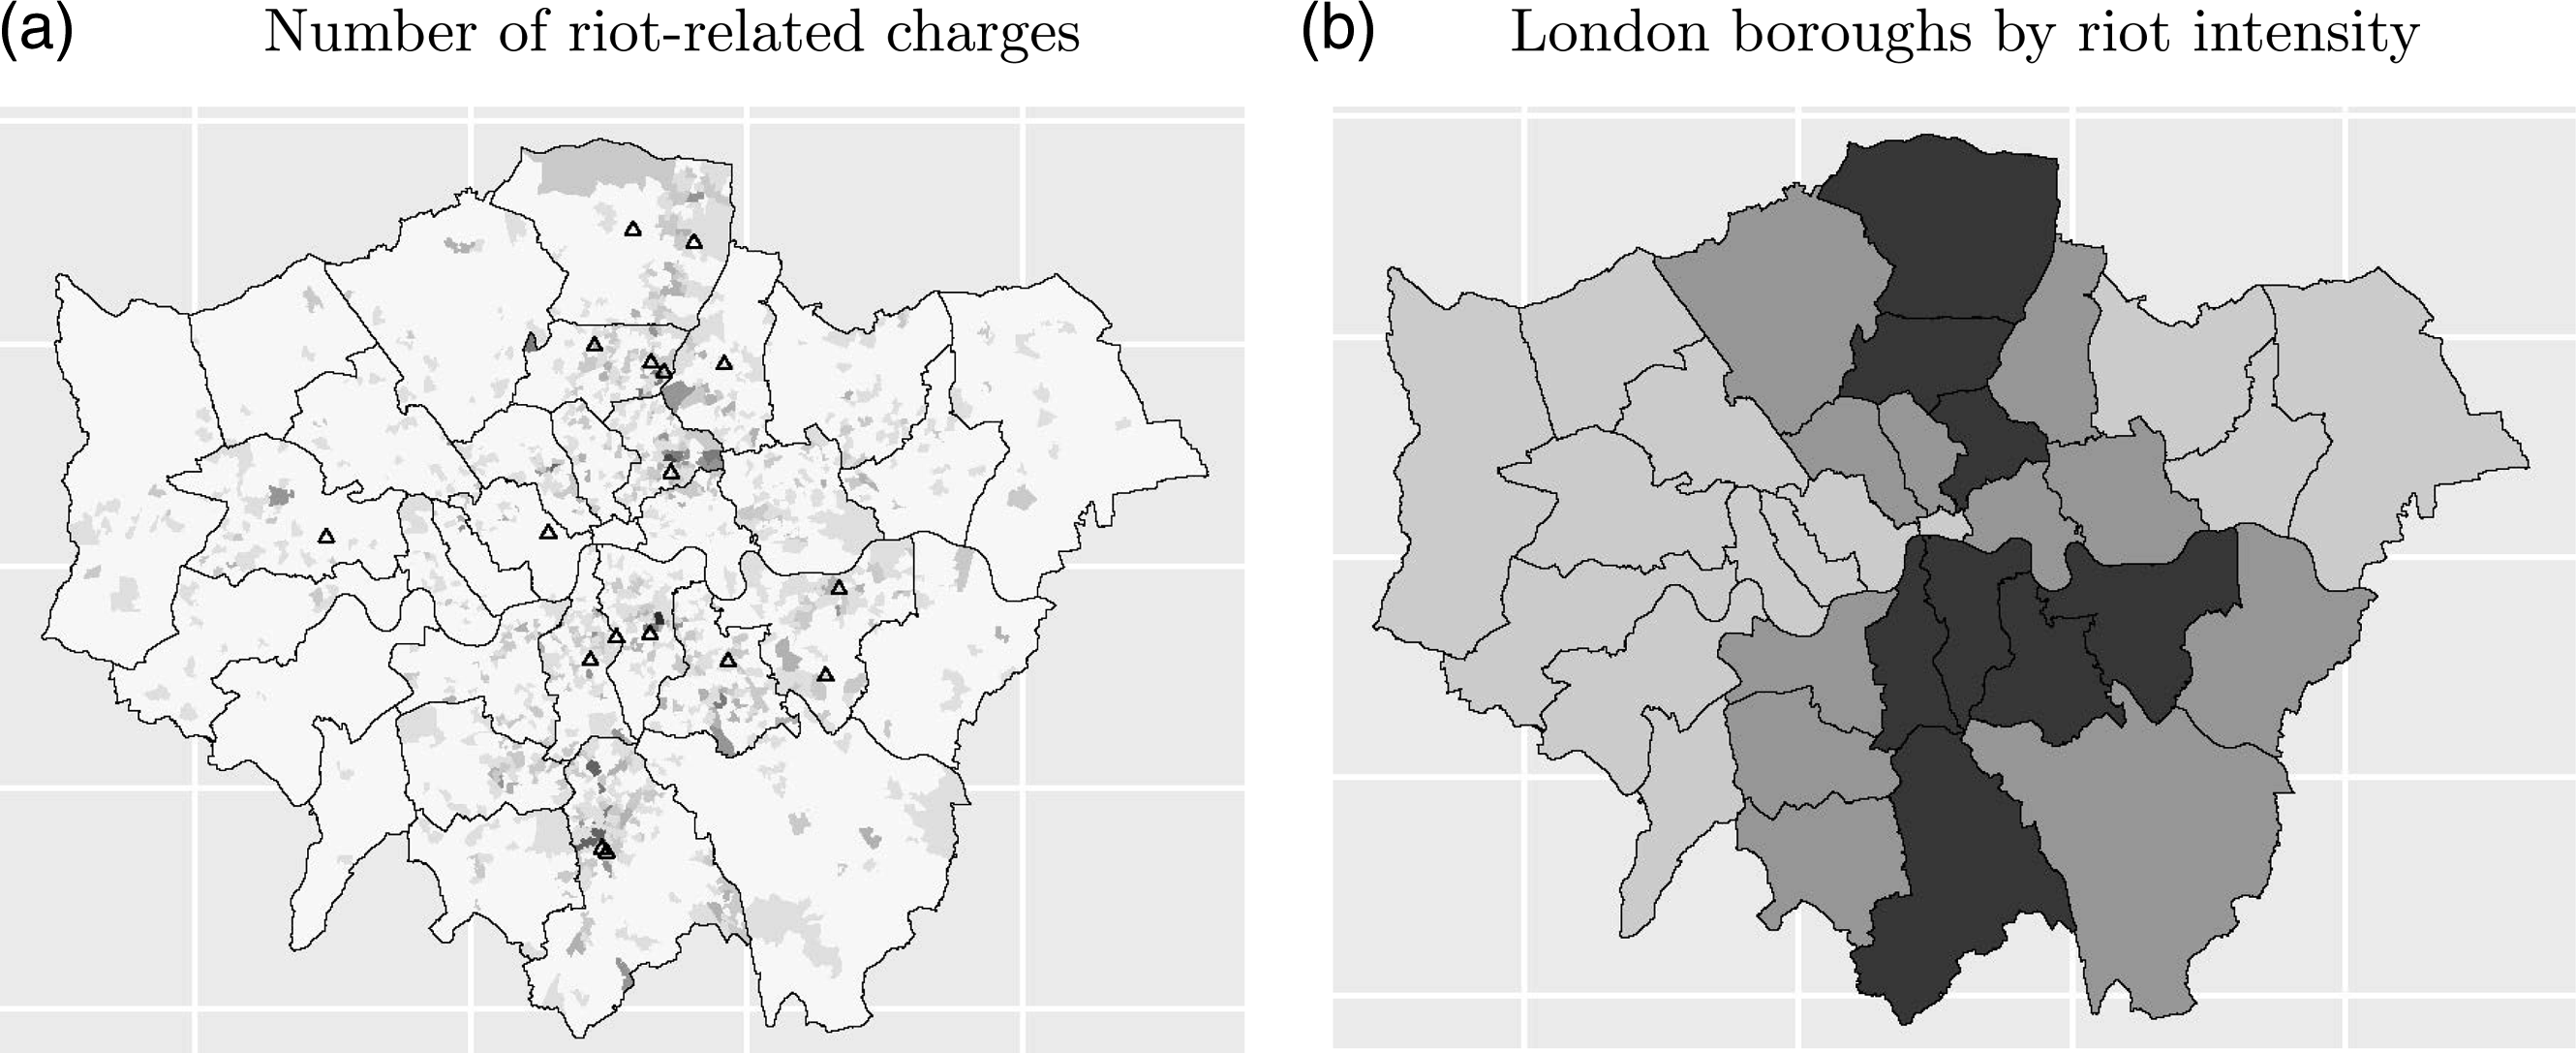
The vast majority of those arrested for riot-related offenses were young and male: their average age was 22 and 87% were men. Seven out of 10 had a criminal record (Metropolitan Police Service 2012) and 66% belonged to an ethnic minority (Singh et al. 2011). 11
Gentrification in London
London began to gentrify in the 1960s (Glass 1964), but since the turn of the millennium the nature of this process has changed. While gentrification used to affect areas with large period properties that could be restored, from around 2001 the process has been driven by the construction of new high-end apartment buildings for the rental market (Paccoud 2017; Davidson and Lees 2010). As a result, deprived areas of the city, particularly inner-city neighborhoods to the east and south including Hackney Wick and Elephant and Castle, have undergone a complete regeneration (Tran 2011; Davies 2011). Due to Britain’s strict planning laws, only relatively new buildings, which often sit on former bomb sites, can be refurbished or demolished to make way for these new housing developments (Davidson and Lees 2010; Houghton 2018; Watts 2015). The online appendix presents a brief history of public housing in London between 1945 and 2010.
The Blitz
The Blitz was a Nazi aerial bombing campaign that targeted British industrial and urban centers during the Second World War. It started in September 1940 and ended in June 1941 when Hitler canceled his planned invasion of Britain and shifted his attention east to the Soviet Union. The bombs destroyed over 1 million houses, and London in particular was heavily affected (Parker 2017, p.234).
The targets were chosen in a somewhat haphazard manner and the bombs were not very precise (Feller 1968). Although planes could target specific areas, bombing largely happened at night and the exact location where a bomb fell depended on a number of factors including pilot skill, wind, visibility, Royal Air Force defensive action and ground fire (Overy 2013). This resulted in considerable variation in the amount of destruction within relatively small areas. 12 Consequently, once we control for borough fixed effects, the exact location where a bomb fell can be treated as random; e.g. the Nazis could target central London, but where in central London the bombs fell was random.
The Blitz completely changed London’s urban geography: after the war, the land cleared by the bombs was used to construct new buildings, many of them public housing complexes (council estates). Due to Britain’s strict planning laws that protect pre-war structures, it is these post-war buildings that have been refurbished or demolished to make way for the new high-end housing developments that have driven the gentrification process since 2001 (Watts 2015). Figure 2 shows bombing intensity by LSOA. The Blitz. This shows the fraction of each LSOA that was destroyed during the Blitz, with darker LSOAs having experienced more destruction. We do not have bombing data for the borough of Havering (the easternmost borough in London).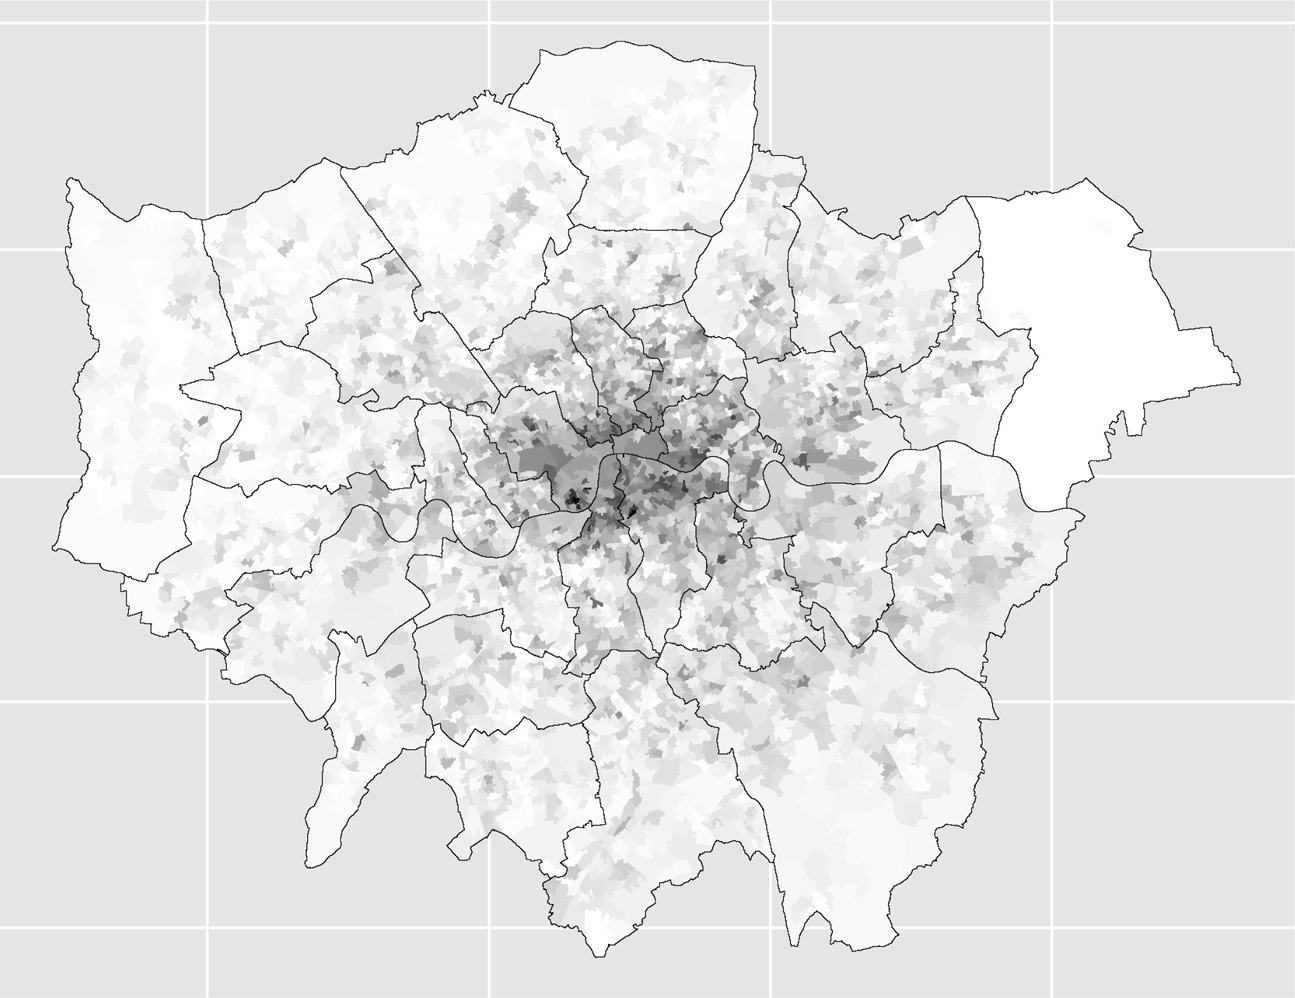
Data and Measurement
Our unit of observation is the lower super output area (LSOA), a census unit of which there are 4835 in London; the average LSOA had a population of 1722 in 2010. 13 We do not have participation data, and so instead use data on those who were arrested and charged for participating in the riots. The police made extensive use of CCTV footage to help identify riot participants ex-post (Metropolitan Police Service 2012), and we have information on 3552 riot-related arrests. We drop crimes committed after 10 August 2011; this is in order to exclude arrests related to the sale of goods stolen during the riots, since this may not have involved participation. We also drop cases where the police could not present enough evidence to press charges. Our final sample has 1361 individuals and their LSOA of residence. 14 We calculate the fraction of individuals charged relative to three different LSOA populations: the total population, the number of young individuals (those aged 16–24) and the number of individuals without qualifications. 15 The last two more closely approximate the population of potential rioters, since participants were mostly young and poor. The census does not report information on income, and so we use the number of individuals without qualifications (e.g. low educational attainment) as a proxy for the working-class population of an area.
One concern is measurement error resulting from the possible targeting of particular neighborhoods by the police. We believe that this measurement error is likely to be small. First, we control for the factors that are typically associated with more aggressive policing: the crime rate, deprivation and ethnic diversity. Second, as discussed in the Framework and Hypothesis section, studies have found that the police are more active in gentrifying areas. This should bias our estimates towards finding that gentrification increases arrests, which is the opposite of what we find. Furthermore, the police devoted considerable resources to an operation that aimed to arrest and charge as many participants as possible, including those whose involvement was limited to stealing low value items. 16 Officers therefore had an incentive to arrest as many individuals as possible, making the targeting of specific areas unlikely. Finally, Figure A2 in the online appendix shows that the number of arrests decreases with distance to the riot locations. This is consistent with the view in the literature that participation rates were higher in areas near the riots, but not with police targeting low income neighborhoods.
We use two measures of gentrification. The first is the change in the fraction of residents in an LSOA who work in management and professional jobs (Δ professionalsi,01−11), which is based on the measure used in Atkinson (2000). We calculate the values of this variable using data from the 2001 and 2011 censuses. 17 Although widely used, measures based on socio-economic background have recently been criticized (e.g. Fenton 2016), and so we use a second measure: the change in the fraction of accommodation that is classified as council housing (Δ councili,01−11). Decreases in this fraction capture reductions in the supply of affordable housing in an LSOA. This would result from the properties being sold off into the private market, the council blocks being demolished, or new private properties being built; all signs of gentrification. This change is calculated using data from the 2001 and 2011 censuses. We can think of the first measure as capturing the positive aspects of gentrification (what is often called the replacement effect), while the second more directly captures the negative consequences of this process (often associated with the displacement of the original residents).
Our data on the location of bombs dropped in London during the Blitz comes from www.bombsight.org. This project used records from the UK National Archive to map the location of the bombs that fell in London between 7 October 1940 and 6 June 1941. Each bomb is assumed to have destroyed all areas within 10 meters of where it fell. 18 We employ a number of additional variables in most of our specifications; these include the share of housing belonging to the council in 2001, the crime rate in 2009, inequality in 2001, the median of log rents in 2009, deprivation in 2001 and a measure of ethnic diversity in 2001. All of these variables are measured at the LSOA level. Details of our sources and how the variables are constructed can be found in the online appendix. 19
Gentrification and Participation
Our core specification is


We address this issue by using an instrumental variable strategy. Our instrument is the fraction of each LSOA that was destroyed by Nazi bombs during the Blitz. This instrument has to meet two conditions: it needs to be correlated with gentrification in 2001–2011 and it needs to satisfy the exclusion restriction. There are good reasons to expect the instrument to be correlated with gentrification. Gentrification in London since the start of the millennium has been driven by the move of professional renters into newly built private properties in deprived areas of inner London (Paccoud 2017; Fenton 2016; Davidson and Lees 2010). 22 Strict planning rules mean that these new developments can only replace recently constructed buildings (Davidson and Lees 2010; Watts 2015), i.e. those from the post-war period, which often sit on former bomb sites. The fraction of an LSOA that was bombed during the Blitz should therefore correlate with gentrification in 2001-2011. 23
The effect on council housing was indirect: as sites were redeveloped, prices in the rest of the neighborhood were pushed up, creating an incentive for local governments to evict residents of council housing blocks in order to redevelop the sites (Paccoud 2017). Houghton (2018, p.225–6) describes this process with respect to the Heygate estate in Elephant and Castle: it was built on a site that had been heavily damaged during the Blitz, but in the early 2000s the council decided to sell the land to a private developer in order to raise money to build new public housing. This resulted in a large fall in the number of council properties.
The Effect of Gentrification on the Number of Individuals Charged, by LSOA.
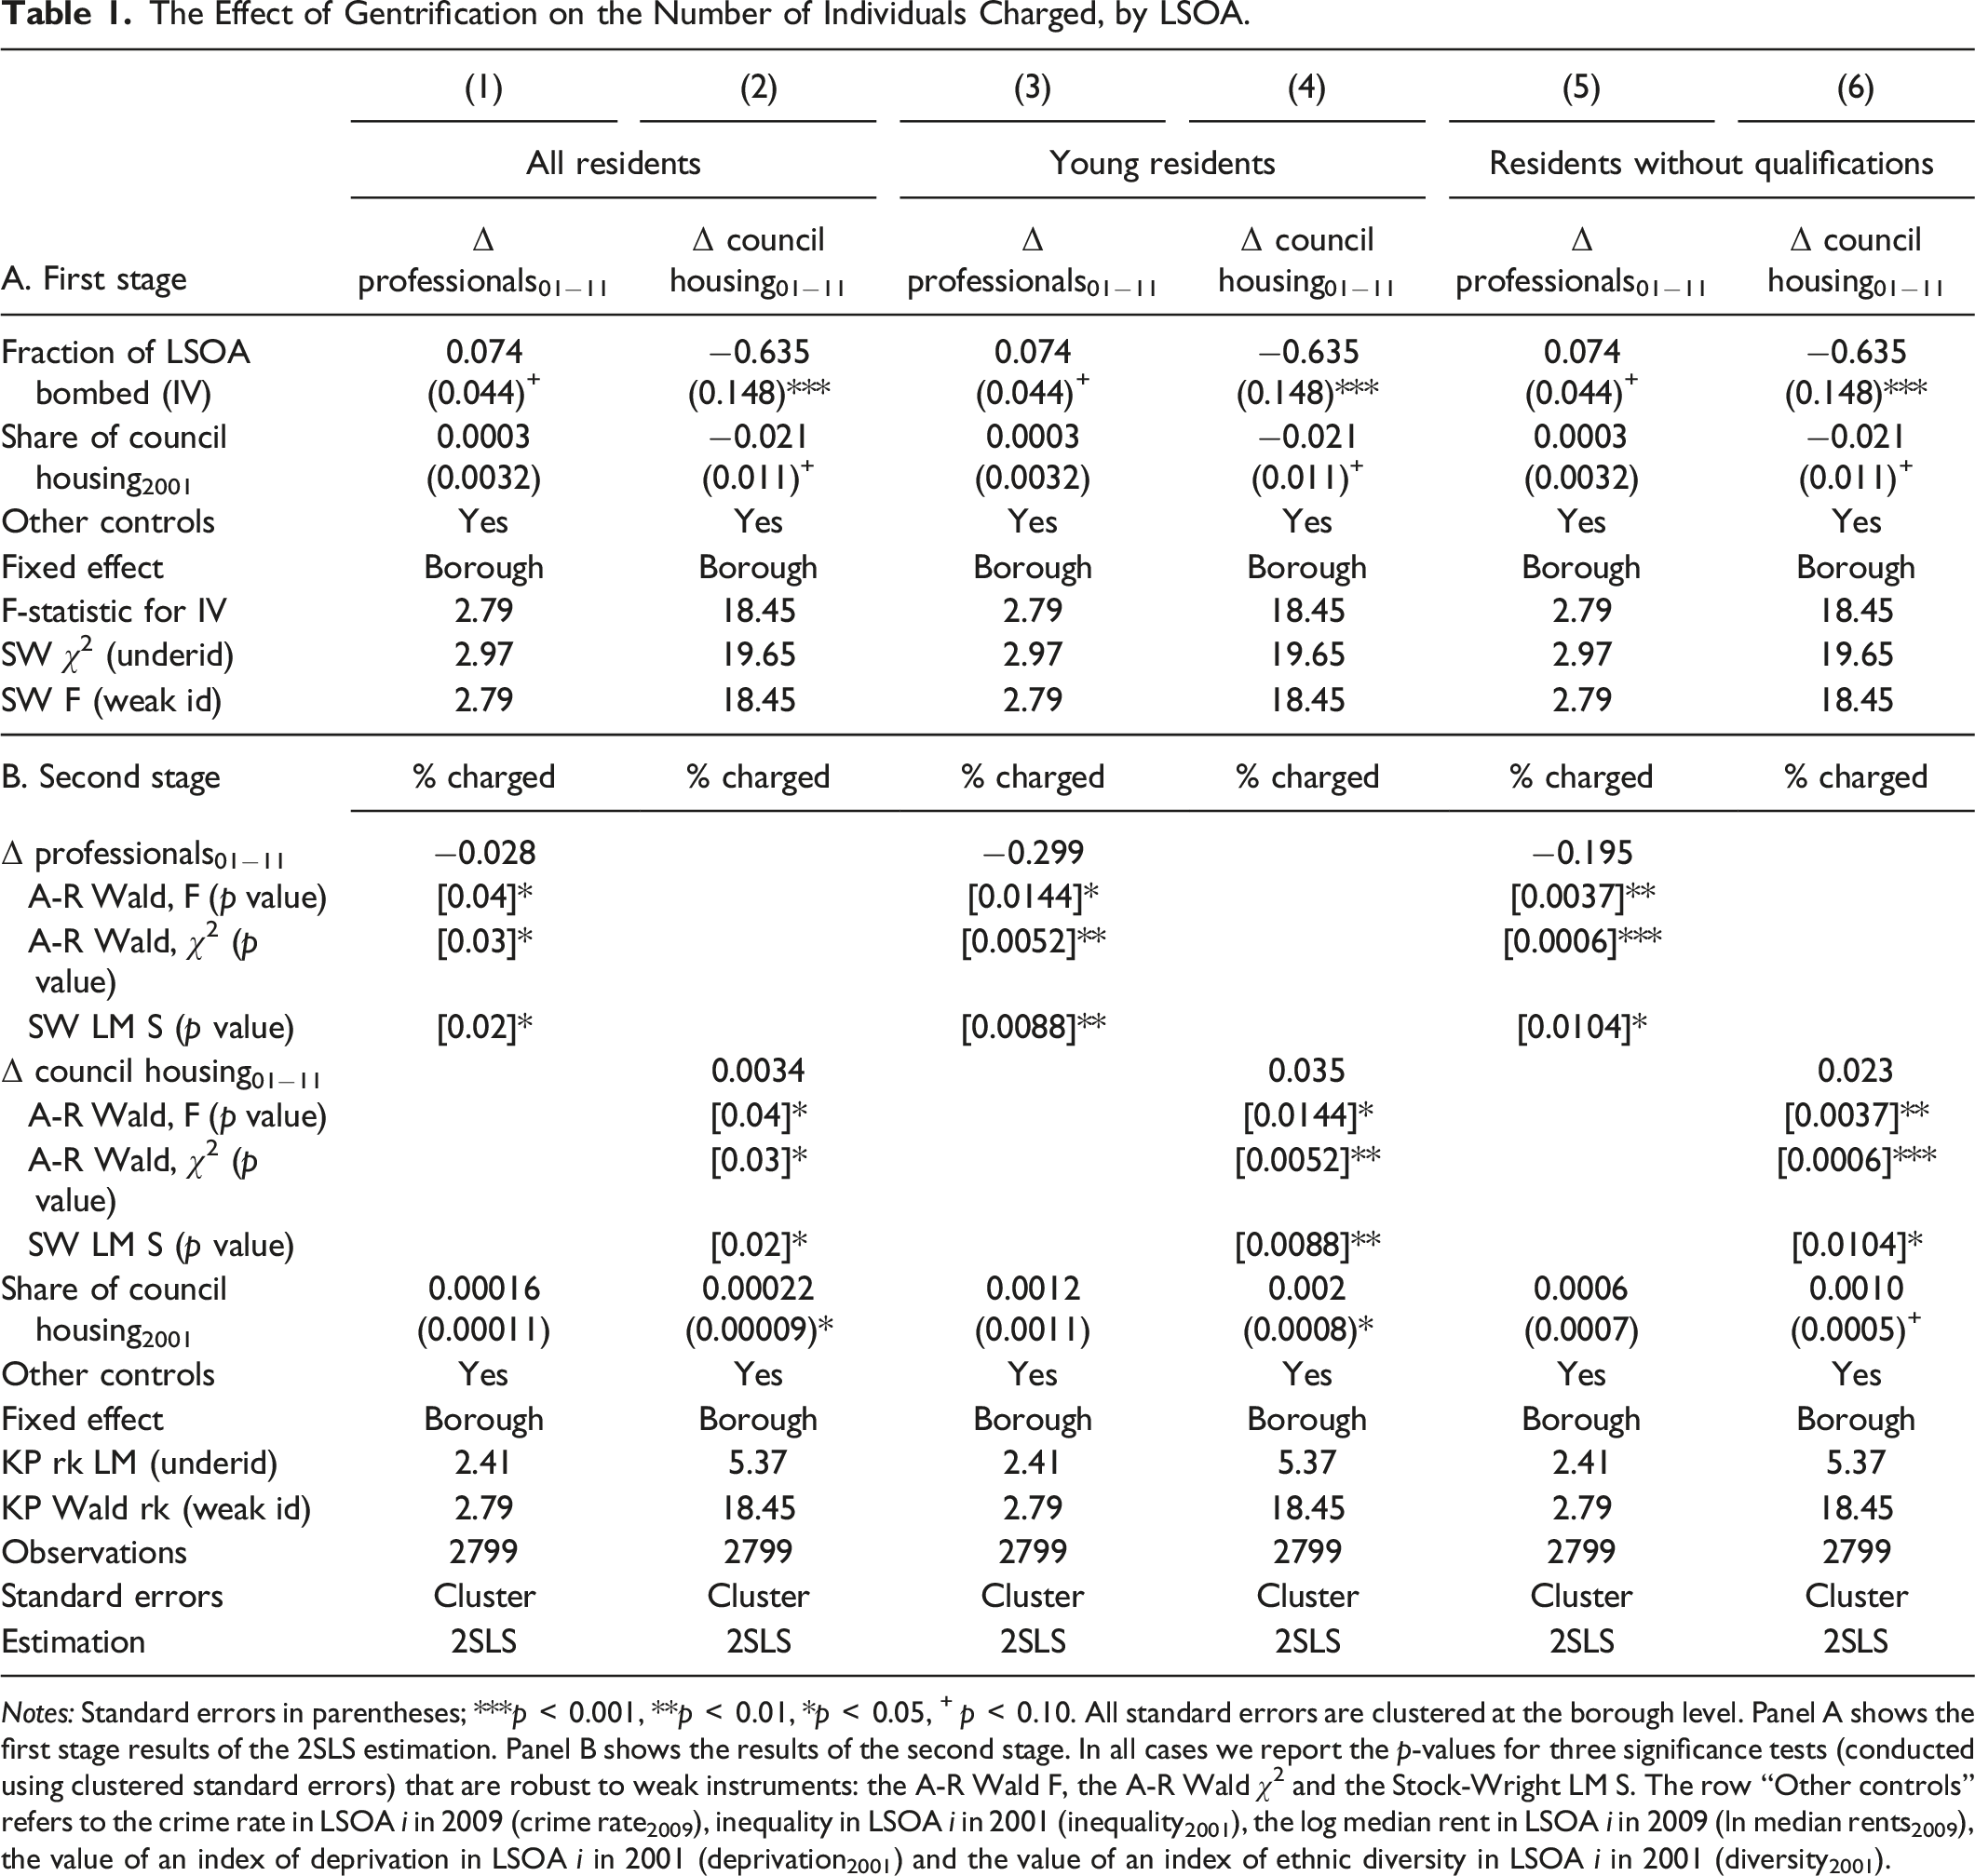
Notes: Standard errors in parentheses; ***p
Our 2SLS results are shown in Table 1. 25 Column 1 shows the results for a specification where gentrification is measured as the change in the fraction of professionals, instrumented using the fraction of the LSOA destroyed during the Blitz. The results for the first stage are reported in panel A, where we find that the F-statistic is 2.79, under the threshold of 10 used as the rule-of-thumb in the literature (Stock, Wright, and Yogo 2002). In panel B we present the results of the second stage; we report the p-values for three significance tests that are robust to the weakness of the instrument: the A-R Wald F test, the A-R Wald χ2 test and the Stock-Wright LM S test. We find that gentrification reduced participation. To compute the size of the effect, consider that one standard deviation in this gentrification variable is 0.029 (see Table 2), and so the effect is −0.028 × 0.029 = −0.0008, which compared to the mean fraction of charged individuals (which is 0.0003; see Table 2), shows that a one standard deviation increase in gentrification generated a decrease in participation that is 2.7 times the magnitude of the mean participation rate across LSOAs. This is a large effect. 26
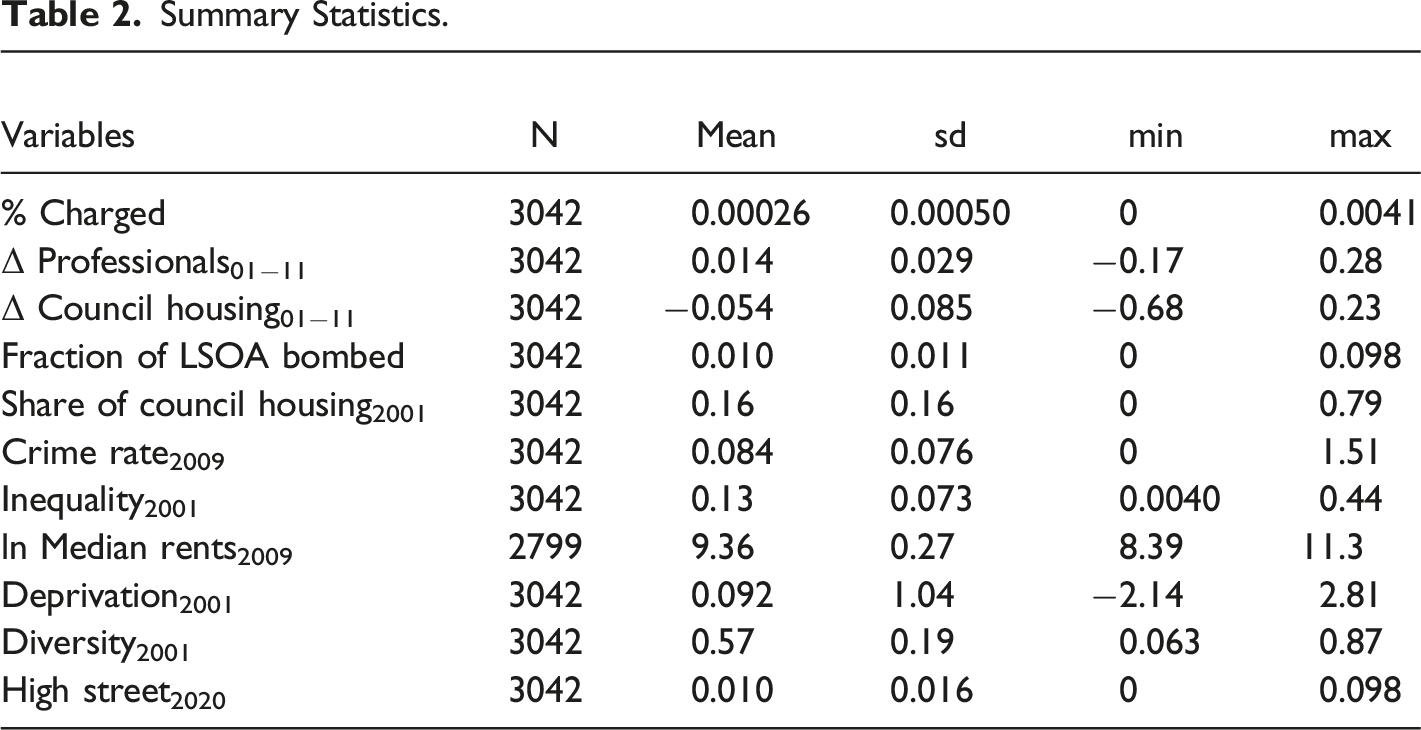
Summary Statistics.
These results could be entirely due to differences in social composition across LSOAs. 28 To get a sense for whether gentrification also affects the participation decision of the young and working-class residents of an area, we calculate participation relative to the size of these groups. In columns 3 and 4 we replicate the analysis using the fraction charged relative to the number of young people in the LSOA (those aged between 16 and 24 in 2011). 29 In columns 5 and 6 we do so relative to the number of individuals with no qualifications in 2011; these are individuals with low levels of education and so likely to belong to the working class. 30 The results in columns 3-6 suggest that the young and working-class residents change their behavior as a result of gentrification and become less likely to riot. 31
We should note that the IV results have a different interpretation from OLS coefficients: our estimates are average causal responses (ACR), a generalization of the local average treatment effect (LATE) for cases where the endogenous variable is continuous. The LATE/ACR interpretation is appropriate when there is heterogeneity in the effect of the variable of interest (Angrist and Pischke 2009, pp.155–186). 32 Our 2SLS coefficients average the effect across LSOAs, giving weights based on how responsive gentrification in 2001–2011 was to bombing during the Blitz. Consequently, they include LSOAs where bombing intensity affected gentrification in 2001–2011, but not LSOAs where it did not affect gentrification in that period (e.g. because they had already gentrified). These “unresponsive” LSOAs contribute to the OLS regression and so attenuate the estimated coefficients.
Our results are calculated using cross-sectional variation in gentrification, and so one concern may be that rather than reducing participation in the gentrifying LSOAs, gentrification increased participation in non-gentrifying areas. This could be the case, for example, if individuals displaced by gentrification moved to non-gentrifying areas and rioted more. Although we do not have a counterfactual to allow us to estimate participation in the absence of gentrification, we think that it is unlikely that our results simply reflect the behavior of these displaced individuals. First, previous work has shown that those who are displaced do not relocate to other parts of the same borough. Instead, they move to the outer London boroughs or out of the city (Fenton 2016; Lees 2018; Houghton 2018). It follows that our findings, derived using within-borough variation, cannot be due to rioting by these displaced individuals. Second, in Table A7 in the online appendix we re-estimate our coefficients using only LSOAs that saw some gentrification (i.e. either the change in professionals was positive or the change in council housing was negative). These estimates therefore only exploit variation in the intensity of gentrification, leaving out non-gentrifying areas. The results are largely unchanged relative to those in Table 1. 33
We now explore the effect of treatment intensity in more detail. Figure 3 shows coefficients for a regression of participation on gentrification quintiles, therefore allowing for some non-linearity in the effect.
34
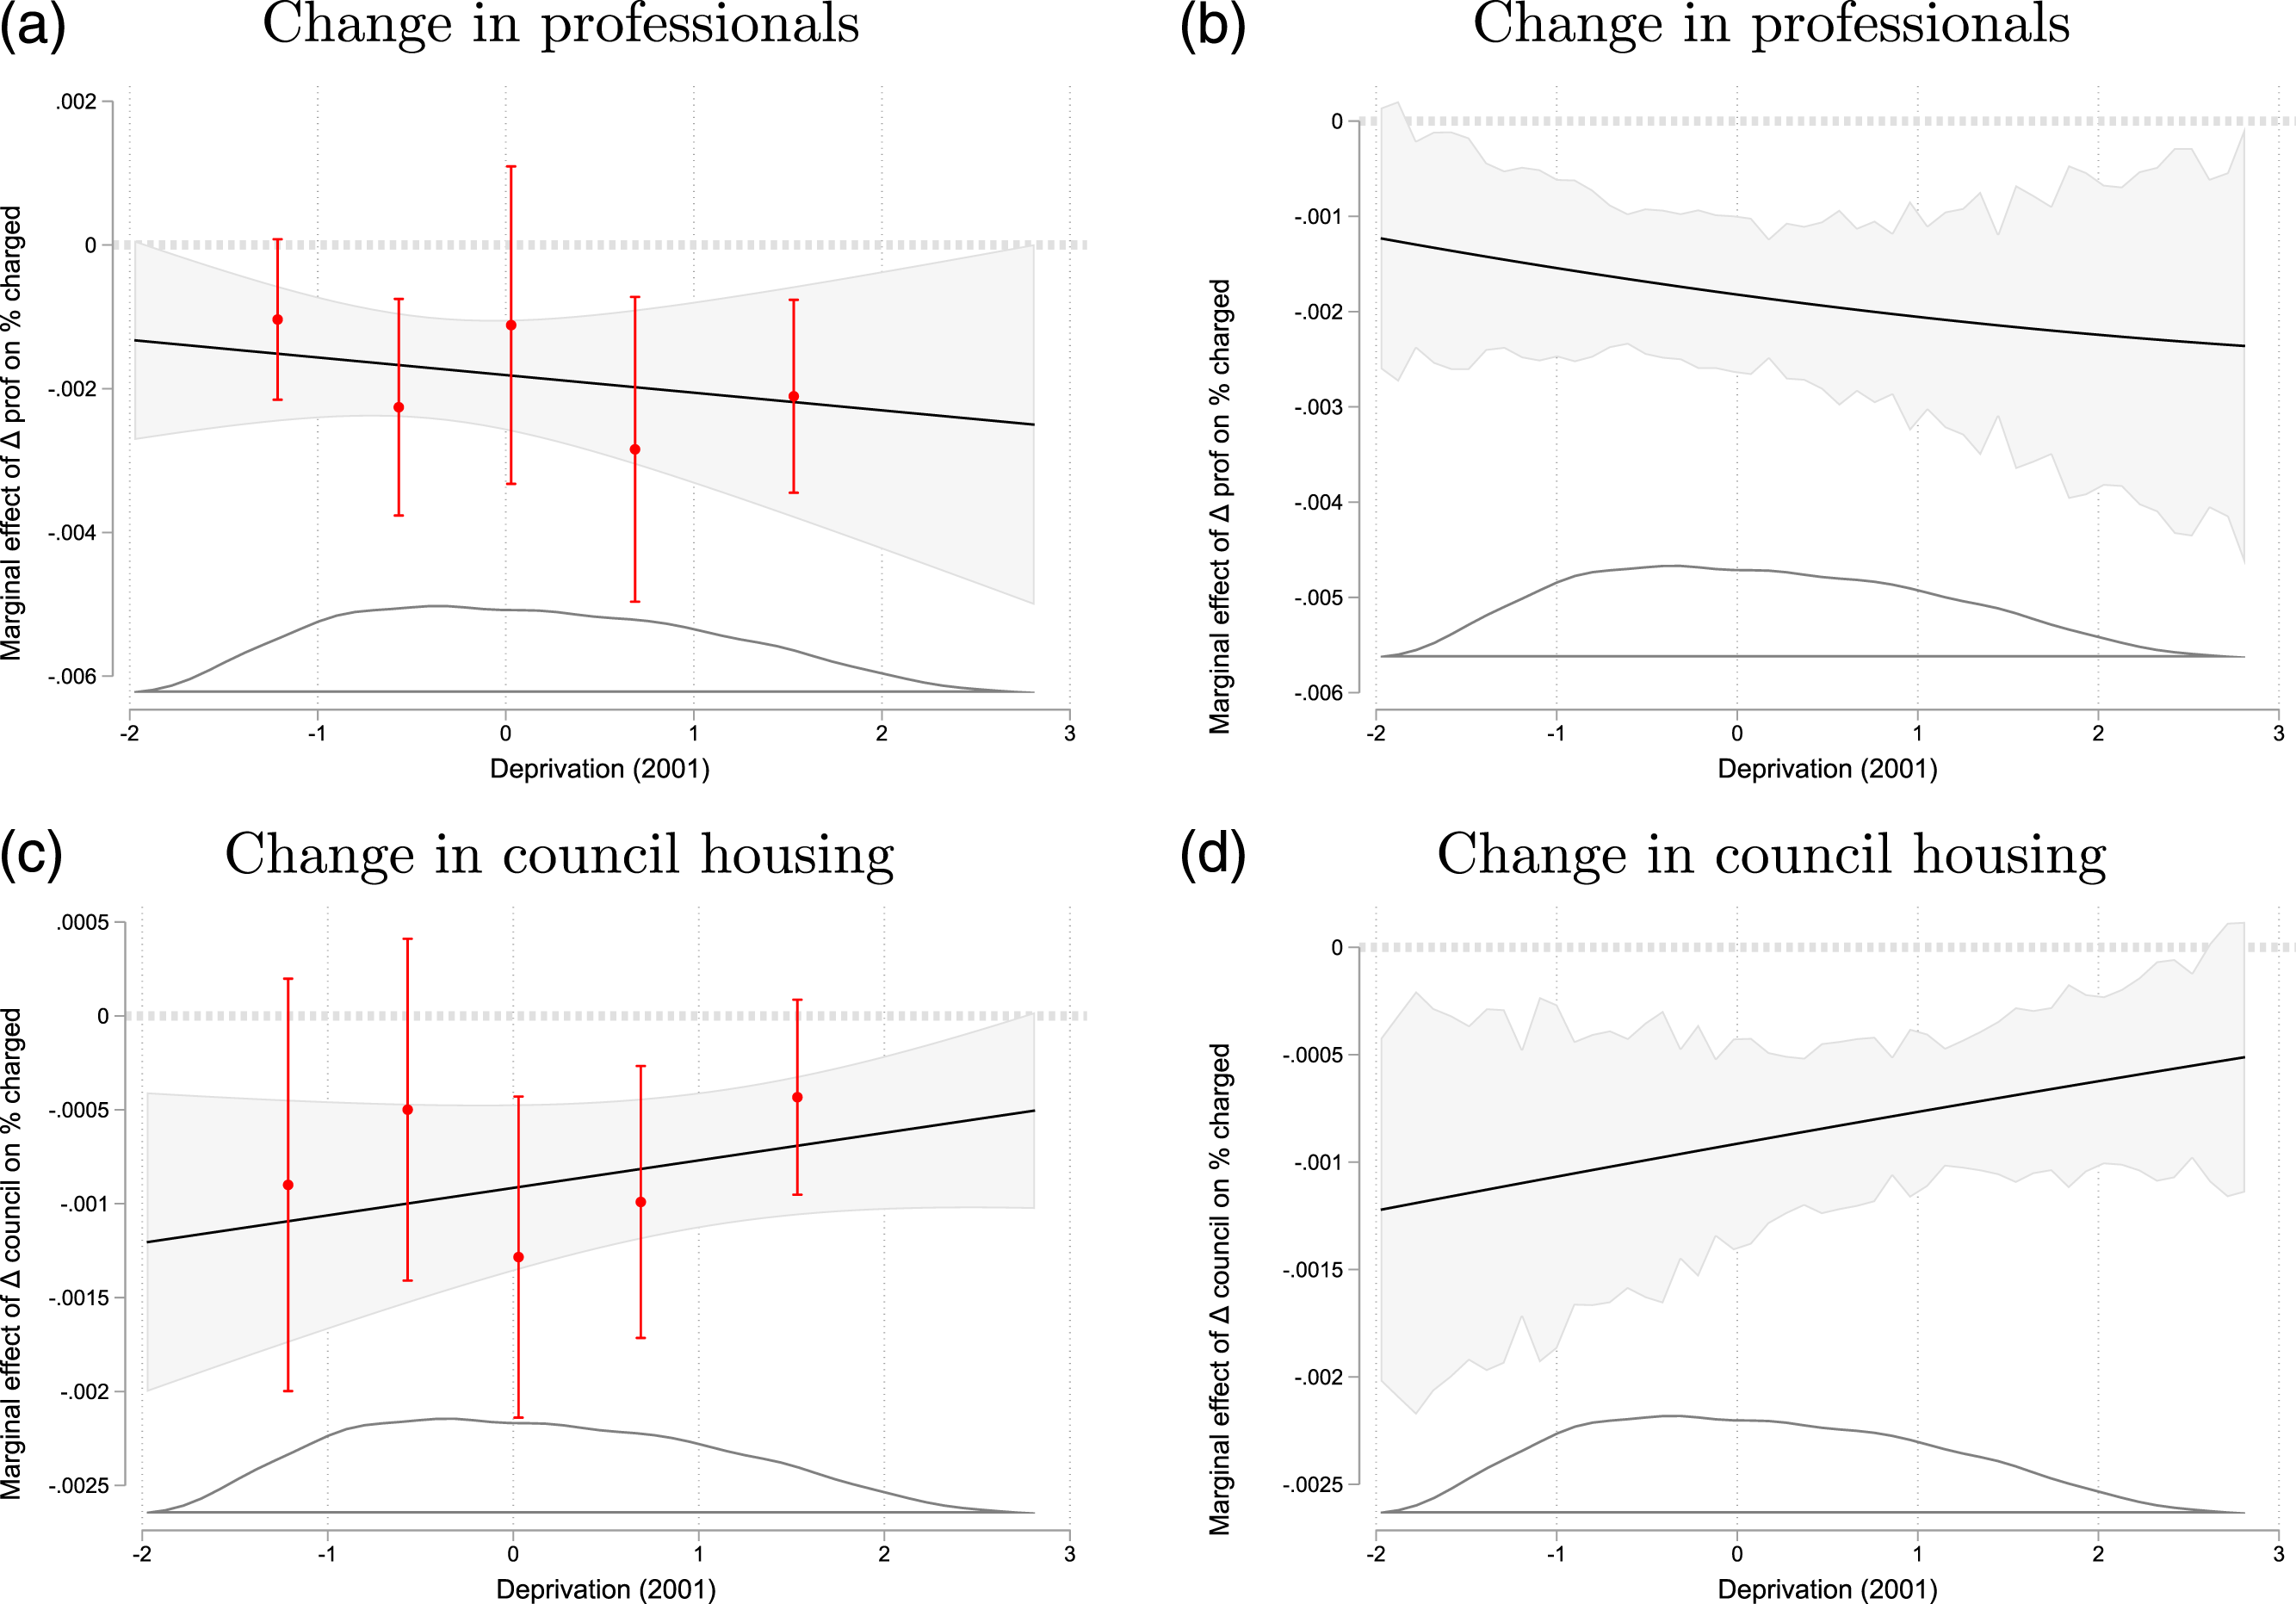
We find that gentrification had a larger effect in areas that gentrified more: there is no evidence that small amounts of gentrification had a disproportionately large effect. In Figure 4 we consider interactions between the gentrification measures and deprivation quintiles using the method developed by Hainmueller, Mummolo, and Xu (2019). This method relaxes the linearity assumption implicit in standard interaction equations and checks for common support across the range of the conditioning variable (e.g. deprivation quintiles). The results show that there is mass throughout the support of the deprivation variable, and that the effect was larger in initially deprived areas. This is consistent with the idea that gentrification reduced participation by reducing deprivation. Non-linearities. The figures show point estimates and 95% confidence intervals. The standard errors are corrected for heteroskedasticity and spatial autocorrelation between the error terms of LSOAs that are within 1 km of each other, following the procedure in Conley (1999). A higher quintile corresponds to greater gentrification in the case of change in professionals and lower gentrification in the case of change in council housing. The omitted category is quintile 1 in panel (a) and quintile 5 in panel (b). The estimates include a full set of controls. The full results can be found in Table A8 in the online appendix. Interactions: The effect of deprivation x gentrification on % charged. The figures show coefficients estimated by interacting gentrification with deprivation in 2001 using the interflex package (Hainmueller, Mummolo, and Xu 2019). Panels (a) and (c) show the conditional marginal effects from a binning estimator (using 5 bins), while panels (b) and (d) use a kernel smoothing estimator. The line at the bottom shows the frequency distribution of LSOA deprivation values. A higher deprivation value means the LSOA is more deprived. The estimation includes a full set of controls. Standard errors are bootstrapped and we show 95% confidence intervals.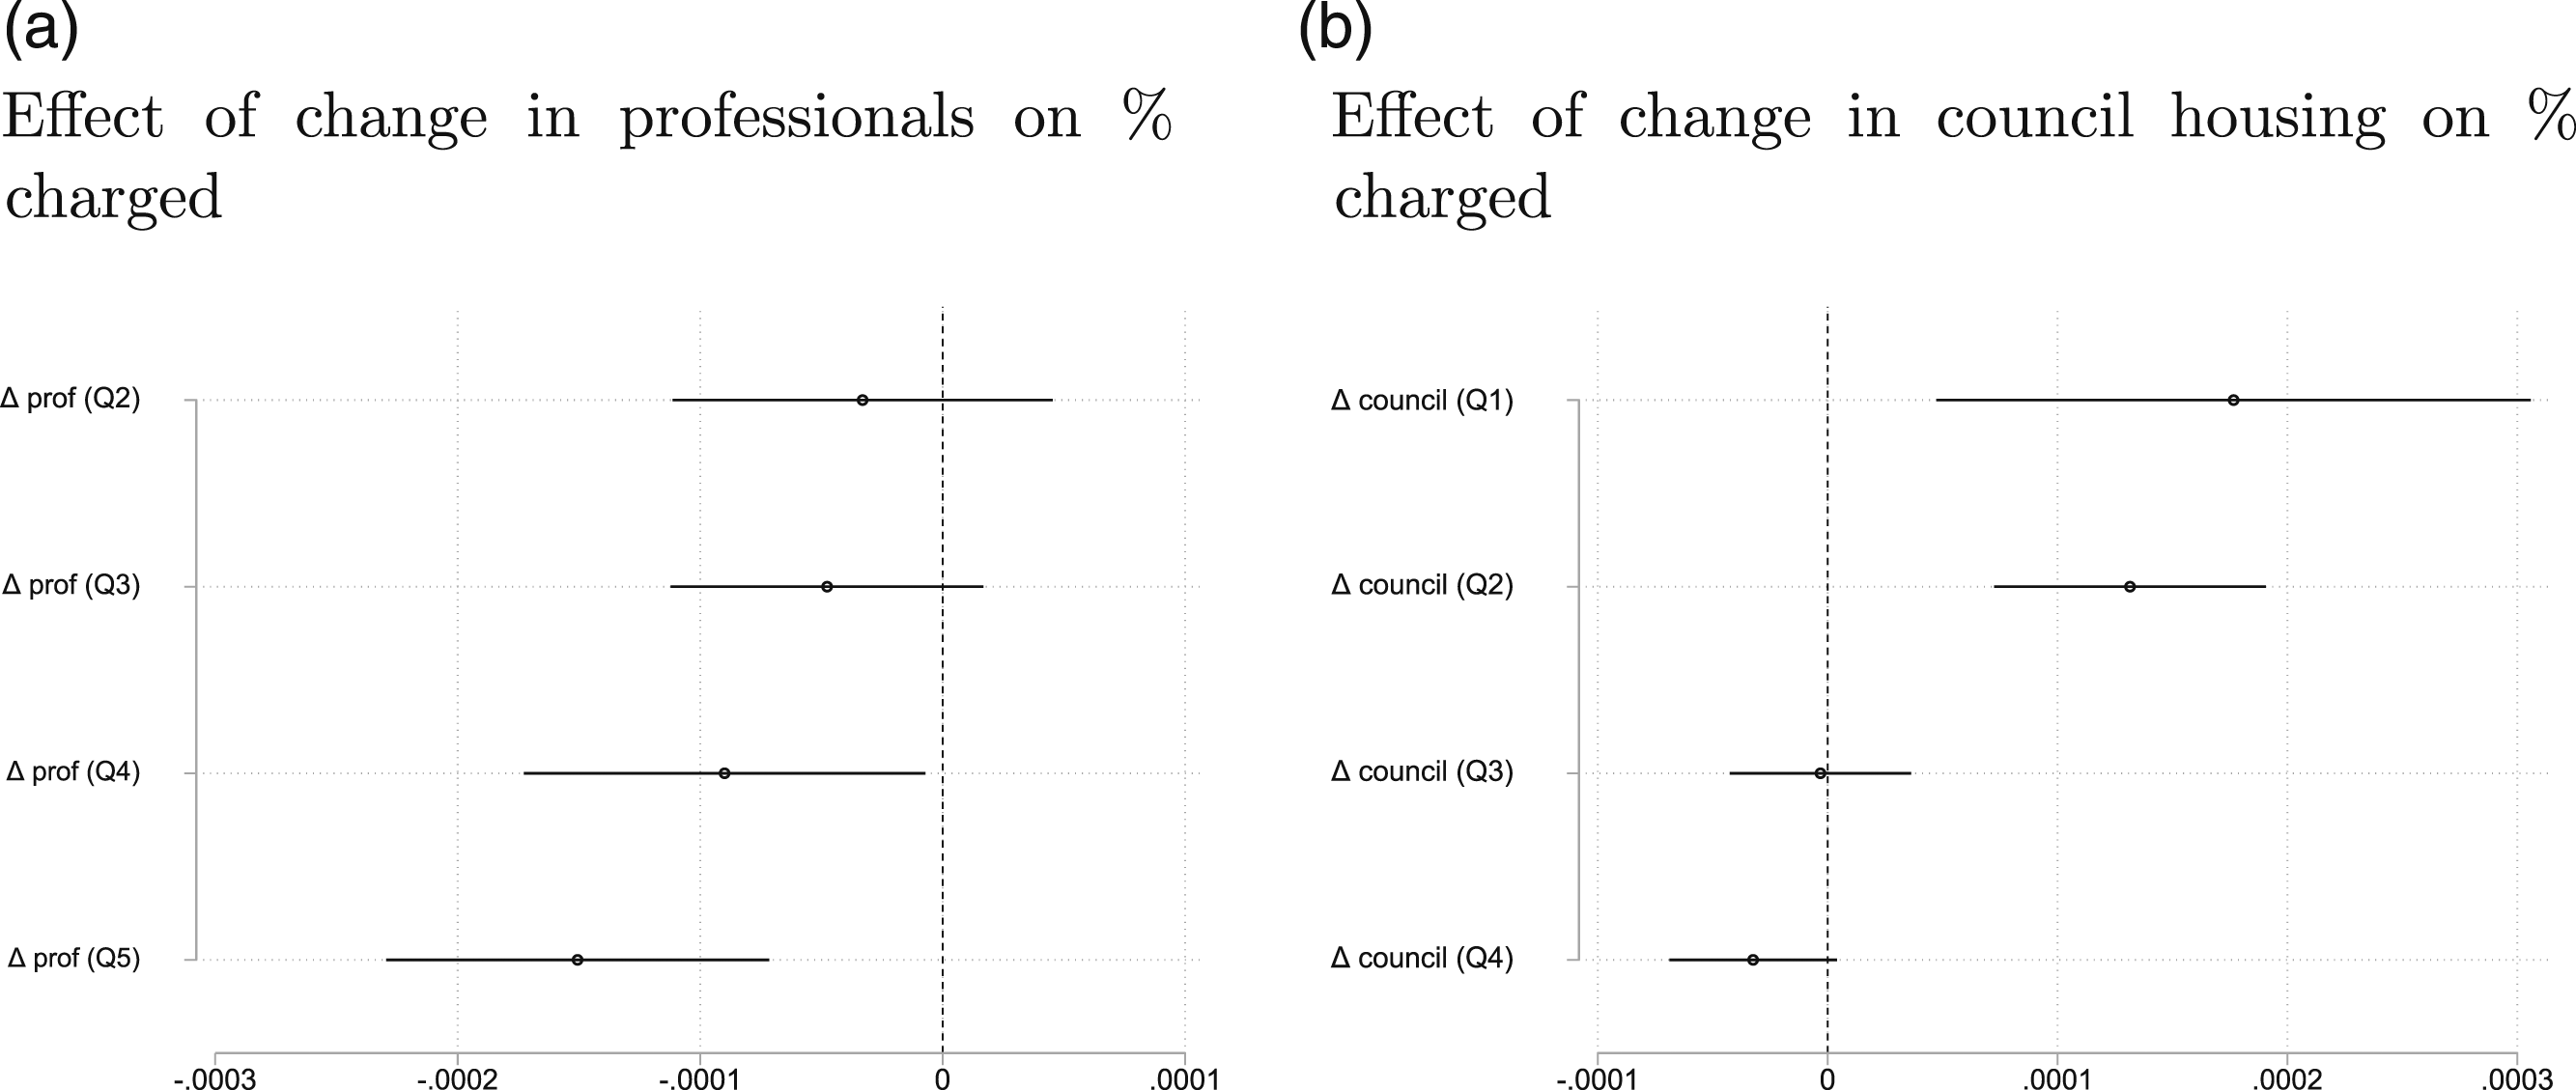
Discussion
We have shown that areas that gentrified in 2001–2011 saw a lower fraction of their residents charged during the 2011 London riots. We interpret this as evidence that gentrification reduced participation. We also showed that the results still hold when we consider the fraction of charged individuals relative to the number of young and the number of individuals with low qualifications, the groups to which most rioters belonged. This suggests the results are not entirely due to changes in social composition, but also to changes in the context in which the participation decision was made.
Previous work has found that gentrification improved the satisfaction of the working-class residents of the affected areas of London. For example, in the gentrifying borough of Hackney, a survey conducted in 2013 found that 88% of those who lived in the gentrifying parts of the borough felt that their neighborhood had improved in the previous 3 years. Even when focusing exclusively on the residents in public housing, a group potentially threatened by gentrification, 83% felt positive about the changes. And for the group of long-term residents, those who had lived in the area for more than 10 years, 52% felt that things had changed for the better (Page 2013). In turn, Morrell et al. (2011) report that how people felt about their community played a part in their decision to participate. For example, they cite a young person from an area that was heavily affected by the riots: “This place is s–t. Boring. Full of scruffy houses and robbing bastards” (p.44), while residents of unaffected areas emphasized the importance of community: “[a]round here it’s a place where everyone pulls together…There are different people but we’re on the same side…You keep your head down and get on with it” (p.44). High levels of satisfaction with their community can help explain why residents of gentrifying parts of a borough were less likely to participate in the riots.
Participants interviewed in the aftermath of the riots blamed gangs for the violence that erupted during the initial protest in Tottenham (Morrell et al. 2011). In Peckham, a neighborhood in south London, the vandalism was started by gangs; Morrell et al. (2011) cite a participant who claims that “all sorts of people [were involved] but gangs led and did the breaking in then others followed afterwards. People turned on, and robbed, each other.” To the extent that gentrification undermined the organization and leadership of these gangs, it may have hindered their efforts to mobilize potential rioters.
Gentrification often leads to an increase in police activity, typically as a result of demand by the gentrifiers. This increase in police activity appears to have had mixed effects in London. On the one hand, the presence of police during the riots caused participants to disperse and move to other locations (Baudains, Johnson, and Braithwaite 2013b), and “[y]oung people did describe becoming aware of a “hardening” of police tactics during the course of the riots in some areas. Once the police intervened more strongly, people began to disperse as they realised the risks associated with their involvement were increasing” (cited in Morrell et al. (2011), p.41). Private spaces with high levels of private security, for example in the financial district of Canary Wharf, proved to be less attractive for looters (Morrell et al. 2011). On the other hand, police activity both before and during the riots caused anger and resentment. The practice of stop and search and the way it was conducted were key factors in generating resentment towards police, and have been cited as important causes of the riots (Newburn et al. 2018). Many of the individuals interviewed after the riots cited police brutality and a negative experience of police as reasons for their participation (Morrell et al. 2011). 35 For example, “One reason for the riots is anger with the police” and “police treats you differently in Peckham than in Westminster – more polite in Westminster, while in Peckham they arrive in riot vans…” (cited in Morrell et al. (2011), p. 32). Likewise, Lewis et al. (2011) write that 85% of the participants who were interviewed after the riots reported policing as an important or very important cause of the riots. In short, it seems unlikely that the effect of additional police was to reduce participation; if anything, it appears to have increased it.
These results also improve our understanding of how different factors can affect urban rioting. First, we show that both changes in social composition and in the context in which the participation decision is made are important. 36 Second, local context matters and helps determine the spatial distribution of riots, even in a city-wide wave of unrest like the 2011 London riots. Finally, gentrification often leads to the economic development of an area, which in turn affects deprivation. One way to read our results is that we exploit exogenous variation in gentrification to generate exogenous variation in economic development and deprivation (captured by the change in professionals and the change in council housing, respectively), which allows us to estimate the causal effect of changes in economic development and deprivation on participation in urban riots.
Conclusions
We examine the relationship between gentrification and participation in the 2011 London riots. We show that areas that had recently gentrified had lower participation, consistent with our main hypothesis, and that this lower participation was due to a change in social composition and of the context in which the participation decision was made.
The specifics of our case allow us to address the endogeneity problem with an instrumental variable strategy, yet our results should apply more widely. Florida (2017, ch.7) describes London as a patchwork metropolis; that is, a city where neighborhoods of different types are located in close proximity to each other. According to Florida (2017, ch.7), this also describes New York, Chicago, Toronto, San Francisco, Boston and Washington DC; and since these cities have experienced gentrification patterns similar to those in London, our results should have relevance for these cities too. Future work should focus on employing causal identification strategies to examine the extent to which gentrification affects social unrest, and politics more generally, in these cities. Another area where more work is needed is in testing the likely mechanisms that link gentrification to urban riots. We have discussed some possibilities and made reference to qualitative studies that have examined these links, but unfortunately the data necessary to test for them is not currently available for London. Finally, the main losers from gentrification are those individuals who are forced to move out of an area, but what happens to them is a question that remains largely unanswered.
This study provides quantitative evidence for how gentrification can affect participation in a riot. In doing so, it uncovers a connection between urban change and social unrest. Furthermore, it is likely that gentrification affects other types of political behavior too, including peaceful protest and voting. The changes taking place in the world’s major cities have profound political consequences.
Supplemental Material
Supplemental Material - Gentrification and Social Unrest: The Blitz, Urban Change and the 2011 London Riots
Supplemental Material for Gentrification and Social Unrest: The Blitz, Urban Change and the 2011 London Riots by Gabriel Leon-Ablan and Juta Kawalerowicz in Journal of Conflict Resolution
Footnotes
Acknowledgements
We wish to thank the audiences at the Central European University, Essex, Linköping, Trondheim, MPSA, NEPS and EPSA for their helpful comments. We are grateful to Sarah Birch, Kristian S. Gleditsch, Peter John, John Meadowcroft, Anja Neundorf, Håvard Nygård, Toni Rodon, Adam Scharpf, David Skarbek and Tore Wig for their comments. We thank Jonathan Higgs for his excellent research assistance. All replication materials are available from the journal website.
Declaration of Conflicting Interests
The author(s) declared no potential conflicts of interest with respect to the research, authorship, and/or publication of this article.
Funding
The author(s) received no financial support for the research, authorship, and/or publication of this article.
Supplemental Material
Supplemental material for this article is available online.
Notes
References
Supplementary Material
Please find the following supplemental material available below.
For Open Access articles published under a Creative Commons License, all supplemental material carries the same license as the article it is associated with.
For non-Open Access articles published, all supplemental material carries a non-exclusive license, and permission requests for re-use of supplemental material or any part of supplemental material shall be sent directly to the copyright owner as specified in the copyright notice associated with the article.