
Abstract
This paper presents a comprehensive study on numerical modelling and experimental analysis of polyisocyanurate (PIR) foam core sandwich panels loaded in shear. The shear beam test method follows the guidelines set by EN 14509:2013, while an alternative test setup using four-point loading is explored. Detailed constitutive modelling of PIR foam with failure based on the Rankine criterion is presented, supported by the necessary experiments for material characterization. The shear beam tests are simulated by the finite element method. The developed simulation model is validated against material and shear beam tests and subsequently employed for an in-depth analysis of the behaviour of the specimens up to failure. In particular, shear stresses and localized transverse compression stresses are examined. The combined experimental and numerical results demonstrate that the four-point loading configuration yields higher and more representative shear strength values than the standard two-point setup, primarily due to reduced local indentation and compressive failure beneath the loading plates. The finite element model reliably captures stress distributions and elucidates local effects during specimen loading. Consequently, the constitutive and finite element models presented in this study provide a solid foundation for advanced analysis of sandwich panels.
Introduction
Sandwich panels with polymeric foam core are widely used in the construction industry due to their excellent thermal insulation, lightweight, and structural performance. In sandwich panels, bending stresses are primarily resisted by the facings, while the core carries most transverse shear stresses. 1 The adhesion between the facings and the core plays a crucial role in force transfer, making bonding strength a key factor in enhancing the panel’s overall performance. 2 Under normal service loads, core shear failure and debonding of the face-core interface are among the common failure modes in construction applications of sandwich panels with low-density foam as the core material.3,4,3 With advancements in production technology and increasing demand for high-performance panels, the maximum available thickness of sandwich panels in the construction market has been increasing, being currently about 200 mm for PIR-core panels. This increase in core thickness significantly enhances the panel’s shear resistance. Recent studies show that different core configurations, such as foam-filled chiral honeycombs 5 or chopped fibre-reinforced laminates, 6 can significantly enhance sandwich panel performance. This makes it crucial to carefully examine test methods to ensure they accurately capture the shear behaviour of both conventional and advanced cores.
Commonly used test methods to determine the shear properties of core materials include the single block shear test, the double-lap shear test, and the shear beam test. 7 Of these, the shear beam test is particularly notable as it assesses the sandwich specimen under conditions that closely simulate real in-service loading, providing a more realistic measurement of the core’s shear properties. A key parameter of the shear beam test is the length of the specimen, which should be chosen such that the shear of the core is the governing failure mode. Various standards are available to conduct the shear beam test such as the American ASTM D7250 and C3938,9 and the European EN 14509:2013, 10 which is used as the reference standard in this study. EN 14509:2013 also provides provisions for determining the shear properties of sandwich panels used in construction.
In a previous study by the authors, 11 the performance of the shear test methods of EN 14509:2013 was assessed through a comprehensive testing campaign. Several interesting observations were made when comparing the so-called two-point loading and four-point loading shear beam test methods. The test results showed that, for thicker sandwich panels, the four-point loading test yielded a higher shear strength than the two-point loading method. Moreover, although the specimens failed in visible shear during the experiments, preliminary failure modes were observed in some specimens prior to crack initiation, which led to final failure. It was deduced that a key factor contributing to these preliminary failure modes is the compressive stress in the core acting below the loading points. Failure occurs due to a combination of flexural and shear stresses, primarily under the load introduction region. 12 In the four-point loading test, the use of a wider load spreading plate minimized the likelihood of local indentation or buckling beneath the loading points. This allowed the sandwich beam to resist higher shear stresses, leading to failure primarily due to shear rather than other failure modes. Additionally, the compressive stresses of the core above the support points can influence the value of shear strength obtained from the experiment. These compressive stresses are not typically accounted for in the shear strength calculations, which could impact the accuracy of the results and the obtained shear strength values may not correspond to the pure shear stress resisted by the core.
Numerical simulations by the finite element method (FEM) provide a valuable tool to gain a better understanding of the observations encountered in laboratory experiments and to describe the shear behaviour of sandwich panels better. In this paper, a detailed finite element model is proposed that captures the behaviour of sandwich panels in the two-point and four-point loading tests. The study investigated sandwich panels with PIR foam cores (nominal density 37 kg/m3), including flat-faced wall panels and profiled roof panels, with core thicknesses ranging from 100 mm to 200 mm. These panels were manufactured continuously in an industrial setting, featuring thin steel facings (S280GD grade) of variable thickness depending on panel type, bonded to the PIR cores. The key contributions of this study are to provide a nonlinear elastic-plastic material model of PIR, which is calibrated by laboratory tests, and to incorporate a shear failure model based on the maximum principal stress criterion into the simulation that is able to predict cracking of the core accurately. The essential contributions enable reliable and detailed analysis of shear beam specimens, providing new insights into the differences between the two-point and four-point loading methods. Such analysis is performed in this study to complement the observations of the experiments reported earlier.
Materials and specimens
The test specimens comprised two types of sandwich panels: flat wall panels and strongly profiled roof panels, as depicted in Figure 1. The flat panels had thicknesses of 100 mm and 200 mm, while the profiled panels had core thicknesses of 100 mm and 170 mm. Both panel types featured thin internal and external steel facings with a PIR core. The nominal density of the PIR foam was 37 kg/m3. Sandwich panel types used for the tests; (a) Flat panels, (b) Profiled panels.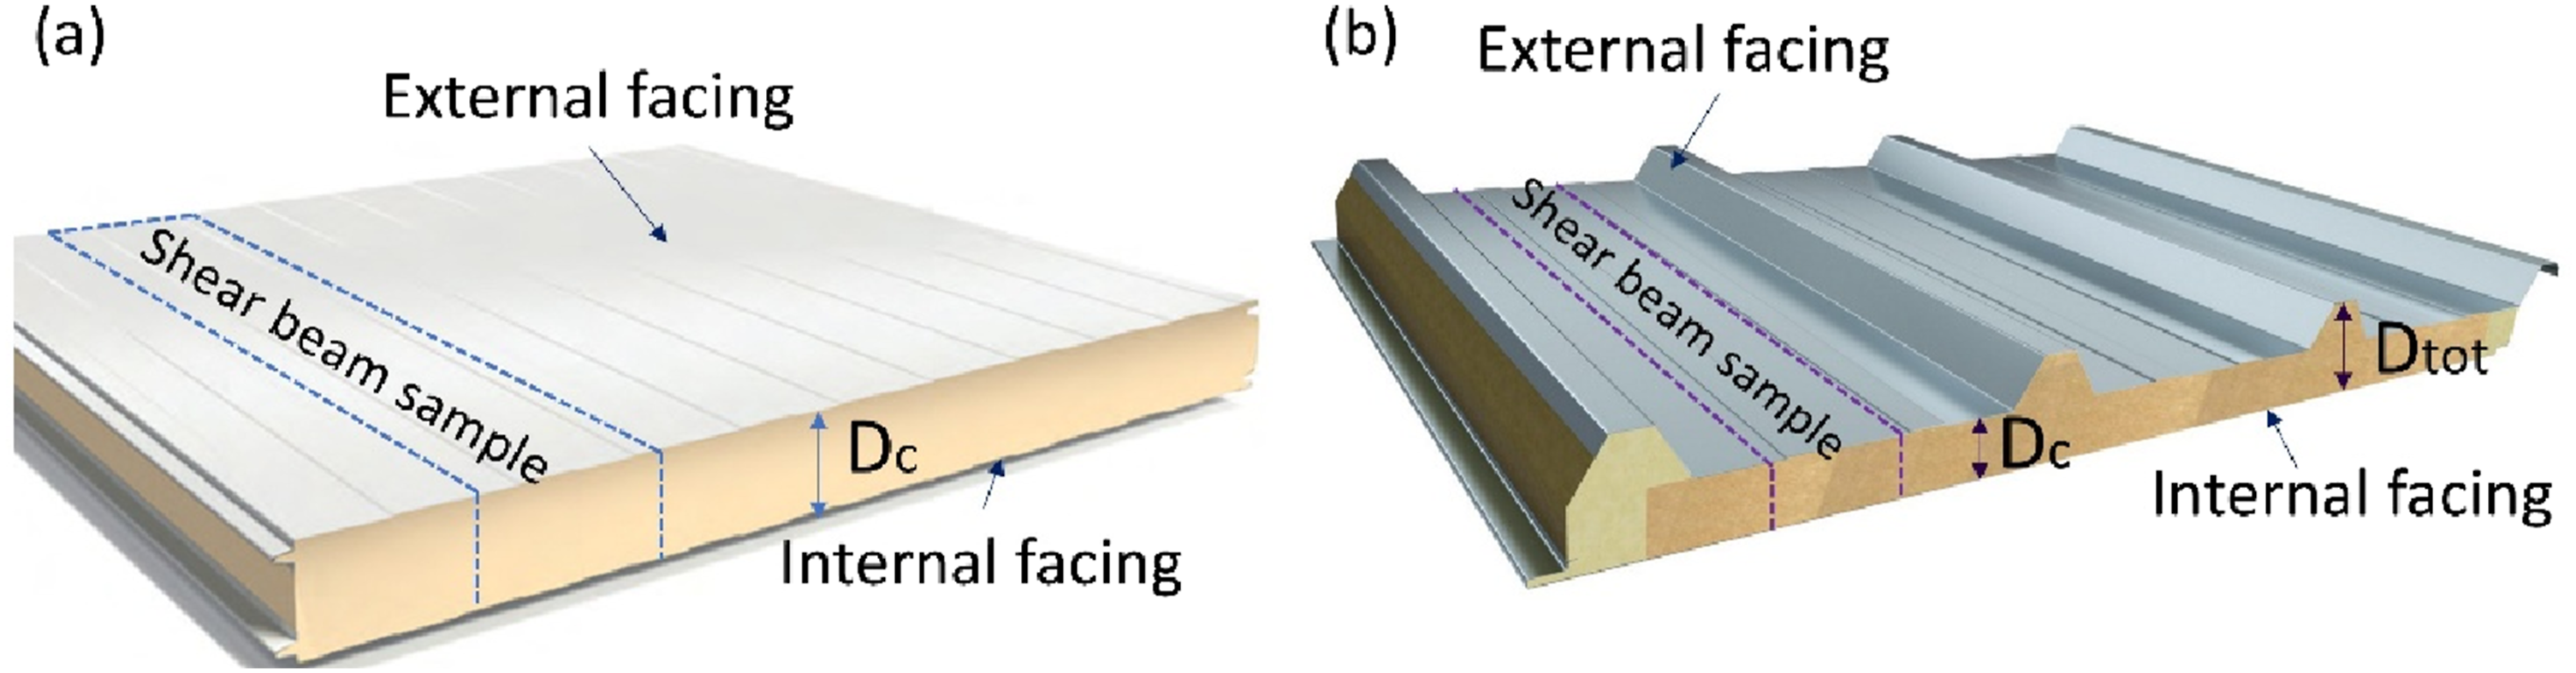
Test panel types with their measured core thickness (D c ), mean PIR core density (ρ) (± standard deviation), the thickness of outer (T F1 ) and inner (T F2 ) steel faces (with nominal values in parentheses) and their corresponding yield strength (ReHF1) and (ReHF2).
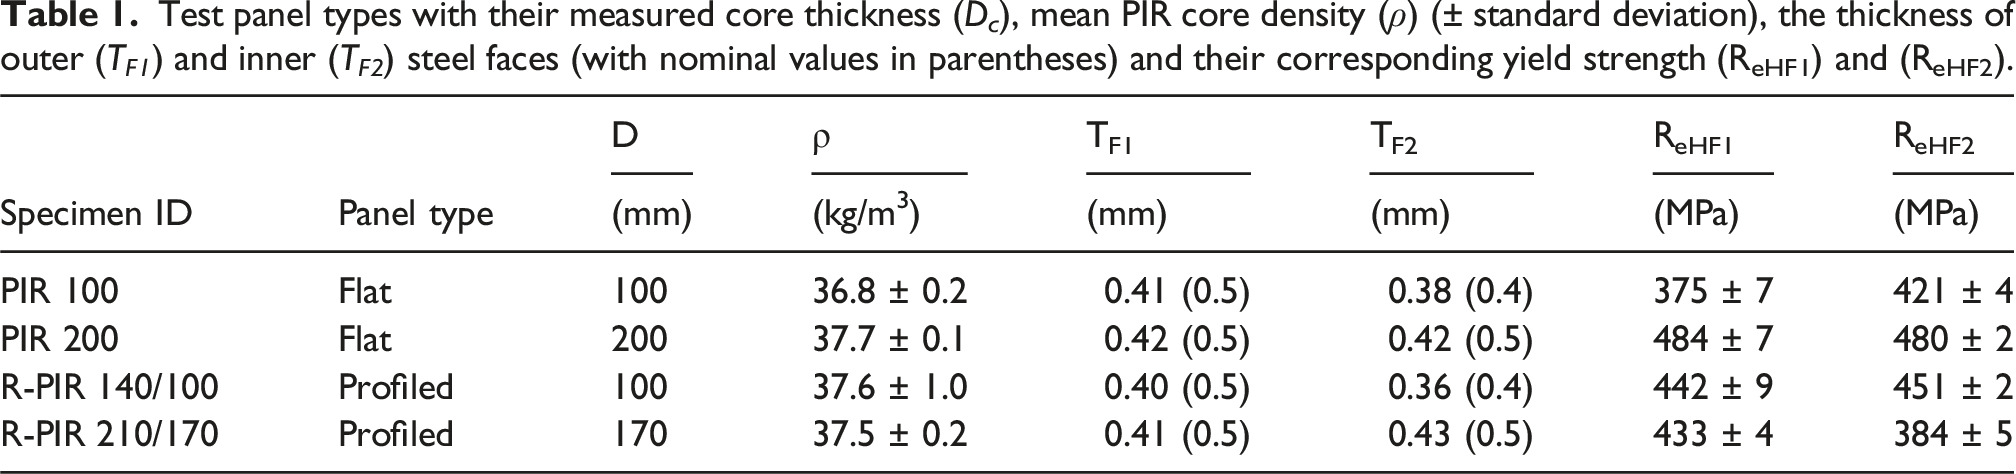
In the table, “R-PIR 140/100” refers to a roof panel with ‘140 mm’ total thickness, D tot (see Figure 1), including the profiled part and 100 mm core thickness between the flat parts of the faces. The same naming convention applies to R-PIR 210/170. The values in parentheses for the facing thickness indicate the nominal thickness before the removal of the coating layer. For the preparation of the shear beam test specimens, beams were cut from full-size sandwich panels. In the case of flat wall panels, each beam was extracted at a random location across the panel width, as shown in Figure 1(a). For the profiled roof panels, the specimens were cut only from the flat region between the profiles, as shown in Figure 1(b).
Experimental program
Mechanical characterization of PIR foam
The compressive and tensile strength of the PIR core and the corresponding E-modulus were determined according to the instructions provided in EN 14509:2013 using eight specimens per test. Specimens were cut into cubes with side dimensions larger than the core thickness, stored at room temperature for at least 48 h, and inspected for defects before testing. Cross-sections were measured using a calibrated vernier calliper (accuracy 0.01 mm) according to EN 12,085.
15
The test setup, along with a typical force-displacement curve of the compression test is depicted in Figure 2(a), where the compressive yield stress of the foam, σ
y
, was determined by identifying the intersection point between the extrapolation of the linear elastic region and the plateau region. The tensile test setup, along with the typical force-displacement curve is shown in Figure 2(b). A shear lap test was performed on PIR foam following the test setup outlined in Clause 7 of EN 12090:2013
16
to determine its shear strength. Three shear lap tests were conducted for each panel type, R-PIR 140/100 and R-PIR 210/170, using only the PIR foam from the sandwich specimen. The test samples measured 100 mm × 95 mm × 20 mm and details of the shear lap test setup are outlined in Ref. 17 Material test of Sandwich components: (a) PIR core compression test, (b) PIR core tensile test, (c) Shear-lap test of PIR foam, (d) Steel facing Coupon test.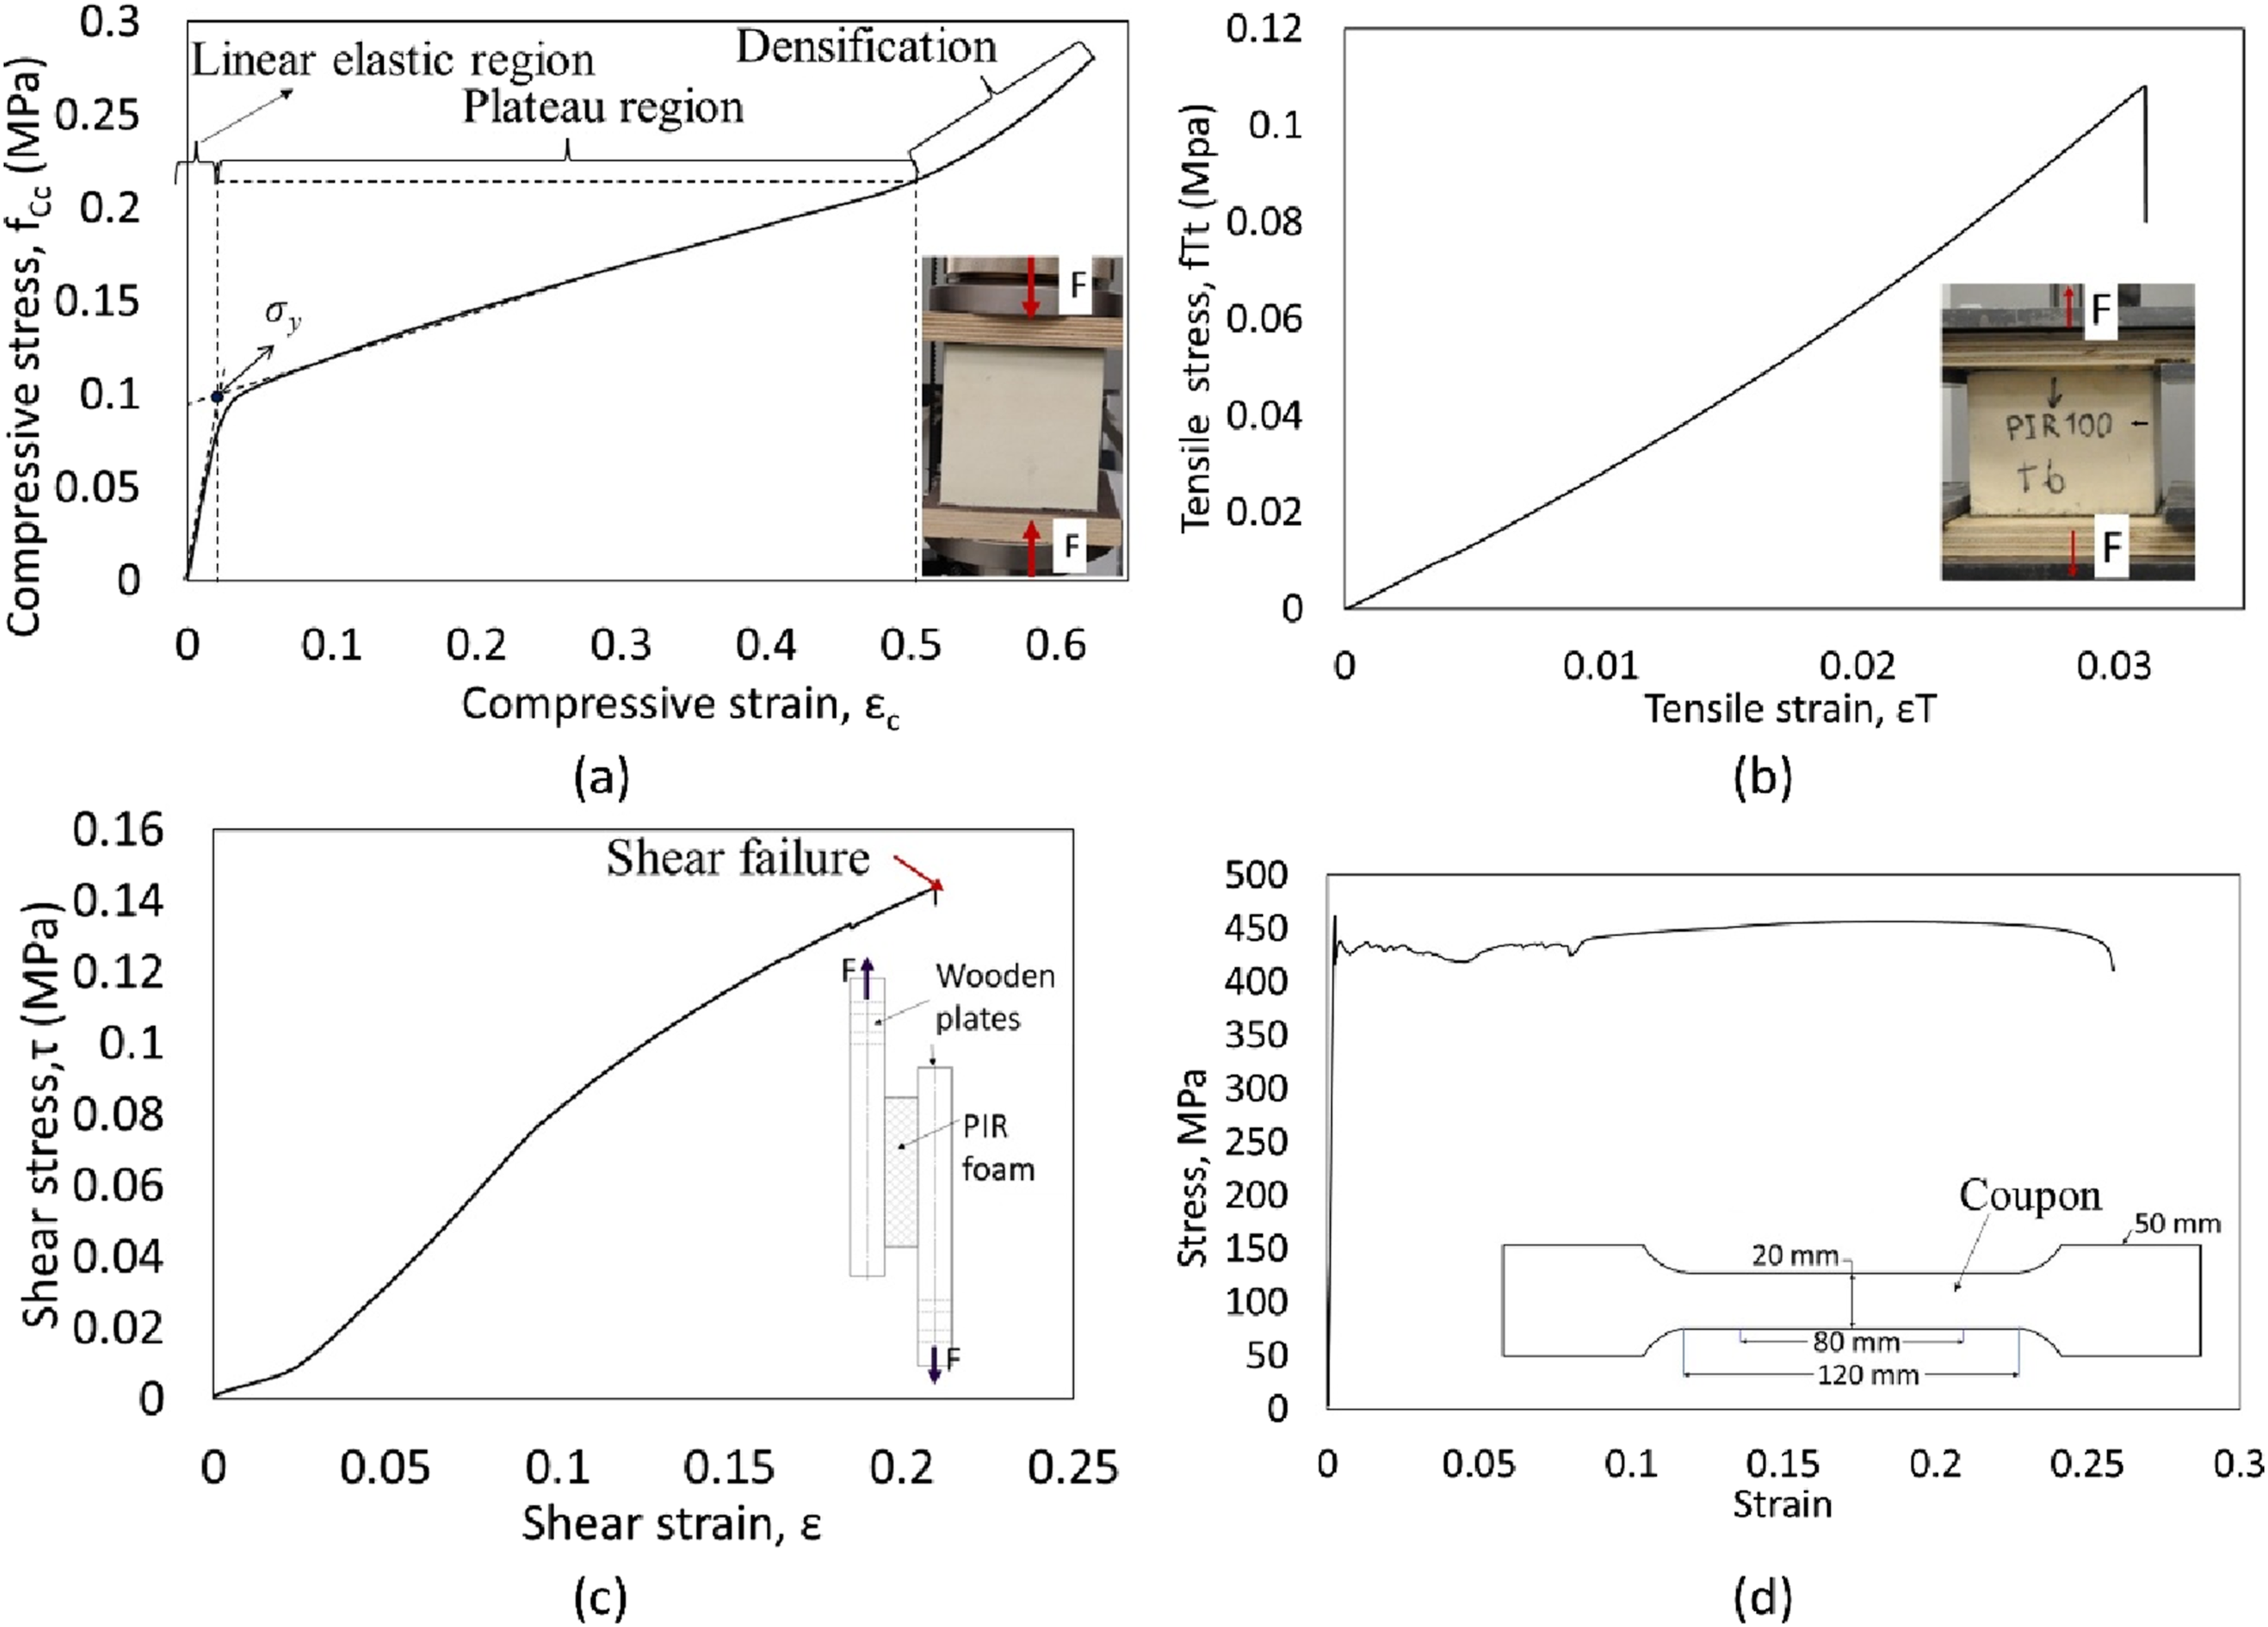
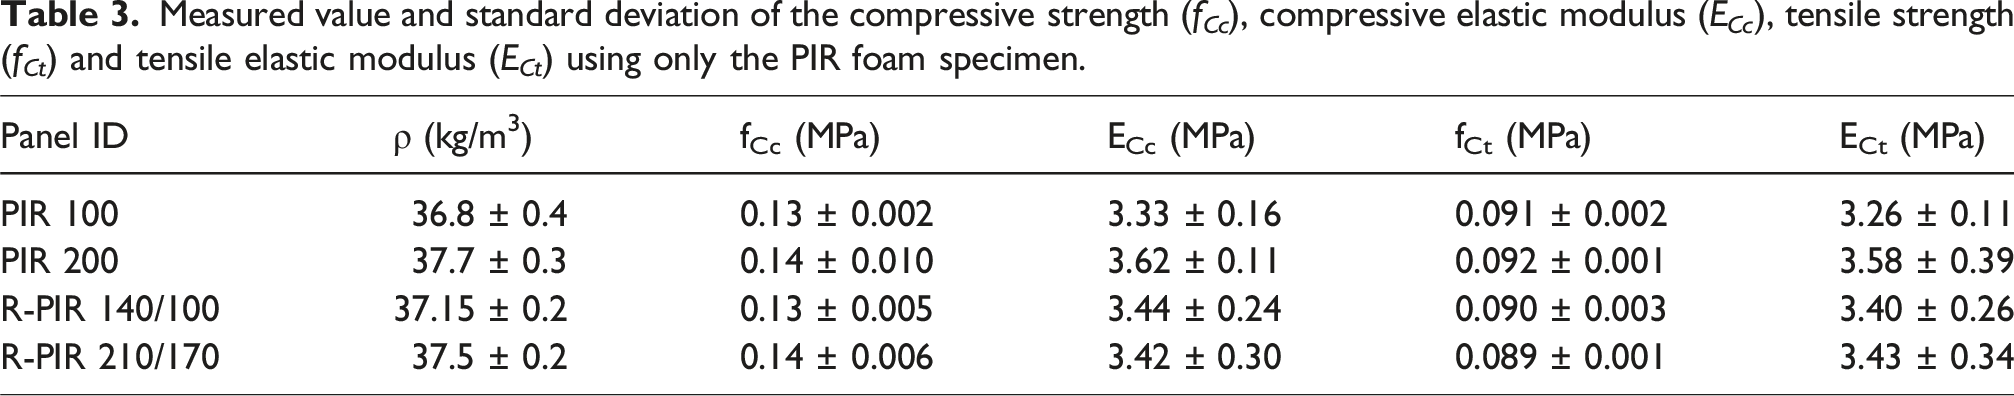
Mean values and standard deviations of the compressive strength (f
Cc
), compressive elastic modulus (E
Cc
), tensile strength (f
Ct
), tensile elastic modulus (E
Ct
) and shear strength (F
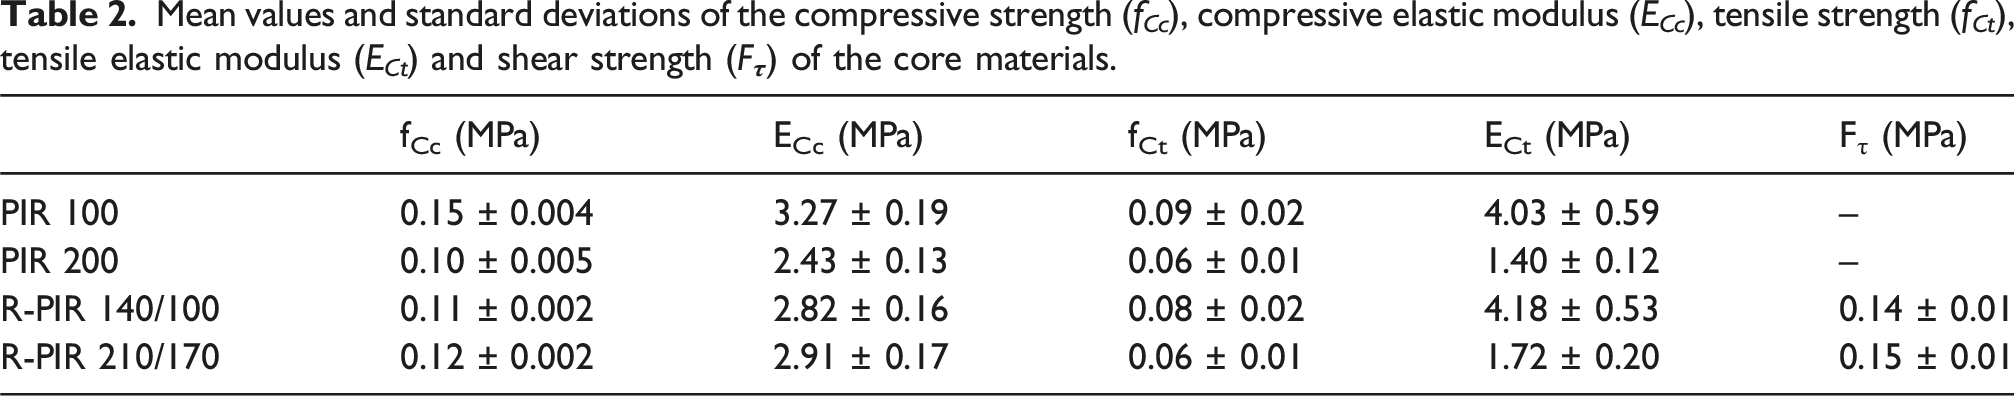
Measured value and standard deviation of the compressive strength (f Cc ), compressive elastic modulus (E Cc ), tensile strength (f Ct ) and tensile elastic modulus (E Ct ) using only the PIR foam specimen.
Confined compression test of PIR foam
In this study, the so-called crushable foam material model
18
is employed for PIR. This material model requires parameter k, which is the ratio of yield stress in uniaxial compression, Test setup: (a) Confined compression test, (b) Measurement of coefficient of friction.
A rigid steel chamber with inner dimensions of 100 mm × 100 mm × 110 mm and a wall thickness of 20 mm was used to conduct a confined compression test. The chamber was designed to prevent lateral expansion of the foam during compression. A cubic PIR foam sample (100 mm × 100 mm × 100 mm) was precisely cut to match the inner dimensions, ensuring no gaps between the foam and the chamber to maintain full confinement. A steel indenter was placed on the top of the foam specimen, and a displacement-controlled load was applied using a Zwick Roell tensile testing machine at a constant speed of 3 mm/min. Load and displacement data were continuously recorded until the specimen was compressed to 80% of its original thickness. During the test, the foam was in tight contact with the chamber walls, causing the load cell to record both compressive and frictional forces.
To accurately plot the stress-strain response, the effect of friction must be reduced. Therefore, the static coefficient of friction, μs, between the steel plate and PIR foam was measured using an inclined plane test as shown in Figure 3b. In this test, the PIR sample was placed on a steel plate, and the plate was gradually tilted until the specimen began to slide. The angle of inclination, θ, at which sliding occurred was recorded, and μs was calculated as μs = tan(θ). The frictional force, F
f
, between the chamber wall and PIR foam was subtracted from the total force applied, F
tot
, to calculate the compressive force, F
C
, during confined compression as:
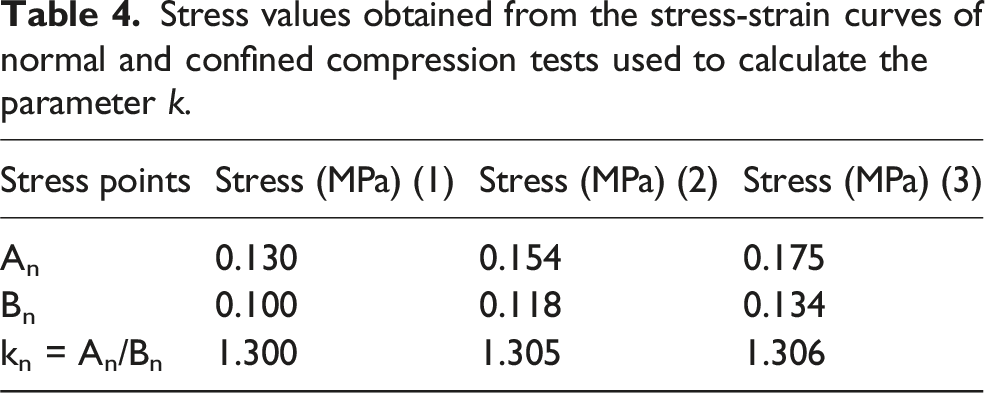
To determine the parameter k, the stress-strain curves obtained from both the uniaxial compression test and confined compression test, as shown in Figure 4b, are considered. Three distinct points (A
1
, A
2
, A
3
) from the uniaxial compression test and (B
1
, B
2
, B
3
) from the confined compression test were selected within the plateau region of the foam’s stress-strain curve, ensuring that each pair of points, (A
n
, B
n
), had equal strains. Generally, the foam is expected to exhibit similar behaviour under both test conditions within this plateau region. Therefore, the ratio of the stress from the uniaxial compression test to the stress from the confined compression test, A
n
/B
n
, for each pair of points, should yield a similar value of k. (a) The isotropic crushable foam yield surface in the p-q stress plane, (b) Comparison of stress-strain curves for normal compression and confined compression test of PIR foam.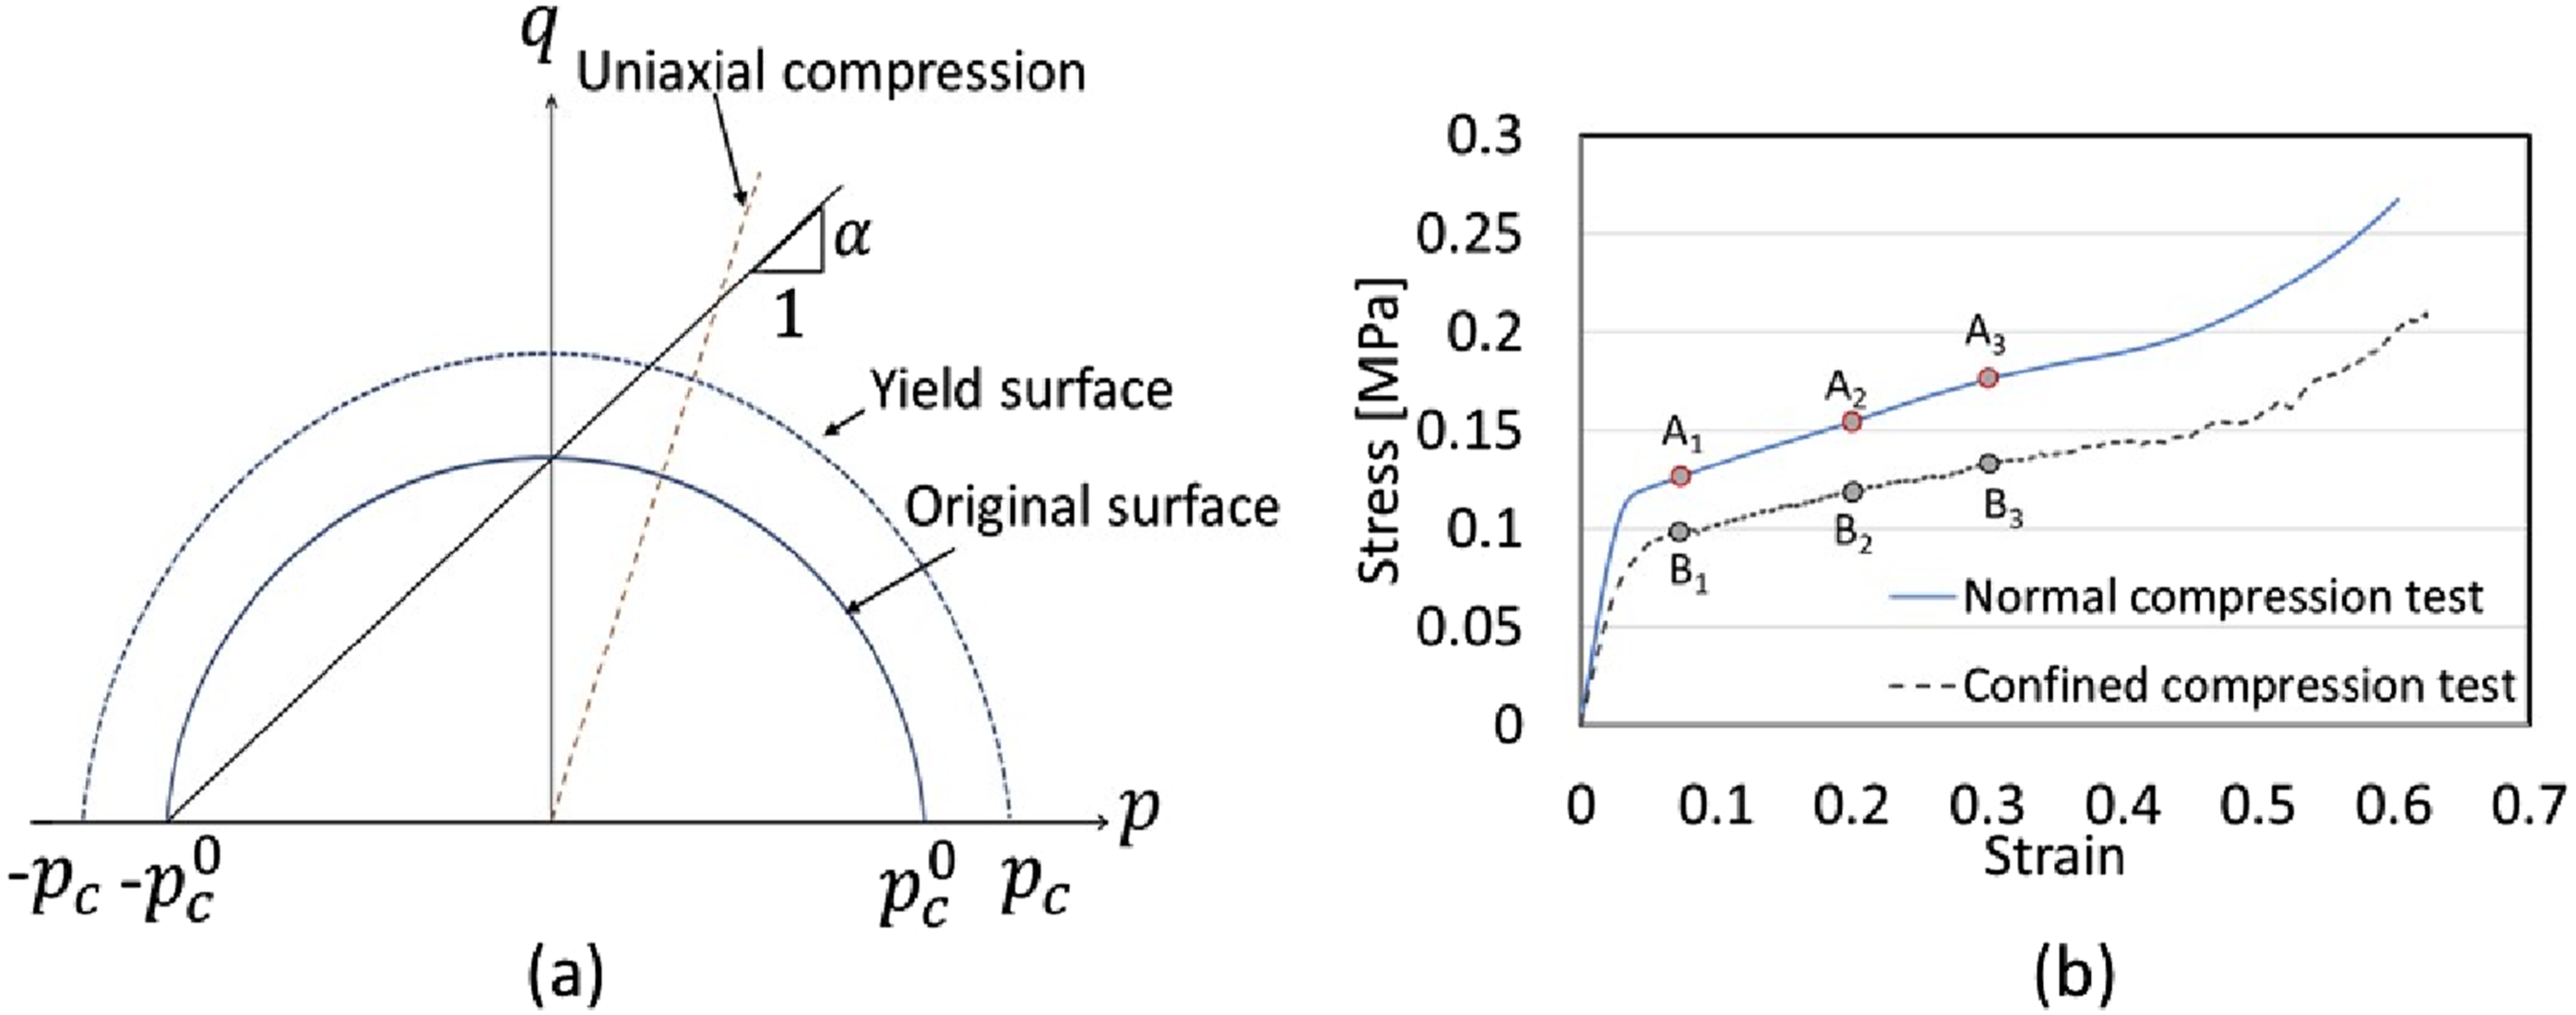
Stress values obtained from the stress-strain curves of normal and confined compression tests used to calculate the parameter k.
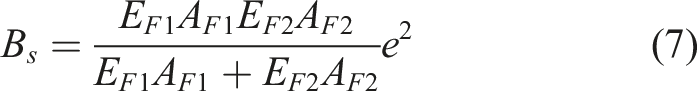
Alternatively, the value of k can also be evaluated using the shear strength, F
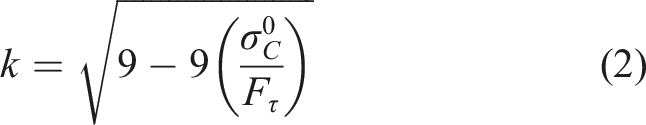
Using the measured PIR foam properties from Table 3 in equation (2), the mean yield stress ratio, k, was determined to be approximately 1.28. This value closely aligns with the result obtained from the confined compression test as shown in Table 4. While the value of k derived from the confined compression test is generally recommended and also adopted in this study, the results suggest that the shear lap test offers a practical alternative when a confined compression test setup is unavailable.
Shear beam test
Shear beam tests were conducted to determine the shear strength and shear modulus of sandwich panels. Two loading configurations were studied in this research: two-point loading and four-point loading. This section provides a general overview of the test setup and the analytical solution for calculating the shear strength and shear modulus of the sandwich beam. Detailed information on the experimental investigation is presented in previous work. 11
Two-point loading test
A two-point loading shear beam test (known as a four-point bending test in general literature) was conducted following the European standard EN 14509:2013.
10
Figure 5(a) depicts a schematic of the two-point loading test setup alongside a photograph taken during testing. Schematic of shear beam test methods: (a) Two-point loading, (b) Four-point loading.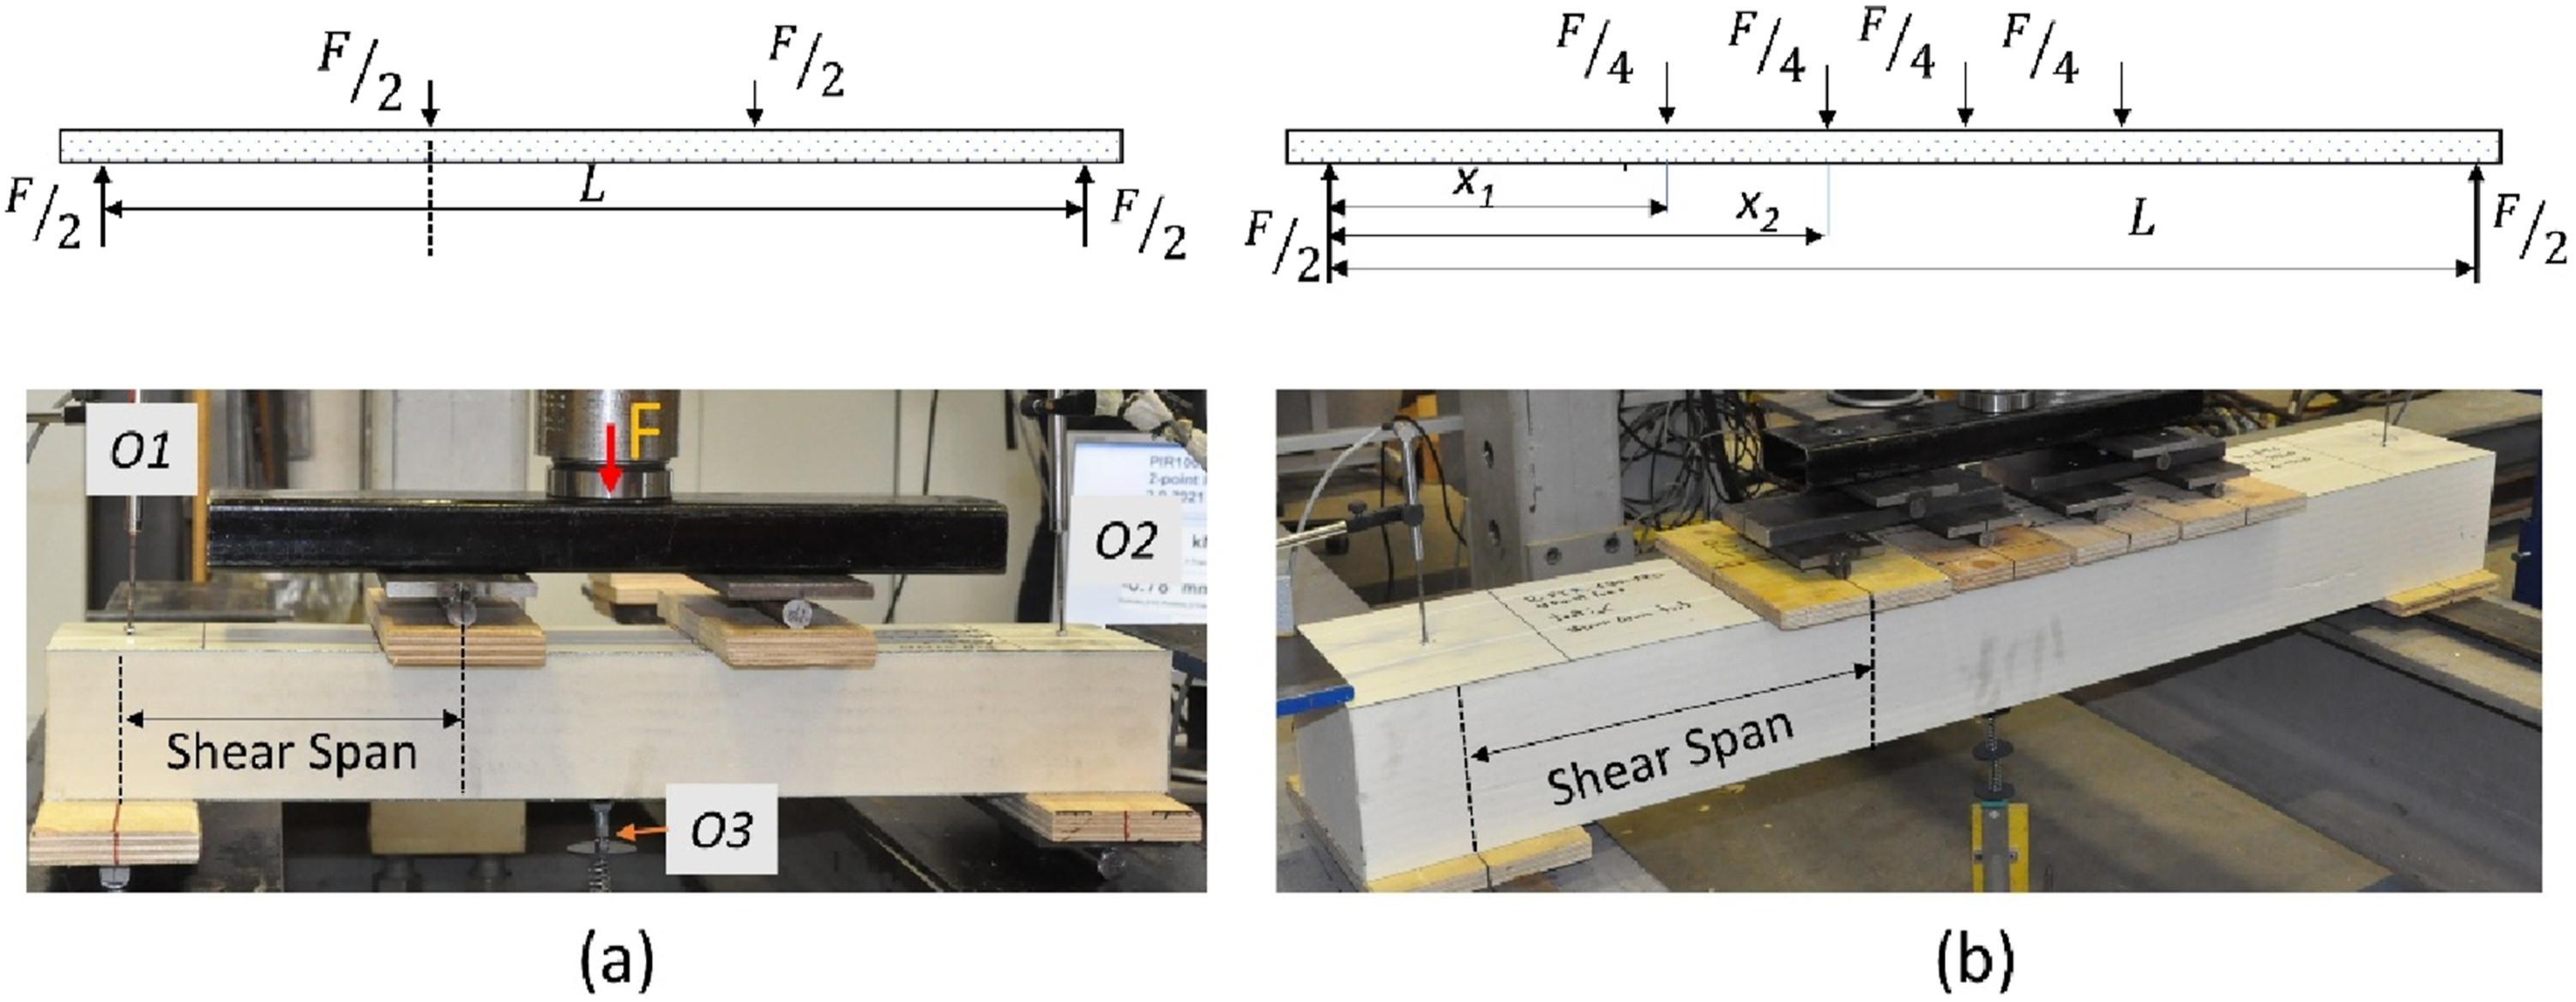
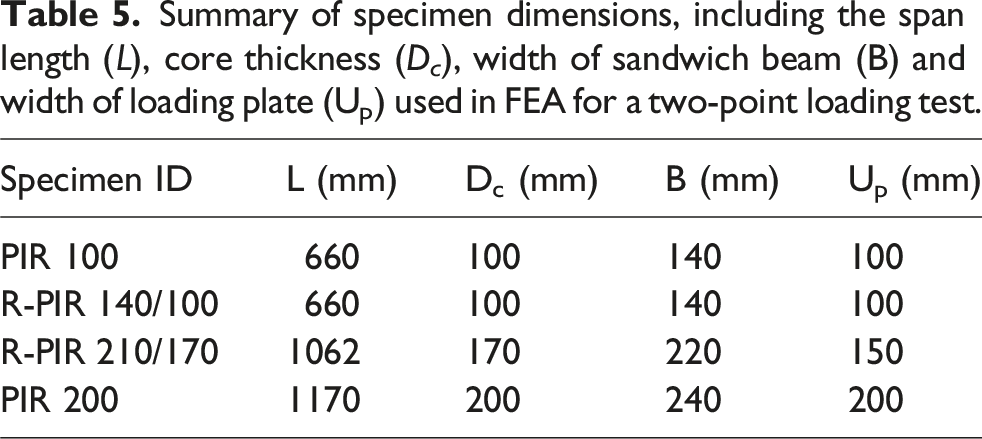
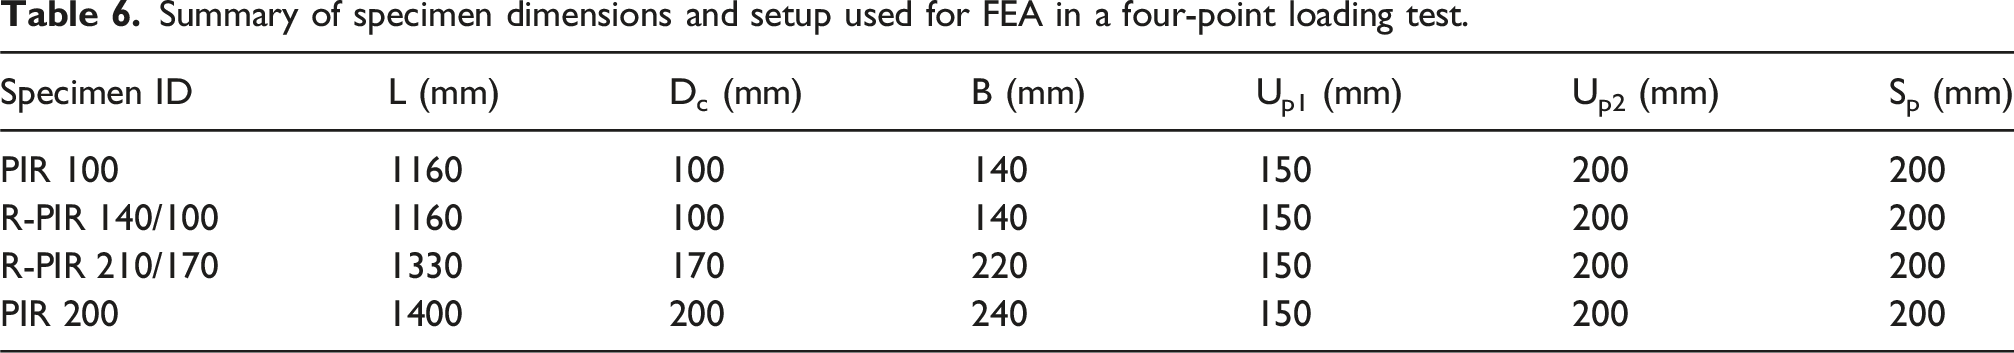
Summary of specimen dimensions, including the span length (L), core thickness (D c ), width of sandwich beam (B) and width of loading plate (Up) used in FEA for a two-point loading test.
During the test, the total deflection at the mid-span of the beam was measured using a displacement sensor O3 positioned below the beam, while displacement sensors O1 and O2 were used to monitor the displacement at the support points. After the test, a load-displacement curve was produced using the total load, F, recorded from the hydraulic cylinder and the total deflection, w, measured at mid-span.
The transverse shear strength, f
Cv
, can then be calculated as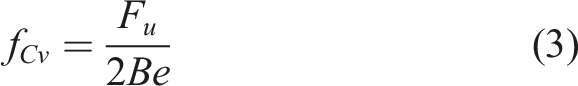
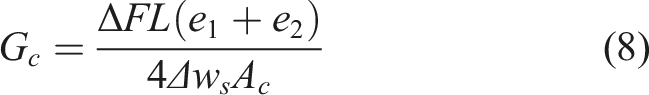
The shear modulus, G
C
, of the sandwich beam can be calculated using the slope obtained from the linear part of the load-displacement curve as: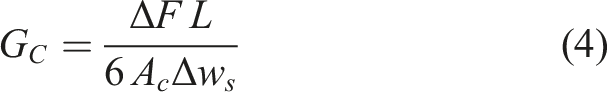

Four-point loading test
The four-point loading test (often referred to as a six-point bending test in the literature) was conducted on a sandwich beam sample by introducing the load at four points, as depicted in Figure 5(b). As EN 14509:2013 does not provide details for the configuration of the four-point loading test, they were developed through trial-and-error such that pure shear failure would be obtained regardless of panel thickness. 11 In general, the applied loading and recorded outputs were the same as for the two-point loading test.
Summary of specimen dimensions and setup used for FEA in a four-point loading test.
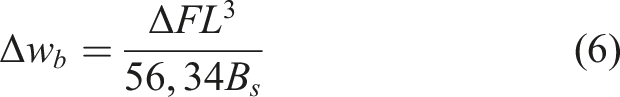
The shear strength of the sandwich beam can be calculated from the test results using equation (3). The shear modulus can be calculated using the following equation
11
:
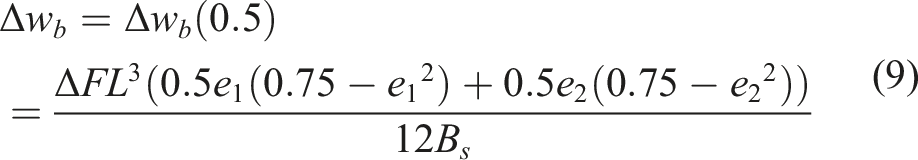
Δw
s
can be calculated by equation (5) with the bending deflection calculated as
11
:
Material model for PIR
PIR foam exhibits different mechanical properties under various loading conditions, as illustrated in Figure 2(a)–(c). When subjected to tensile loading, the failure is brittle with a clear visible rupture once the tensile strength is reached. Under compression load, PIR foam shows a nonlinear stress-strain behaviour with significant deformation capacity before failure. In the shear beam tests, the PIR core is subjected to a combination of compression, tension, and shear stresses. Consequently, the material model employed in simulations needs to consider the behaviour of PIR with respect to all these stresses.
Elastic-plastic material model
The PIR foam has a linear elastic region, both in compression and in tension. From the results of Table 3, it can be concluded that the elastic modulus in tension and compression can be considered equal. The elastic modulus obtained from the uniaxial compression test, E Cc , was employed, with the values taken from Table 3 for each panel type. Based on previous research, the Poisson’s ratio for low-density foam in the elastic region was assumed to be zero. 24
To define the plastic response, the crushable foam plasticity model presented by Deshpande and Fleck,
25
originally for metal foams, and later employed on polyvinylchloride (PVC) foams
26
was used. This model is also available in the FE software ABAQUS.
18
In the crushable foam model, the yield surface and its evolution are governed by the hydrostatic pressure, p, and von Mises equivalent stress, q. Isotropic hardening was employed, and the yield surface was defined by the compression test data. The yield surface is represented by an ellipse centred at the origin in the p-q stress plane, as illustrated in Figure 4a as:

The flow potential, G
fp
, in isotropic hardening is
18

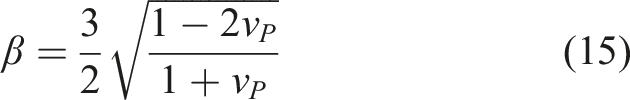
For PIR (a low-density foam), the plastic Poisson’s ratio, ν P , is very small, and in this study, the value ν P = 0 was employed.
The hardening law for the foam was implemented using a piecewise linear curve that relates the uniaxial Cauchy stress to the logarithmic plastic strain obtained from the uniaxial compression. The nominal stress (σ
nom
) and nominal strain (ε
nom
) obtained from the uniaxial compression test were converted into true stress (σ
true
) and logarithmic plastic strain (ε
pl
) using the following relationships
27
:
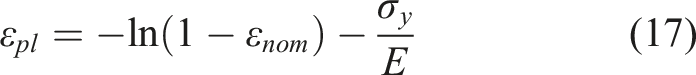
Equation (16) is valid for material that has a zero Poisson’s ratio.
Modelling shear failure of PIR
The shear failure observed in the tests can also be regarded as a tensile failure in terms of principal stresses. As PIR exhibits brittle behaviour in tension, the maximum principal stress (or Rankine) criterion was adopted to model the shear failure. According to the Rankine failure criterion,
28
failure in brittle materials occurs when the maximum principal stress reaches a critical value equal to the uniaxial tensile strength of the material. Crack initiation takes place at the most highly stressed point when any of the principal stresses (σ
1
, σ
2
, or σ
3
) attains this tensile strength.
29
Although this criterion neglects the contributions of the remaining principal stresses and the influence of shear stresses acting on other planes within the material, it is applicable to PIR foam subjected to shear loading, where failure is governed by tensile cracking. Accordingly, failure is assumed to occur when the maximum principal stress satisfies
Since ABAQUS does not provide a built-in option for integrating the failure criterion directly, the failure criterion was implemented using a user-subroutine (VUSDFLD), which follows the flowchart presented in Figure 6. Flowchart of the implementation of user-subroutine VUSDFLD for foam damage.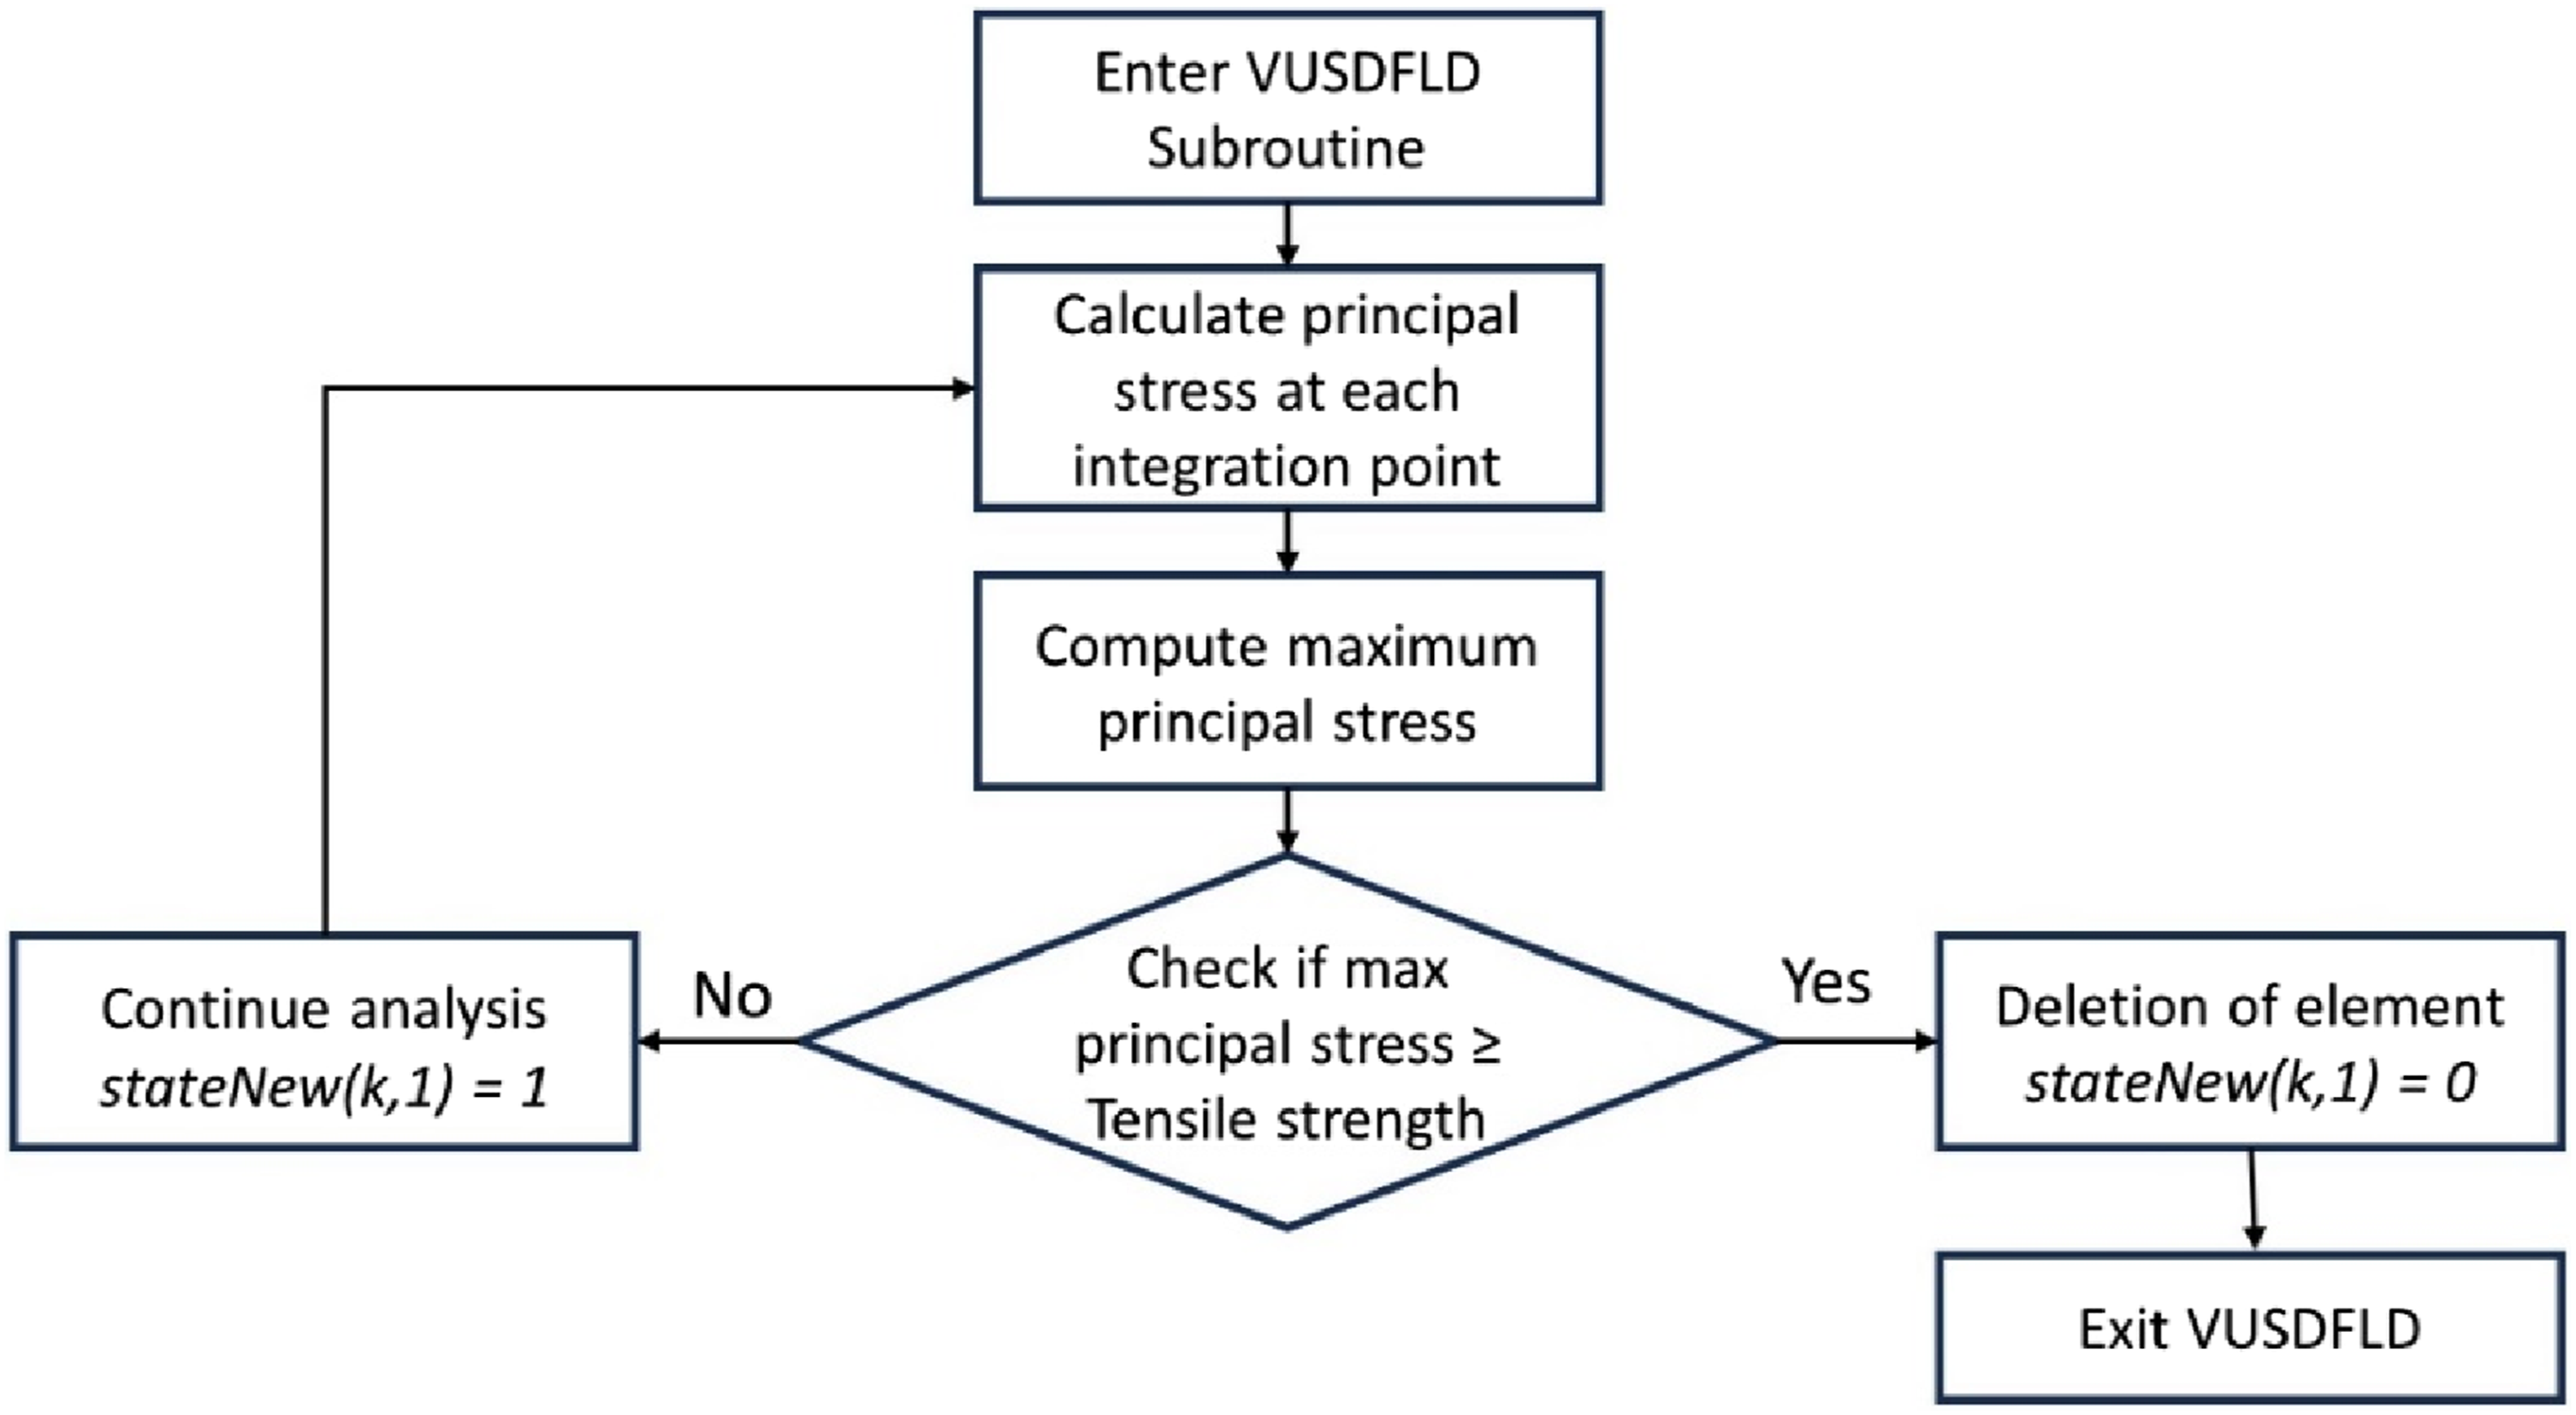
The maximum principal stress is evaluated at each integration point of an element. If the maximum principal stress is greater than or equal to the tensile strength of PIR, the damage criterion is satisfied, which implies damage in the material. In this case, the corresponding element is deleted from the model. If the maximum principal stress is less than the tensile strength of the core, the analysis continues without failure. The VUSDLFD subroutine is called at each load increment in conjunction with stress evaluation.
Numerical simulation of shear beam tests
Non-linear Finite element (FE) models were developed to mainly investigate and analyse the effect of the loading configurations on the shear resistance of the sandwich beam. Two distinct shear beam test methods, as depicted in Figure 5, were examined. Furthermore, the FE models aimed to explore potential pre-failure modes that are challenging to identify during experimental testing and provide a better understanding. The numerical simulation was conducted using the ABAQUS/Explicit solver, which employs an explicit time integration rule to solve the equations of motion directly without requiring iteration. This method utilizes small time increments to integrate the equations of motion, making it ideal for highly nonlinear problems with discontinuities, such as those involving element deletion due to shear failure. To reduce computational costs, uniform mass scaling was applied to control the stable time increment. This involved scaling the mass of elements with small time increments to increase the time step size while maintaining stability. A limit of 1e-6 was set to prevent the stable time increment from exceeding this threshold. For accurate results, the system’s kinetic energy (ALLKE) was monitored and ensured that it was within 3-5% of the system’s internal energy (ALLIE) throughout the simulation. Additionally, the artificial energy (ALLAE) generated by internal hourglass forces was kept below 5% of the internal energy (ALLIE) to ensure result reliability. Numerical simulations were conducted on eight cases using the Puhti supercomputer provided by CSC, Finland.
Modelling of parts
Steel faces
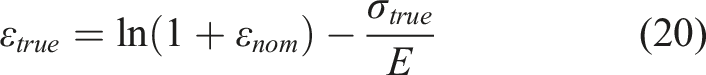
The steel faces were modelled as a linear elastic-plastic material using the measured properties. The engineering stress-strain curve obtained from the coupon tensile test was converted into true stress-strain data using equations (19) and (20), which was used to define the plastic behaviour. A Young’s modulus, E = 210 GPa and a Poisson’s ratio, ν = 0.3 were used. The measured thickness of each specific facing, as given in Table 1, was used.
PIR core
The PIR foam was modelled as an elastic-plastic material with the Rankine criterion for shear failure included. The material modelling procedure and failure criteria for PIR foam are detailed in Section 4, with the relevant material parameters taken from Table 3, based on pure PIR foam tests with three specimens per panel type.
Plates and rollers
The load spreading plates with a thickness of 20 mm and rollers with a diameter of 20 mm were modelled as a linear elastic material model using the properties of steel (E = 210 GPa and ν = 0.3). In the four-point loading case, as illustrated in Figure 7(b), the use of rollers and an additional loading beam with a thickness of 40 mm was incorporated. This setup was implemented to maintain consistent contact between the loading plate and the upper steel face throughout the simulation as the beam curves under the application of load. Boundary condition, (a) Two-point loading, (b) Four-point loading.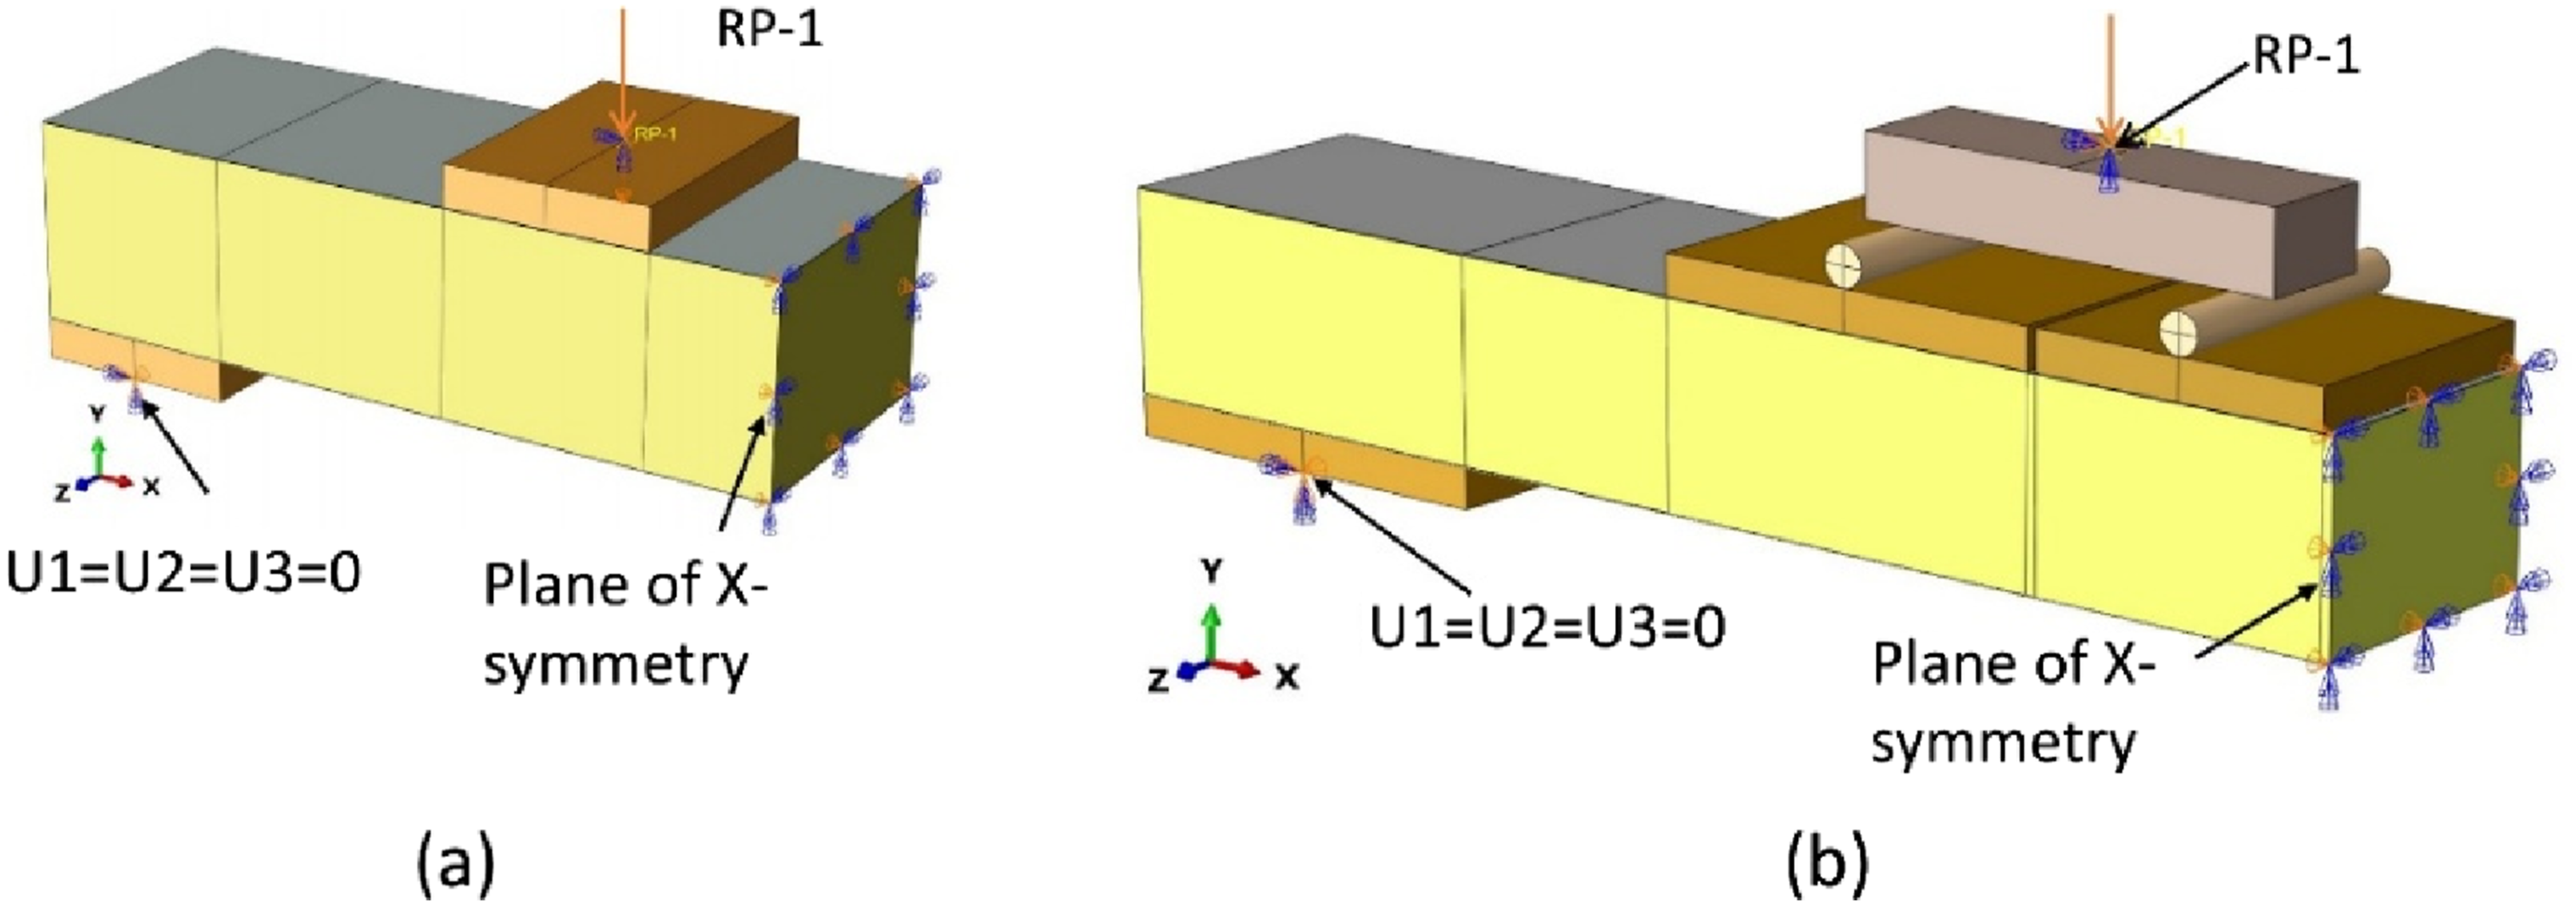
Contacts
General contact formulation 18 was implemented, which automatically detects all the possible contact pairs and ensures the contact conditions are enforced efficiently. This formulation ensures proper contact between the loading plates and the upper steel facings, the support plates and the lower steel facings, and between the loading plates and the rollers. A penalty friction formulation with isotropic friction was applied to describe the tangential behaviour using a friction coefficient of 0.4. 30 The normal behaviour was defined using a hard contact pressure-overclosure relationship. Additionally, a tie constraint was implemented to bond the upper and lower steel facings to the PIR core. This constraint ensures that the nodes of the steel facings are rigidly linked to the corresponding nodes of the PIR core, thereby eliminating any relative motion between them and replicating a perfectly bonded connection.
Boundary conditions and loads
The boundary conditions and loading setup for the two-point loading and four-point loading tests are shown in Figure 7(a) and (b), respectively. To model the pin support condition, the translational displacements in the X, Y, and Z directions (U1, U2, U3) were set to zero for the nodes along the centreline of the bottom face of the support plate. The loading was applied through a reference point (RP-1), designated as the control point. The nodes along the centreline of the loading plate were coupled to this reference point using the kinematic coupling constraint function. 18 This constraint ensures that all degrees of freedom (DOFs), both translational and rotational, of the slave nodes on the loading plate are rigidly tied to the reference node, enforcing rigid-body motion. A vertical displacement-controlled load at the rate of 2 mm/s was applied at the reference point, along the Y-axis (U1 = U3 = 0).
Due to symmetry, only one half of the sandwich beam was considered for the numerical simulation, as depicted in Figure 5. Symmetry boundary condition was imposed by constraining the displacement in the X-direction (U1 = 0) and the rotations about the Y- and Z-axes (UR2 = UR3 = 0) at the mid-span of the beam.
Mesh type and mesh convergence study
The steel faces and PIR foam were meshed using an eight-node hexahedral solid element (continuum element C3D8). For the loading plates and rollers, an eight-node linear hexahedral element with reduced integration (C3D8R) was employed. The selection of an appropriate element size is a crucial step to save computational cost and time. For foam materials in particular, a finer mesh yields more accurate results, especially in capturing cracking patterns and predicting the ultimate load. 31 However, coarser element sizes can save computational time by reducing the number of elements.
Results of the mesh convergence study for the two-point loading test of the PIR 100 panel.
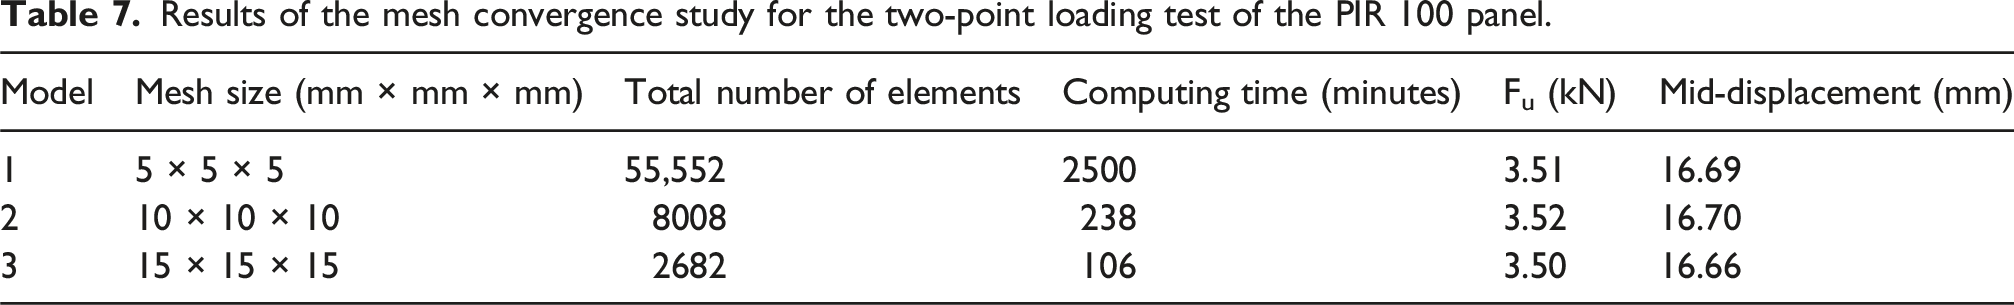
While the use of a 15 mm mesh size significantly reduces computational time, the damage is more pronounced when compared to the finer mesh, as depicted in Figure 8(a)–(c). Comparison of foam damage with different mesh sizes: (a) Mesh size 5 mm, (b) Mesh size 10 mm, (c) Mesh size 15 mm.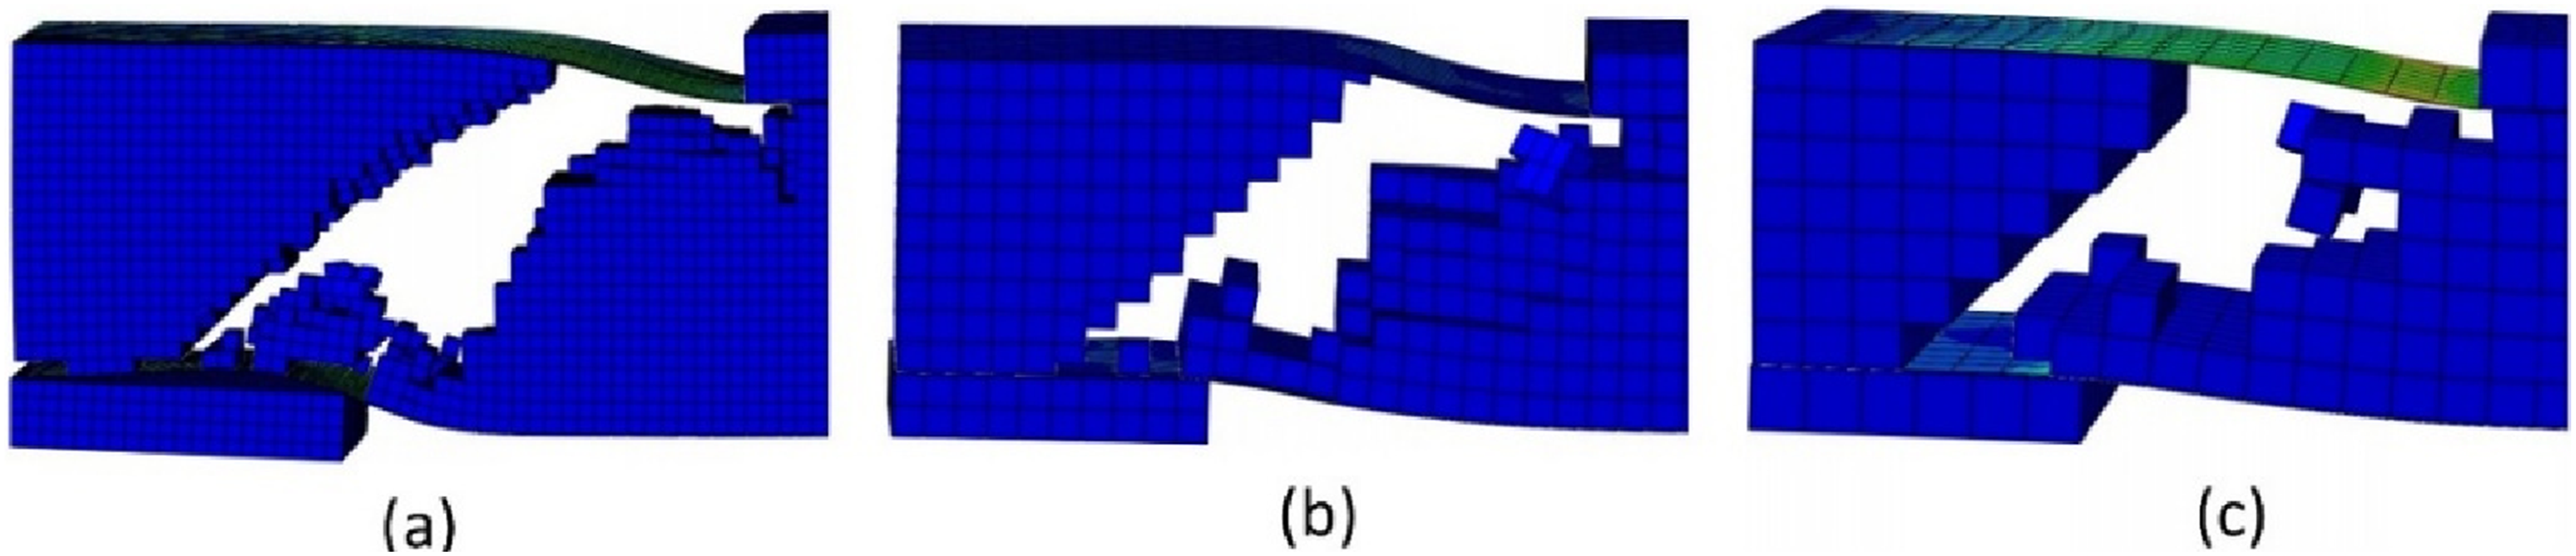
Based on these observations, a mesh size of 10 mm was selected for further numerical studies.
Validation of the finite element model
To validate the FE model, a comprehensive comparison between numerical simulations and experimental results was conducted. Figure 9(a) illustrates the behaviour of the core material before and after undergoing a compression test. Figure 9(b) depicts a comparison of force-displacement curves obtained from uniaxial compression tests and FEA, which shows that the numerical model aligns closely with the experimental data. The FE model was able to replicate the exact failure mode observed during the shear beam tests, with a clear shear crack of core material as shown in Figure 9(c) and the comparison of the force-displacement curve from the two-point loading test is depicted in Figure 9(d), where the FEA results closely resemble the experimental one. However, it should be noted that the current model does not account for the effects of bonding between steel faces and core material, which may introduce some discrepancies when compared to experimental results. (a) Core material before and after the compression test, (b) Comparison of force-displacement curve between experimental and FEA results for the compression test of core material, (c) Damage comparison between experimental results and FEA predictions, (d) Comparison of force-displacement curve between experiment and FEA predictions of the two-point loading test of the R-PIR 210/170 panel.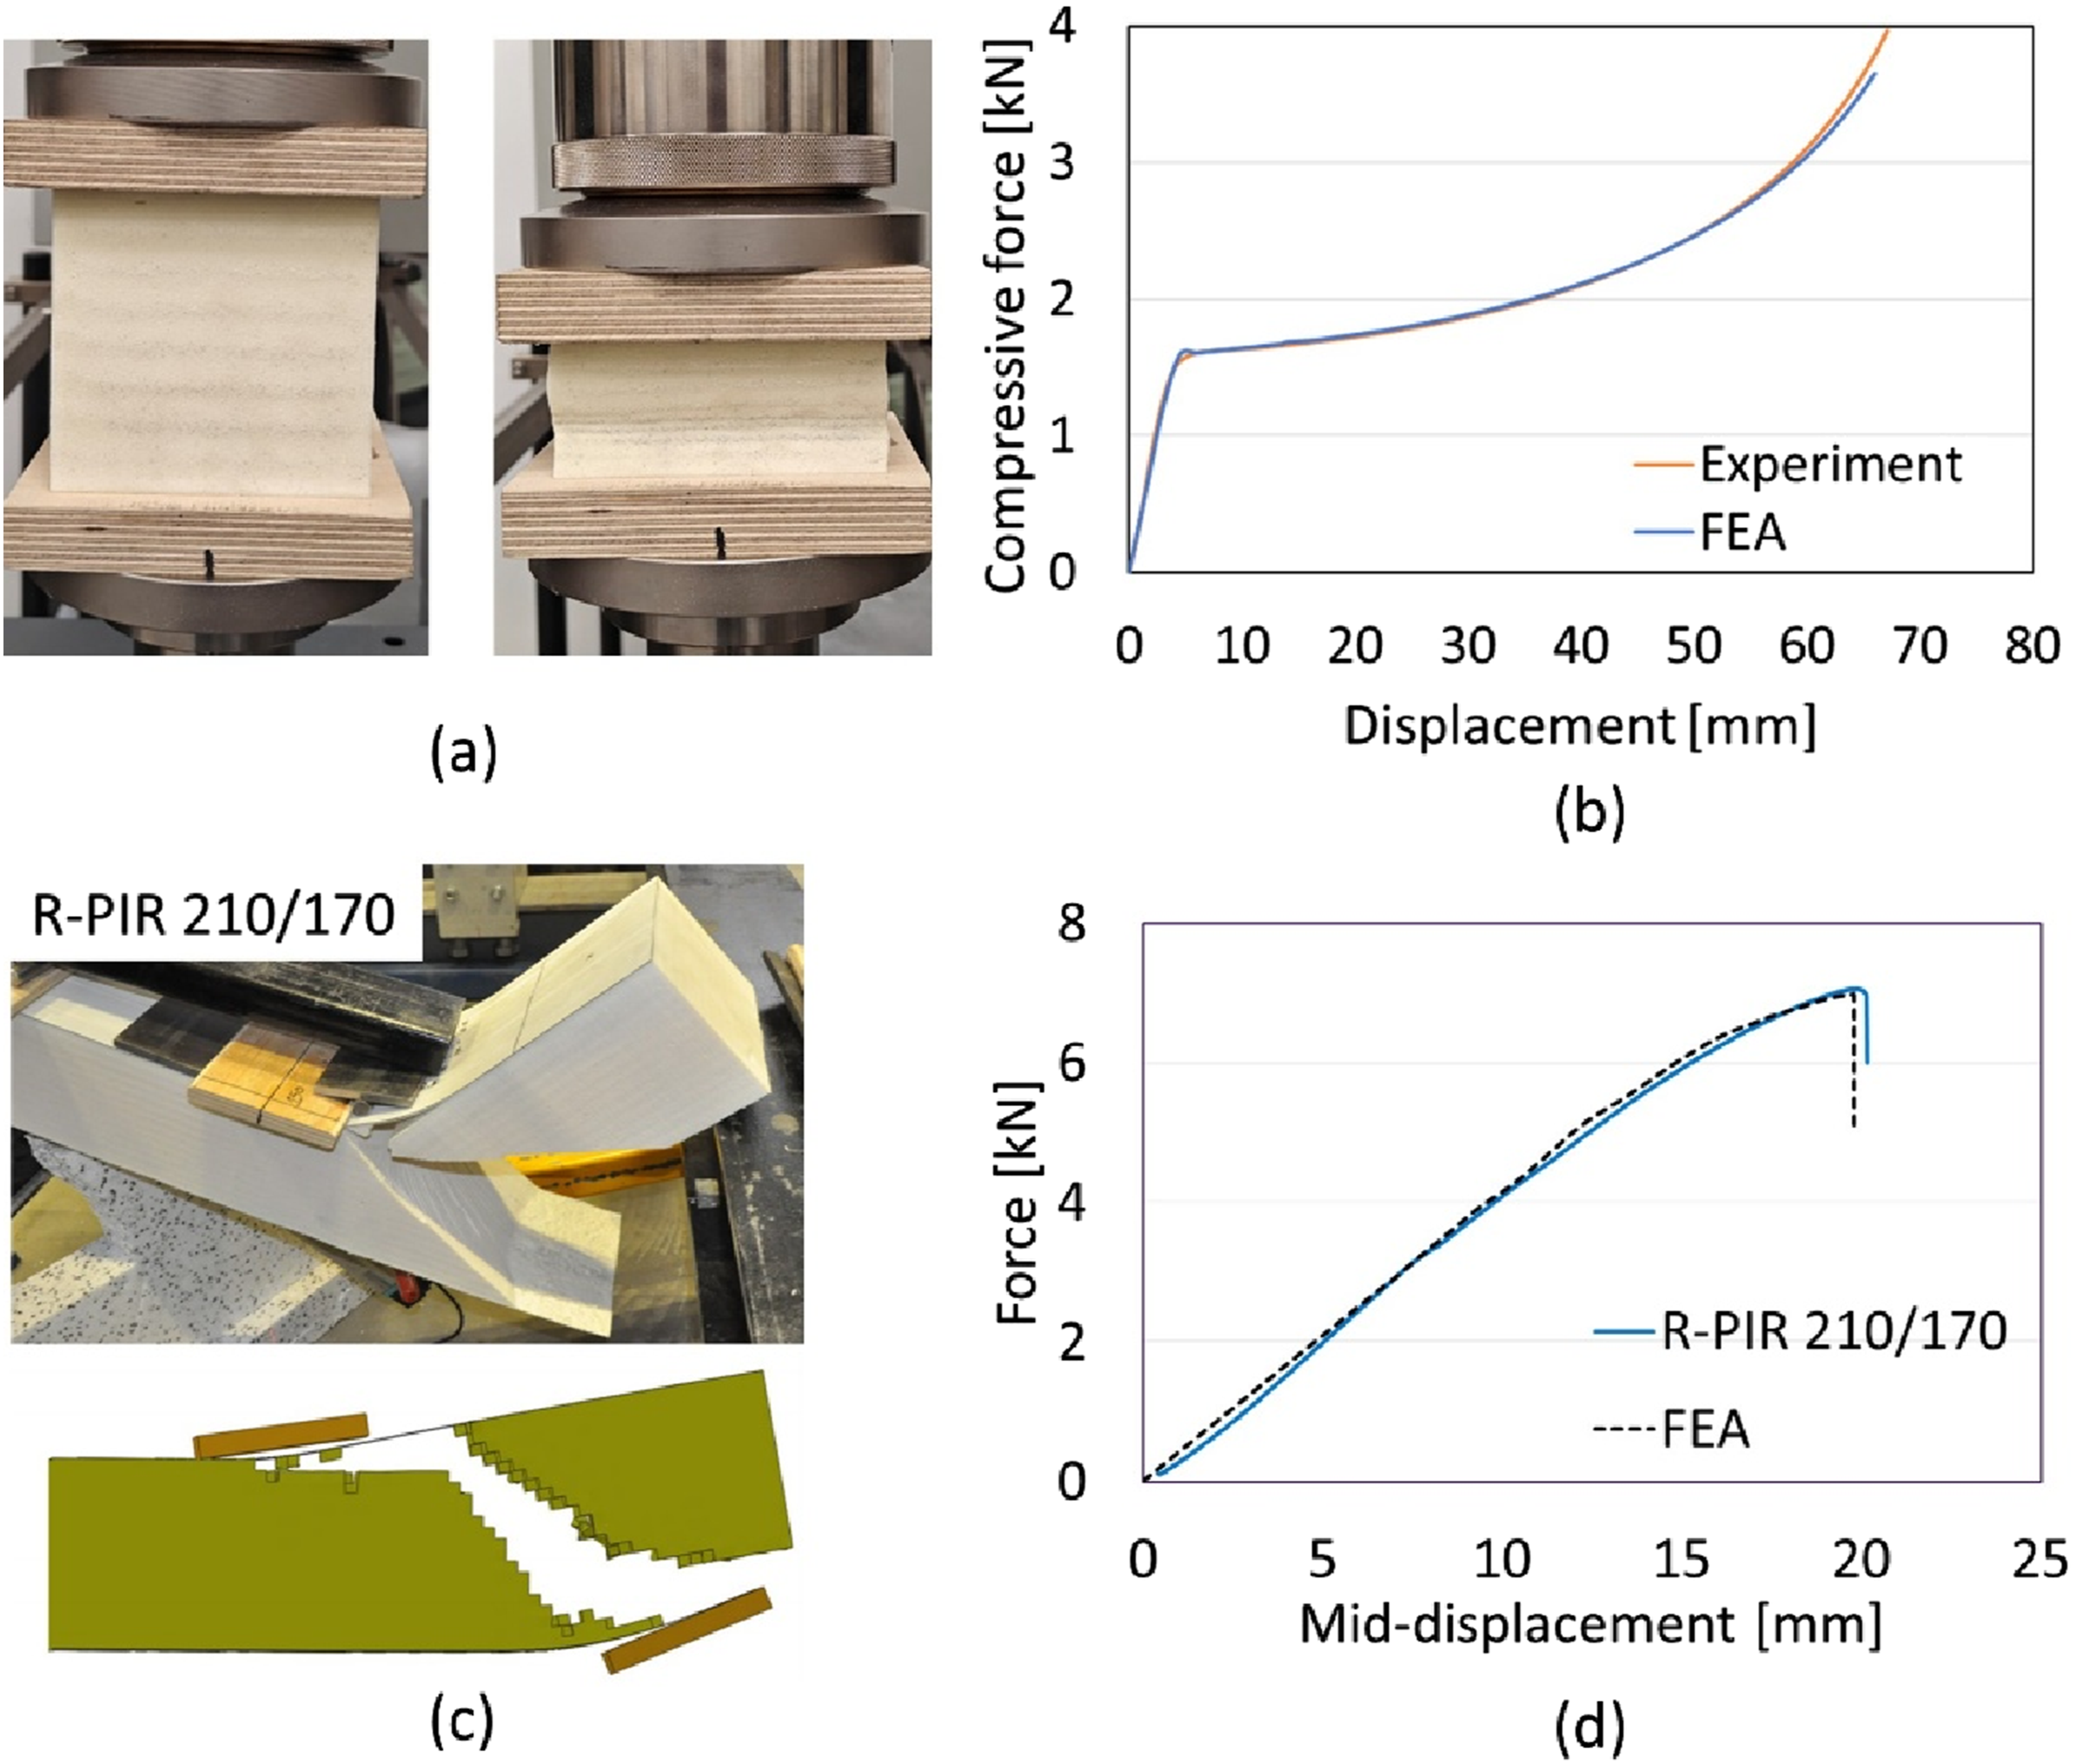
Shear span and St. Venant’s principle
As the test method described in this work focuses solely on the shear properties of the sandwich panel, the shear span plays a critical role. For accurate determination of shear properties, it is essential that St Venant’s principle is utilized, i.e., that the shear stress region remains unaffected by local effects from the applied loads. 7 This corresponds to the situation that during loading in the elastic regime, the shear force (and consequently shear stress) remains constant in the shear span. In this study, the shear span length recommended by EN 14509:2013 (1.2D c ) was adopted to take St Venant’s principle into account.
Figure 10 illustrates the shear stress distribution of the PIR 200 panel under loading, where the core remains elastic. The results of the FEA clearly show that the shear stresses along the centreline of the core remain constant, which implies that the chosen span length is adequate to account for Saint-Venant’s principle. The results also show that even though the loading points in the four-point loading setup are closely spaced, the shear stress in the shear span remains constant. The shear stress depends on the total applied load and the support reactions, which do not change with the spacing of the loading points. Shear stress distribution in the core of the PIR 200 panel from the four-point loading test, extracted within the linear region.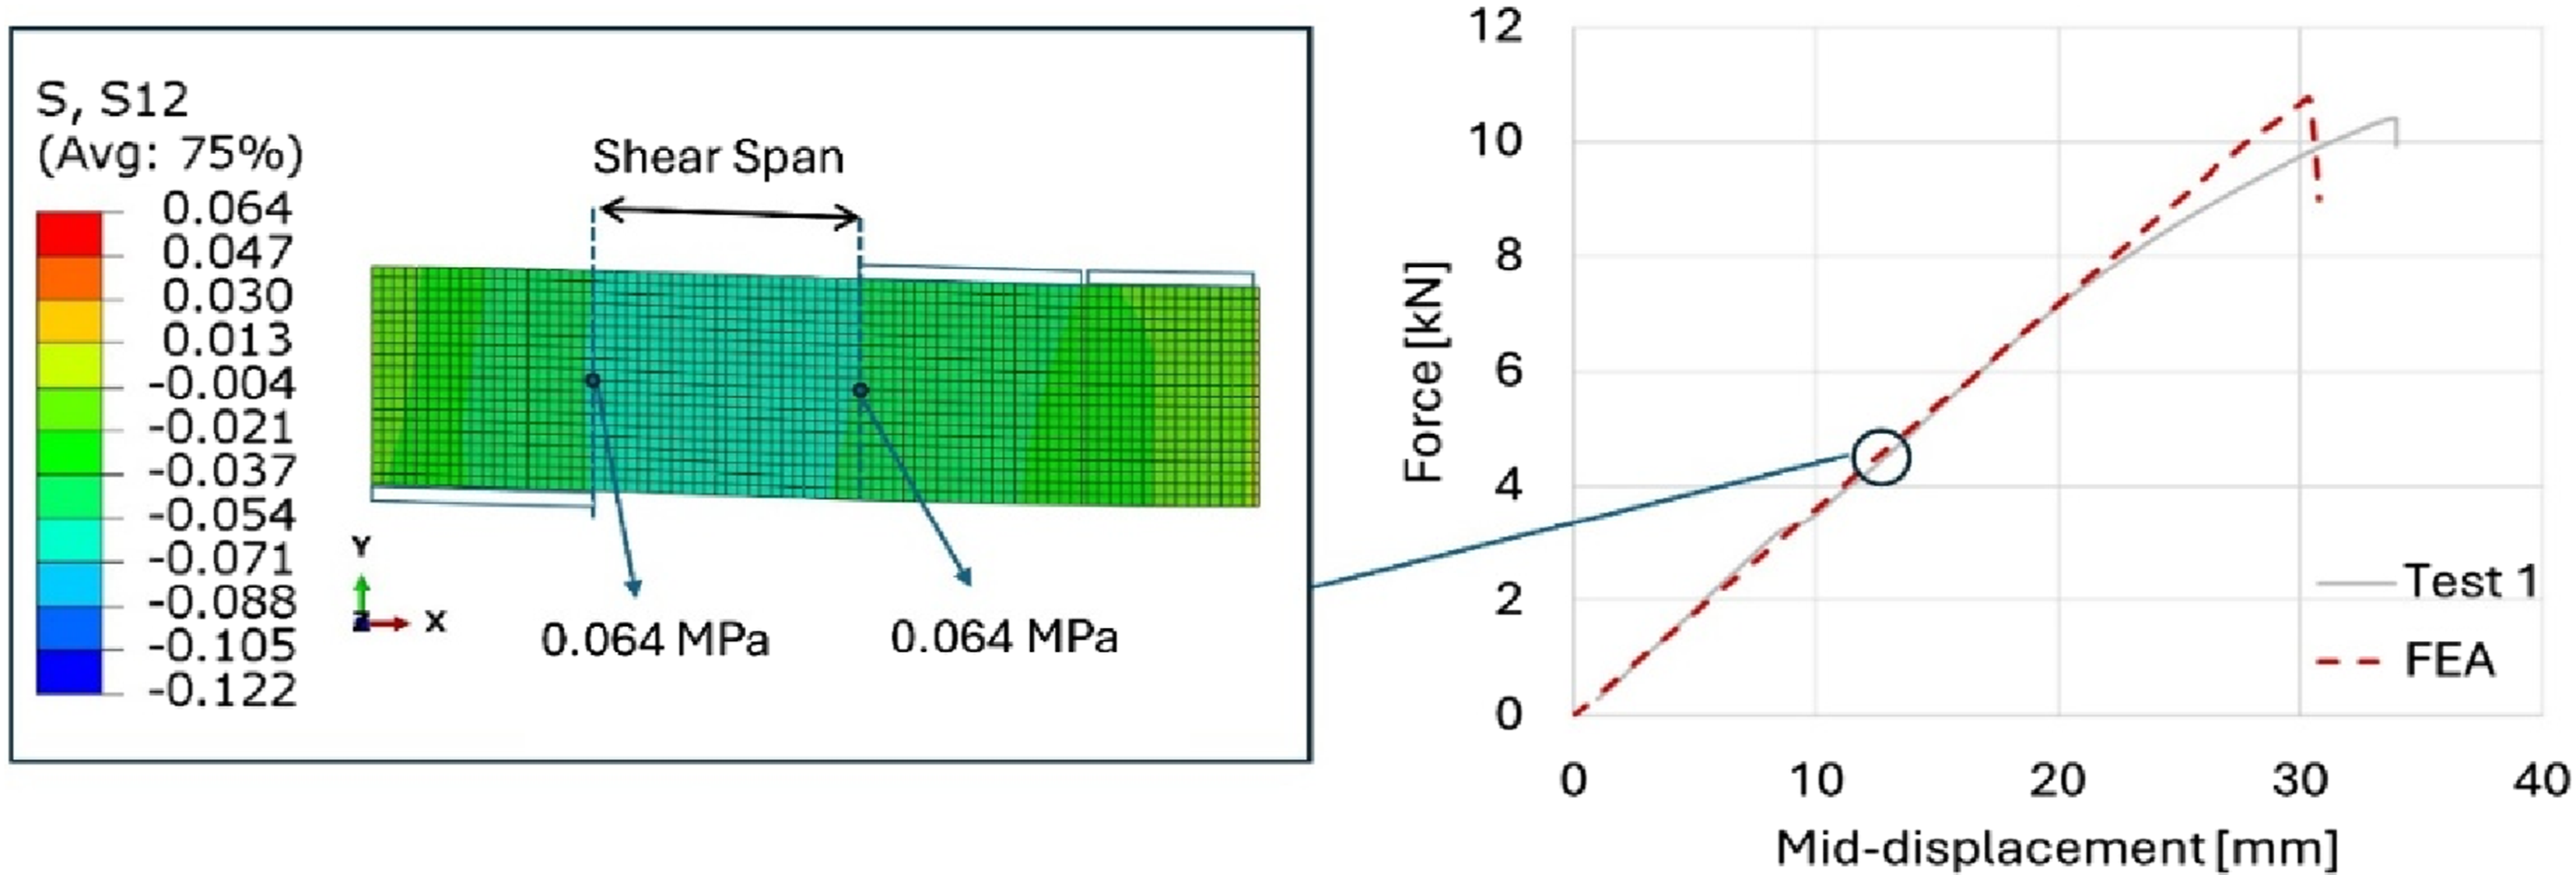
Results and discussion
Shear beam tests
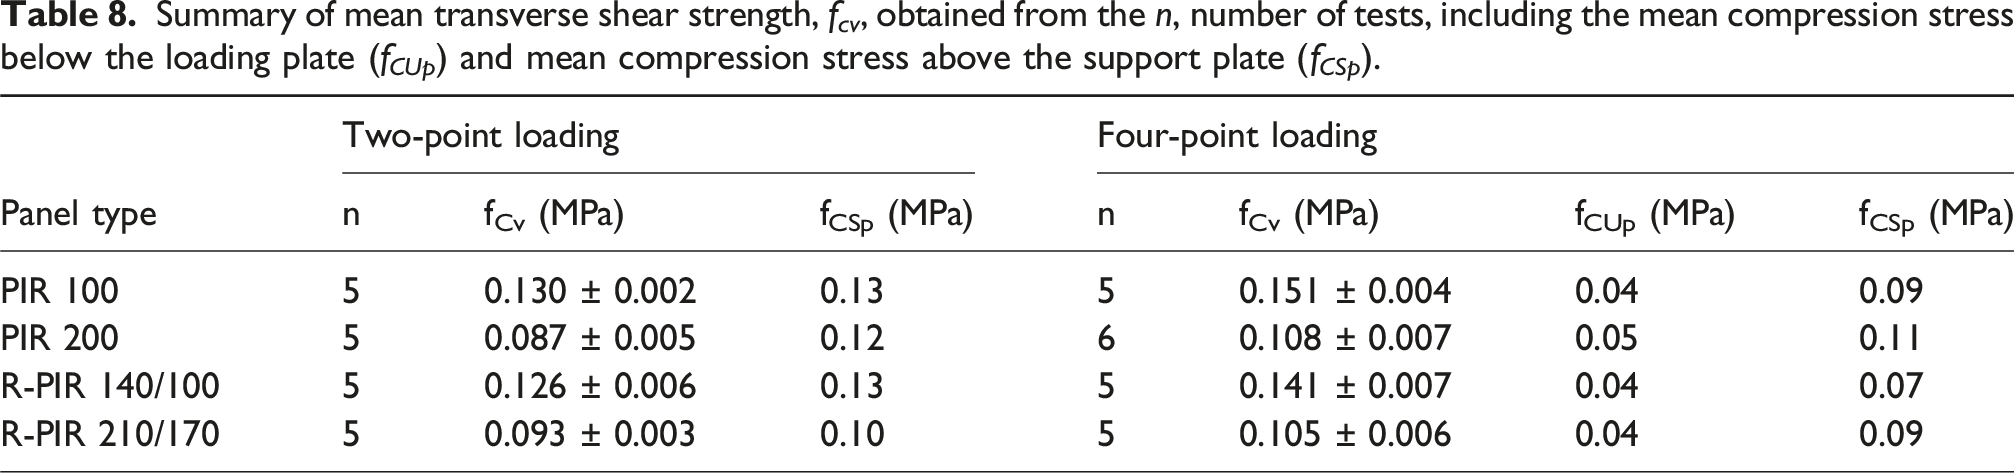
Summary of mean transverse shear strength, f cv , obtained from the n, number of tests, including the mean compression stress below the loading plate (f CUp ) and mean compression stress above the support plate (f CSp ).
Comparison with simulation results
Comparison of ultimate loads and their variations between experimental and FEA results.
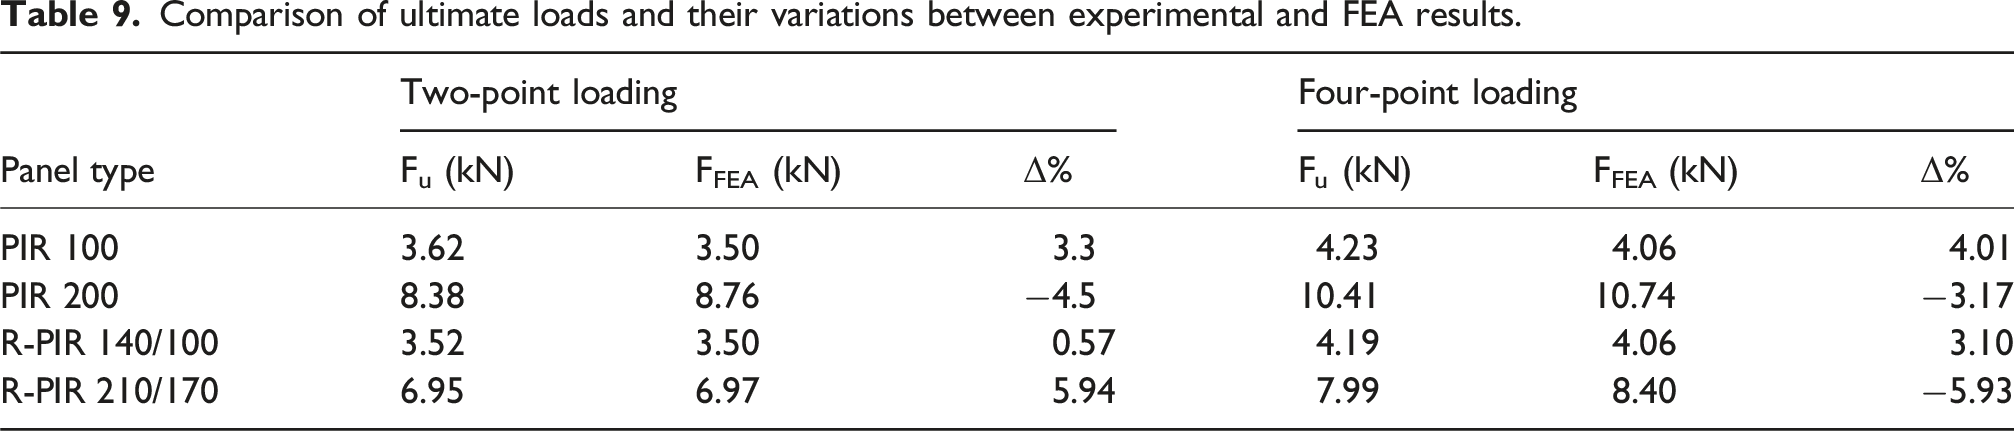
It should be noted that the sandwich beams of panel types PIR 100 and R-PIR 140/100 have the same core thickness and dimensions. Therefore, for further analysis, only the panel type PIR 100 will be considered. The beam specimens tested under both two-point and four-point loading resulted in all specimens failing in shear during the experiment. However, upon analysing the FE results, it was observed that the failure mode in the two-point loading test was predominantly affected by failure modes other than shear. In Figure 11(a), the force-displacement curve of the two-point loading test shows a linear elastic region (A-B), followed by non-linear behaviour (B-C) before failing in shear. Comparison of Experimental and FE Results of panel type PIR 100: (a) Two-Point Loading, (b) Four-Point Loading.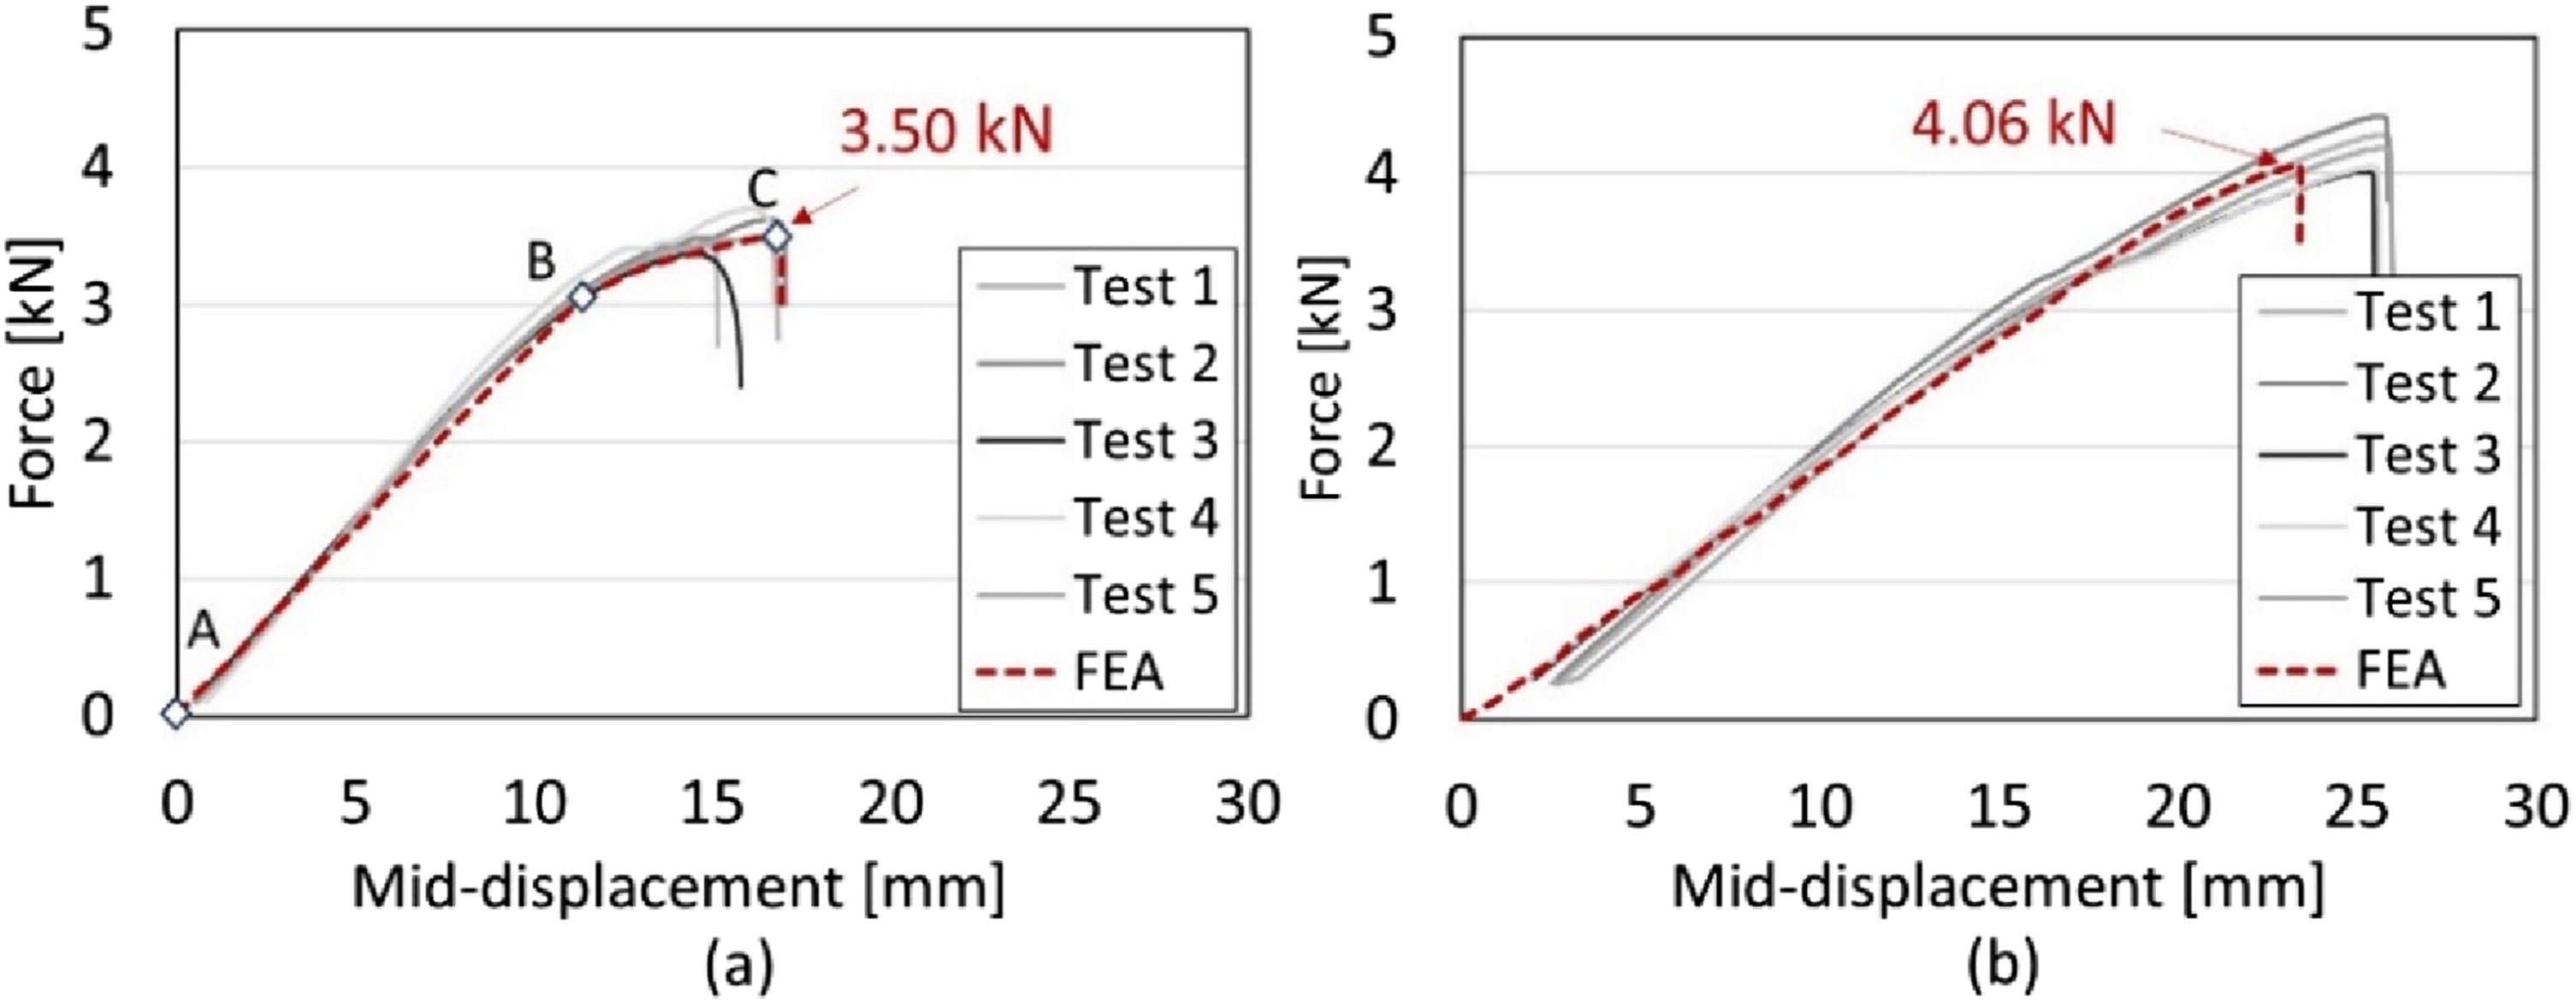
FE analysis revealed that this transition corresponds to the compression failure of the core material directly above the support point and the local indentation below the loading point. Despite this preliminary failure, the panel continued to resist the applied load until failing in shear. This phenomenon is often overlooked during testing, leading to the ultimate failure mode being identified as a shear failure based solely on visual observations and declaring the shear strength. On the other hand, as shown in the graph in Figure 11(b), the panel tested under four-point loading exhibited linear behaviour until it reached its ultimate shear strength and failed in shear with a higher level of ultimate load.
To further investigate this issue, the transverse shear stress (S12) acting on the PIR core and the axial compressive stress (S22) below the loading point and above the support points were analysed using contour plots, as illustrated in Figure 12. Comparison of FEA results of PIR 100: (a) Shear stress, (b) Axial stress.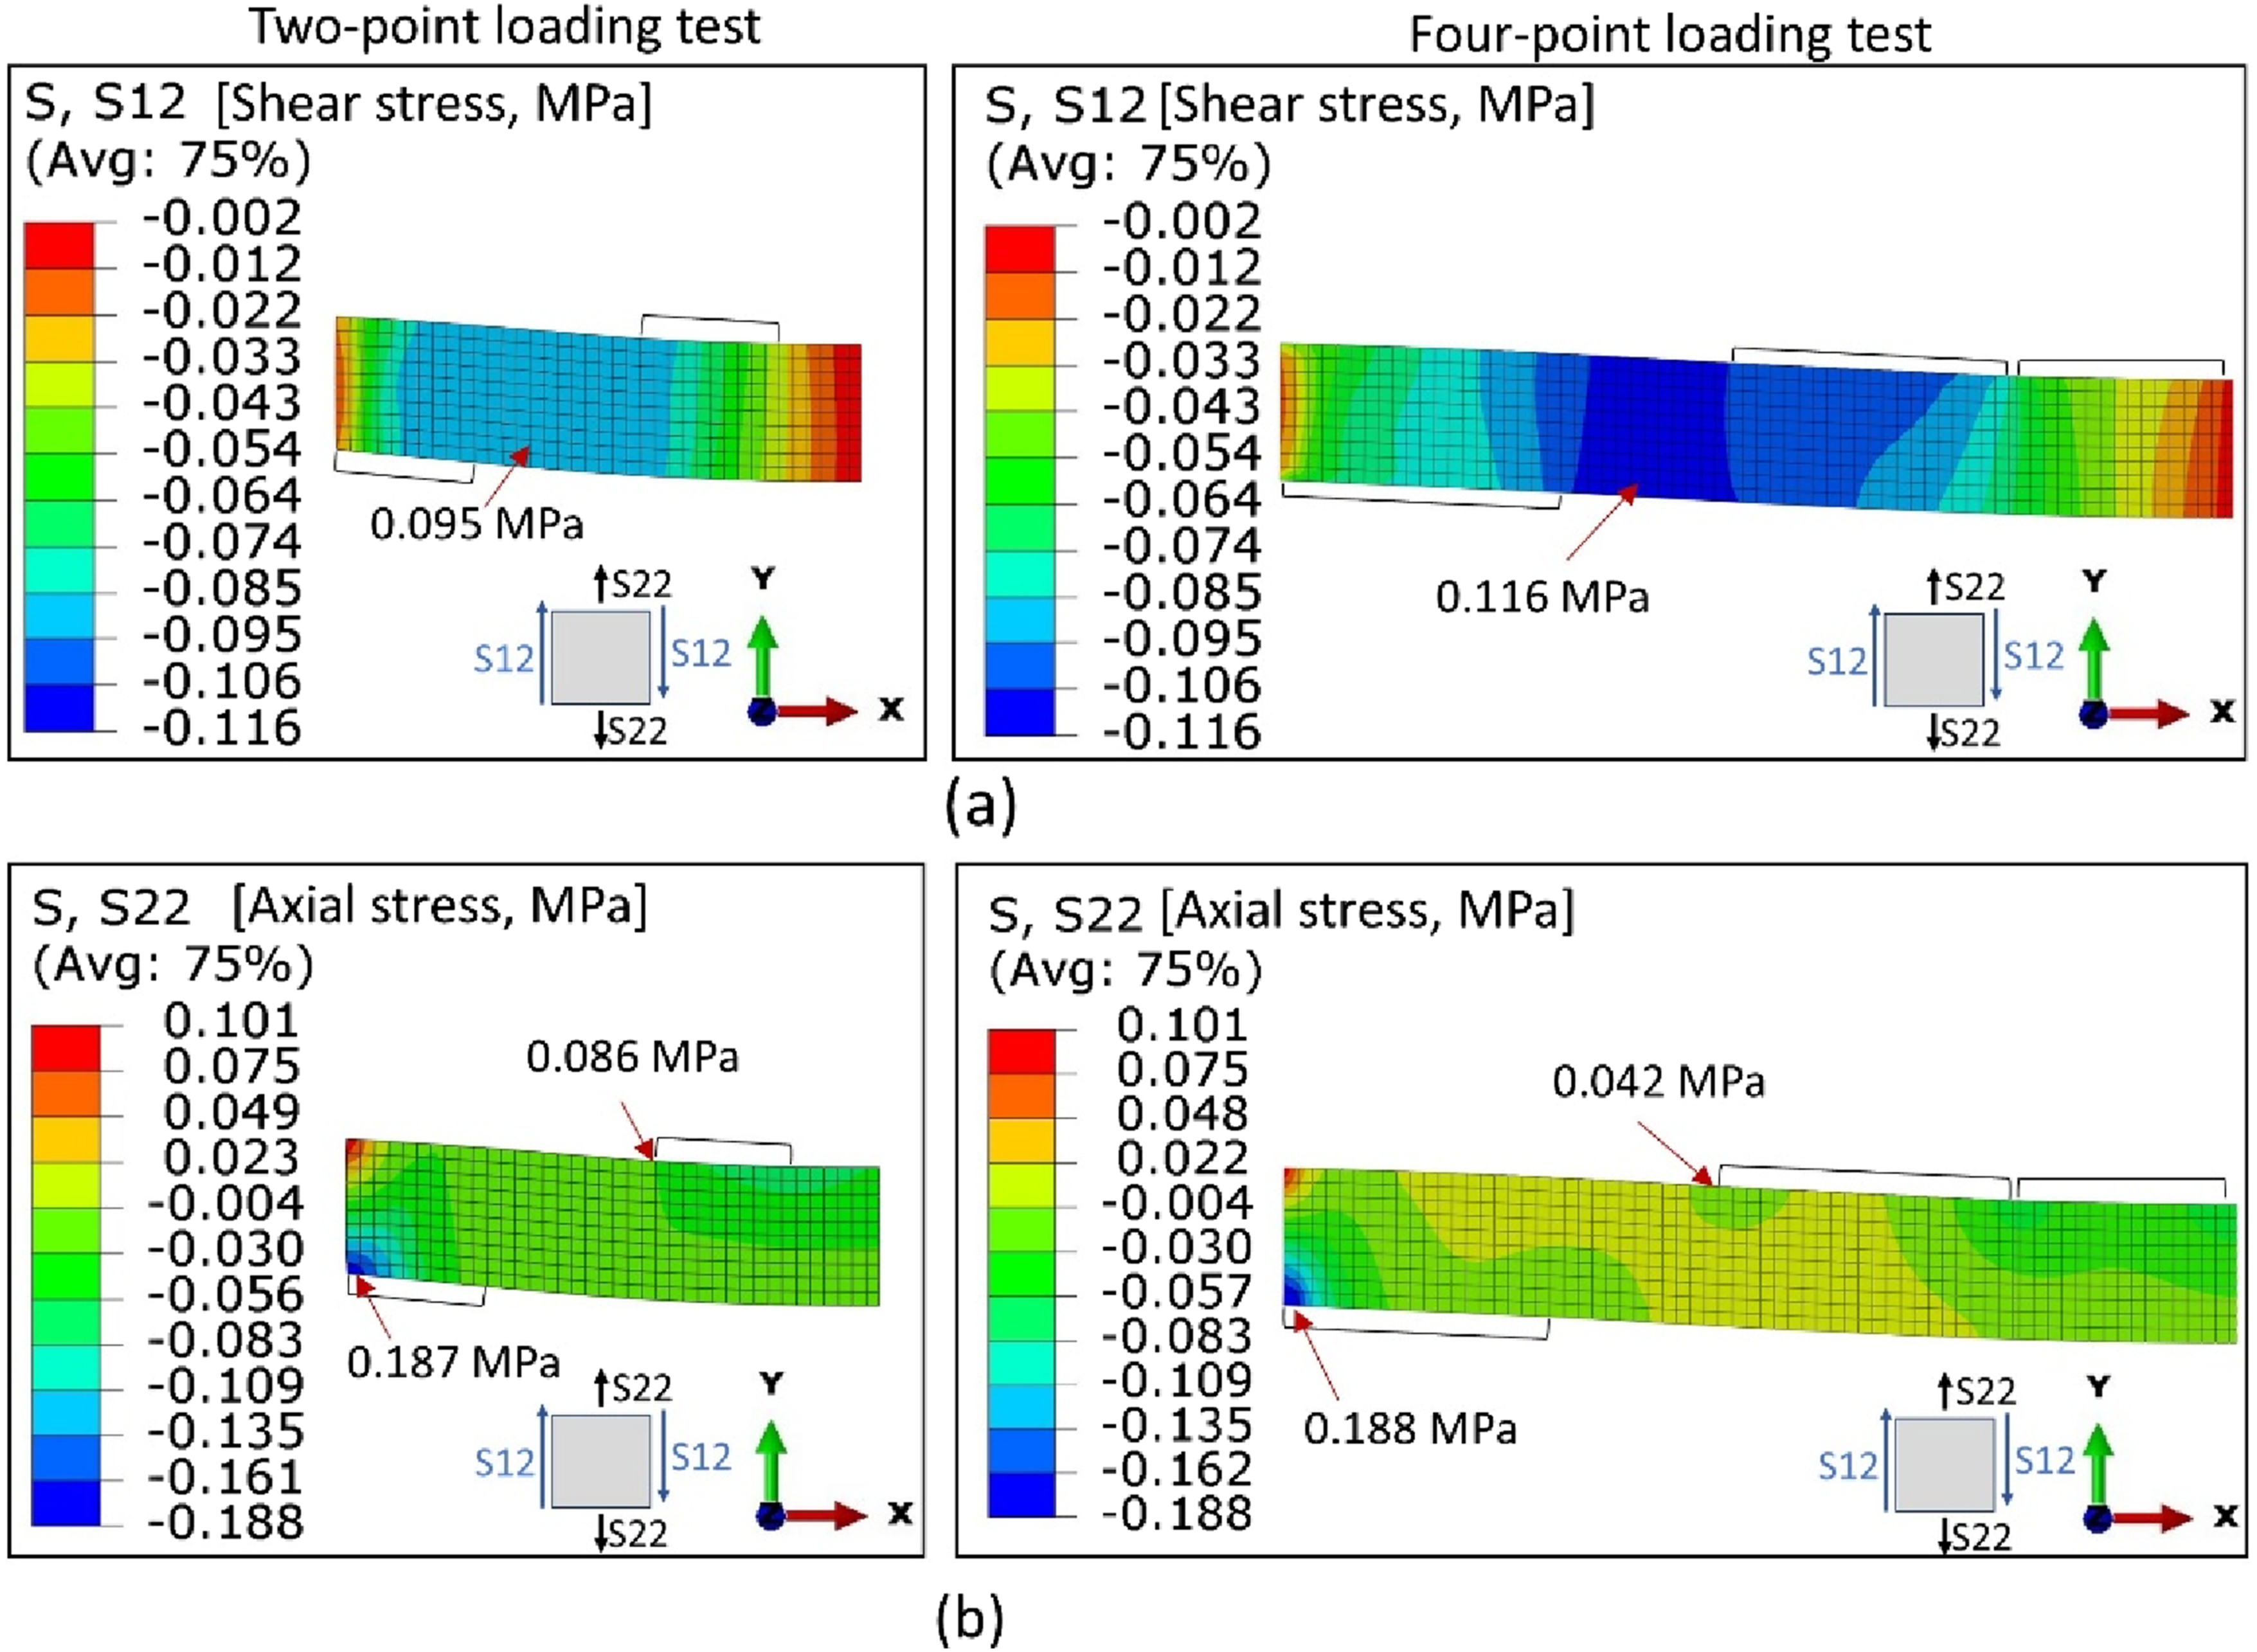
These plots illustrate the stress distribution within the core material immediately preceding failure. Figure 12(a) shows that for the PIR 100 panel, shear stress distributions for the four-point and two-point loading tests are similar, but the magnitude of the stresses is higher for the four-point loading test. Additionally, in the four-point loading test, the shear stress remains nearly constant in the shear failure region, i.e., between the edges of the support and load plates. Figure 12(b) depicts the transverse axial stress acting above the support point and below the loading point. In both test methods, the axial compressive stress acting on the sandwich beam above the support point exceeded the PIR core compressive strength, implying local stress concentration and large compressive deformation. However, the four-point loading test demonstrated a significant reduction (approximately 50%) in axial stress below the loading point. This reduction in transverse compressive stress below the loading point reduces the likelihood of local indentation failure, which primarily occurs due to the biaxial stress state induced by the combination of bending moment and transverse compression.
The force-displacement curves obtained from the two-point and four-point loading tests of the sandwich beam with a 170 mm core thickness (R-PIR 210/170) are compared with the FE results in Figure 13(a) and (b), respectively. A close agreement between experimental and FEA results is observed for both test methods. Comparison of Experimental and FE Results of panel type PIR: (a) Two-Point Loading, (b) Four-Point Loading.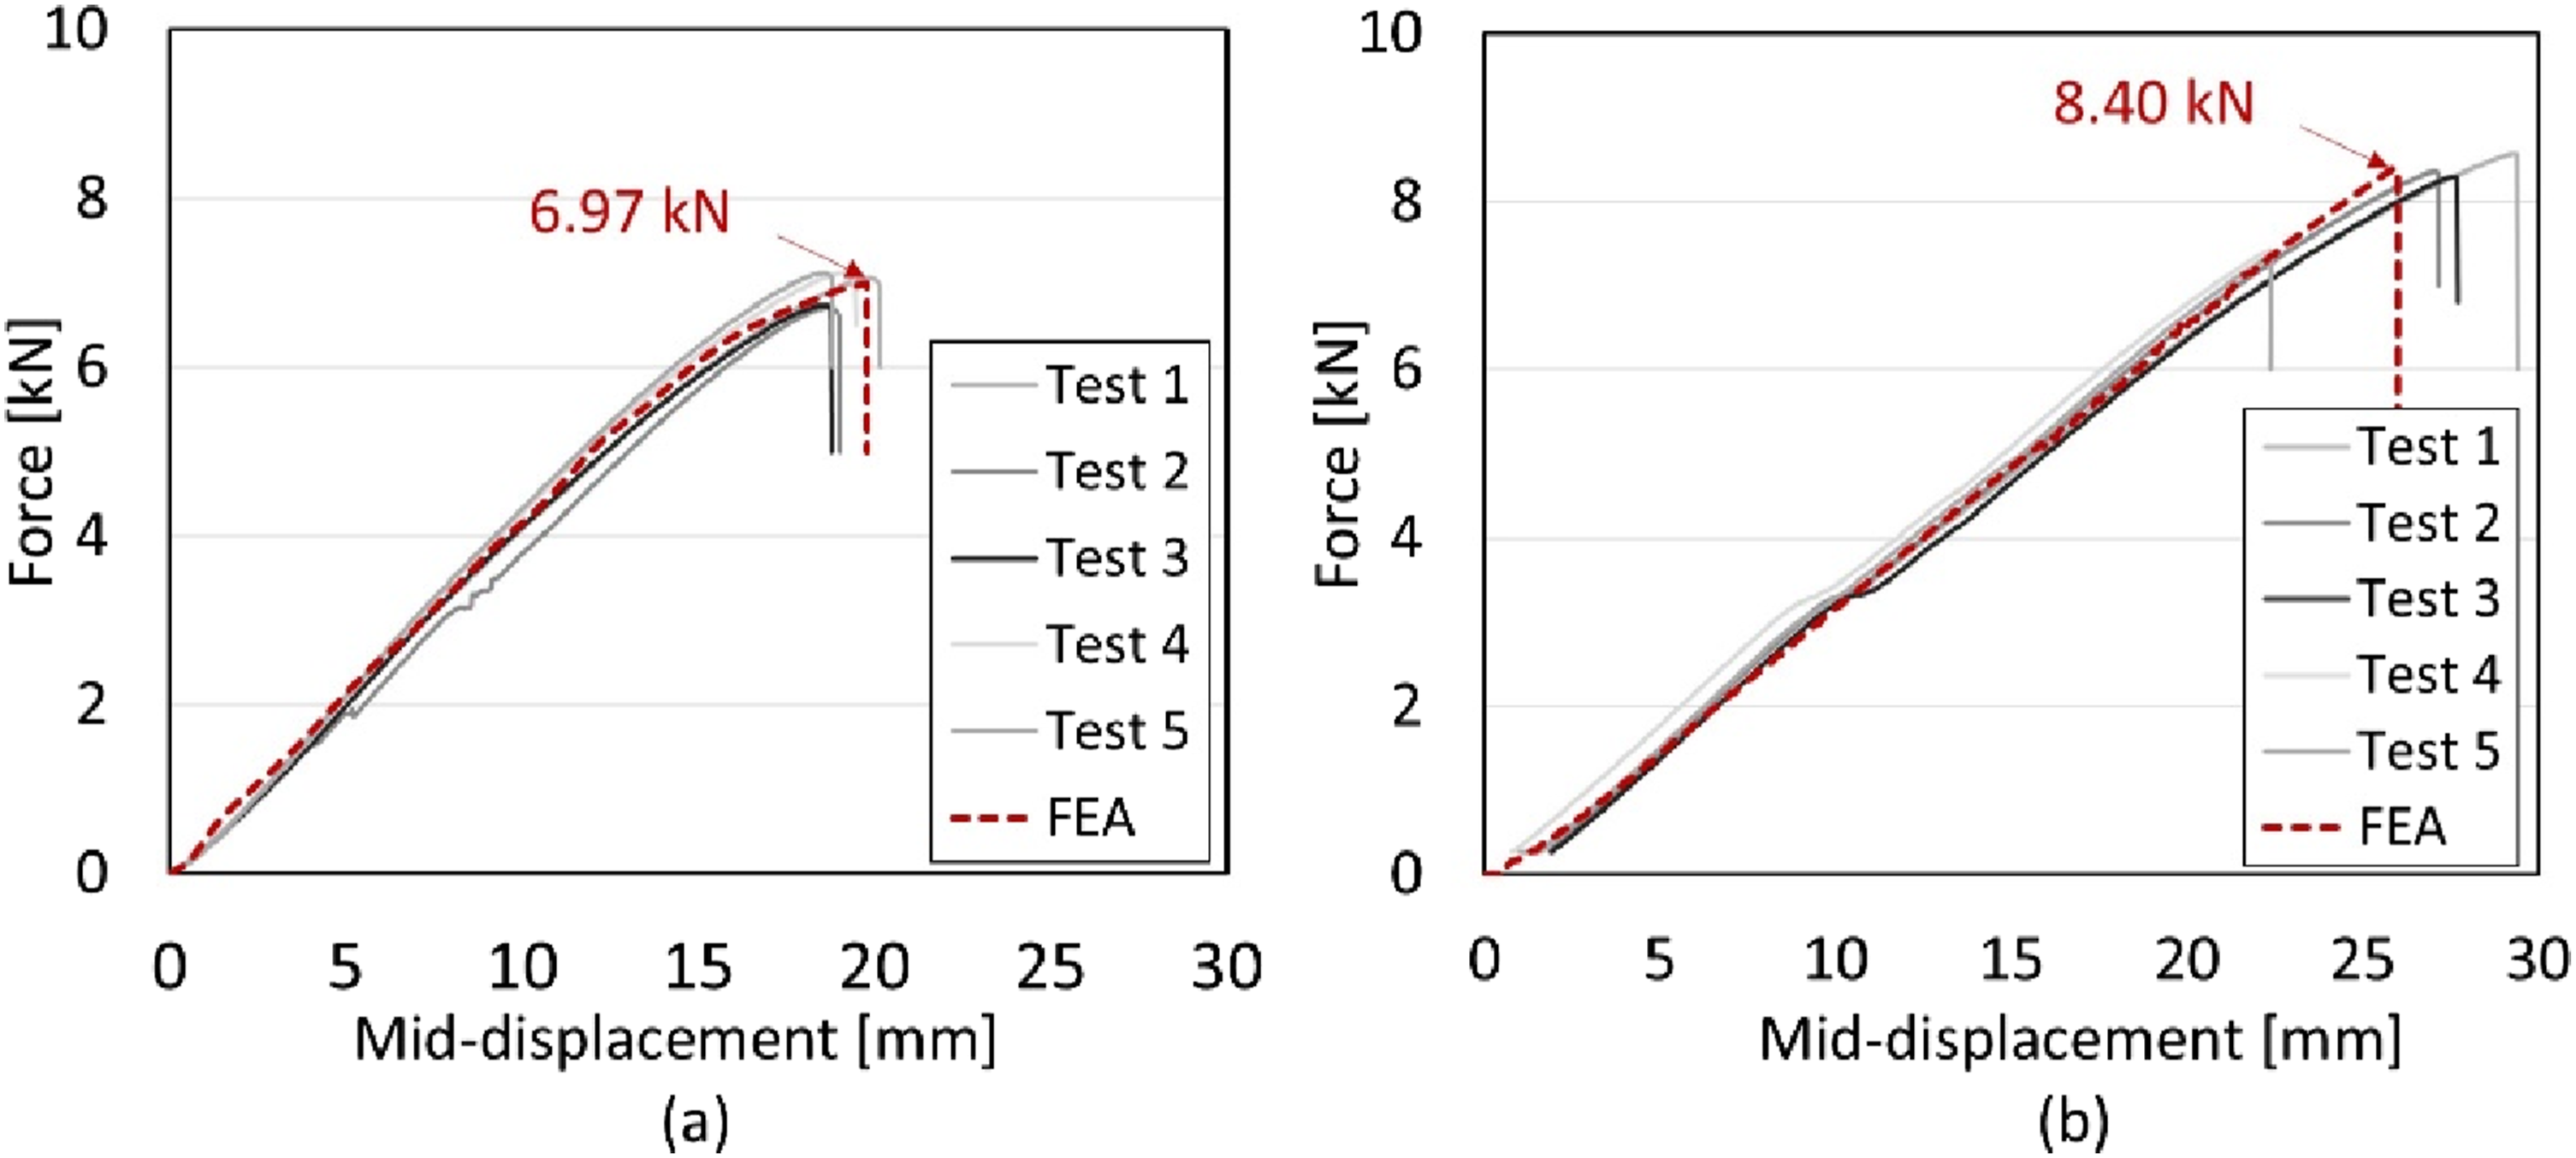
Similar to the PIR 100 panel, non-linear behaviour due to pre-indentation below the loading plate was observed in the two-point loading test just before the shear failure occurred. The transverse shear stress distributions depicted in Figure 14(a) show that the shear stress distribution across the core of the sandwich beam in two-point loading is non-uniform in the shear failure region. It is notable that below the loading point, the shear stress reached a peak value of 0.11 MPa, whereas the core material in most of the shear span experienced a lower stress of 0.09 MPa, which closely aligns with the experimentally obtained shear strength (see Table 8). This point of localized stress below the loading point also acted as the primary initiator of the shear crack. In the four-point loading test, the shear stress in the core was uniformly distributed along the shear span. In this case, a clearly visible shear failure mode was observed, and the ultimate load was greater than in the two-point loading test. FEA results of R-PIR 210/170: (a) 2-point loading, (b) 4-point loading.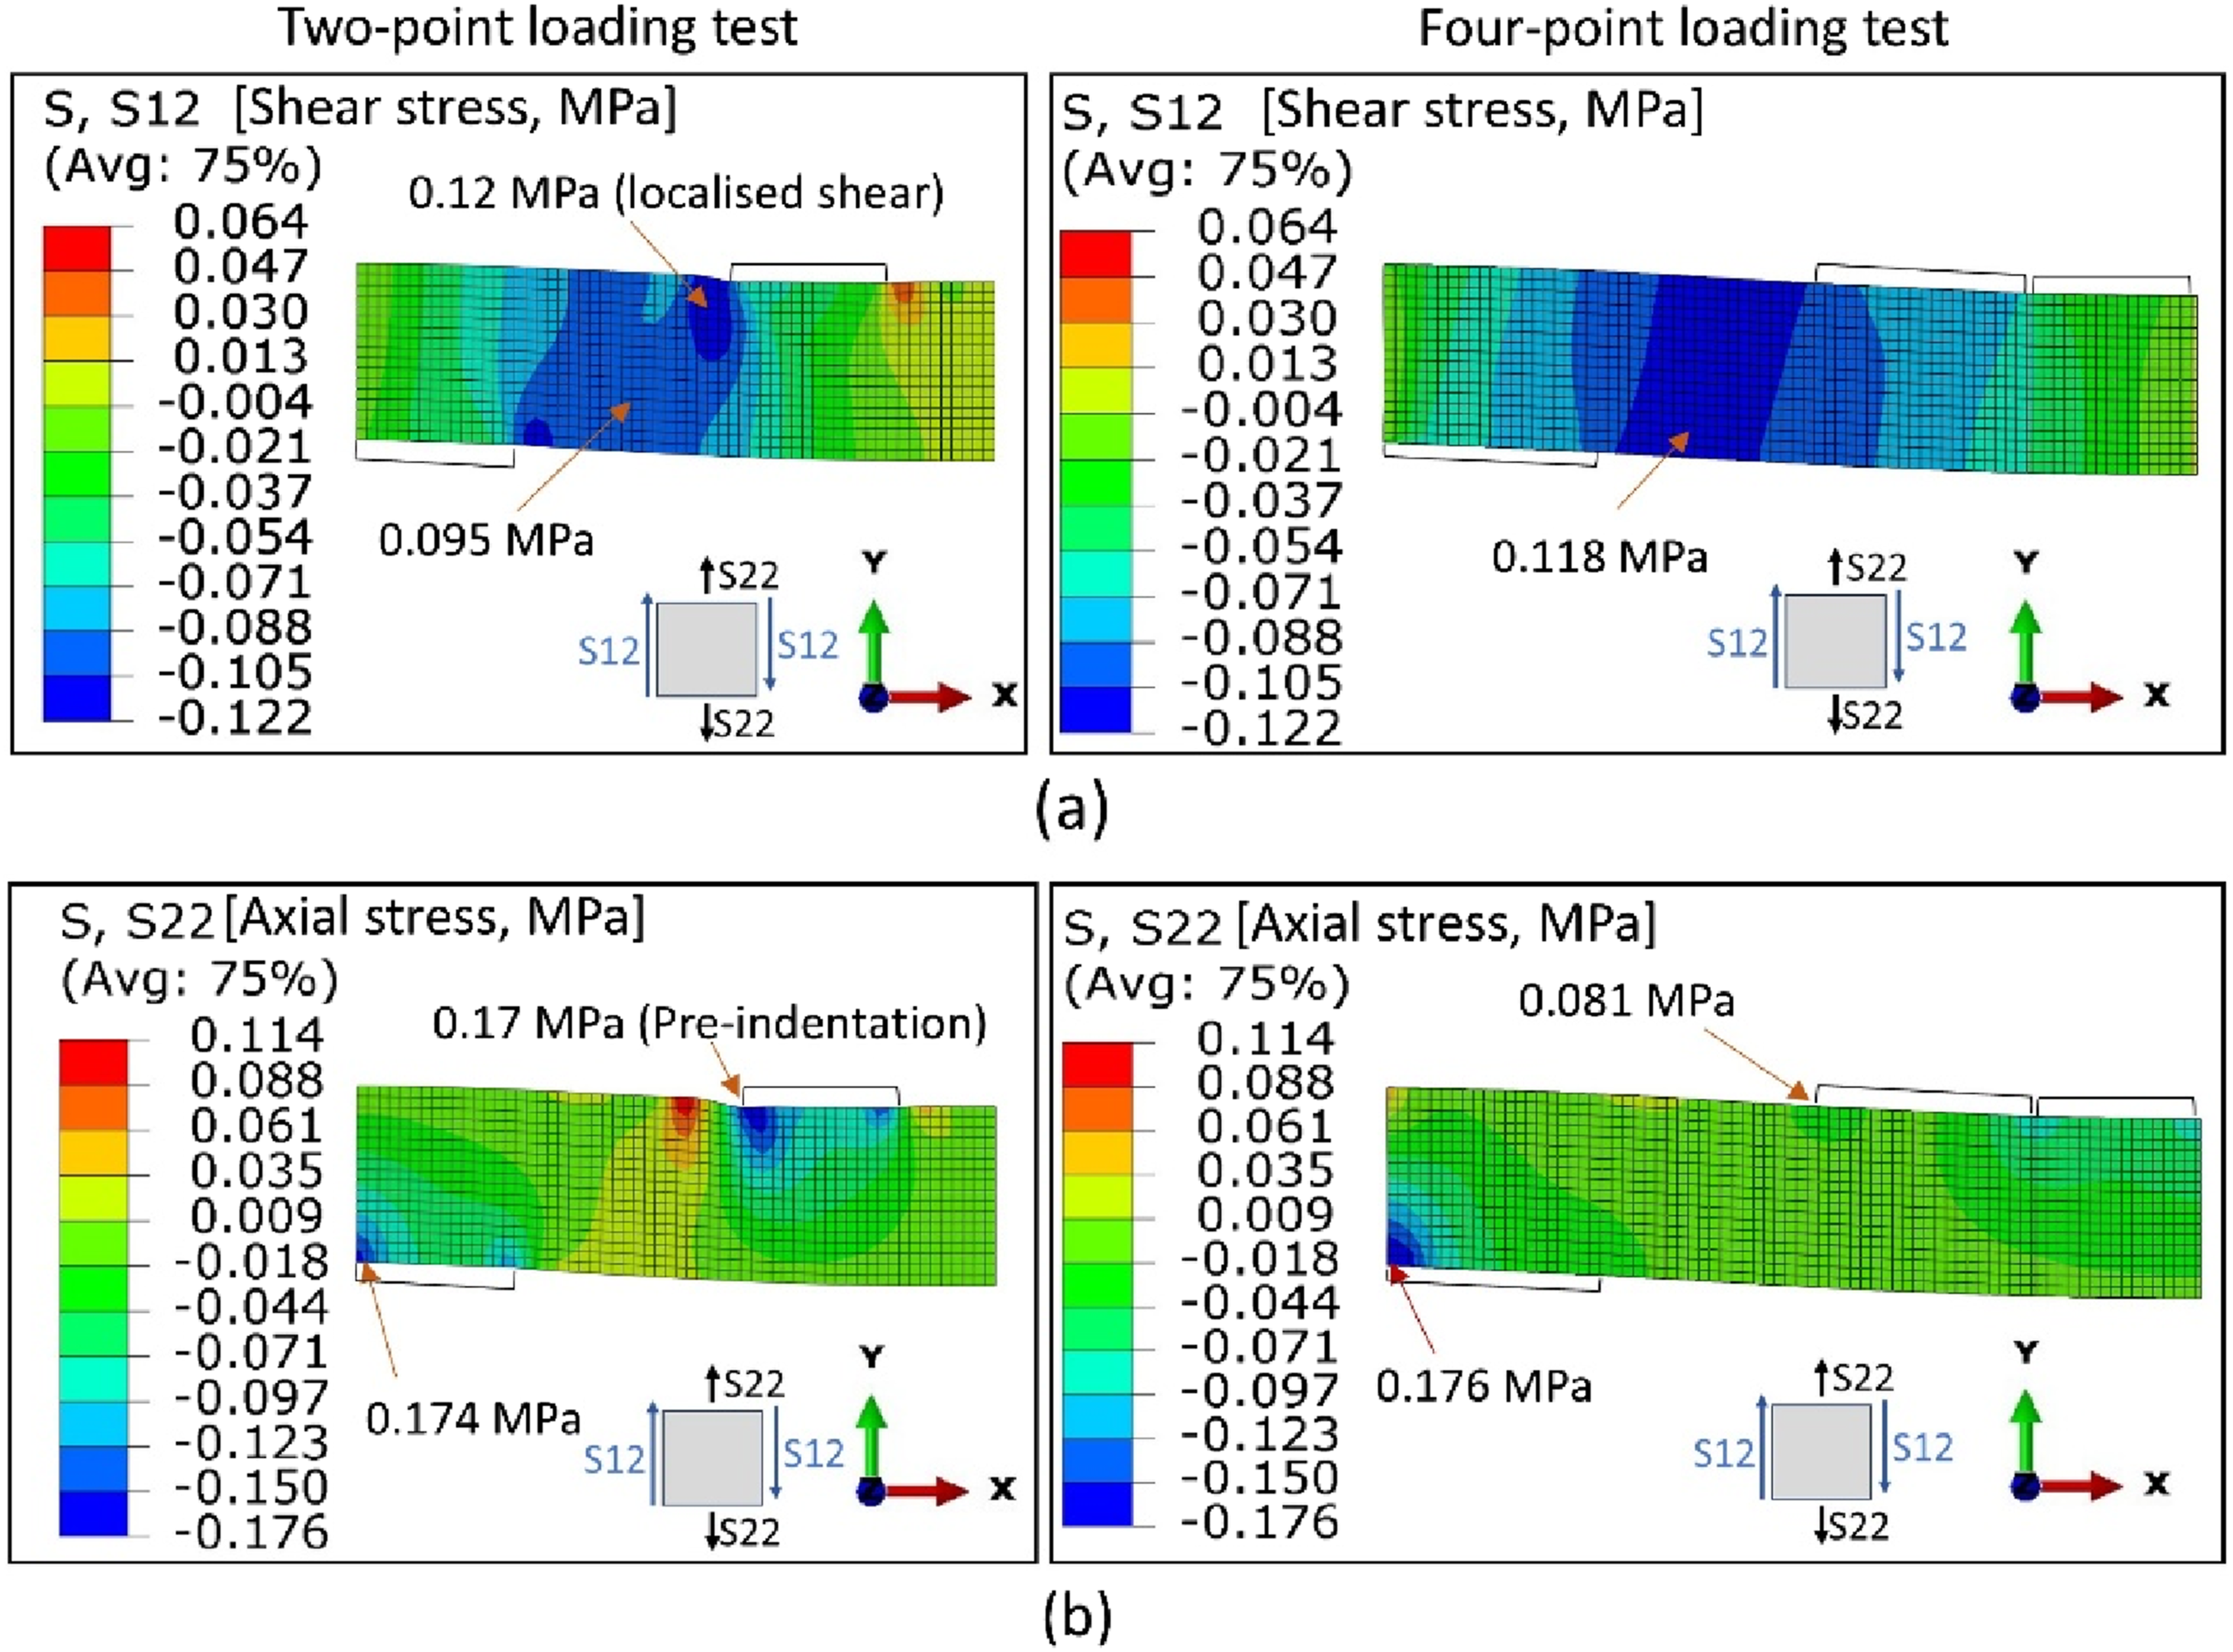
Upon analysing the transverse axial stress below the loading point and above the support point, as depicted in Figure 14(b), it is evident that similar levels of transverse compressive stress were acting on the support point for both test configurations. However, the transverse compressive stress below the loading point in the two-point loading test was almost double compared to the four-point loading test. In the case of the two-point loading test, this high concentration of axial compressive stress below the loading point was the primary cause of local indentation, which acted as the failure initiator. In contrast, the use of four loading points in the four-point loading test significantly reduced this concentration of stress, effectively eliminating the issue of local indentation during the shear test. To further clarify the preliminary pre-indentation, experimental and FEA results obtained immediately before and after failure, as illustrated in Figure 15, were compared. Comparison of experimental results and FEA: (a) Initial local indentation of the core material beneath the loading point as the preliminary failure mode, (b) Shear failure of the core material as the final failure mode.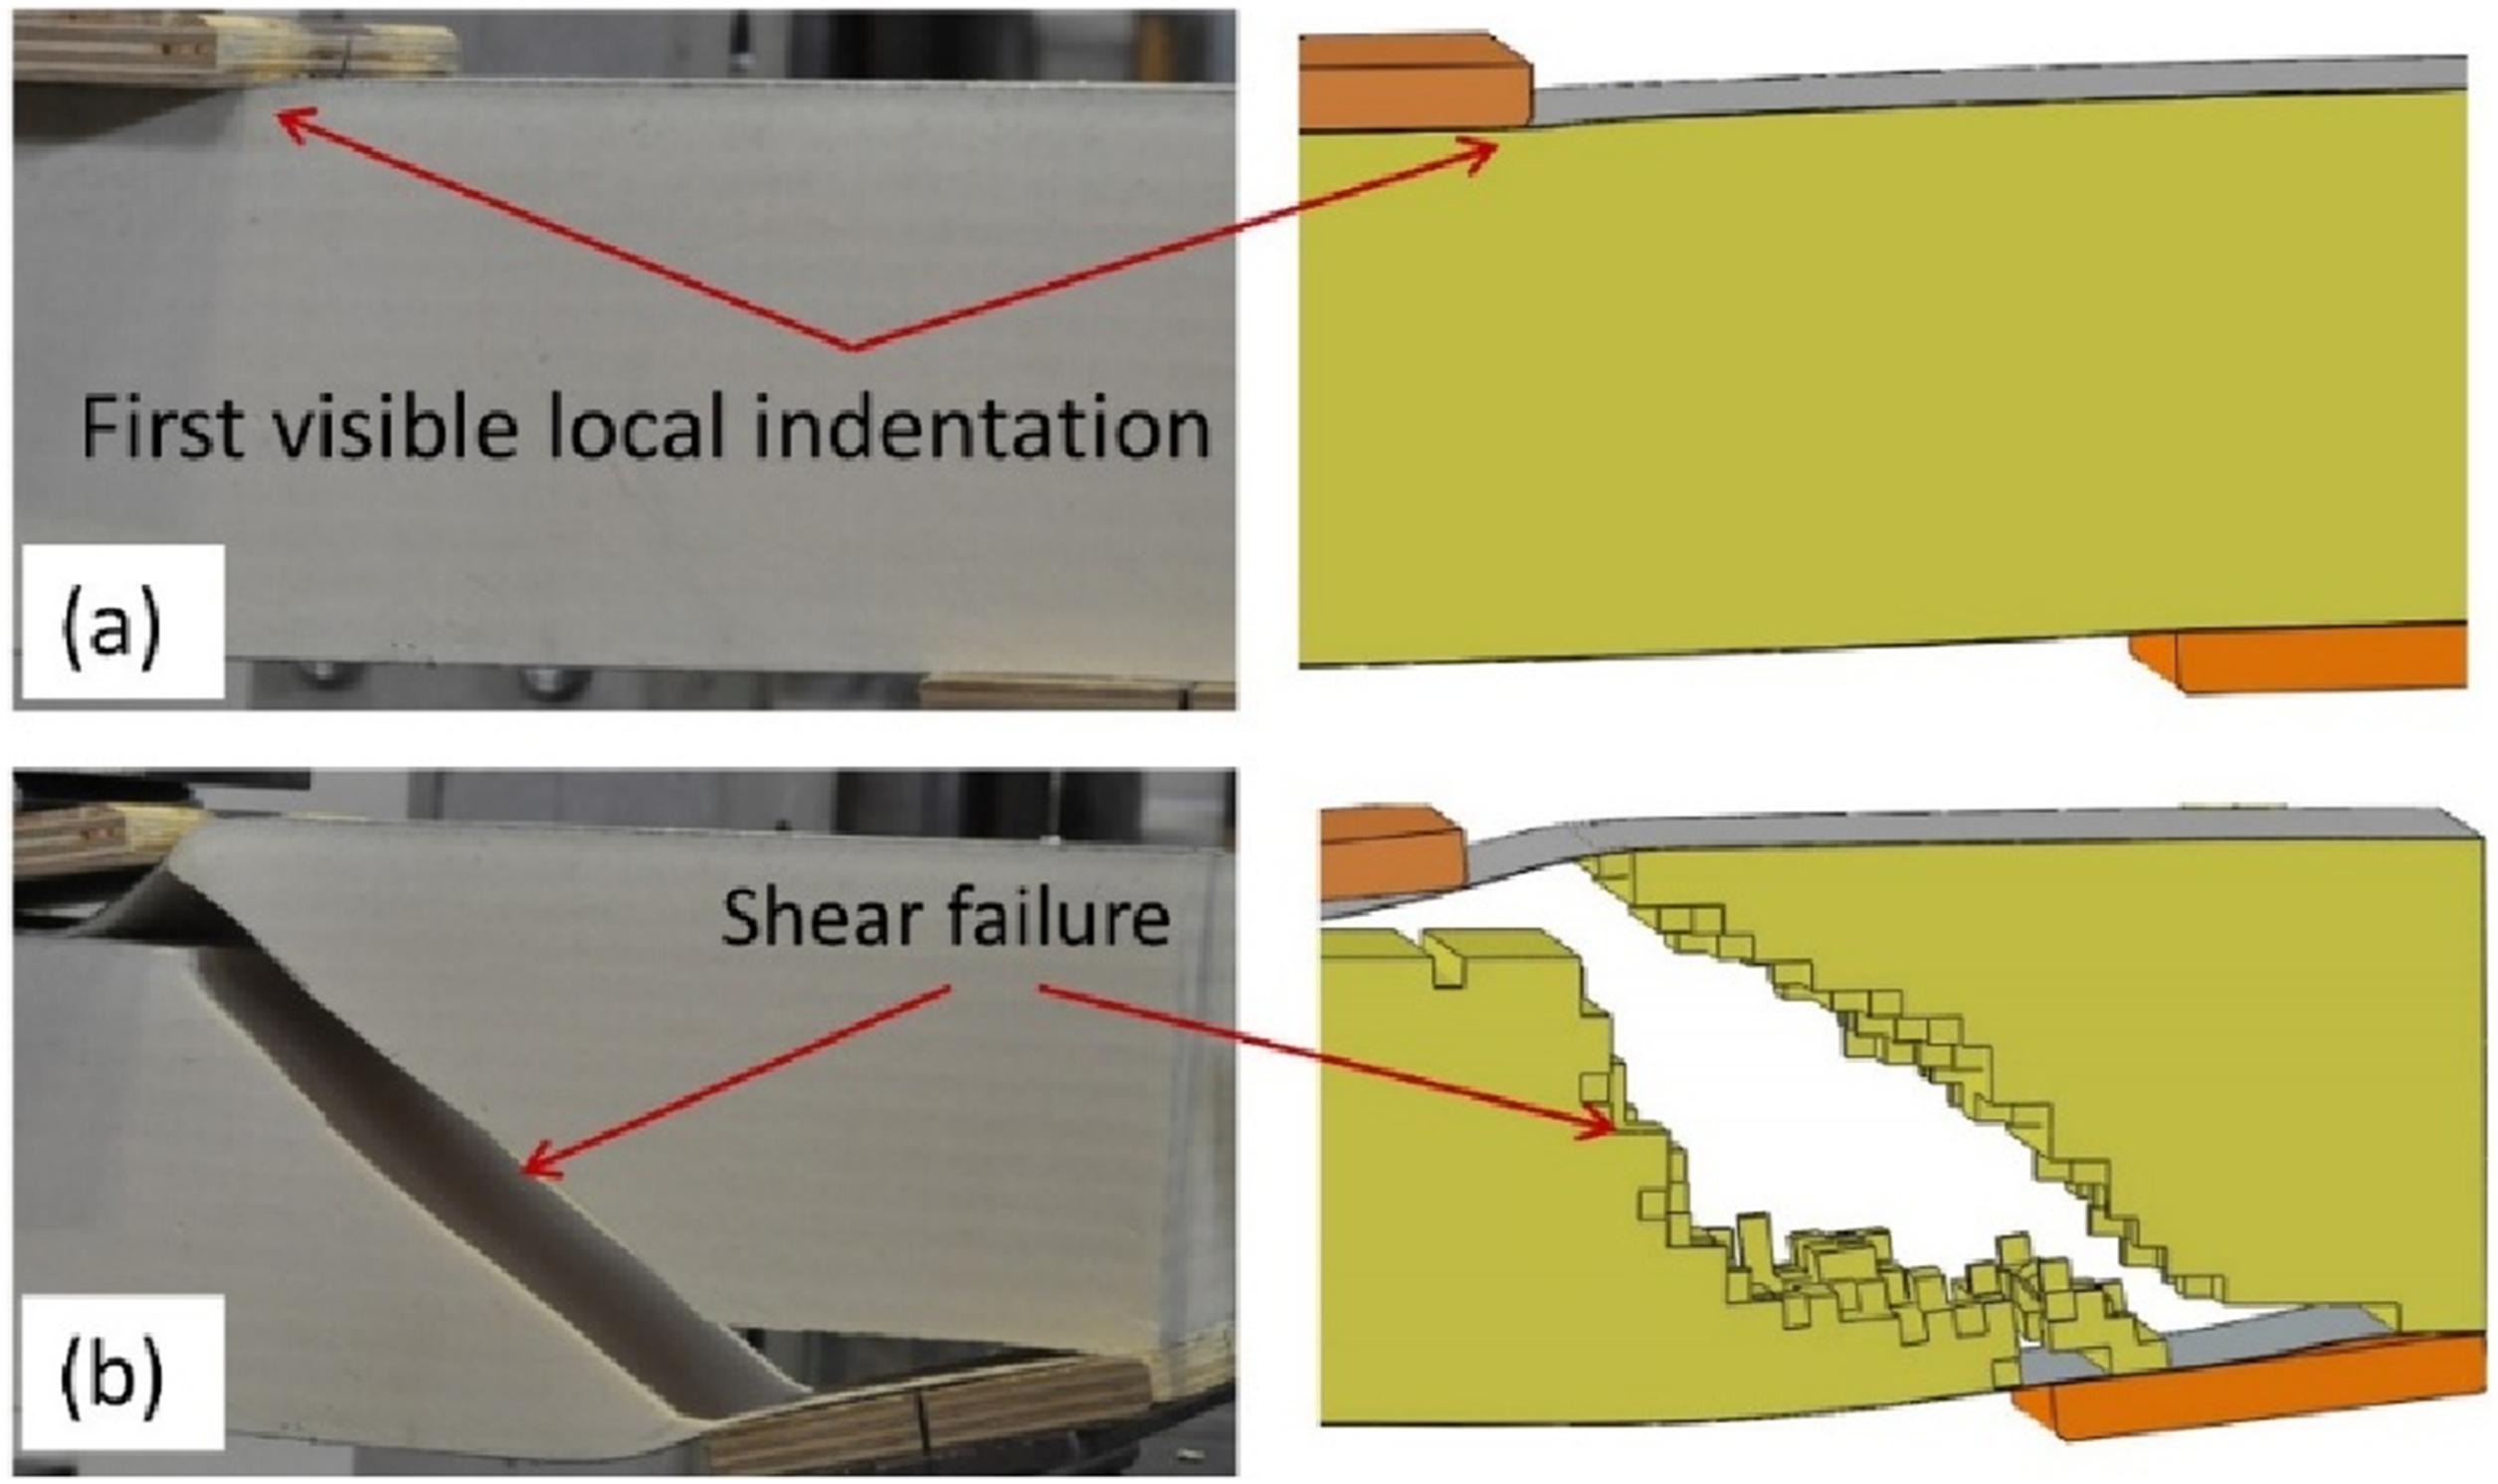
The FEA results revealed that concentrated stress below the loading point caused local indentation of the core material, serving as the primary location for crack initiation, i.e., where the Rankine criterion is first satisfied. This phenomenon is challenging to observe during testing due to the rapid transition between local indentation and shear crack formation, often leading to misinterpretation of shear failure as the main failure mode. However, at this stage, the sandwich beam has not yet reached its full shear strength capacity.
The comparison of force-displacement curves between experimental and FEA results for panel type PIR 200 is presented in Figure 16(a) for the two-point loading test and Figure 16(b) for the four-point loading test. The results demonstrate a close agreement between experimental and FEA outcomes. Comparison of experimental and FE results of PIR 200 panels: (a) 2-point loading, (b) 4-point loading.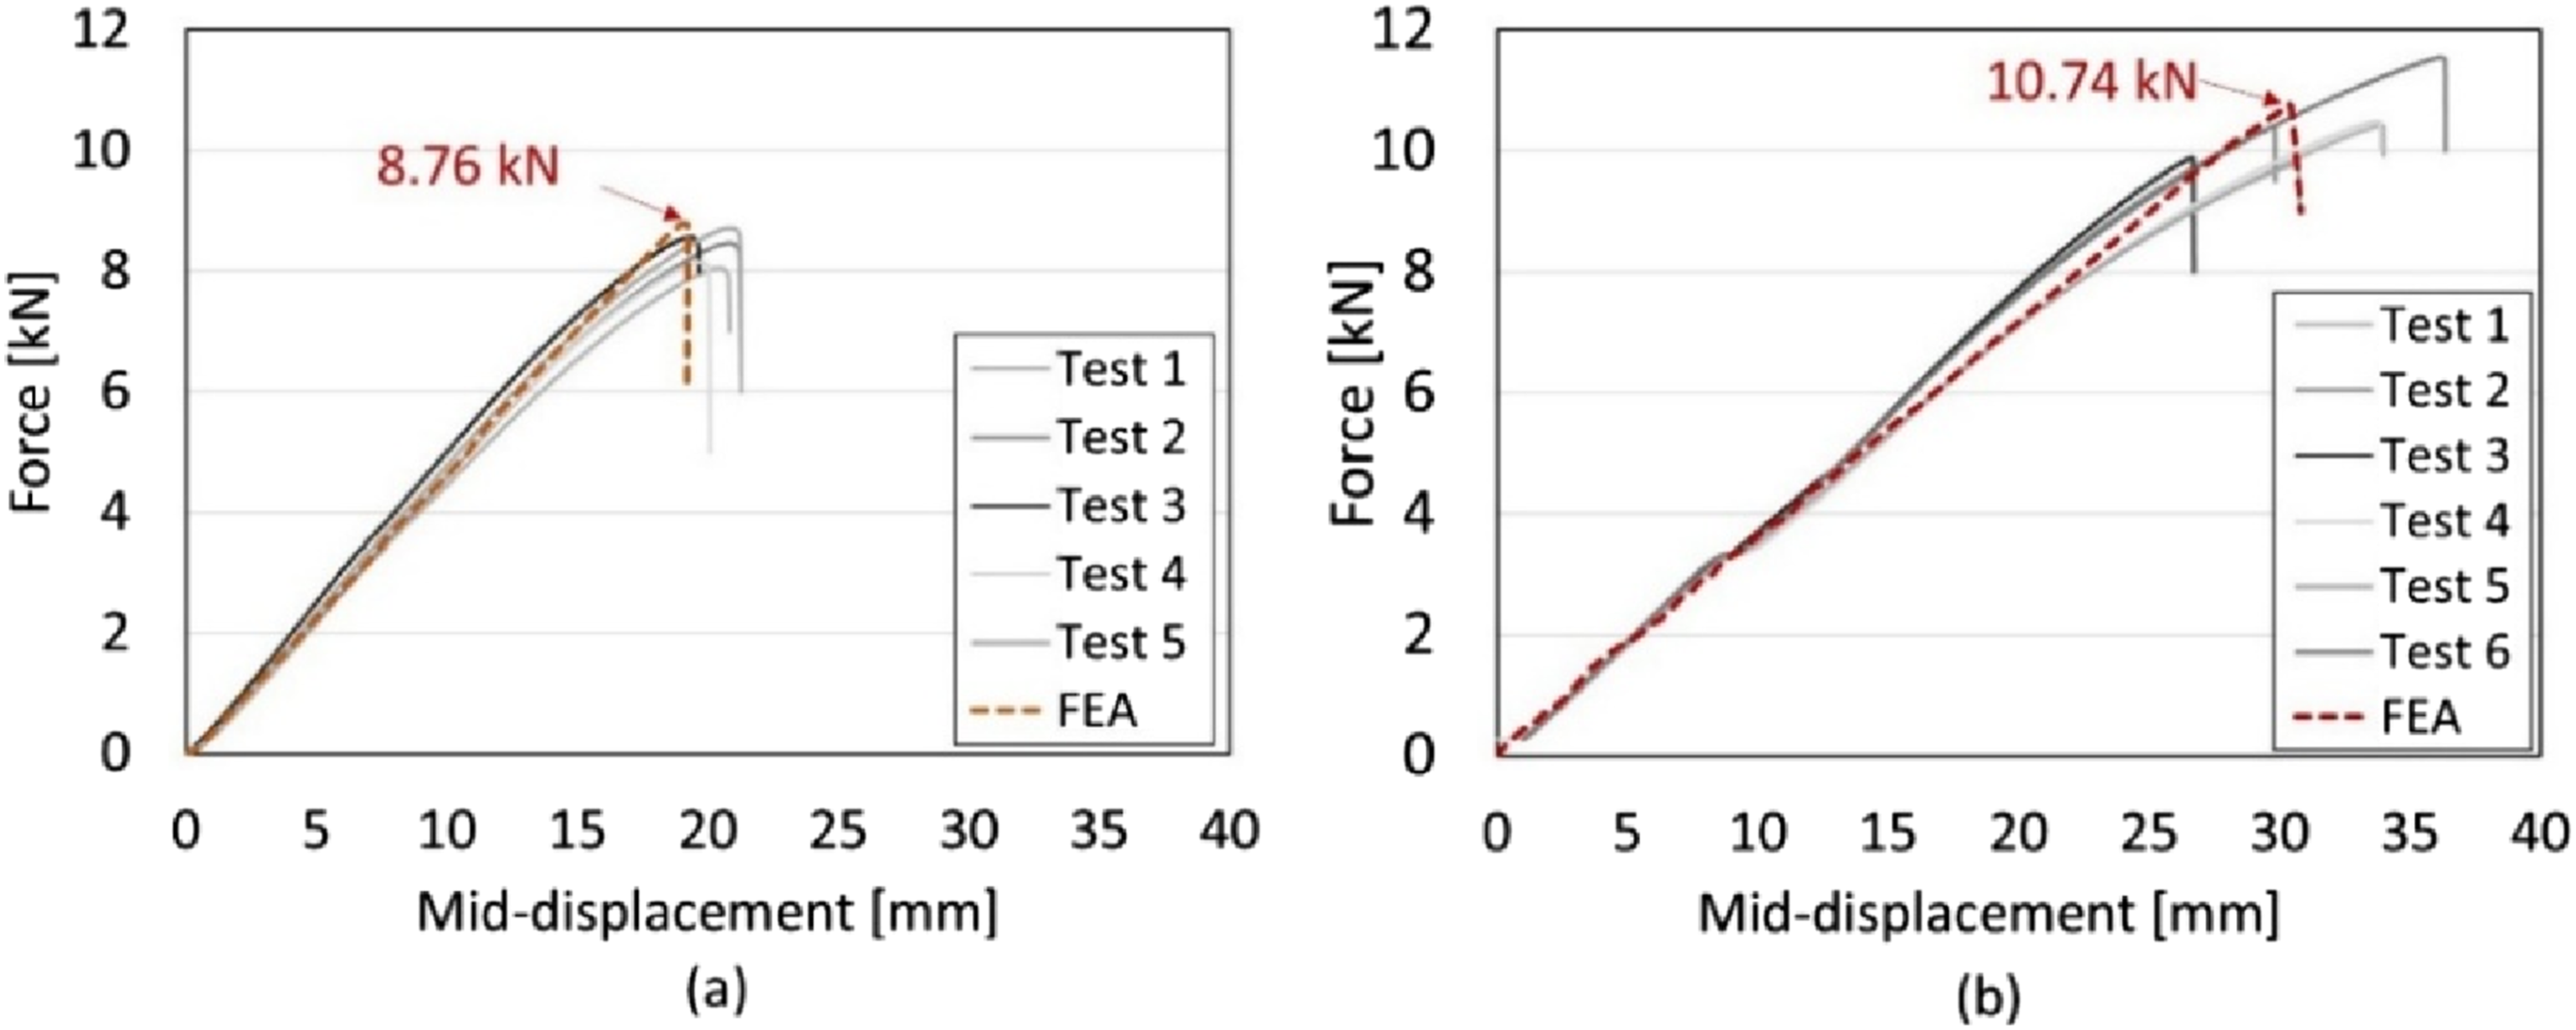
An analysis of the transverse shear stress (Figure 17(a)) and axial stress contour plots (Figure 17(b)) reveals that localized stress beneath the loading point in the two-point loading test caused pre-indentation of the core just before the onset of shear failure. This phenomenon was similar to what was observed in the two-point loading test of R-PIR 210/170. FEA results of PIR 200: (a) 2-point loading, (b) 4-point loading.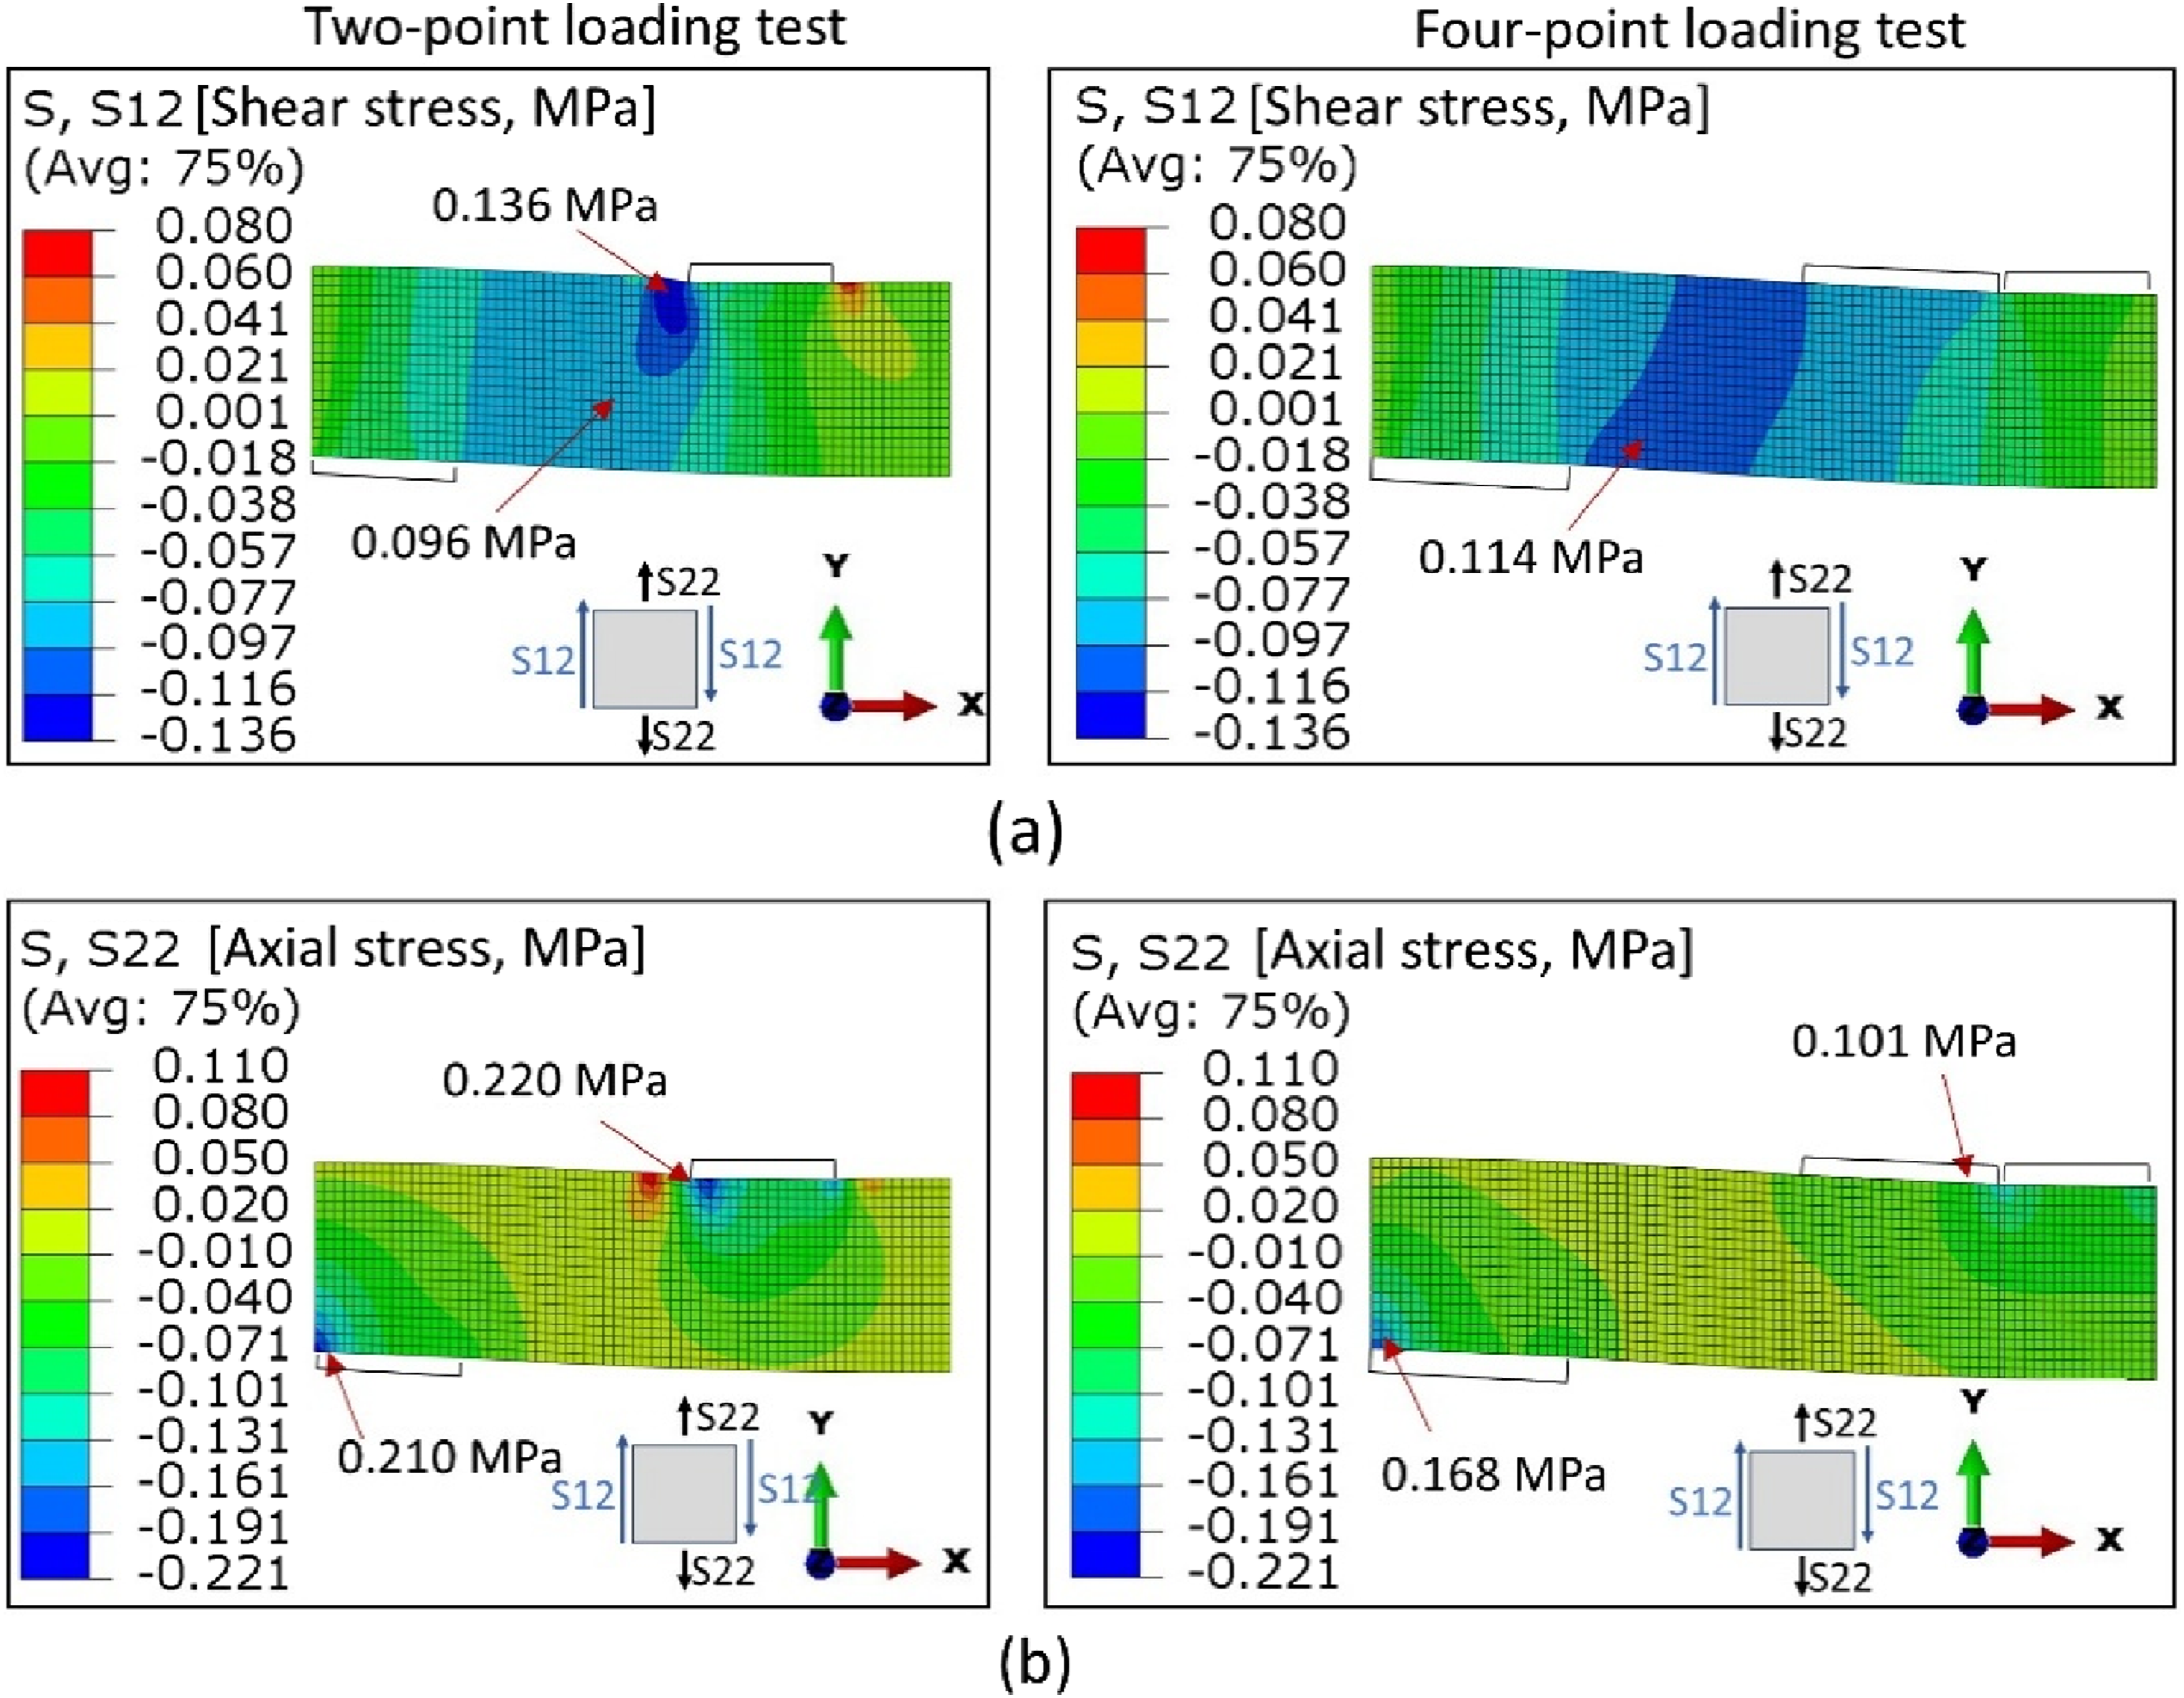
The narrow width (150 mm) of the loading plates contributed significantly to this effect, influencing the test results. To address this issue, an additional two-point loading test was conducted using wider loading and support plates with a width of 200 mm. The contour plots obtained from FEA and the comparison of a force-displacement curve between the experiment and FEA analysis are depicted in Figure 18(a) and (b). The results show that the core of the sandwich beam resisted a higher level of shear force while effectively reducing pre-indentation of the core material beneath the loading points. Additionally, the use of load spreading plates with a width of 200 mm led to an approximately 8% increase in the specimen’s ultimate load capacity. (a) Contour plots showing the transverse shear stress and axial stress, (b) Comparison of the force-displacement curves between the experiment and FEA results.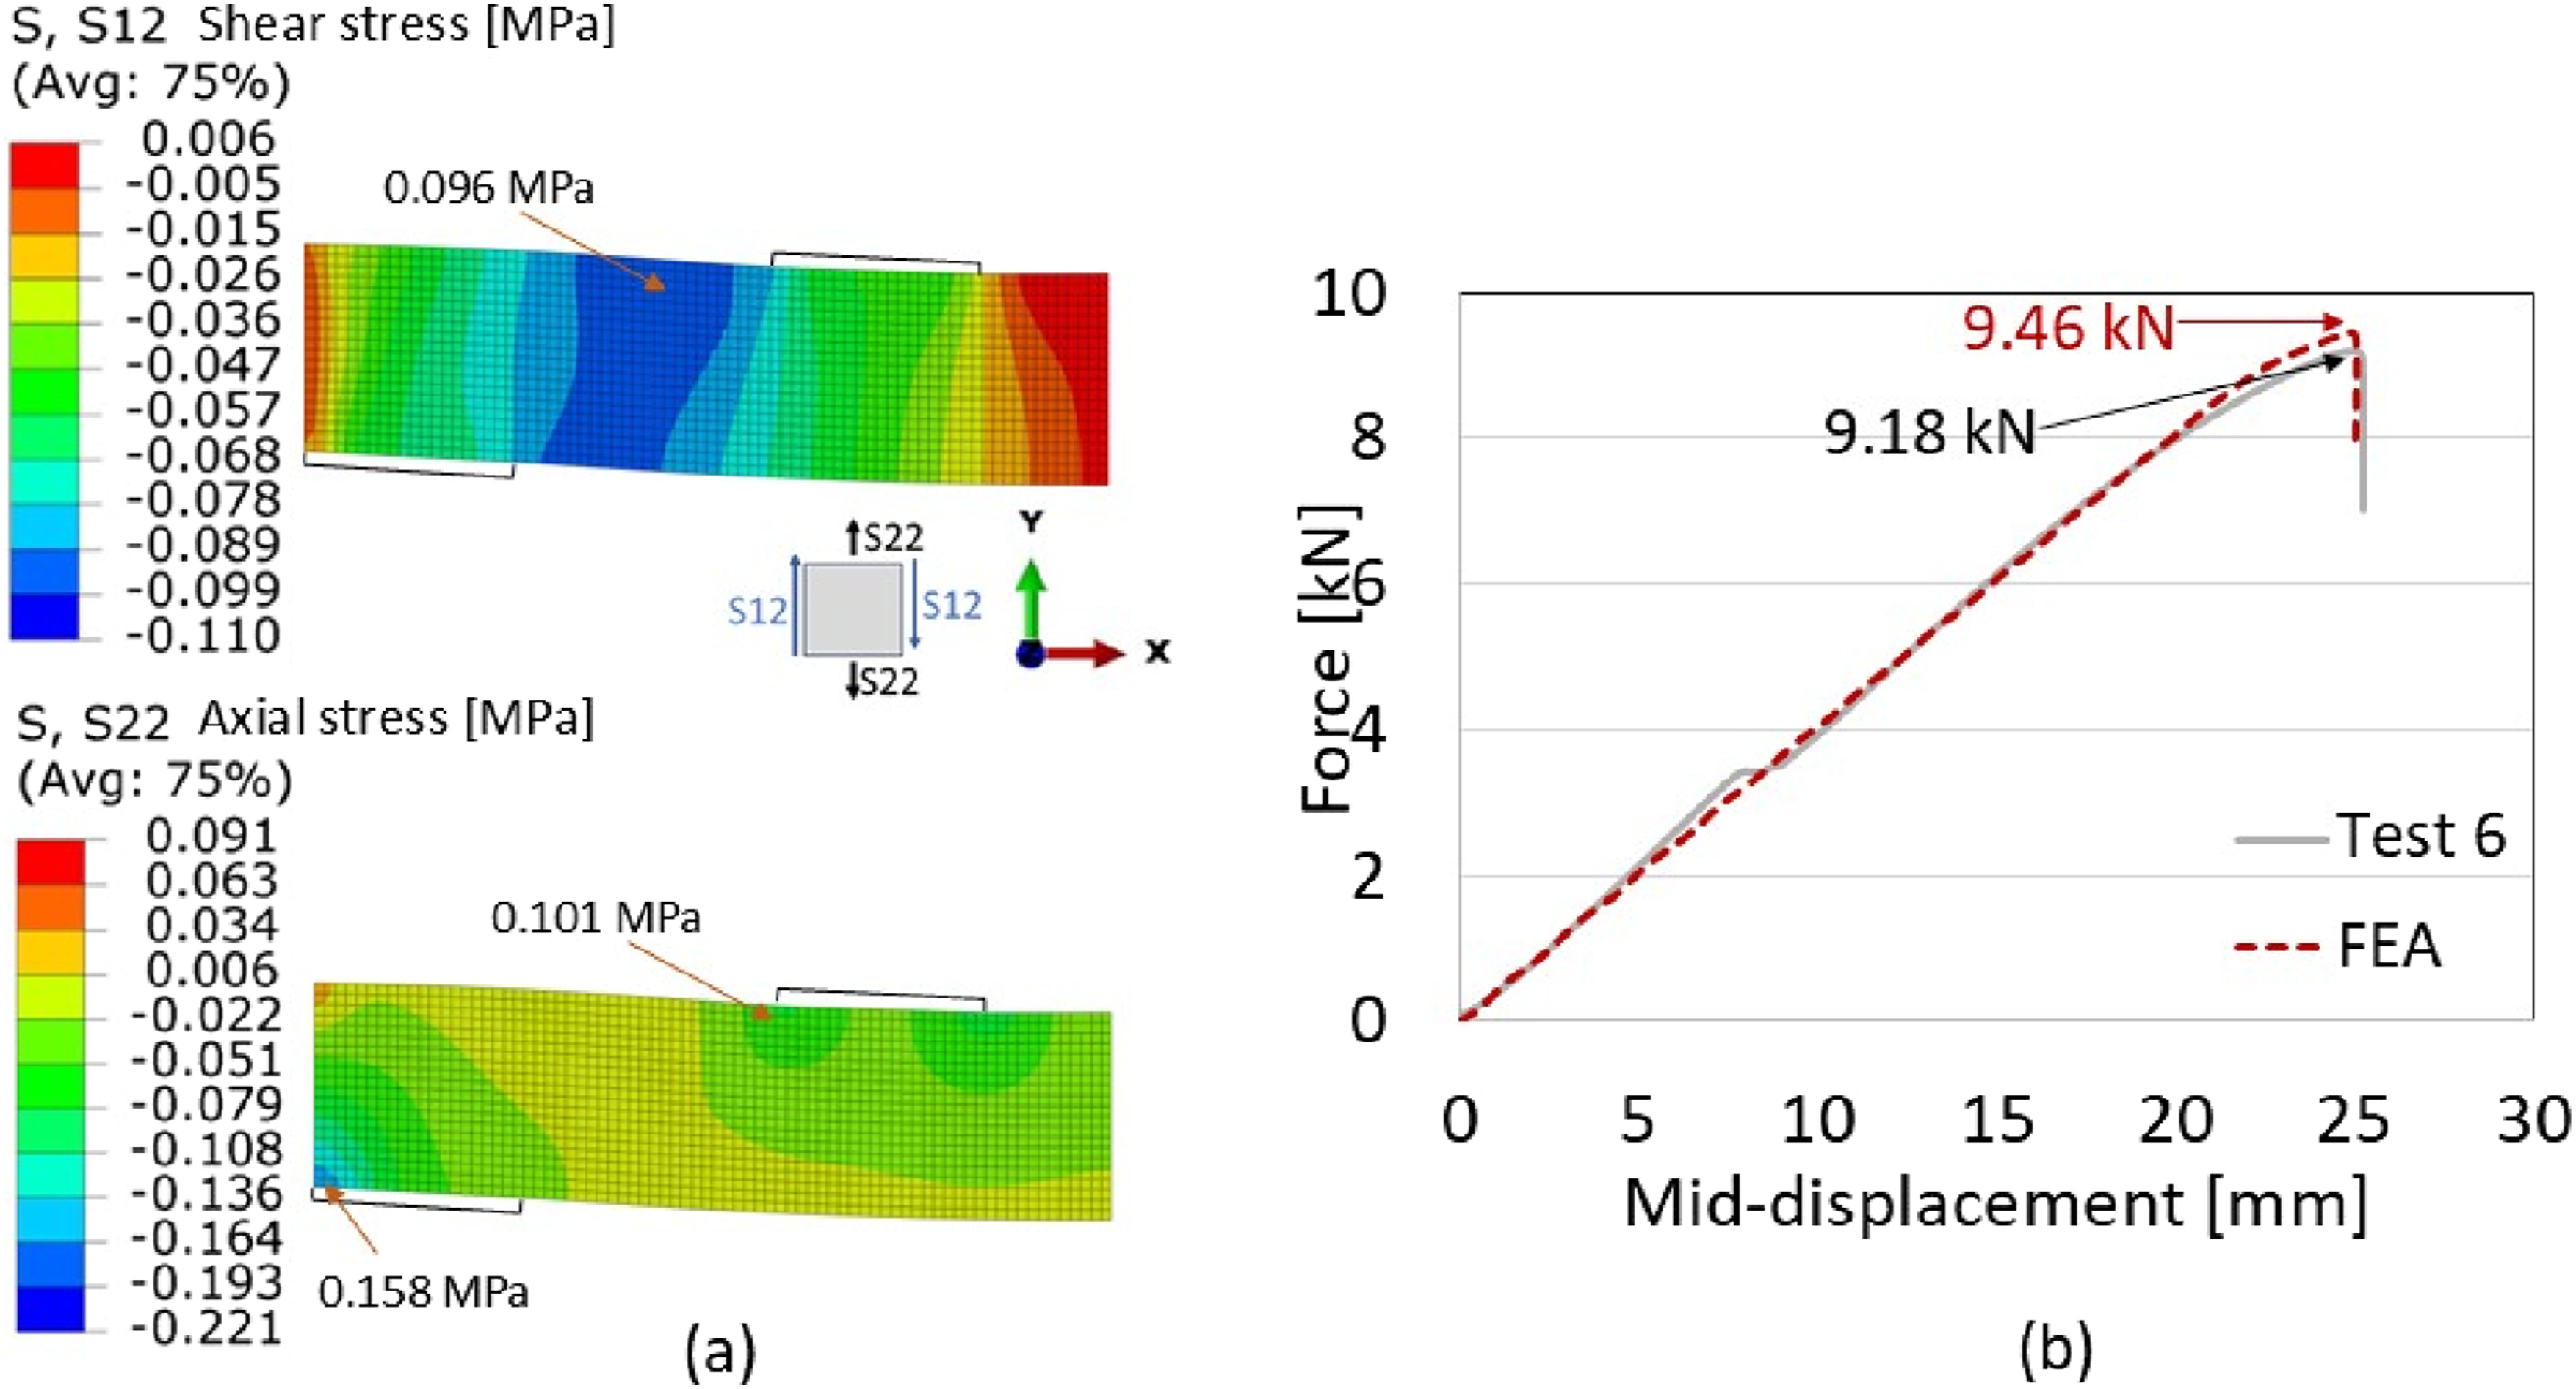
The use of a four-point loading configuration resulted in all the PIR 200 specimens failing in pure shear (both in the experiments and FEA) with shear stress distributed within the shear span, mainly with the inclined crack region as depicted in Figure 17(a). Furthermore, the transverse compression stress below the loading point was significantly reduced, thus decreasing the likelihood of local failure modes not related to shear.
Conclusions
This study emphasizes the importance of carefully considering the loading configuration when performing shear beam tests on sandwich panels with PIR foam cores. The results demonstrate that the commonly used two-point loading configuration has significant drawbacks: although visual observations during testing often suggest a dominant shear failure, numerical simulations reveal that other failure modes, such as local compression, indentation, and buckling in the vicinity of the loading and support plates, develop first and strongly influence the apparent shear failure. Consequently, two-point loading tests can underestimate the true shear strength capacity of sandwich beams, particularly for thicker panels, and may lead to misleading interpretations of the core behaviour.
In contrast, the four-point loading configuration distributes the load over a wider region, thereby reducing local stress concentrations beneath the loading plates. This method promotes a more uniform shear stress distribution within the core and produces failures that are much closer to pure shear. The experimental results consistently show higher shear strength values and clearer shear failure modes for the four-point configuration, indicating that it provides a more accurate characterization of the core’s shear capacity. This highlights that four-point loading is better suited than two-point loading for determining representative shear properties of PIR-core sandwich panels.
The close agreement between the FEA and the experimental results confirms the suitability of the calibrated PIR foam material model and the Rankine-type criterion for capturing shear-related failure. The FEA results reproduce the measured force-displacement response, ultimate load, and observed crack patterns with good accuracy, demonstrating their capability for analysing sandwich panels under shear-dominated loading. With this validated model, future work can incorporate additional failure mechanisms observed experimentally such as face-core debonding and delamination to further enhance the assessment of sandwich panel performance under realistic loading conditions.
Footnotes
Acknowledgments
The authors gratefully acknowledge the financial support provided by the Doctoral School of Industry Innovation at Tampere University, the provision of experimental specimens by Ruukki Construction, and the computational resources supplied by CSC – IT Center for Science, Finland.
Funding
The authors disclosed receipt of the following financial support for the research, authorship, and/or publication of this article: This study was supported by Doctoral School of Industry Innovation at Tampere University.
Declaration of conflicting interests
The authors declared no potential conflicts of interest with respect to the research, authorship, and/or publication of this article.
Data Availability Statement
Data sharing not applicable to this article as no datasets were generated or analyzed during the current study.