
Abstract
This work compares and recommends efficient methods for studying process parameters and their influence on mechanical performance, which is crucial for optimizing the processing of woven fabric-reinforced composites. It addresses the assessment of impregnation quality in woven fiber-reinforced polymer (FRP) laminates, specifically using thermoplastic Polyetherimide (PEI) reinforced with carbon fiber fabric. Specimens were manufactured using an autoclave process under varied process pressures. Their porosity was assessed, along with testing for interlaminar shear strength, in-plane shear strength, in-plane shear modulus, flexural strength, and flexural modulus. The results indicate that the processing pressure has a significant influence on material performance. The in-plane shear strength and interlaminar shear strength exhibited the highest sensitivity, with a 32% performance increase observed from vacuum-only to vacuum combined with 15 bar pressurized air. Interlaminar shear strength emerged as the simplest and quickest test among all conducted mechanical tests. Furthermore, the obtained mechanical performance correlated with void content in the laminates.
Keywords
Introduction
Fiber-reinforced polymers (FRPs) are extensively applied in lightweight structures due to their exceptional mechanical properties and significant potential for weight reduction. These materials are applied in high-performance industries, such as aerospace and automotive, where the performance-to-weight ratio is important.1,2 However, the manufacturing process substantially influences the final mechanical properties of FRPs. Variations in manufacturing parameters can lead to discrepancies between the expected and actual performance of the materials. When determining the optimal processing conditions for a material, it is crucial to utilize a test that is highly sensitive to processing parameters. The higher the sensitivity of a test, the more pronounced the performance changes with variations in processing, thus allowing for precise optimization of manufacturing techniques. 3
Key processing parameters in FRP manufacturing, including time, pressure, and temperature, have a significant impact on laminate quality, which is typically evaluated by void content. 4 Of these processing parameters, pressure was identified as the most influential factor on void content and mechanical properties.5–7 There is extensive literature on the impact of voids and other defects on mechanical performance. 8
Unidirectional laminates under transverse loading are highly sensitive to porosity. Laminate quality can be characterized efficiently using the transverse tensile test or the transverse flexural test. When loading the unidirectional laminates in the longitudinal direction, voids have a lower impact, as this is a fiber-dominated property. 9 Laminates with woven fabric reinforcement have fibers in longitudinal (warp) and transversal (weft) direction, so both loading directions are dominated by the fibers. The tensile as well as the flexural properties in these directions have therefore limited sensitivity to porosity. 8
As an alternative for laminates with woven fabric reinforcement, interlaminar shear strength is widely used as it shows high sensitivity to void content, with studies showing a linear decrease of 5%–10% for each 1% increase in void volume fraction.10–15 However, woven fabrics tend to be less sensitive to voids than unidirectional laminates, as their structure provides natural resistance to crack propagation in the matrix. This increased resistance to interlaminar shear fracture results in lower sensitivity to voids.16–18
The impact of voids on the in-plane shear properties is less documented, yet studies show that porosity significantly impacts in-plane shear modulus and strength, with a sensitivity comparable to interlaminar shear properties.19,20 The impact of voids on the flexural behavior is complex, combining tensile, compressive, and interlaminar shear properties, and is thus difficult to generalize. The combination of these mechanisms makes it difficult to draw general conclusions. However, studies consistently report a few percent reduction in flexural stiffness and a flexural strength decrease of up to 10% per 1% increase in void content, indicating that flexural strength is more sensitive to voids than flexural stiffness.13,21–23
While most studies have focused on thermoset matrix systems, similar trends are observed in thermoplastic composites. 8 Fiber impregnation is of particular interest for thermoplastic matrix systems. Thermoplastic polymers have a higher viscosity in manufacturing than thermosets, which makes fiber impregnation more challenging. This can lead to high void contents with negative effects on material performance. Recent advancements have therefore focused on enhancing fiber impregnation techniques. 24
Research gap
This study compares the sensitivity of different mechanical characterization methods to processing defects in woven thermoplastic composites. The widely used interlaminar shear strength is evaluated along with alternative methods, including the novel ±45° flexural test and the in-plane shear test. Existing literature indicates that the in-plane shear properties are highly sensitive to void content, while the effect of porosity on ± 45° flexural performance has not been directly compared to other test methods until now. By comparing and discussing these approaches, this study aims to identify an efficient and sensitive mechanical test for assessing processing parameters and defects in woven thermoplastic composites.
Sample preparation
Materials
The preform used in this study consists of a CarboTex CT240K-200 carbon fiber fabric with a 2 × 2 twill weave, consisting of 3K carbon fiber tows with a linear density of 200 tex and an area weight of 240 g/m2.
The carbon fabric is combined with two layers of thermoplastic PEI fibers in the form of a 100 g/m2 fleece. The carbon and thermoplastic fibers are combined in a needle-punching process.
The resulting preform has a total areal weight of 440 g/m2, corresponding to a fiber mass content of 54.5% and a fiber volume fraction of 45.6%. Once fully consolidated, the material, commercially available as KyronTEX C55FAB 440 (Mitsubishi Chemical Advanced Materials, Germany), has a ply thickness of 0.29 mm and a density of 1.516 g/m2.
Tool
Specimen manufacturing took place in a special tool that is able to simulate an autoclave process in a hot press. The concept was first presented by Lystrup
4
: The tool consists of two milled steel molds in combination with a compressor and a vacuum pump. A schematic cross section is shown in Figure 1. A special tool was used to manufacture specimens in an autoclave-like process. Annotations for the tool are provided in the tool sub-section.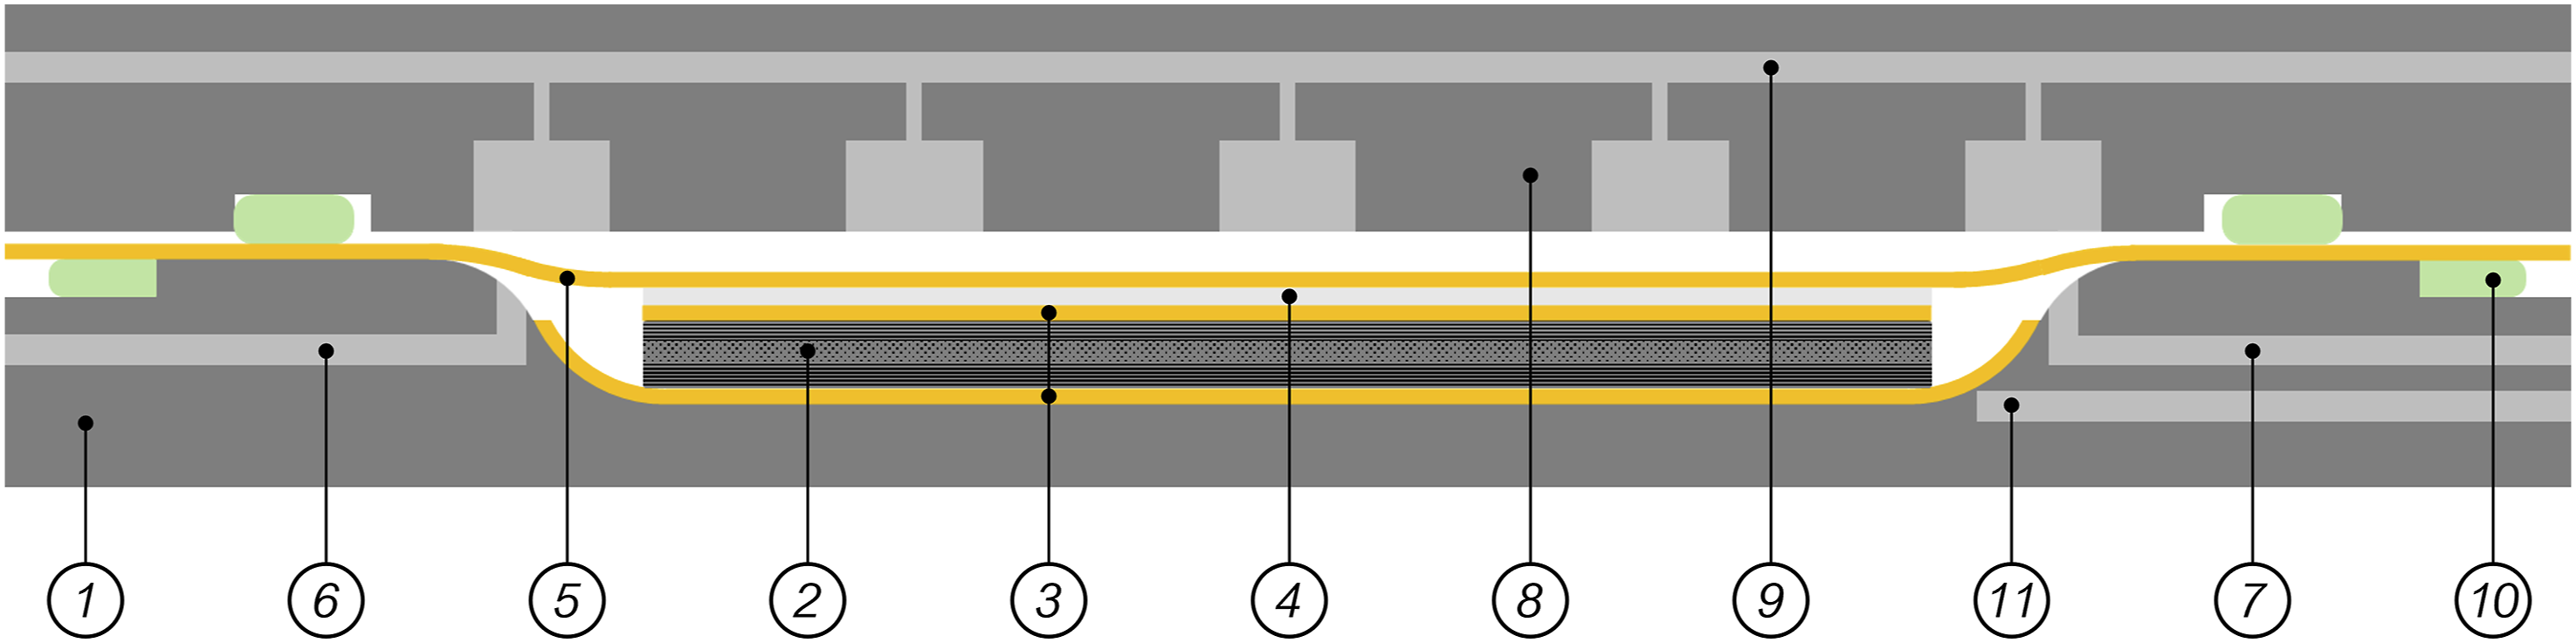
The bottom part of the tool (1) has a groove, in which the laminate (2) is placed between two layers of release film (3; Thermalimide RCBS Ultra high temperature release film, Airtech International, USA). The layup is covered by a breather (4; Glass Fiber Plain Weave 3K No. 850 0300, Tissa Textiles, Switzerland) and a vacuum foil (5; Thermalimide Ultra high temperature bagging film, Airtech International, USA). The bottom part has two holes, which connect to a vacuum pump (6) and a vacuum gauge for monitoring the vacuum during the process (7). The top part of the tool (8) includes multiple grooves (9), where the compressed air can spread to generate an even pressure on the top side of the vacuum foil. The vacuum foil is placed between the two parts and sealed with sealant tape (10; A-800-3G, Airtech International, USA) on each side. Both parts of the tool include holes to insert thermocouples (11) to measure the temperature close to the laminate. Whereas common autoclaves need to run under nitrogen for high temperature thermoplastic polymers, 25 the tool can run high-temperature processes under air.
Sample manufacturing
Samples were manufactured in the described tool following the temperature and pressure cycles shown in Figure 2. The material was laid up in the tool, which was then inserted into a pre-heated hot press. The processing of the CF-PEI intermediate material occurred at 360°C, with a hold time of 30 minutes under varying pressures ranging from vacuum-only to vacuum combined with 15 bar pressure. Due to the inadequate sealing of the sealant tape at low temperatures, pressure was incrementally applied as the temperature increased to prevent the escape of pressurized air. During the cooling phase, specimens processed at pressures above 6 bar were held at a lower pressure to reduce leakage. Previous studies have shown that cooling at a pressure lower than the consolidation pressure can still maintain consolidation without a significant loss in material properties.
26
Meanwhile, the vacuum was maintained throughout all processes, with the process temperature held steady at 360°C. Pressure application coincided with the heating phase, which approximately lasted 30 minutes until the laminate temperature reached 360°C. Subsequently, the tool was transferred from the hot press to a cold press for cooling. Temperature and pressure cycles during specimen manufacturing: Samples were held at 360°C for 30 minutes under different pressures with vacuum applied. After the hold time in the hot press, the tool was transferred to a cold press by removing and then reapplying pressure for cooling.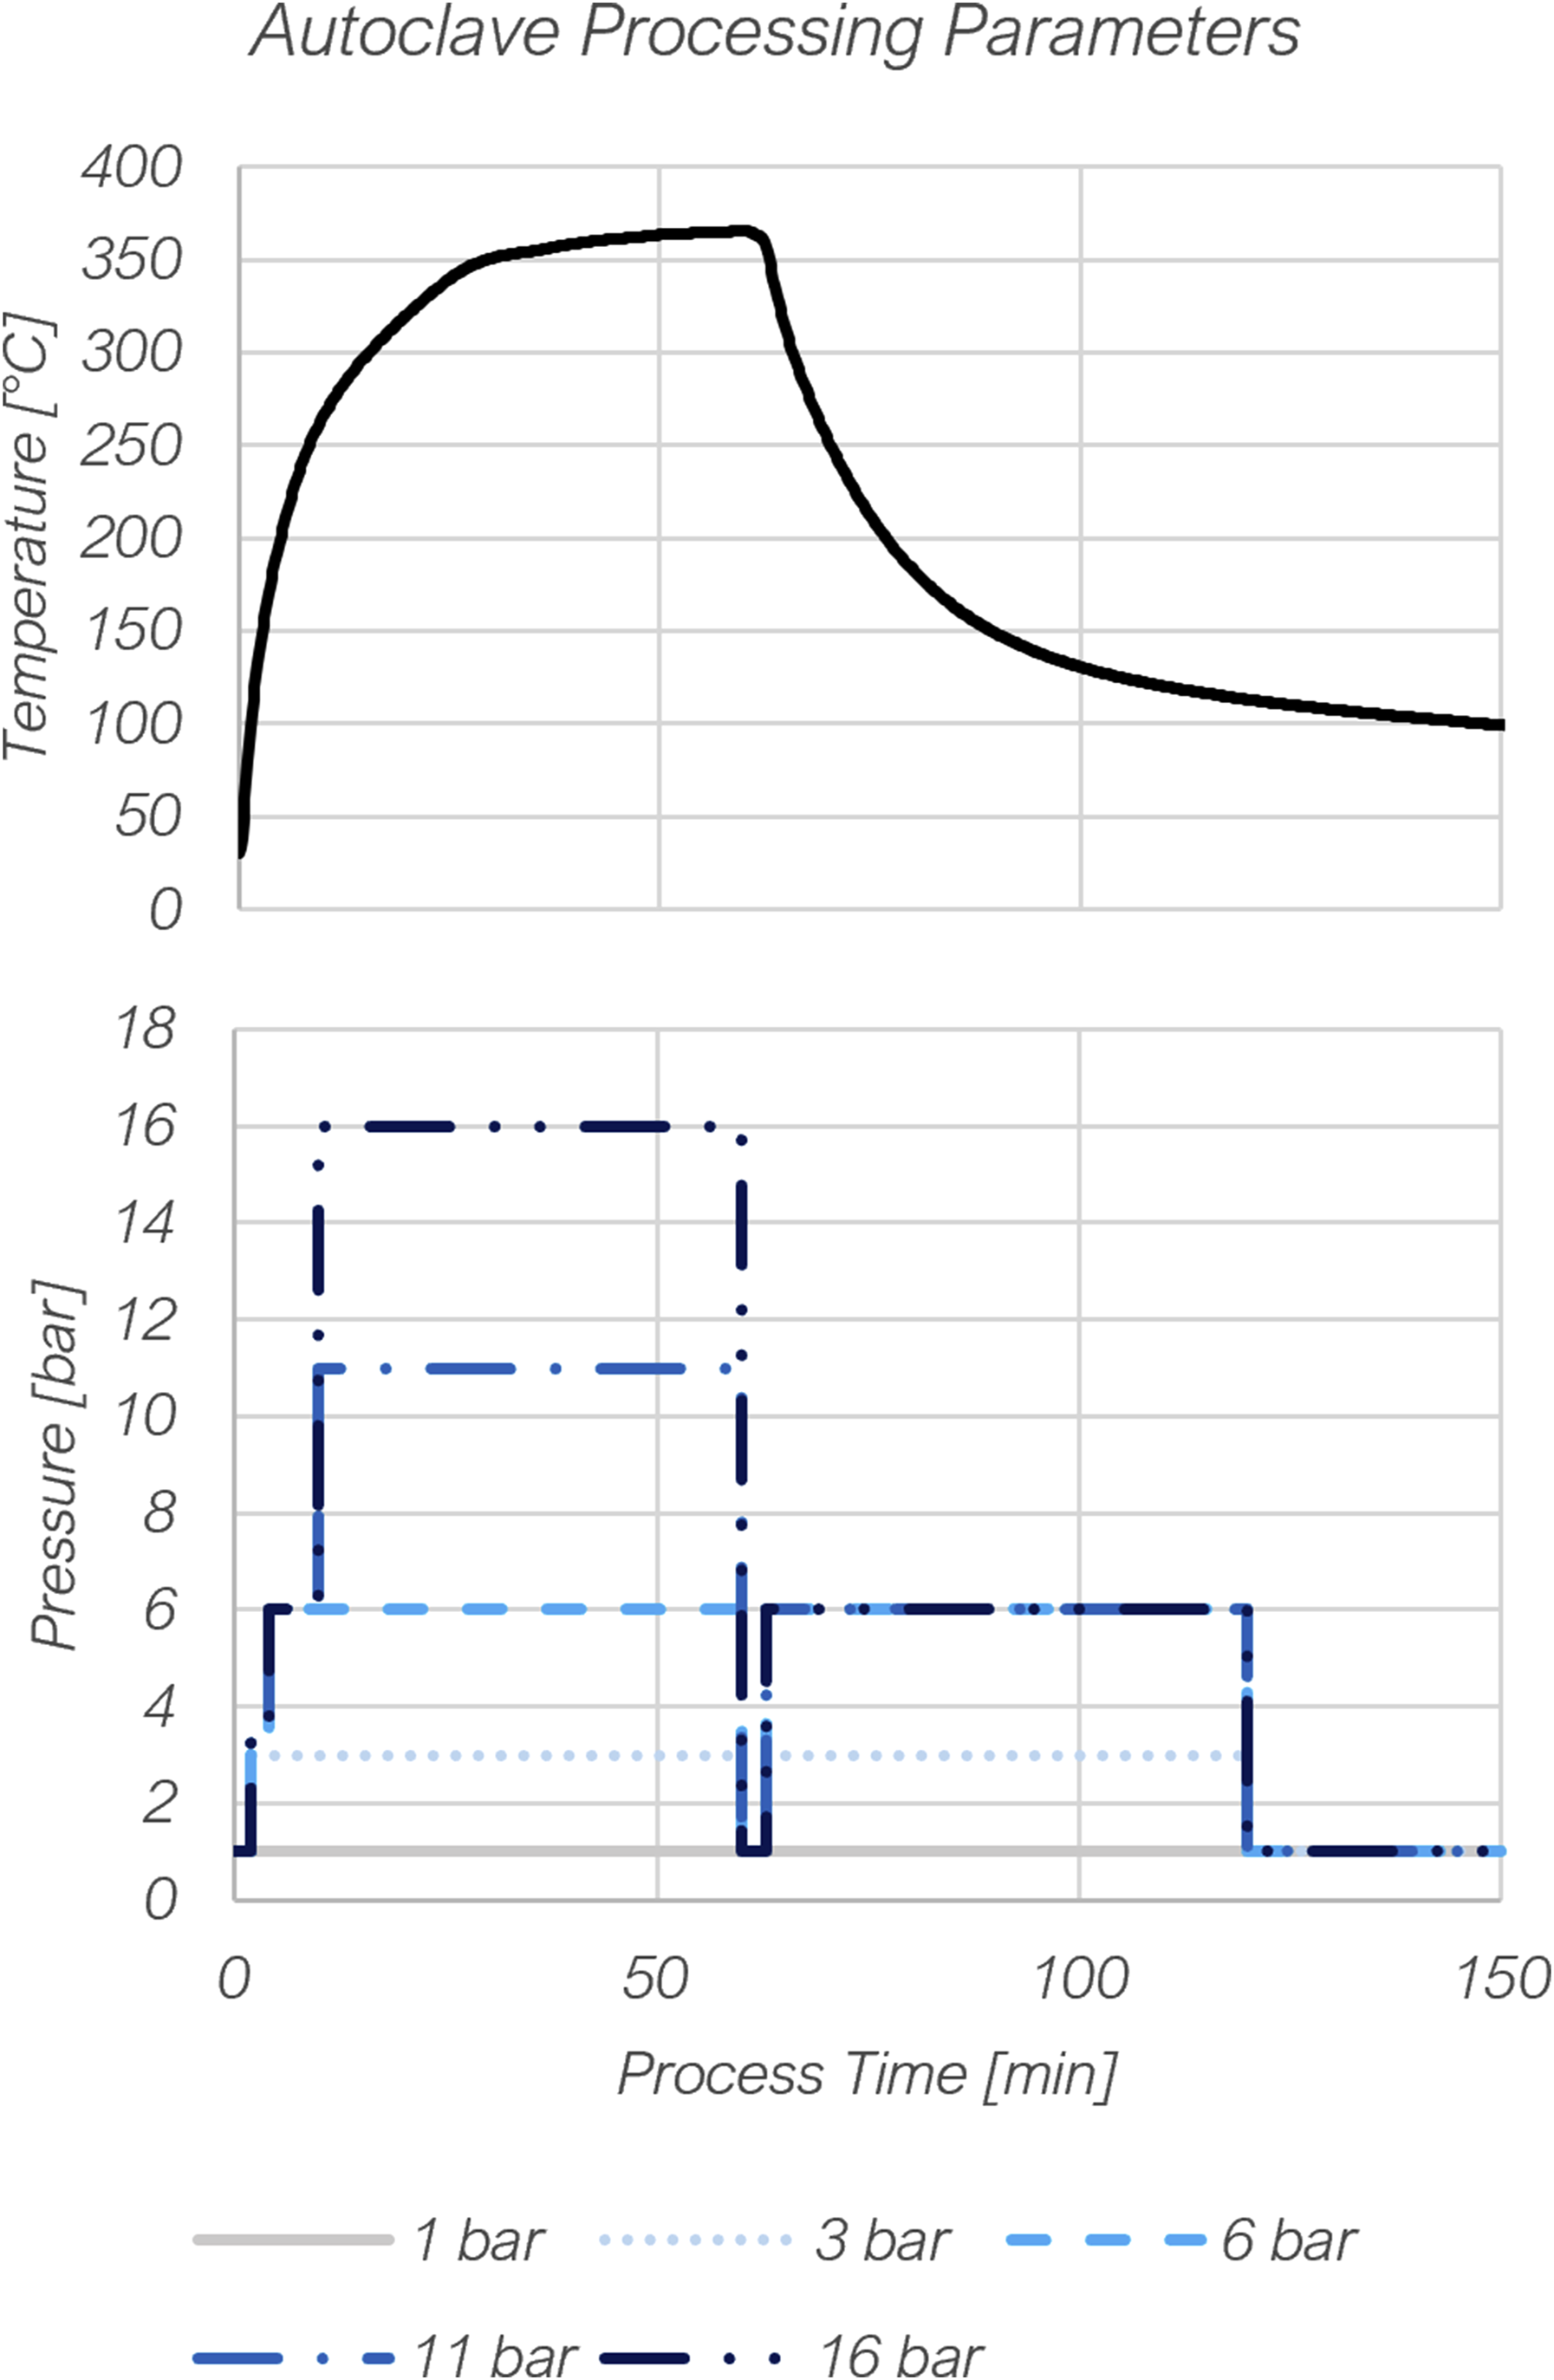
The process temperature of 360°C was selected based on manufacturer recommendations. The heating and cooling cycles were dominated by the thermal inertia of the tool, with the actual temperature cycle measured using a thermocouple placed inside the tool.
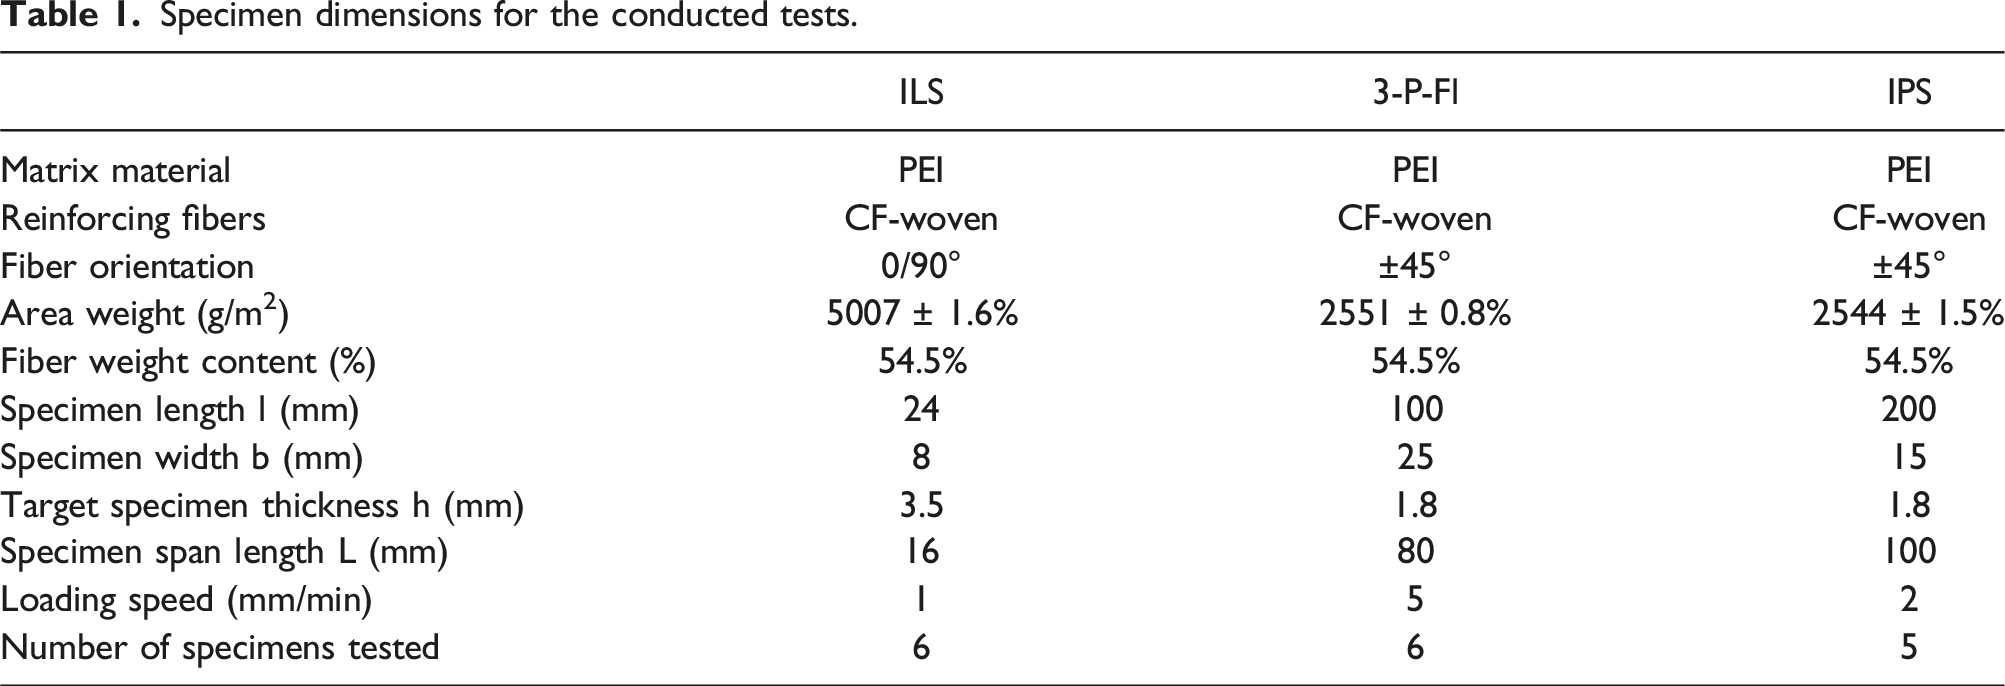
Specimen dimensions for the conducted tests.
Characterization methodology
This section describes the methodology to test specimens in their level of porosity, three-point flexure, interlaminar shear, and in-plane shear. The results were then used to compare the sensitivity of these characterization methods for FRPs with woven reinforcements.
Porosity
Porosity measurement is a common method to characterize the laminate quality. 8 For high-performance applications, the highest acceptable void content is generally below 2%. 4 A common method to determine void content is microscopy, which enables the characterization of void content, size, shape, and distribution. 8 For this work, the porosity was analyzed by means of an optical microscope Keyence VHX-7000. For each processing pressure, three 24 mm × 3.5 mm specimens were imaged using the automated image stitching feature. The recommended minimum image size of 0.1-1 cm2 was applied to reduce positional bias in micrograph analysis. 5 The spatial resolution of the micrographs was 2.07 microns per pixel. The micrographs were imported to imageJ and the respective void content was determined based on the area fraction: The image was assessed by setting a brightness threshold for the porosity and calculating the surface area of the voids.
Alternative non-destructive techniques, such as ultrasonic and micro-CT, are described in the literature as precise and relatively accurate. 8 Literature comparisons suggest that optical microscopy correlates well with X-ray CT for porosity levels below 6%, although variability increases at higher porosity levels. 27 Micrograph analysis was regarded as efficient and suitable as a complementary analysis to mechanical testing. Therefore, non-destructive methods were not further considered.
Three-point flexure
Three-point flexure tests were performed to determine the flexural modulus and flexural strength of the woven CF-PEI composites, using a ZwickRoell Z005 universal material testing machine. For this study, woven materials oriented at ± 45° were tested, and the average results for six samples per group were recorded. In this work, we selected a ±45° fiber orientation for the flexure tests to increase the sensitivity to matrix-dominated properties. While the 0/90° fiber orientation commonly used in flexure tests primarily reflects fiber-dominated behavior, the ±45° orientation reduces the contribution of the fibers to the overall stiffness and strength, which should enable a more pronounced influence of the matrix driven properties. The sample dimensions and test conditions followed the standard DIN 14125 28 and are detailed in Table 1.
The flexural strength σ
fm
was calculated using the following formula: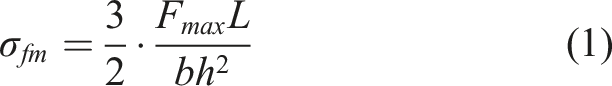
The flexural modulus E
f
was calculated in the linear elastic range of the force-deflection curve as follows: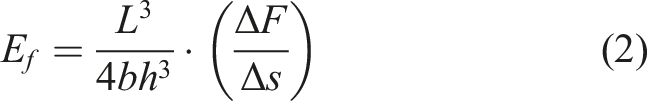
Interlaminar shear
The short beam test assesses the interlaminar shear strength. For this test, all layers of the CF-PEI fabric were oriented in 0/90° direction. The test methodology and evaluation followed the ASTM 2344, 29 with sample dimensions and testing parameters provided in Table 1. The interlaminar shear test was conducted on a ZwickRoell 1474 Retroline and the average results for six samples per group were recorded.
The interlaminar shear strength τ
sbs
was calculated as follows: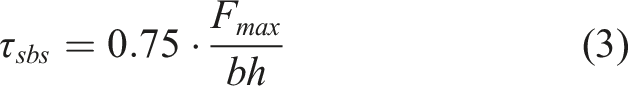
In-plane shear
The in-plane shear test assesses the in-plane shear strength and shear modulus. For the in-plane shear study samples the fabric material was oriented in ±45° direction.
The in-plane shear properties were evaluated following the DIN ISO 14129,
30
with sample dimensions and testing parameters provided in Table 1. The in-plane shear test was conducted on a ZwickRoell 1474 Retroline. The in-plane shear strength τ
12M
was calculated using the following formula: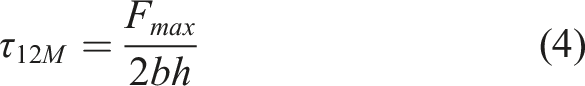

The in-plane shear modulus G12 was calculated as follows: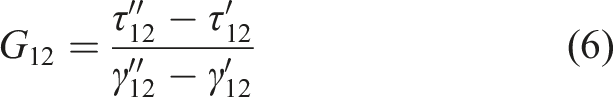
where
To measure strain accurately, Digital Image Correlation (DIC) was used instead of machine crosshead displacement to avoid errors from specimen slippage and clamping limitations. A FLIR Blackfly S BFS-U3-50S5M-C camera was mounted on a tripod and connected to a laptop running Spinnaker SDK for image acquisition. To improve image quality, an additional light source was used to ensure sufficient illumination. During the loading, images were captured at 1 Hz. A black speckle pattern on a white background was applied to the specimens for tracking deformations. The images were processed in ImageJ for cropping and orientation correction before analysis in DICe, an open-source software capable of computing displacements and strains from sequences of digital images. A region of interest was defined approximately 5 mm from the clamping edges and 5 mm from the vertical sample borders to minimize boundary effects. The strain components along the loading (x) and transverse (y) directions were extracted and averaged across the specimen using a Python algorithm for further analysis following DIN ISO 14129. 30
Results
This section describes the results of the tested specimens. The goal of this study is to compare the sensitivity of different characterization methods for FRPs with woven reinforcements. To vary the fiber impregnation quality, samples were manufactured in an autoclave process at different pressures. This section describes the results of the following investigations: porosity, three-point flexure, interlaminar shear, and in-plane shear. For the mechanical tests, a logarithmic trendline was fitted to the mean values using the least squares method. This trendline will later be used as an indicator of sensitivity.
Porosity
Figure 3 illustrates the relationship between the measured porosity and the absolute pressure differential in the autoclave process. The error bars represent the standard deviation of the data obtained from three specimens analyzed for each processing pressure. The plot generally shows a decreasing porosity for an increasing processing pressure, with the trend divided into two major sections. When reducing the processing pressure below 6 bar, the porosity increased rapidly. At 6 bar, the porosity reached a value of 0.54%. For pressures above 6 bar, the trend changed, with the void content decreasing at a lower gradient. The lowest measured porosity was 0.29% for a processing pressure of 16 bar. The highest porosity was obtained for the sample with vacuum only, with a void content of 2.18%.
The 1 bar (vacuum only) specimen exhibited the highest variability in void content, while those manufactured at higher pressures showed lower variability. This observation can be attributed to the location bias of the optical microscopy method. Yang and Elhajjar similarly reported that variability increases at higher porosity levels.
27
Relationship between porosity and processing pressure of PEI-CF.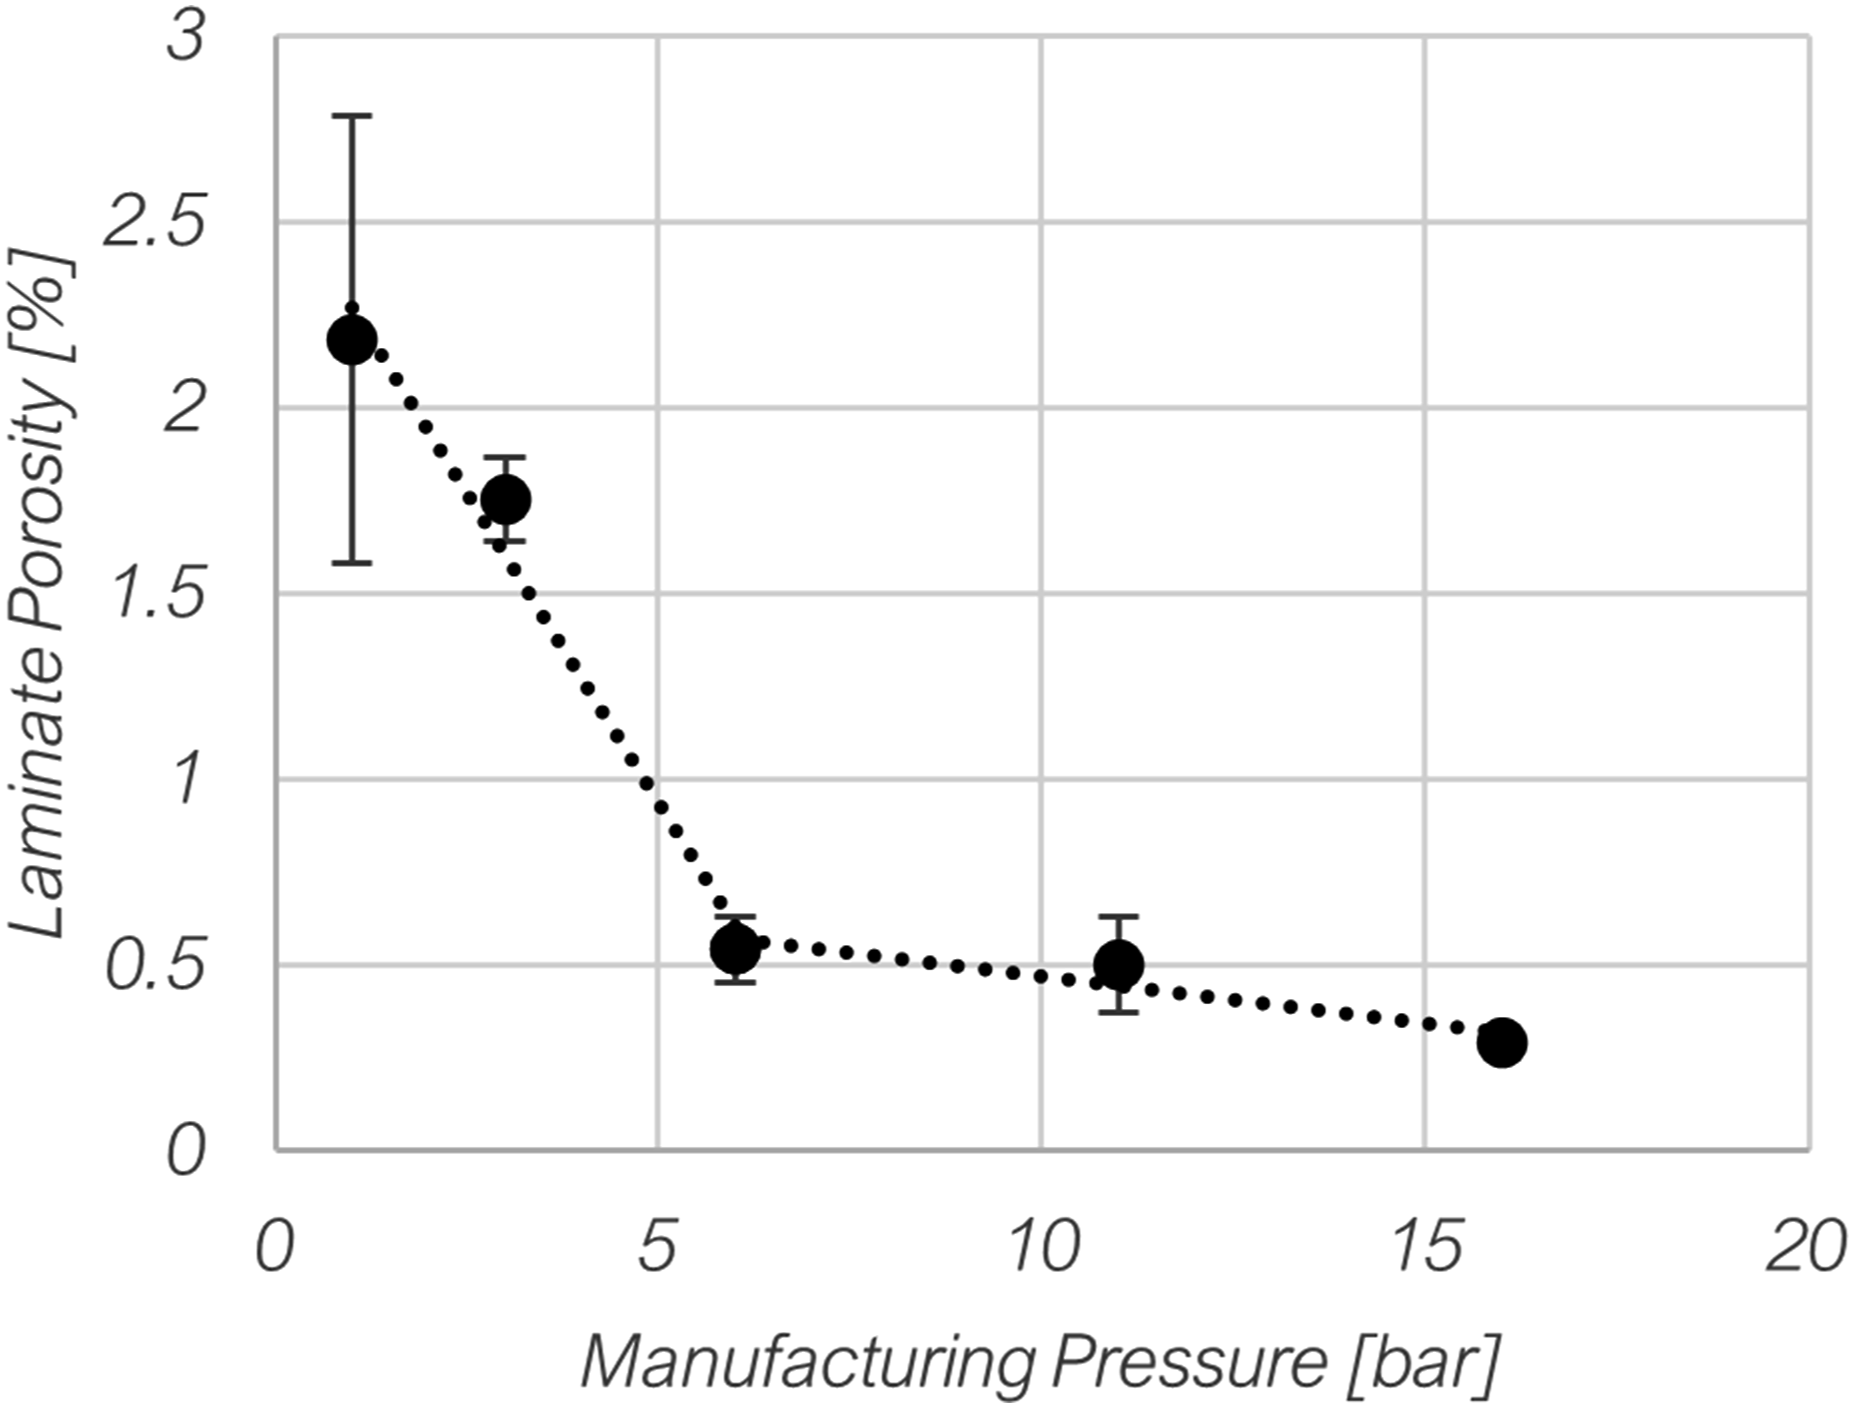
An analysis of the micrographs supports this observation, as shown in Figure 4. A detailed analysis of the microscopy images revealed that at 1 bar (vacuum only), a considerable number of fiber bundles remained unimpregnated, resulting in a significant amount of intra-yarn porosity. Additionally, there was also some inter-yarn porosity present. At 3 bar processing pressure, the number of unimpregnated fiber bundles is considerably reduced, and only smaller pores were observed between fiber bundles. At 6 bar, the majority of fiber bundles were fully impregnated, with minimal porosity remaining. Samples manufactured at 11 bar and 16 bar exhibited comparable results, with only a few fiber bundles remaining unimpregnated and negligible pore formation between the fiber bundles. These samples also exhibited minimal porosity between fiber bundles, resulting in a low overall porosity.
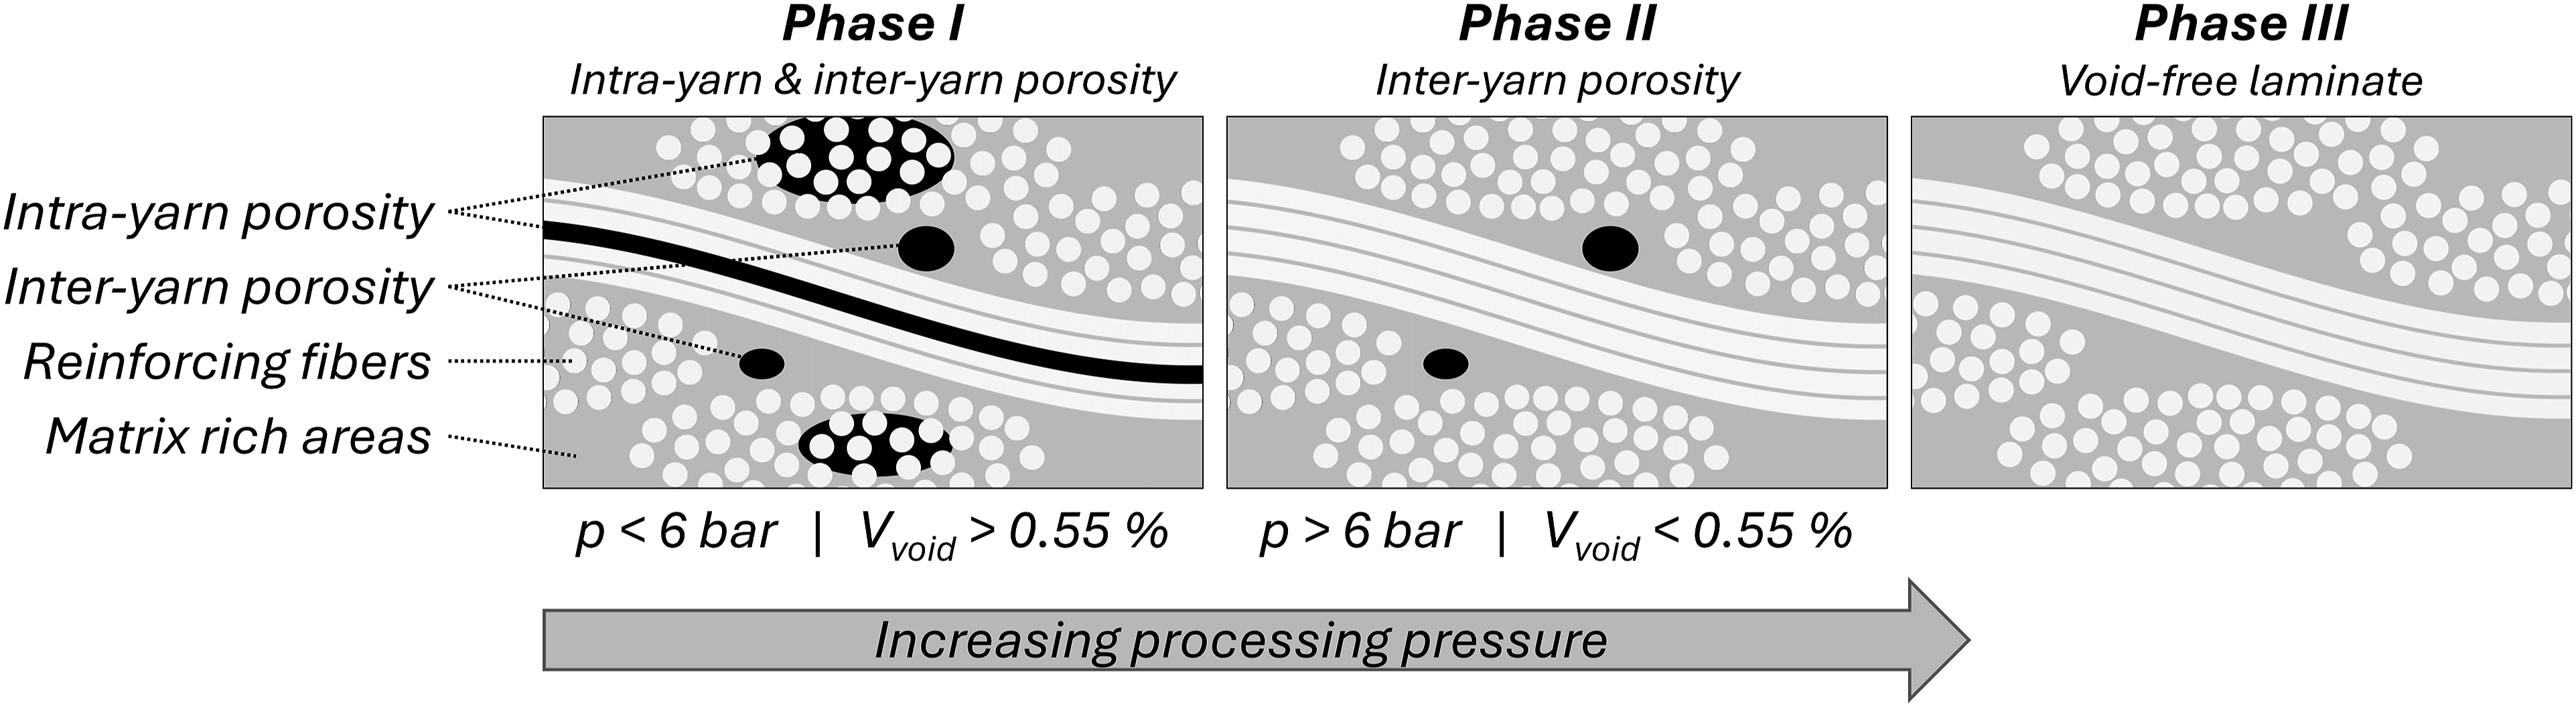
The micrographs provide insight into the impregnation process and may explain the bilinear trend observed in Figure 3 and other studies.4,20,31 The micrographs are schematically illustrated in Figure 5. Below the inflection point at 6 bar, porosity is primarily due to unimpregnated fiber bundles, leading to significant intra-yarn porosity. Above the inflection point, the fiber bundles become fully impregnated, and the remaining porosity is predominantly inter-yarn, decreasing gradually at a lower rate. Micrographs of PEI-CF for different processing pressures show high intra- and inter-yarn porosity for low pressure processing. Schematic of the void distribution of inter- and intra-yarn porosity, which may explain the bilinear trend in void content.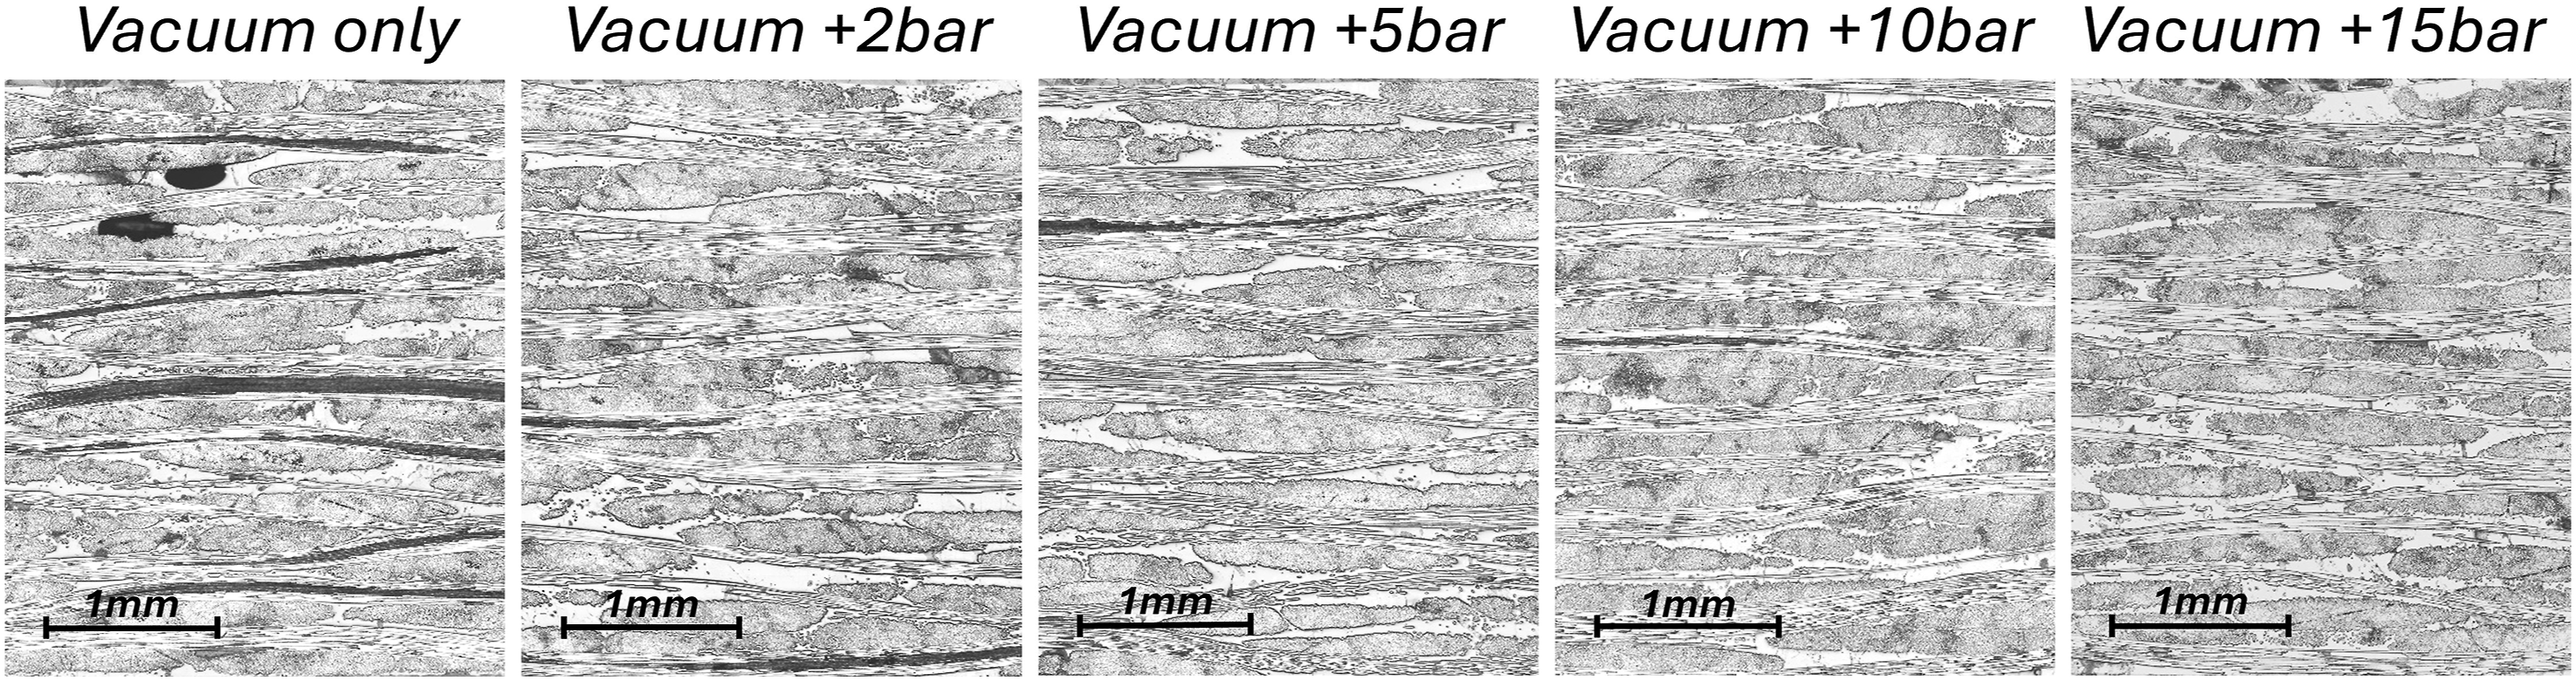
Three-point flexure
Figure 6 illustrates the relationship between the flexural strength and the absolute pressure differential in the autoclave process. The left vertical axis shows the absolute flexural strength obtained, while the vertical axis on the right shows the respective flexural strength in comparison to the maximum value of the series. Overall, the flexural strength was observed to increase with higher manufacturing pressures. The maximum flexural strength of 331 MPa was obtained for the samples manufactured at a processing pressure of 6 bar. At the same time, this pressure marked a turning point in the performance. Below 6 bar, the flexural strength decreased rapidly, reaching the lowest value of 258 MPa for the vacuum-only process. Above 6 bar processing pressure, the performance showed a decreasing trend: the sample at 16 bar showed a flexural strength of 316 MPa. Despite the higher pressure, the flexural strength decreased. A similar reduction in flexural performance has also been documented in the literature and may be attributed to fiber compaction, as the higher pressure makes the fibers more difficult to impregnate.
32
The standard deviation was found to be below 5% for each series, based on the six tested samples for each processing pressure. The flexural samples manufactured at 11 bar were excluded from the evaluation due to the presence of anomalous porosity and thickness in the laminate. Relationship between flexural strength and processing pressure of PEI-CF.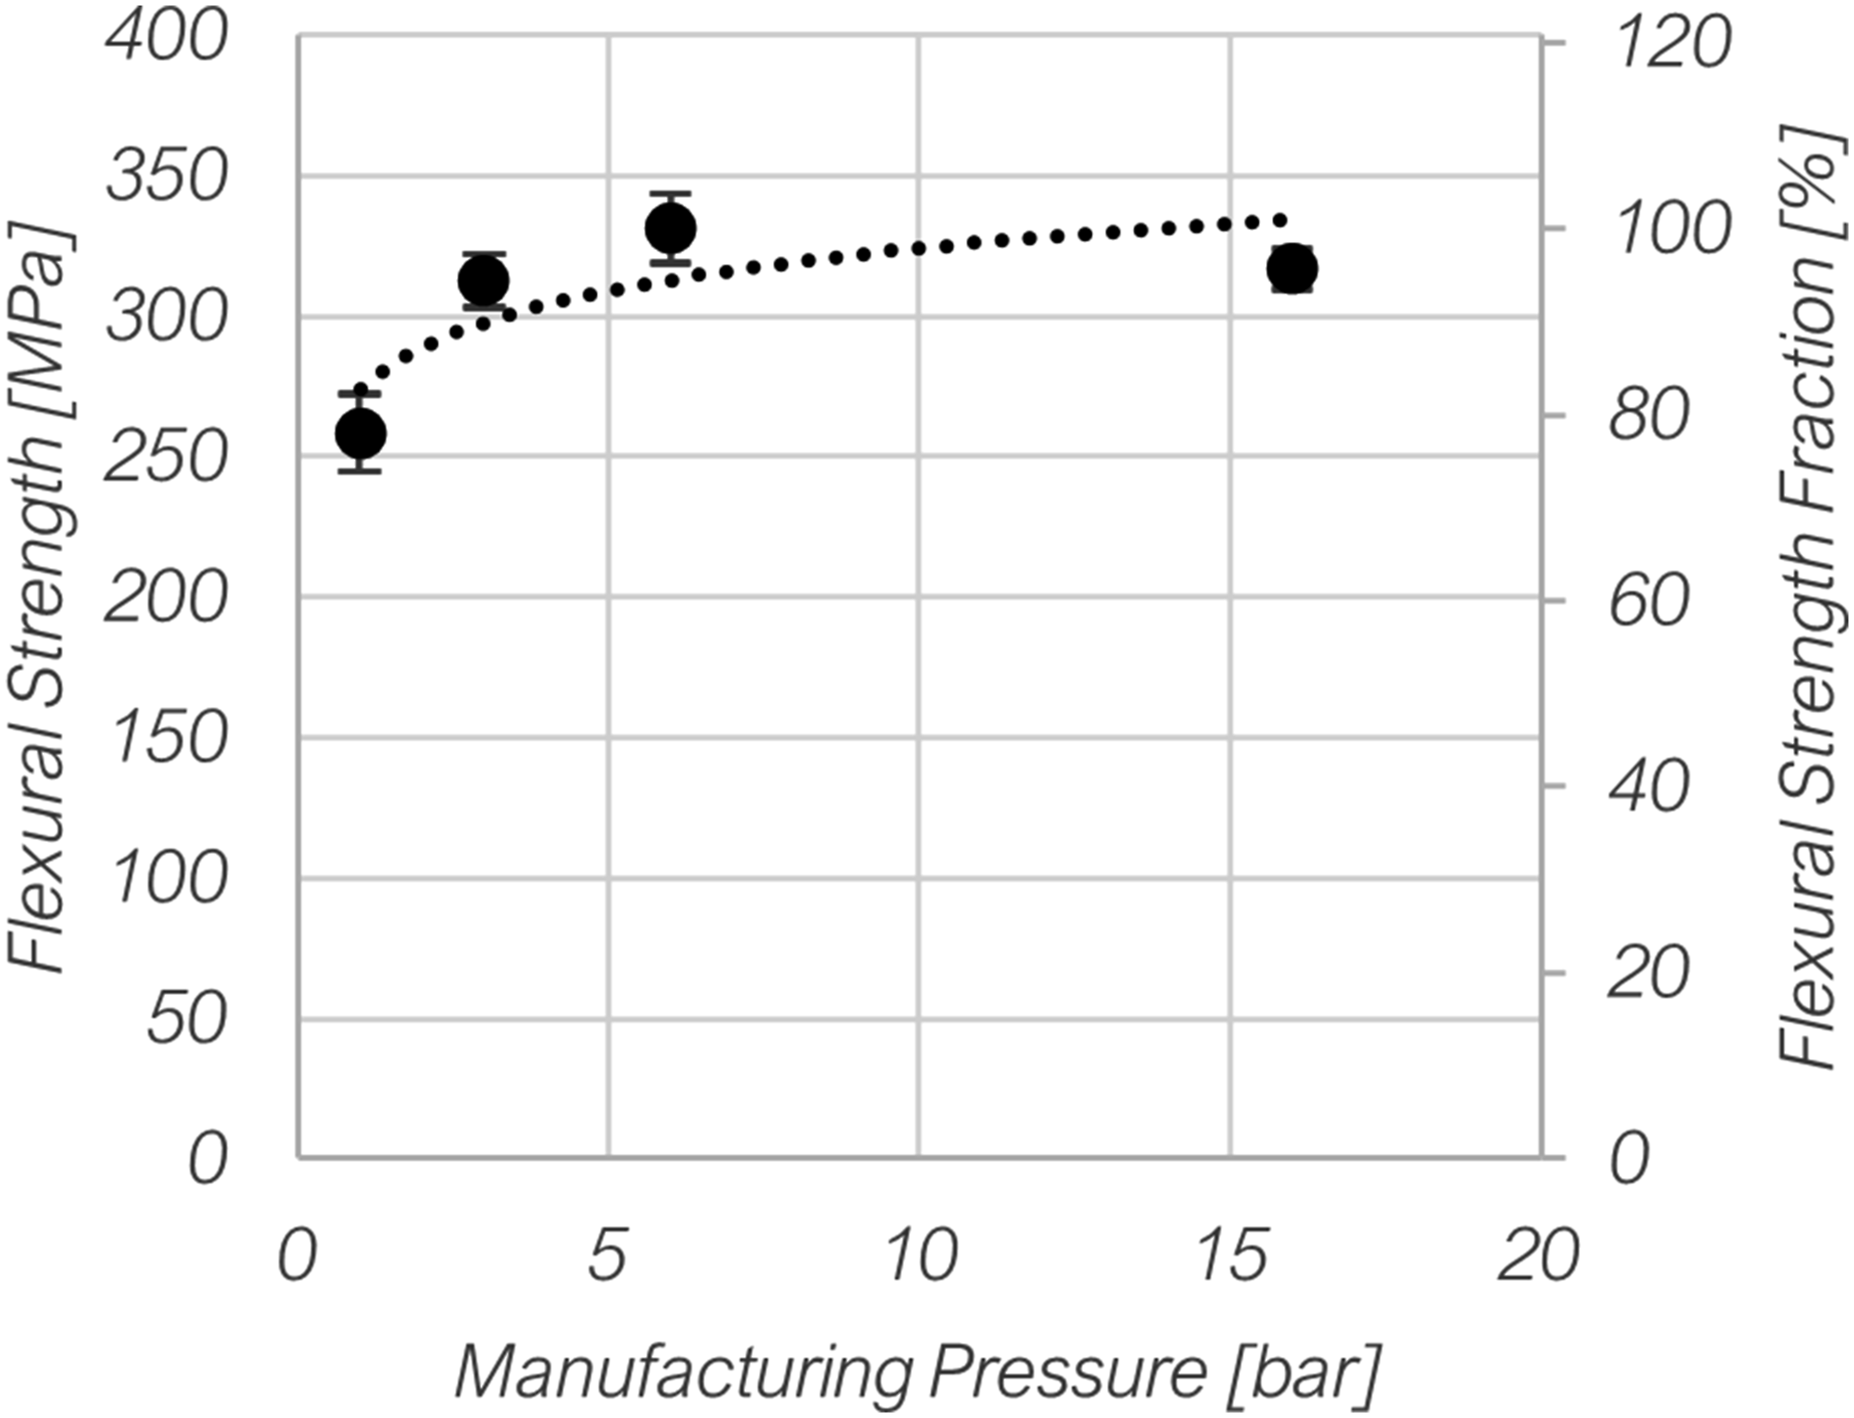
Figure 7 illustrates the relationship between flexural modulus and absolute pressure differential in the autoclave process. The vertical axis on the left refers to absolute flexural modulus, while the axis on the right indicates the respective value relative to the maximum value of the series. Overall, the flexural modulus showed a low dependence on the processing pressure. The flexural modulus showed a strong tendency to increase for increasing processing pressures up to 3 bar. For pressures above 3 bar, the flexural modulus exhibited a slight tendency to decrease. The standard deviation was found to be below 6% for each series, based on the six tested samples for each processing pressure. Relationship between flexural modulus and processing pressure of PEI-CF.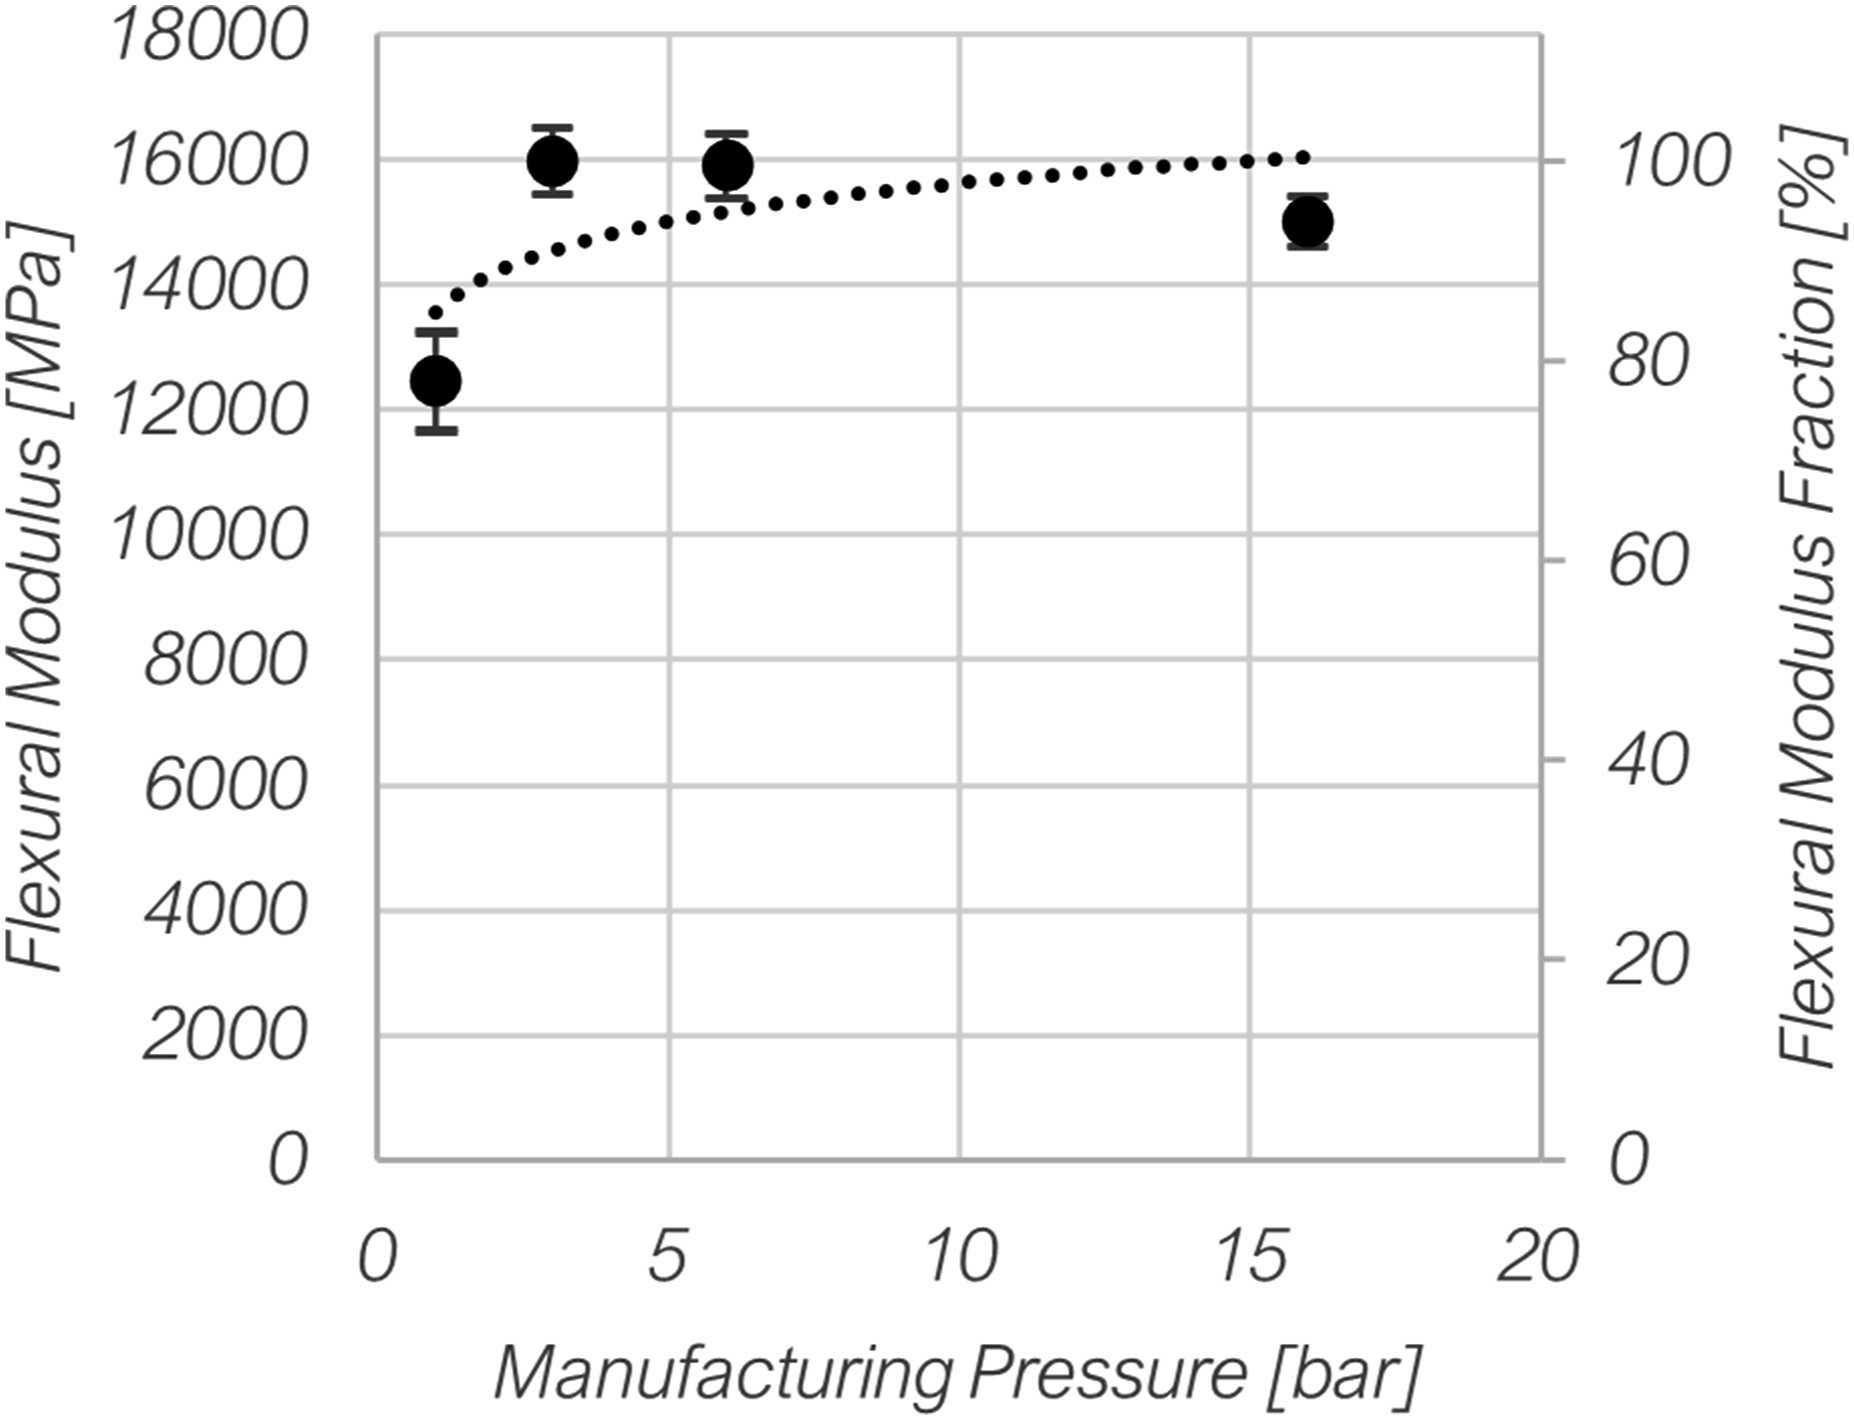
In addition, samples of the same material with fibers in the 0/90° direction were tested in a flexure test, which showed that laminates with fibers in the ±45° direction exhibited a 66% reduction in flexural modulus compared to 0/90° laminates (15982 MPa vs 47248 MPa). Similarly, flexural strength was reduced by 59% (331 MPa vs 816 MPa).
Interlaminar shear
Figure 8 illustrates the relationship between the interlaminar shear strength and the absolute pressure differential in the autoclave process. Overall, the results showed an increasing interlaminar shear strength for increasing processing pressure. The maximum interlaminar shear strength of 69 MPa was obtained at 16 bar, while at 6 bar, 96% of the maximum performance was achieved. Below 6 bar, the gradient of the increase was steeper than above 6 bar. The minimum interlaminar shear strength was achieved for the sample at 1 bar (vacuum only), with a value of 47 MPa, which is 68% of the maximum value. The standard deviation was found to be below 7% for each series, based on the five tested samples for each processing pressure. Relationship between Interlaminar Shear Strength and processing pressure of PEI-CF.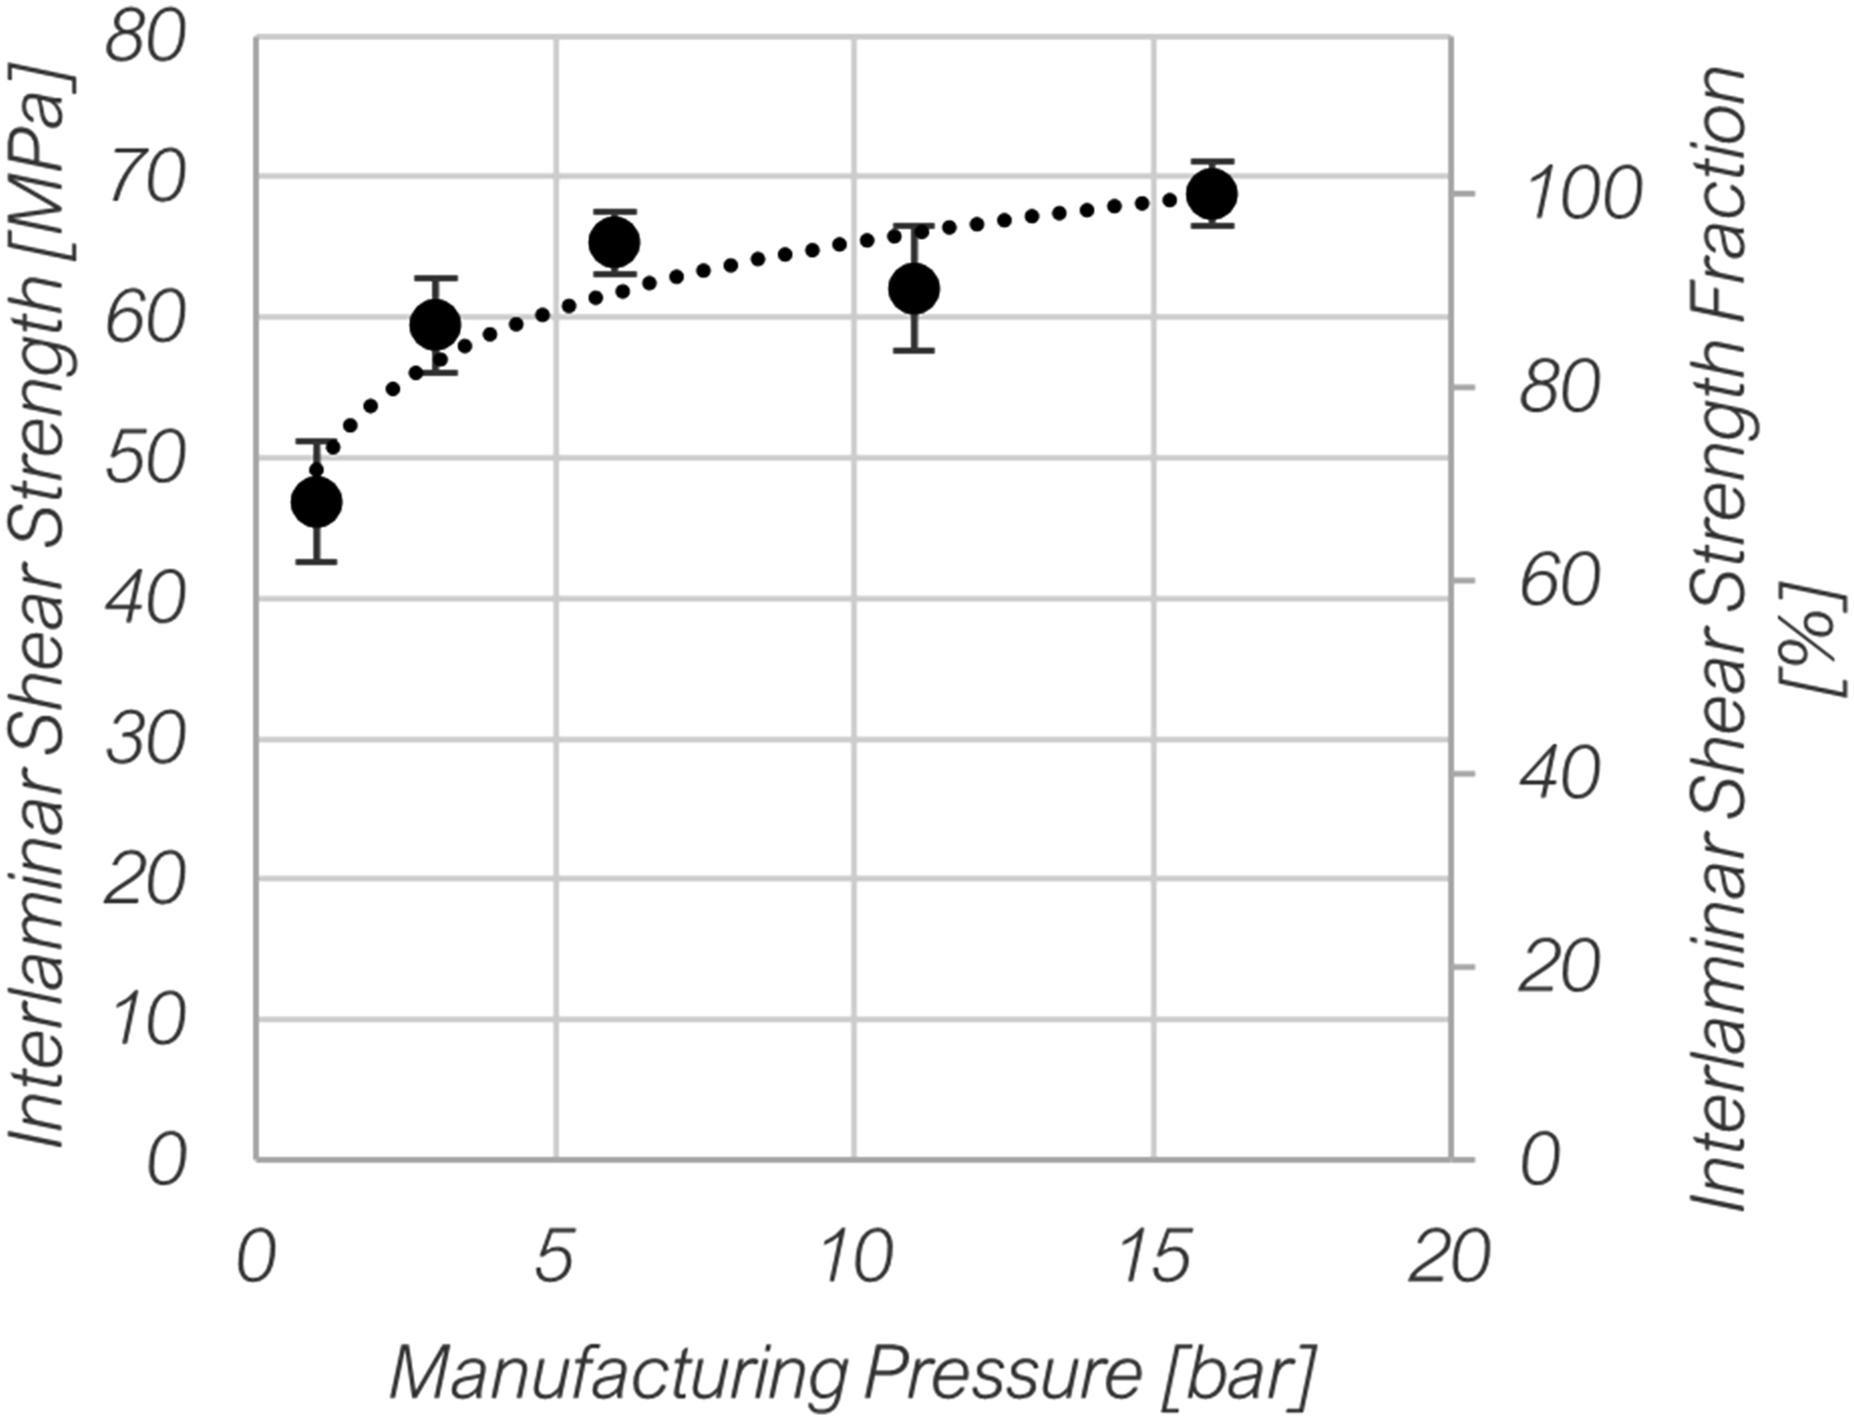
In-plane shear
Figure 9 illustrates the relationship between the in-plane shear strength and the absolute pressure differential in the manufacturing process. The results demonstrated an increasing in-plane shear strength for increasing processing pressure. The maximum in-plane shear strength of 129 MPa was achieved at 16 bar, while at 3 bar, 83% of the maximum performance was attained. A reduction in pressure to 1 bar (vacuum only) resulted in a performance decrease to 68% of the maximum value. The in-plane shear strength exhibited a linear trend between 3 and 16 bar manufacturing pressure. The standard deviation was found to be below 5% for each series, based on the five tested samples for each processing pressure. Relationship between in-plane shear strength and processing pressure of PEI-CF.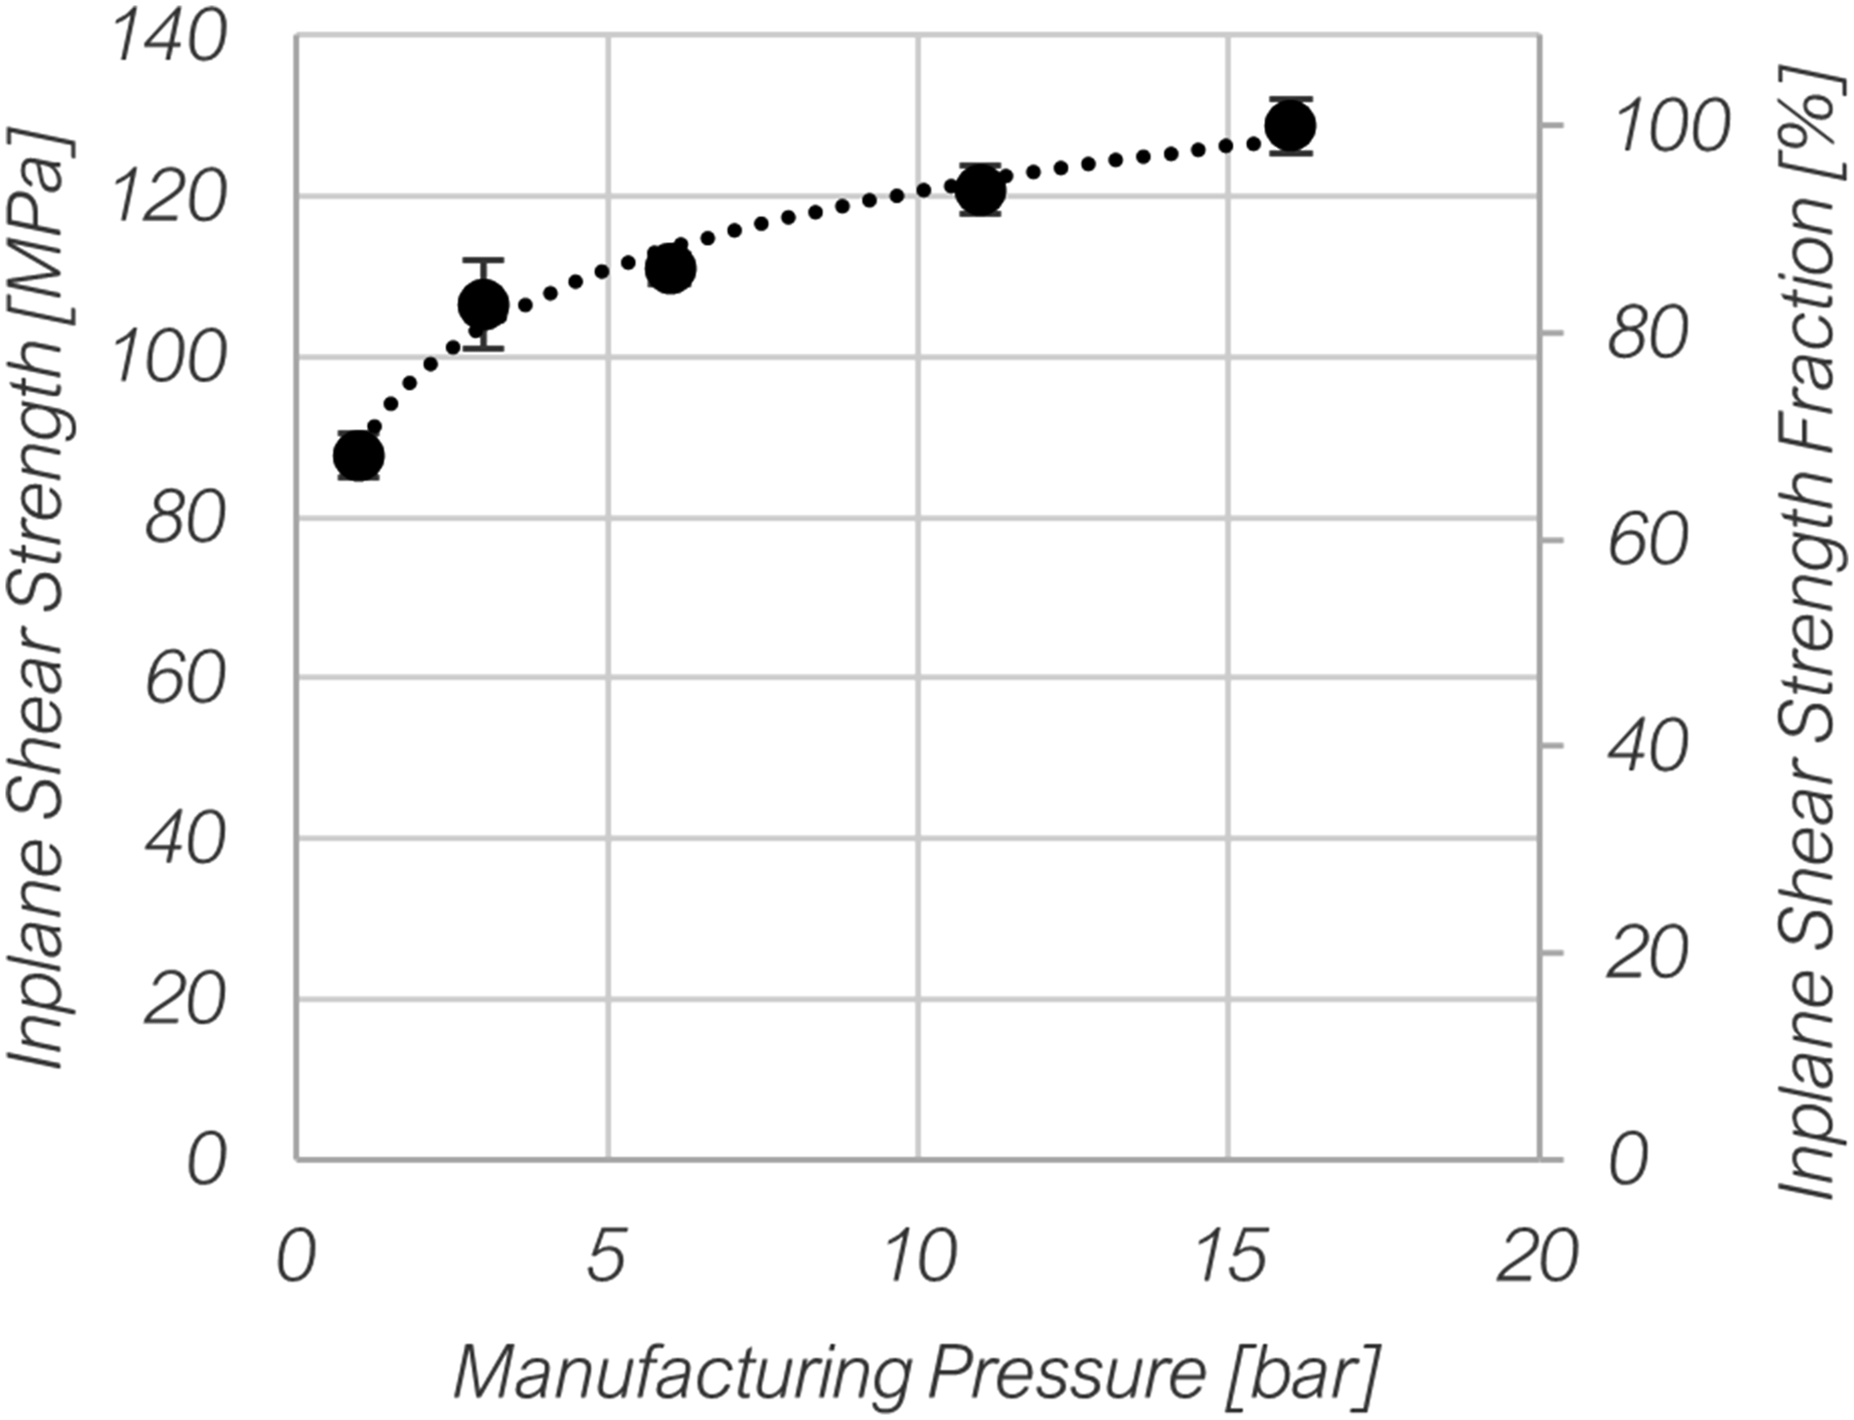
Figure 10 illustrates the relationship between the shear modulus and the absolute pressure differential in the manufacturing process. The results indicate an increasing shear modulus for pressures up to 3 bar. At 3 bar, the modulus is already matching the performance at 16 bar. The highest shear modulus was obtained for the samples with 6 bar processing pressure at 3582 MPa. The sample at 1 bar (vacuum only) exhibited the lowest shear modulus at 2843 MPa, representing 79% of the maximum value. On the other hand, the sample at 16 bar achieved a shear modulus of 3464 MPa, equaling 97% of the maximum value. Relationship between Shear Modulus and processing pressure of PEI-CF.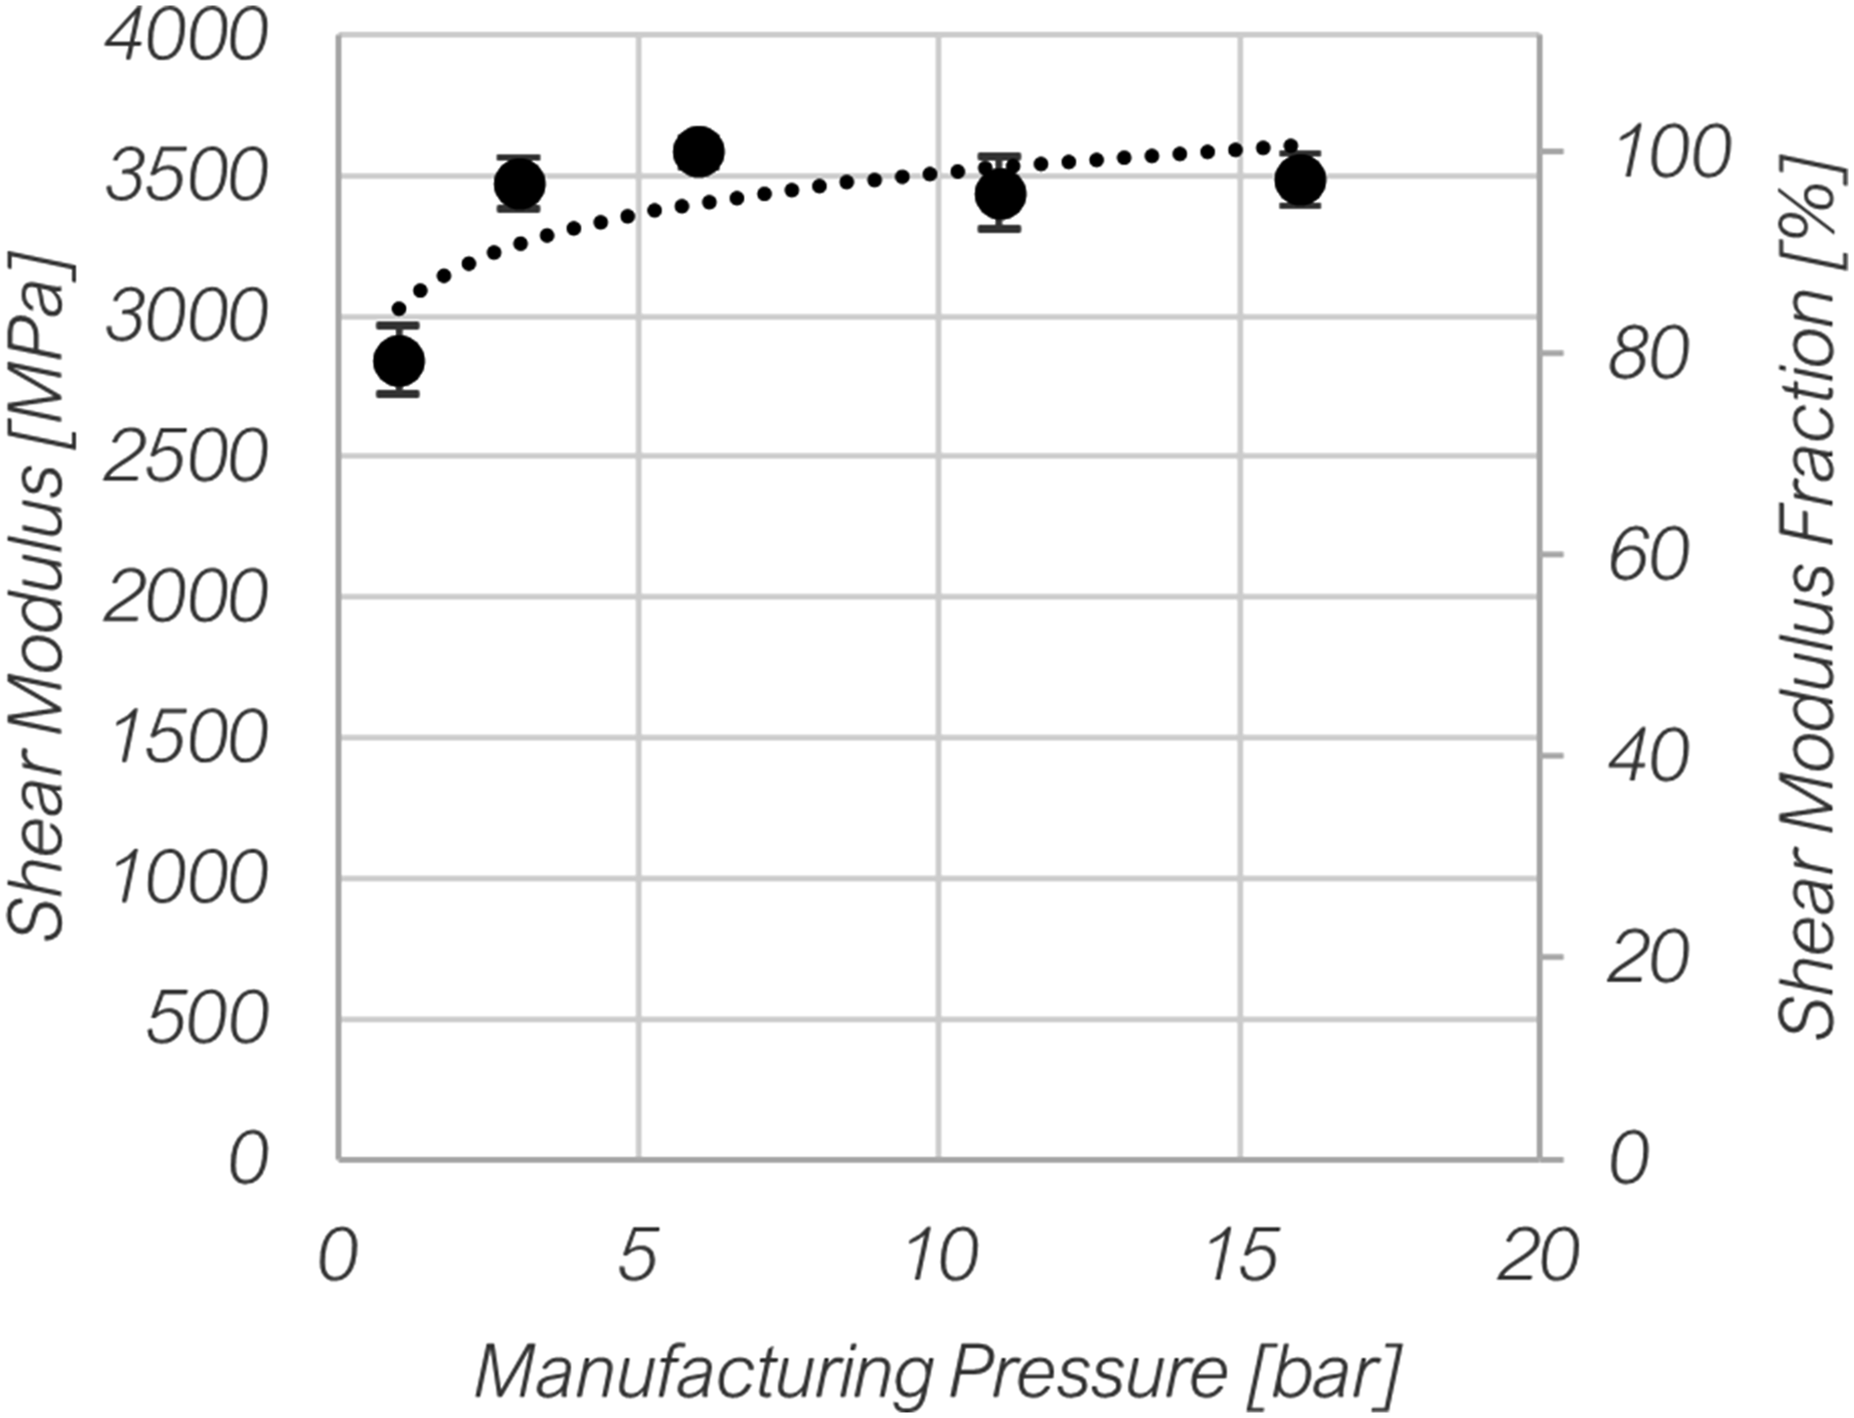
Discussion on sensitivity of mechanical tests
The conducted experiments enable a comparison of the sensitivity with respect to changes in the processing conditions for thermoplastic composites with woven carbon fiber reinforcements. A high sensitivity is important to efficiently identify good fiber impregnation in FRP materials.
In literature, the consolidation quality and fiber impregnation quality are widely analyzed with void content analysis. The results from this study indicate a bilinear trend in porosity within the tested pressure range. The porosity in the laminate rapidly decreases until a pressure of 6 bar. For pressures higher than 6 bar, the void content remains at a low level, indicating that consolidation is largely complete and fibers are well impregnated.
The bilinearity was not as evident in all mechanical testing results. Nevertheless, the results enable a comparison of the test sensitivities with respect to processing pressure. Two methods are used here to compare the tests:
First, the range of the obtained results is normalized with the maximum value for comparison
33
: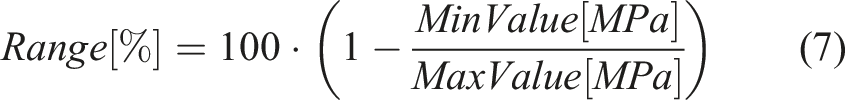
Figure 11 illustrates the range obtained for each test. The flexural strength had a range of 22%. The flexural modulus had a range of 23%. The interlaminar shear strength had a range of 32%. The in-plane shear strength had a range of 32%. The in-plane shear modulus had a range of 21%. The interlaminar and in-plane shear strength showed the largest range of performance for the considered processing pressures. The relative range of results in this study allows a comparison of the test sensitivities. The interlaminar and in-plane shear strength showed the largest range of performance for the considered processing pressures.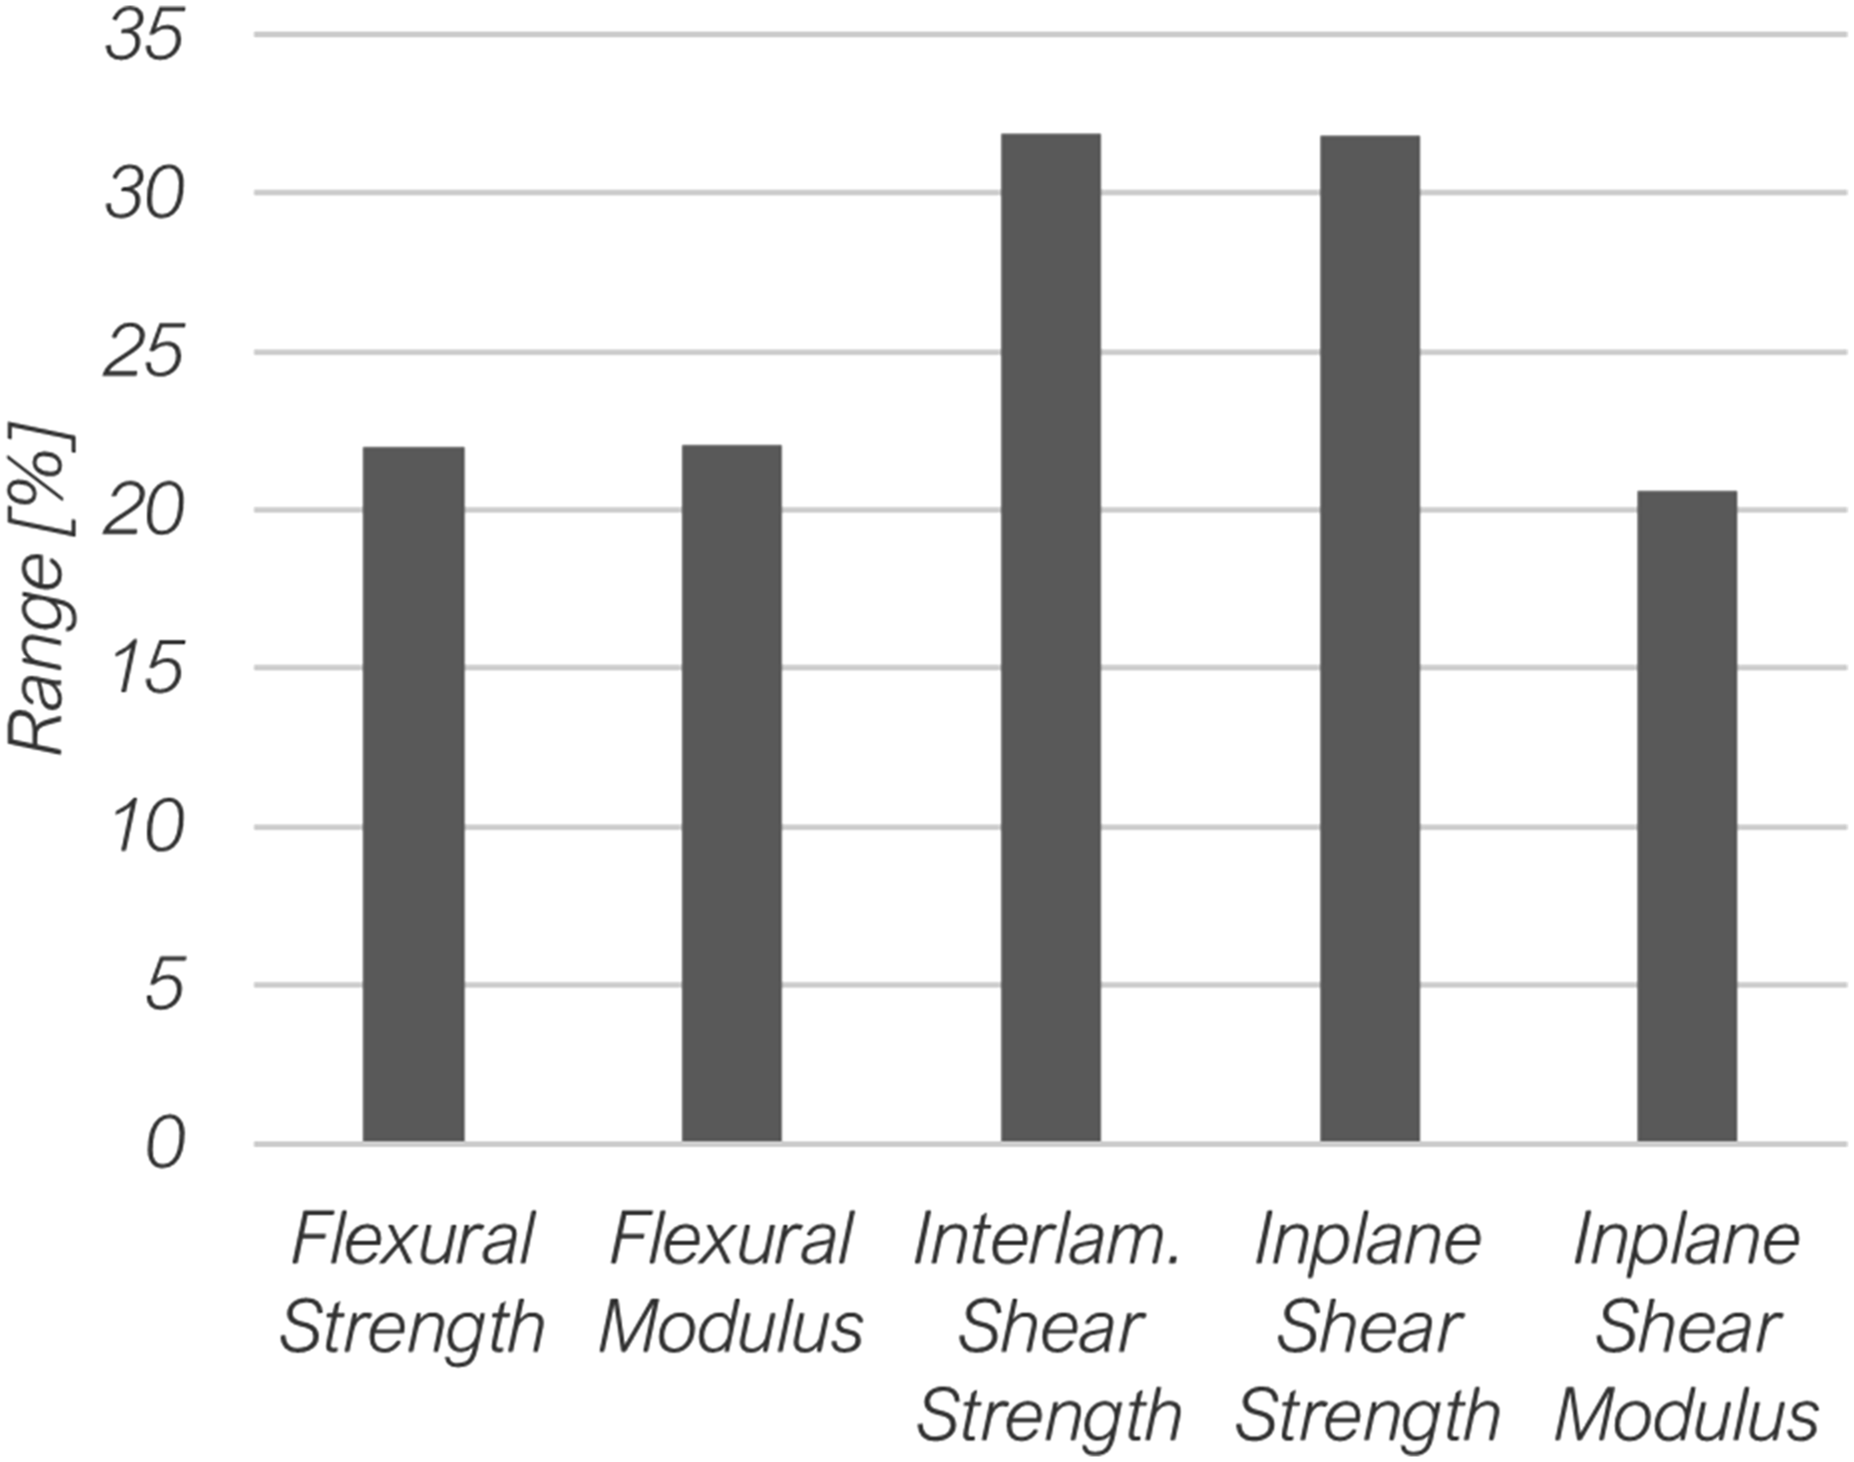
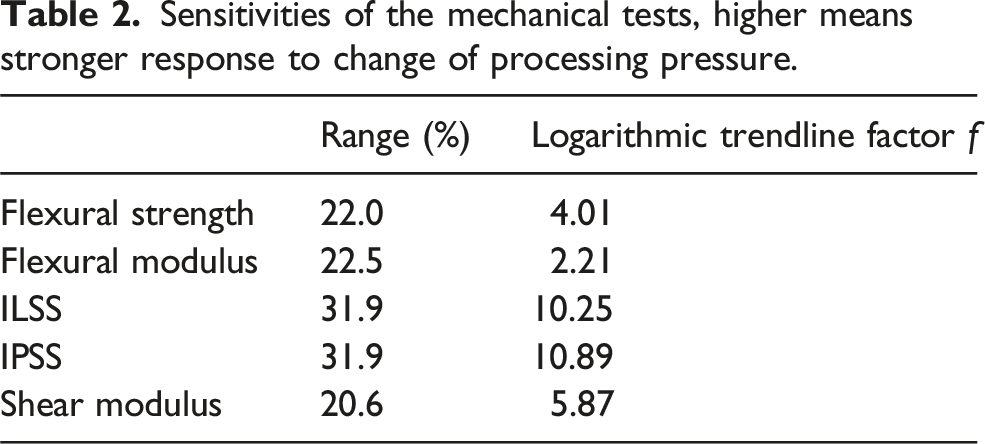
For a closer comparison, the in-plane shear strength and the interlaminar shear strength were further compared based on their logarithmic trendline. This was done by fitting the experimental results with a logarithmic trendline of the form y = f ⋅ ln(x) + C, where the factor f is an indication of sensitivity. The parameters were determined using the least squares method, with the fits applied to the mean values of the data points. A logarithmic trendline was chosen as it provided the highest R-squared values among commonly used trendlines. For the in-plane shear strength, the obtained trendline was of the form y = 10.89 ⋅ ln(x) + 68.6 and for the interlaminar shear strength y = 10.25 ⋅ ln(x) + 71.4 as visualized in Figure 12. Again, the trendlines for both tests are very similar. For a comprehensive analysis, the trendline factor f was also evaluated for the other tests and the results are detailed in Table 2. The trendline analysis of results in this study allows a comparison of the test sensitivities. The plot shows the logarithmic trendline of the interlaminar shear strength and in-plane shear strength, which showed the largest range of performance for the considered processing pressures. Sensitivities of the mechanical tests, higher means stronger response to change of processing pressure.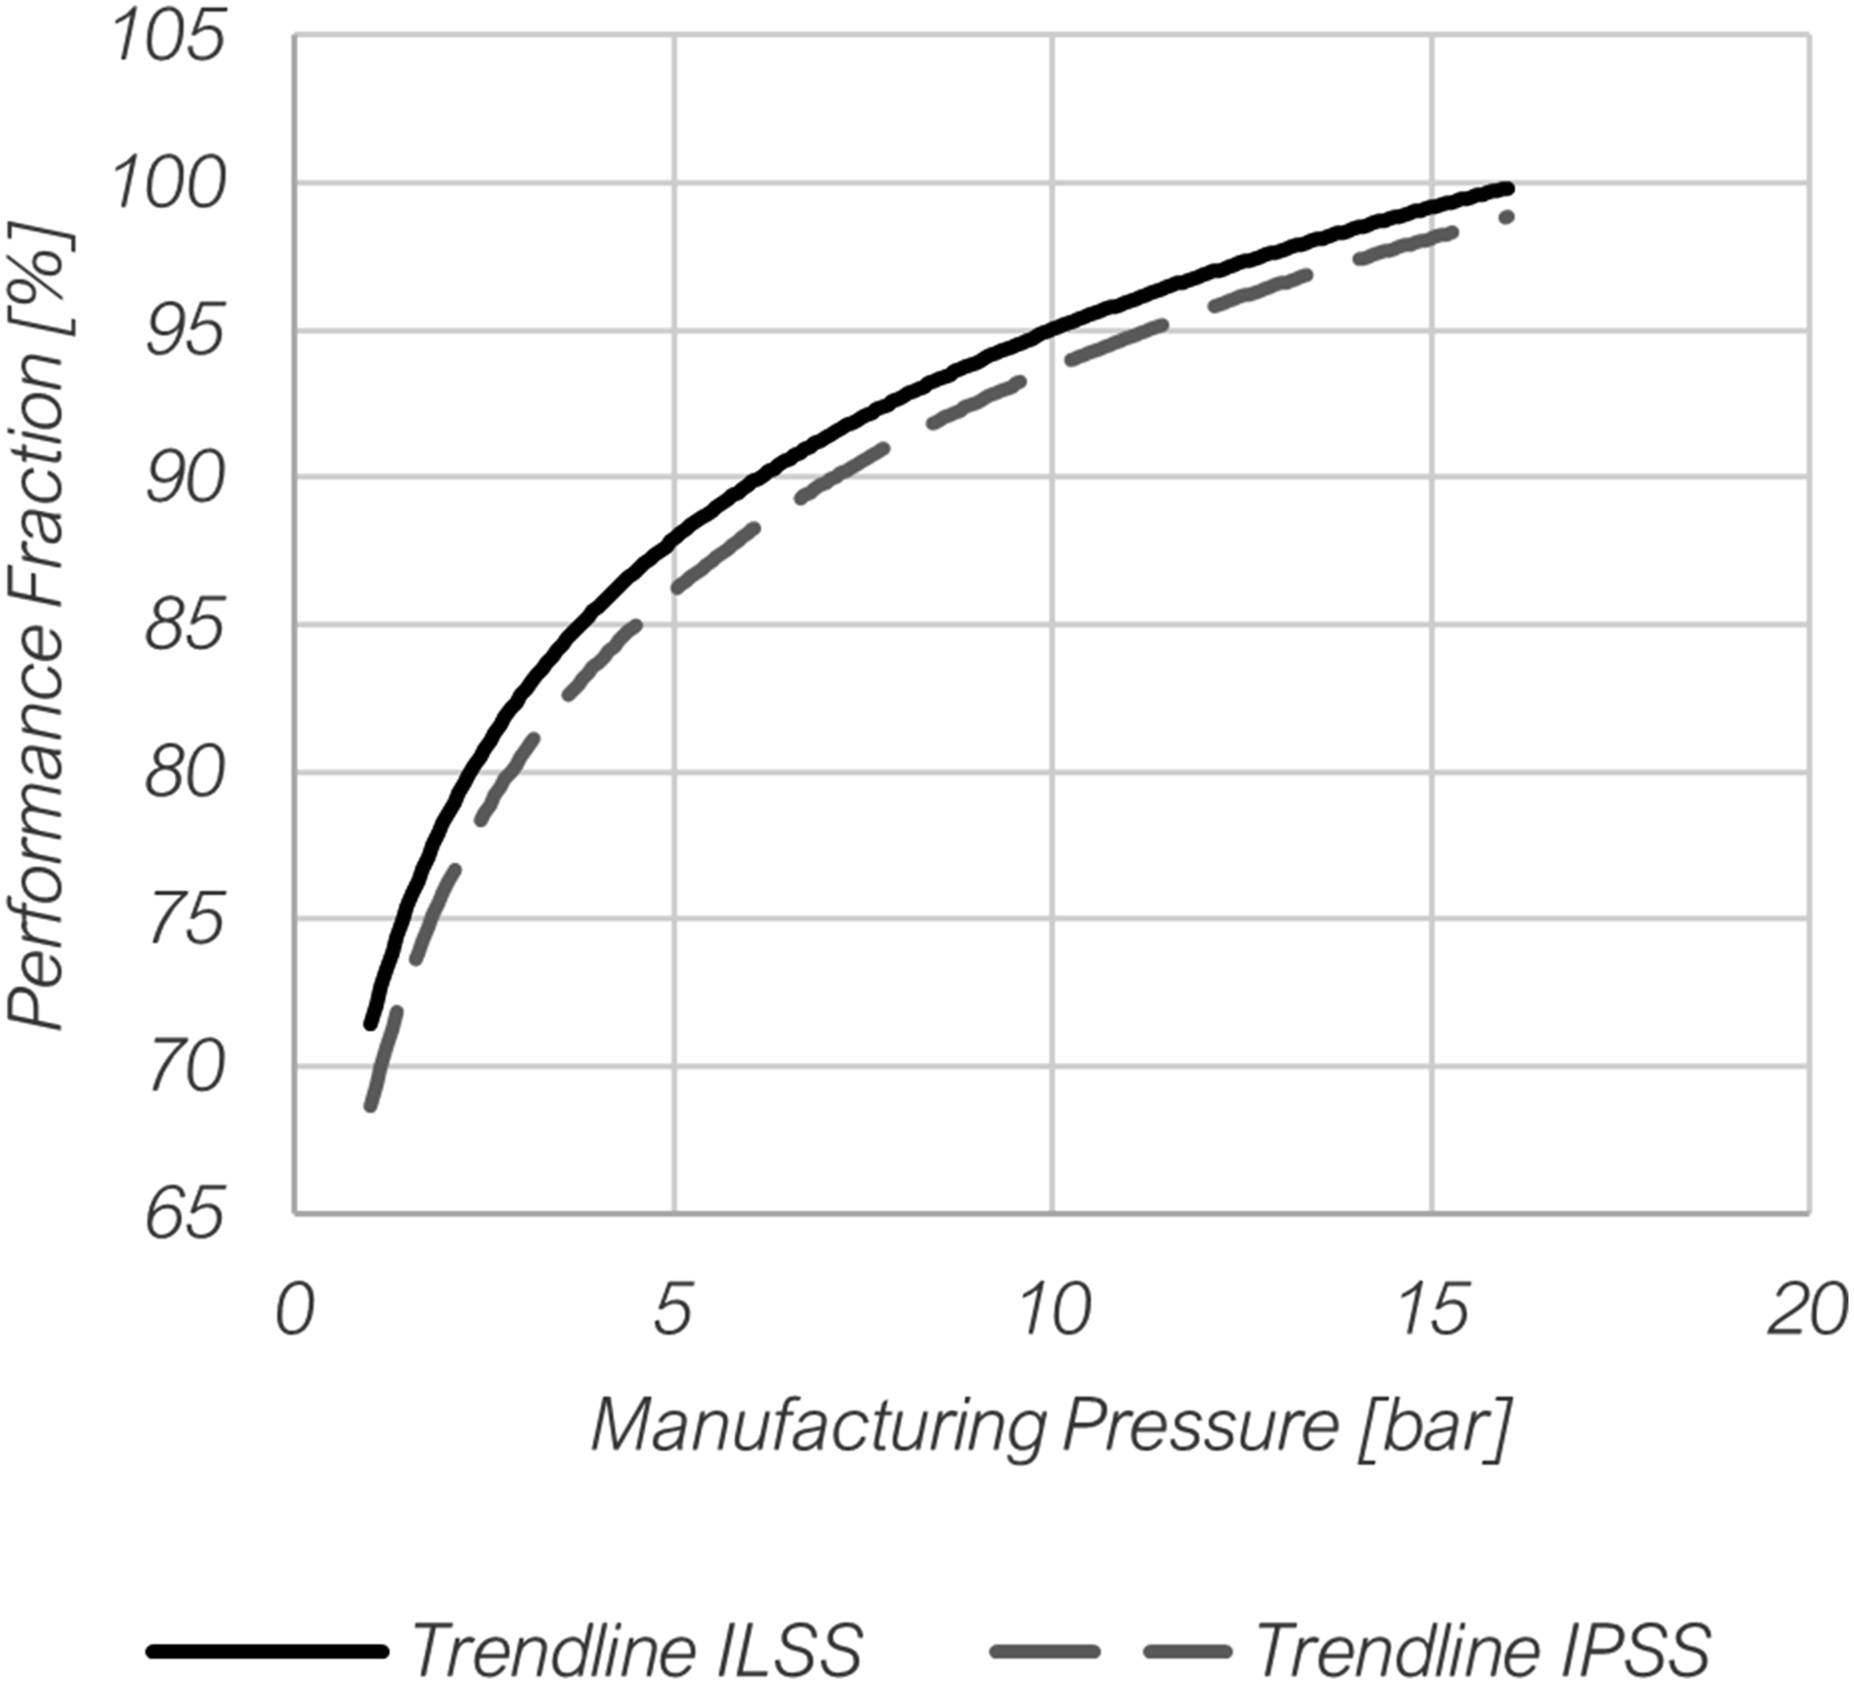
In the evaluations of this work, interlaminar shear strength and in-plane shear strength showed the highest sensitivities. This means that these two tests show the strongest response to changes in processing pressure. The sensitivity trends observed for in-plane and interlaminar shear tests align with existing literature. The ±45° flexural test has not been compared for sensitivity to porosity until now. Our results show that its sensitivity matches the highest reported values for 0/90° laminates. While flexural stiffness and strength exhibited similar ranges, trendline analysis confirms that flexural strength is more sensitive to voids, consistent with previous findings.
Further, the scalability of the mechanical tests can be assessed based on the effort and complexity required for testing and evaluation. Among the three methods, the in-plane shear test was the most complex, requiring careful clamping to prevent specimen slippage. Additionally, DIC analysis was time-intensive due to image processing, though the final evaluation of in-plane shear strength was faster, relying only on the maximum load from the testing machine. In contrast, the interlaminar shear and flexural tests were less complex in both testing and evaluation. Their simpler procedures and lower processing effort make them more suitable for large sample sizes.
While the absolute mechanical performance values depend on the specific material preform and processing conditions, the relative sensitivity of different mechanical tests to processing variations is likely to be generalizable to other thermoplastic FRPs. Similarly, although production techniques may influence quantitative results, the observed trends in test sensitivity remain relevant. These findings provide a foundation for evaluating other thermoplastic preforms and processing techniques.
Conclusion
The experiments conducted in this study compared the sensitivity of selected mechanical tests to changes in manufacturing pressure for thermoplastic FRPs with woven carbon fiber reinforcements. The results demonstrated that interlaminar shear strength and in-plane shear strength exhibited the highest sensitivity to these changes, making them favorable for efficiently identifying fiber impregnation for FRPs with woven fabric reinforcement. Due to its simplicity and speed, the interlaminar shear emerged as the most practical and sensitive test among the methods evaluated. The flexural modulus, flexural strength, and shear modulus showed lower sensitivities.
These findings highlight the effectiveness of the interlaminar shear strength in studying and optimizing process parameters for FRPs with woven fabric reinforcement. By comparing and recommending efficient methods to assess matrix-dominated properties, this work contributes to improving laminate quality and enhancing composite manufacturing processes.
While this study focuses on the influence of pressure, temperature and time also play crucial roles in fiber impregnation. Future research should investigate whether the identified sensitivities also apply to variations in processing time and temperature. Additionally, this evaluation should be extended to other intermediate materials, such as other thermoplastic fiber-reinforced polymer materials or traditional carbon fiber reinforced epoxy, to further refine the processing parameters and enhance material performance.
Footnotes
Acknowledgments
The project team thanks Mitsubishi Chemical Advanced Materials AG for supporting this research and the Swiss Innovation Agency Innosuisse for funding the innovation project 55029.1 IP-ENG ”thermoplastic laminates with controlled porosity for FRP lightweight structures”.
Declaration of conflicting interests
The author(s) declared no potential conflicts of interest with respect to the research, authorship, and/or publication of this article.
Funding
The author(s) disclosed receipt of the following financial support for the research, authorship, and/or publication of this article: Innosuisse - Schweizerische Agentur für Innovationsförderung; 55029.1 IP-ENG.
Data Availability Statement
The data that support the findings of this study are available from the corresponding author.