
Abstract
Pultruded glass fiber reinforced polymer (GFRP) composites are used extensively in civil, marine, and offshore infrastructure applications. These components can be exposed to long periods of humidity or immersion with long-term performance characteristics being influenced by the rate and level of moisture uptake and its consequent effects. This paper reports on the moisture uptake response and kinetics of a pultruded GFRP composite exposed to a range of relative humidity levels and immersion over a range of temperatures below the glass transition. Four models for diffusion are used to assess the range of uptake responses. It is seen that humidity and temperatures have a significant effect on both rate of uptake and maximum apparent uptake level with there being a significant difference between effects of 99% RH and immersion emphasizing that immersion, as is often used in durability testing, cannot be directly used as a substitute for accelerating effects of humidity even at high levels. The two-stage structural modification model which considers both an initial diffusion dominated regime and a second relaxation/deterioration dominated regime is seen to best model the range of uptake regimes and characteristics while the simple Fickian model is shown to be deficient in modeling most of the regimes accurately.
Introduction
Due to their lightweight, characteristics of high specific strength and specific stiffness, tailorability, ease of use in the field, and potentially longer service lives with significantly reduced maintenance, fiber reinforced polymer (FRP) composites provide significant advantages over conventional materials in civil, offshore, and marine, infrastructure applications. Cost considerations necessitate that the highly standardized and well characterized autoclave cure process used in the aerospace industry is not used in these applications. However, processes such as pultrusion, which enable the rapid production of long lengths of constant cross-section/profile with a high degree of uniformity in shape and performance characteristics at relatively low cost, provide attractive alternatives. Extensive reviews of the pultrusion process and composite applications addressed thereof can be found in Refs. 1–3 and are hence not repeated herein. Despite their extensive use, there is still a lack of a comprehensive understanding of aging and degradation mechanisms of glass fiber reinforced polymer (GFRP) composites fabricated through pultrusion as related to the environmental conditions likely to be faced by civil 4 and offshore/marine infrastructure applications. In addition, most studies conducted to date have focused on short-term exposures over which the full range of degradation mechanisms are not developed, resulting at times in erroneous conclusions related to long term response and durability. Further, most studies are conducted using immersion conditions, which while important, may not replicate the more commonly faced humidity based environmental exposure conditions. In the case of resins that do not significantly degrade in water at lower temperatures the critical aspect for comparison is achieving the same quantity of moisture sorbed and the concentration gradients similar to those seen in the field in order to replicate effects on performance characteristics. However, in cases where the polymer is sensitive to water care needs to be taken since immersion conditions used in the laboratory can potentially result in a range of effects such as diffusion of residual volatiles, hydrolysis and leaching out at levels not probable with field exposure at specific humidity levels. This is of special significance since mechanisms of deterioration are dependent largely on the characteristics of moisture uptake and diffusion which are different in these cases. Thus, while immersion may provide a convenient means of studying moisture uptake and of simulating accelerated aging, the data generated does not provide a comprehensive understanding of the effects of the range of humidity conditions likely to be faced by components in the field.
Vinylester resin systems are commonly used in pultrusion and provide good characteristics in terms of ease of processing, and in subsequent performance. These resins, however, use styrene in monomeric form as a diluent which leads to an increase in hydrophobicity and a complex progression of cure due to simultaneous homopolymerization and copolymerization reactions at different rates resulting in differential, and incomplete, cure of the bulk polymer.5,6 This can lead, upon exposure to moisture, to a competition between the continued progression of cure that results in increase in performance characteristics with time, and degradation of the resin and fiber-matrix interface levels due to moisture ingress. 7 In addition, the hydrolysis of ester groups in the resin can result in the formation of carboxyl groups causing additional deterioration. 8 Beyond these mechanisms there are two primary sets of effects that accrue from exposure to moisture. The first relates to molecular interactions between water and the polymer network that results in plasticization which, in itself, causes depression of the glass transition temperature and decrease in mechanical strength characteristics 9 and can further lead to hydrolysis which also degrades fiber-matrix interfacial bonding. 10 The second set is associated with mechanisms at the macroscopic level due to molecular processes set in motion by water sorption and the consequent hydrolysis and/or swelling stresses which result in matrix microcracking and/or fiber matrix debonding.11,12 In addition, pultruded composites include fillers in the form of particles such as calcium carbonate, calcium sulfate, alumina trihydrate, and talc which serve as resin extenders and enhance process efficiency by preventing adhesion of the resin or composite to the die, lowering the exothermic peak, and increasing line speeds.13,14 While some of these particles can decrease the volume of the bulk matrix over which moisture can be sorbed the mechanisms of the diffusion processes change significantly from those seen in neat resin based on humidity level and period of immersion. Lekatou et al 15 reported that for glass particle filled composites water diffuses preferably through the bulk matrix at lower temperatures whereas the movement is along the path of matrix-particle interfaces on exposure to high humidity levels. Despite the extensive use of fillers in pultruded GFRP there is a lack of research on the effect of addition of these particles on moisture uptake and diffusion. 16 Thus, there is a need to better understand the complex interaction between moisture and the constituents of the composite as well as between moisture uptake and deteriorative mechanisms that are caused by sorption and diffusion and the lack of a comprehensive understanding of long term performance of GFRP composites under humidity based hygrothermal conditions. 17 While changes in uptake as determined through measurement of change in mass of specimens exposed to immersion/humidity conditions are traditionally used to assess the extent and rate of moisture uptake, and thence to attempt to correlate levels to consequent changes in properties and damage, care needs to be taken in interpreting such data since the measurements reflect the result of a combination of phenomena including absorption, adsorption, and even mass loss due to leaching of lower molecular weight species and removal of interfacial material and small particles through microcracks. Thus the application of diffusion models without consideration of these phenomena can lead to erroneous conclusions and interpretation of response.
The objective of the research reported in this paper is to better understand moisture uptake and diffusion mechanisms in pultruded GFRP composites as a result of exposure to a range of humidity levels and compare that to immersion in water over a range of temperatures for extended periods of time. The characteristics are assessed through sorption isotherms and a set of diffusion models to provide a nuanced understanding of uptake and diffusion mechanisms. This is expected to serve as the basis for a comprehensive study of the effect of exposure to humidity and immersion on the long term durability of such composites.
Materials and test method
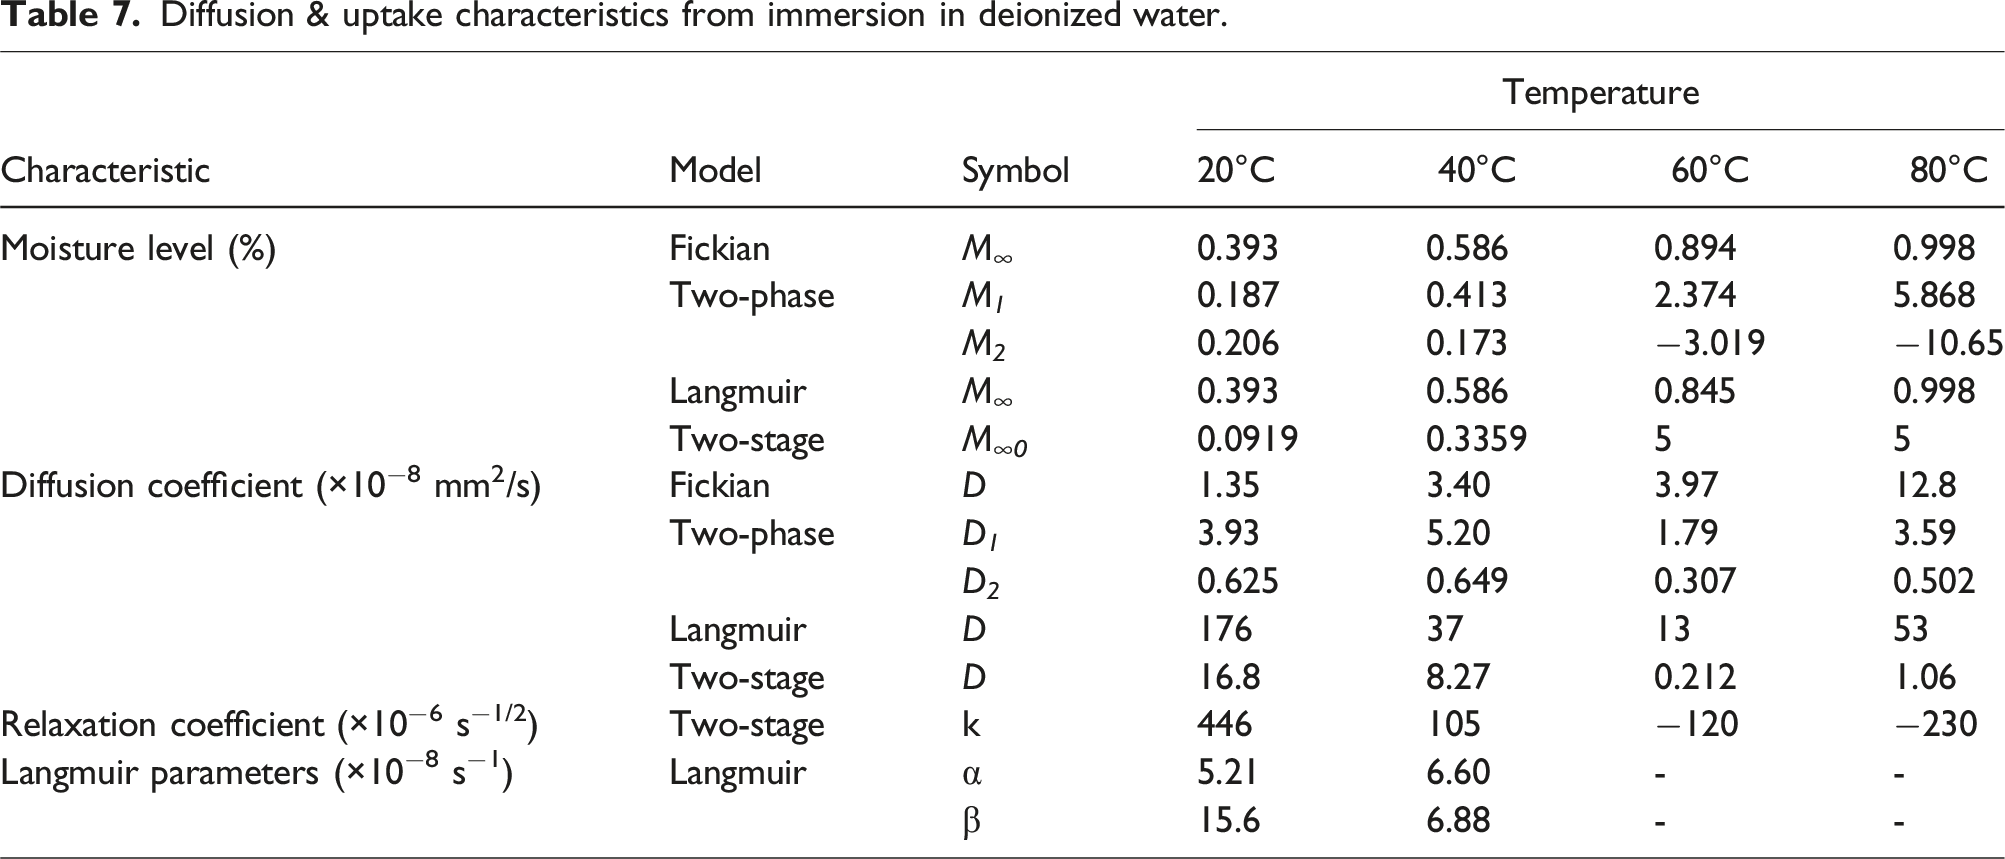
The material system consisted of a pultruded unidirectional E-glass/vinylester composite composed of a bisphenol epoxy-vinylester resin (Reichhold Dion VER 9102) with unidirectional E-glass fibers (Hybon 2026 continuous filament single end roving, PPG 113 Y, with a nominal yield of 113 yd/lb, i.e. nominally roving tex of 4400 g/km, having average fiber diameter of 24 μm and treated with a silane based sizing) and kaolin particles (ASP 400 grade with a specific gravity of 2.58 and nominal average size of 4.8 μm) as fillers. The constituents and system are representative of commercial processes and systems used commonly in the civil and offshore/marine infrastructure sectors with exposure to water. Panels of nominal width of 100 mm and 1.36 mm thickness were pultruded at a line speed of 91 cm/min, with the die temperature in the range of 120°C. Fiber volume fraction was determined to be 68% using burnoff testing, and the glass transition temperature, Tg, was determined to be 117°C through dynamic mechanical thermal analysis (DMTA) using a three-point bend fixture in the transverse mode. The degradation temperature determined from Thermogravimetric Analysis (TGA) was 415°C.
List of environmental exposure conditions investigated.
All specimens were preconditioned at 40°C and 18% RH for 6 weeks to remove any moisture present through cutting and storage while minimizing post-cure and embrittlement. Test specimens were removed from the baths, in the case of immersion, and environmental chambers, in the case of relative humidity, at periodic intervals with padded tweezers to ensure that the pressure on surfaces was minimized and that no dirt/substances from human hands could inadvertently contaminate the specimens and/or exposure conditions. Measurements of mass were taken on a balance with a resolution of 10−5 g. To ensure uniformity and consistency in measurement across all specimens mass was recorded after the specimens were patted dry with tissue paper and a 5 s count. The only exceptions were for specimens exposed to 80°C wherein there was evaporation almost immediately on removal from the environment and thus measurements were recorded immediately after the initial patting dry of the specimens. A minimum of six specimens were used for each period of assessment. Scanning electron microscopy was used to assess the extent of moisture induced deterioration at the fiber, interface and resin levels through carefully polished and sputtered specimens viewed at magnification greater than 2000x.
Results and discussion
Moisture uptake trends
The monitoring of trends in mass change of a material over time enables identification of diffusion phenomena and key characteristics including those of physical processes which occur as water and constituent material elements interact. For example, gravimetric trends may reveal concentration driven diffusion profiles or physical relaxation of the polymer. Additionally, activation energies determined from exposure to environments at different temperatures may shed light and insight as to the physical processes responsible for changes in the GFRP composite. While exposure to moisture, either through immersion or humidity, generally results in an increase in mass because of moisture uptake, it can also result in mass loss due to leaching of lower molecular weight species (LMWS) or due to degradation in the material system leading to constituent loss. While the loss in uptake due to leaching has been extensively reported as resulting from immersion conditions7,17,27–29 it has also been noted after exposure to humid environments where matrix microcracking at the surface and/or interfacial debonding can result in increased sites for mass loss.30,31 Thus, mass loss can also be an indicator of change. Similarly, severe degradation may be indicated by sudden mass gains and a steep change in the moisture uptake profile when wicking along interfaces may occur or by more gradual mass loss when degraded material leaches into the surrounding environment at a faster rate than that of moisture uptake into the composite. Often there is a competition between the phenomena of uptake and degradation resulting in mass gain, or loss, as a result of the interaction between different mechanisms. When considering the uptake of water in material exposed to humid air and water, it is assumed that the only sorbing substance is water molecules. The apparent moisture content (generally reported as percentage change), M
t
, measured at time, t, is determined as
In the current investigation M d < M 0 was observed only in the specific cases of material exposed to conditions of 99% RH at 60°C and 80°C and in conditions of immersion at temperatures of 40°C, 60°C and 80°C.
Moisture uptake curves from the 15 different exposure conditions are shown in Figure 1(a)–(f) based on the type of exposure. Since the abscissa is in units of square root of time in hours, it is useful to point out that 1 week is equivalent to 168 h, i.e. 12.96 on the abscissa, 4 weeks is equivalent to 672 h, i.e. 25.92 on the abscissa, and 96 weeks is equivalent to 16,128 h, i.e. 126.99 on the abscissa. It is emphasized that the scales used for the vertical axis representing apparent moisture uptake are different in Figure 1(a), (b), and (f) to accommodate the extremely different levels of uptake therein from others. Results for specimens exposed to the lowest humidity level, 18% RH, are shown in Figure 1(a) from which it can be seen that overall there was variation from one point of measurement to the next due to the difficulty in maintaining equilibrium between removal from the low humidity chamber and weighing at the higher room humidity level. Exposure at a temperature of 40°C resulted in a gradual increase in uptake while that at 60°C resulted in periods of decrease suggesting differing mechanisms. However, the overall levels of change were significantly lower than that under the rest of the exposure conditions investigated. The overall level of uptake and change though is extremely low and hence this condition will not be used in determination of uptake characteristics such as diffusion and relaxation coefficients. (a) Apparent moisture uptake at 18% RH as a function of temperature. (b) Apparent moisture uptake at 50% RH as a function of temperature. (c) Apparent moisture uptake at 99% RH as a function of temperature. (d) Apparent moisture uptake at 60°C as a function of RH level and immersion in deionized water. (e) Apparent moisture uptake due to immersion in deionized water as a function of temperature. (f) Apparent moisture uptake due to immersion in deionized water at 80°C.
In comparison to the low, and varying, uptake levels at 18% RH, the specimens exposed to 50% RH as shown in Figure 1(b) show an initial increase in uptake with time of exposure, followed by a plateau, and then either oscillation about a mean (as seen at 20°C) or a further increase. The rates of initial uptake increase with temperature of exposure and the overall response is indicative of gradual structural modification as a result of adsorption phenomena with initial response at 20°C being Fickian in nature with the specimens exposed to the higher temperatures of 40°C and 60°C indicating attainment of a pseudo-equilibrium threshold at about 6 weeks, after which there is a slight decrease followed by an increase. This type of response is indicative of relaxation of the polymer with the effect being less at the higher temperature indicative of the formation of a stiffer network with greater progression of cure as validated through dynamic mechanical thermal analysis (DMTA), and hence lower ultimate uptake. As can be seen the specimens at 40°C continue to show increased uptake even at the end of the period of investigation of 96 weeks, whereas those at 60°C appear to have attained an asymptotic threshold. This effect of a second set of mechanisms at 40°C is further emphasized through a comparison of uptake levels between the initial threshold attained at about 4 and 6 weeks for the exposures at 40°C and 60°C, respectively, and that attained at the end with the increase being 58.8% at 40°C and 22.6% at 60°C.
An increase in the level of humidity to 99% RH shows both increasing rates of uptake and maximum levels of uptake with temperature of exposure as shown in Figure 1(c). A true asymptote is not attained at any of these temperatures, except in transition at the two higher temperatures of exposure prior to decreases, and thus maximum level of uptake cannot be considered to be independent of temperature, contrary to what is often assumed. At the two highest temperature levels, the extent of degradation results in a drop in uptake with this occurring earlier with increase in temperature. It should be noted that the deterioration initiates far earlier and is only noted through moisture uptake plots when extractive mechanisms result in greater loss than the level of uptake. The extent, and initiation, of the drop is a result of the competition between several phenomena and hence should not, in error, be taken as the first instance of degradation which is actually obscured by the uptake since the kinetics of deterioration (leaching, material loss etc.) are very slow and of extremely low amplitude initially. It is of interest to compare response at 60°C between specimens exposed to 50% RH, 75% RH, 99% RH and immersion in deionized water to assess differences at the same temperature. As can be seen from Figure 1(d), the response is representative of Fickian behavior at the two lower humidity levels transitioning to two-stage behavior at 99% RH and then indicative of degradation and mass loss due to immersion. As will be discussed later, the adjusted maximum moisture uptake level for the immersion specimens is higher than that of the ones exposed to humidity and both initial rate and maximum uptake increase with increase in levels of relative humidity. While the 75% RH data was only collected at an exposure temperature of 60°C, similar trends are also indicated in other sets. Results due to immersion in deionized water at three different temperatures is shown in Figure 1(e). While the specimens exposed to the two lower temperatures do not reach full equilibrium there is indication of pseudo-Fickian response within the 96-week period of immersion dominated by diffusion initially and then by relaxation phenomena as reported in Ref. 32. Specimens at 60°C (shown in Figure 1(e)) and 80°C (shown in Figure 1(f), since the levels of loss are so different) both show degradation after a peak, indicative of leaching of LMWS as reported earlier and as determined through comparison of mass before, and after, drying with M
d
< M
0
. Following Weitsman,
33
the uptake trends can be represented in terms of uptake mechanisms and modes as shown schematically in Figure 2. Schematic of potential moisture uptake trends.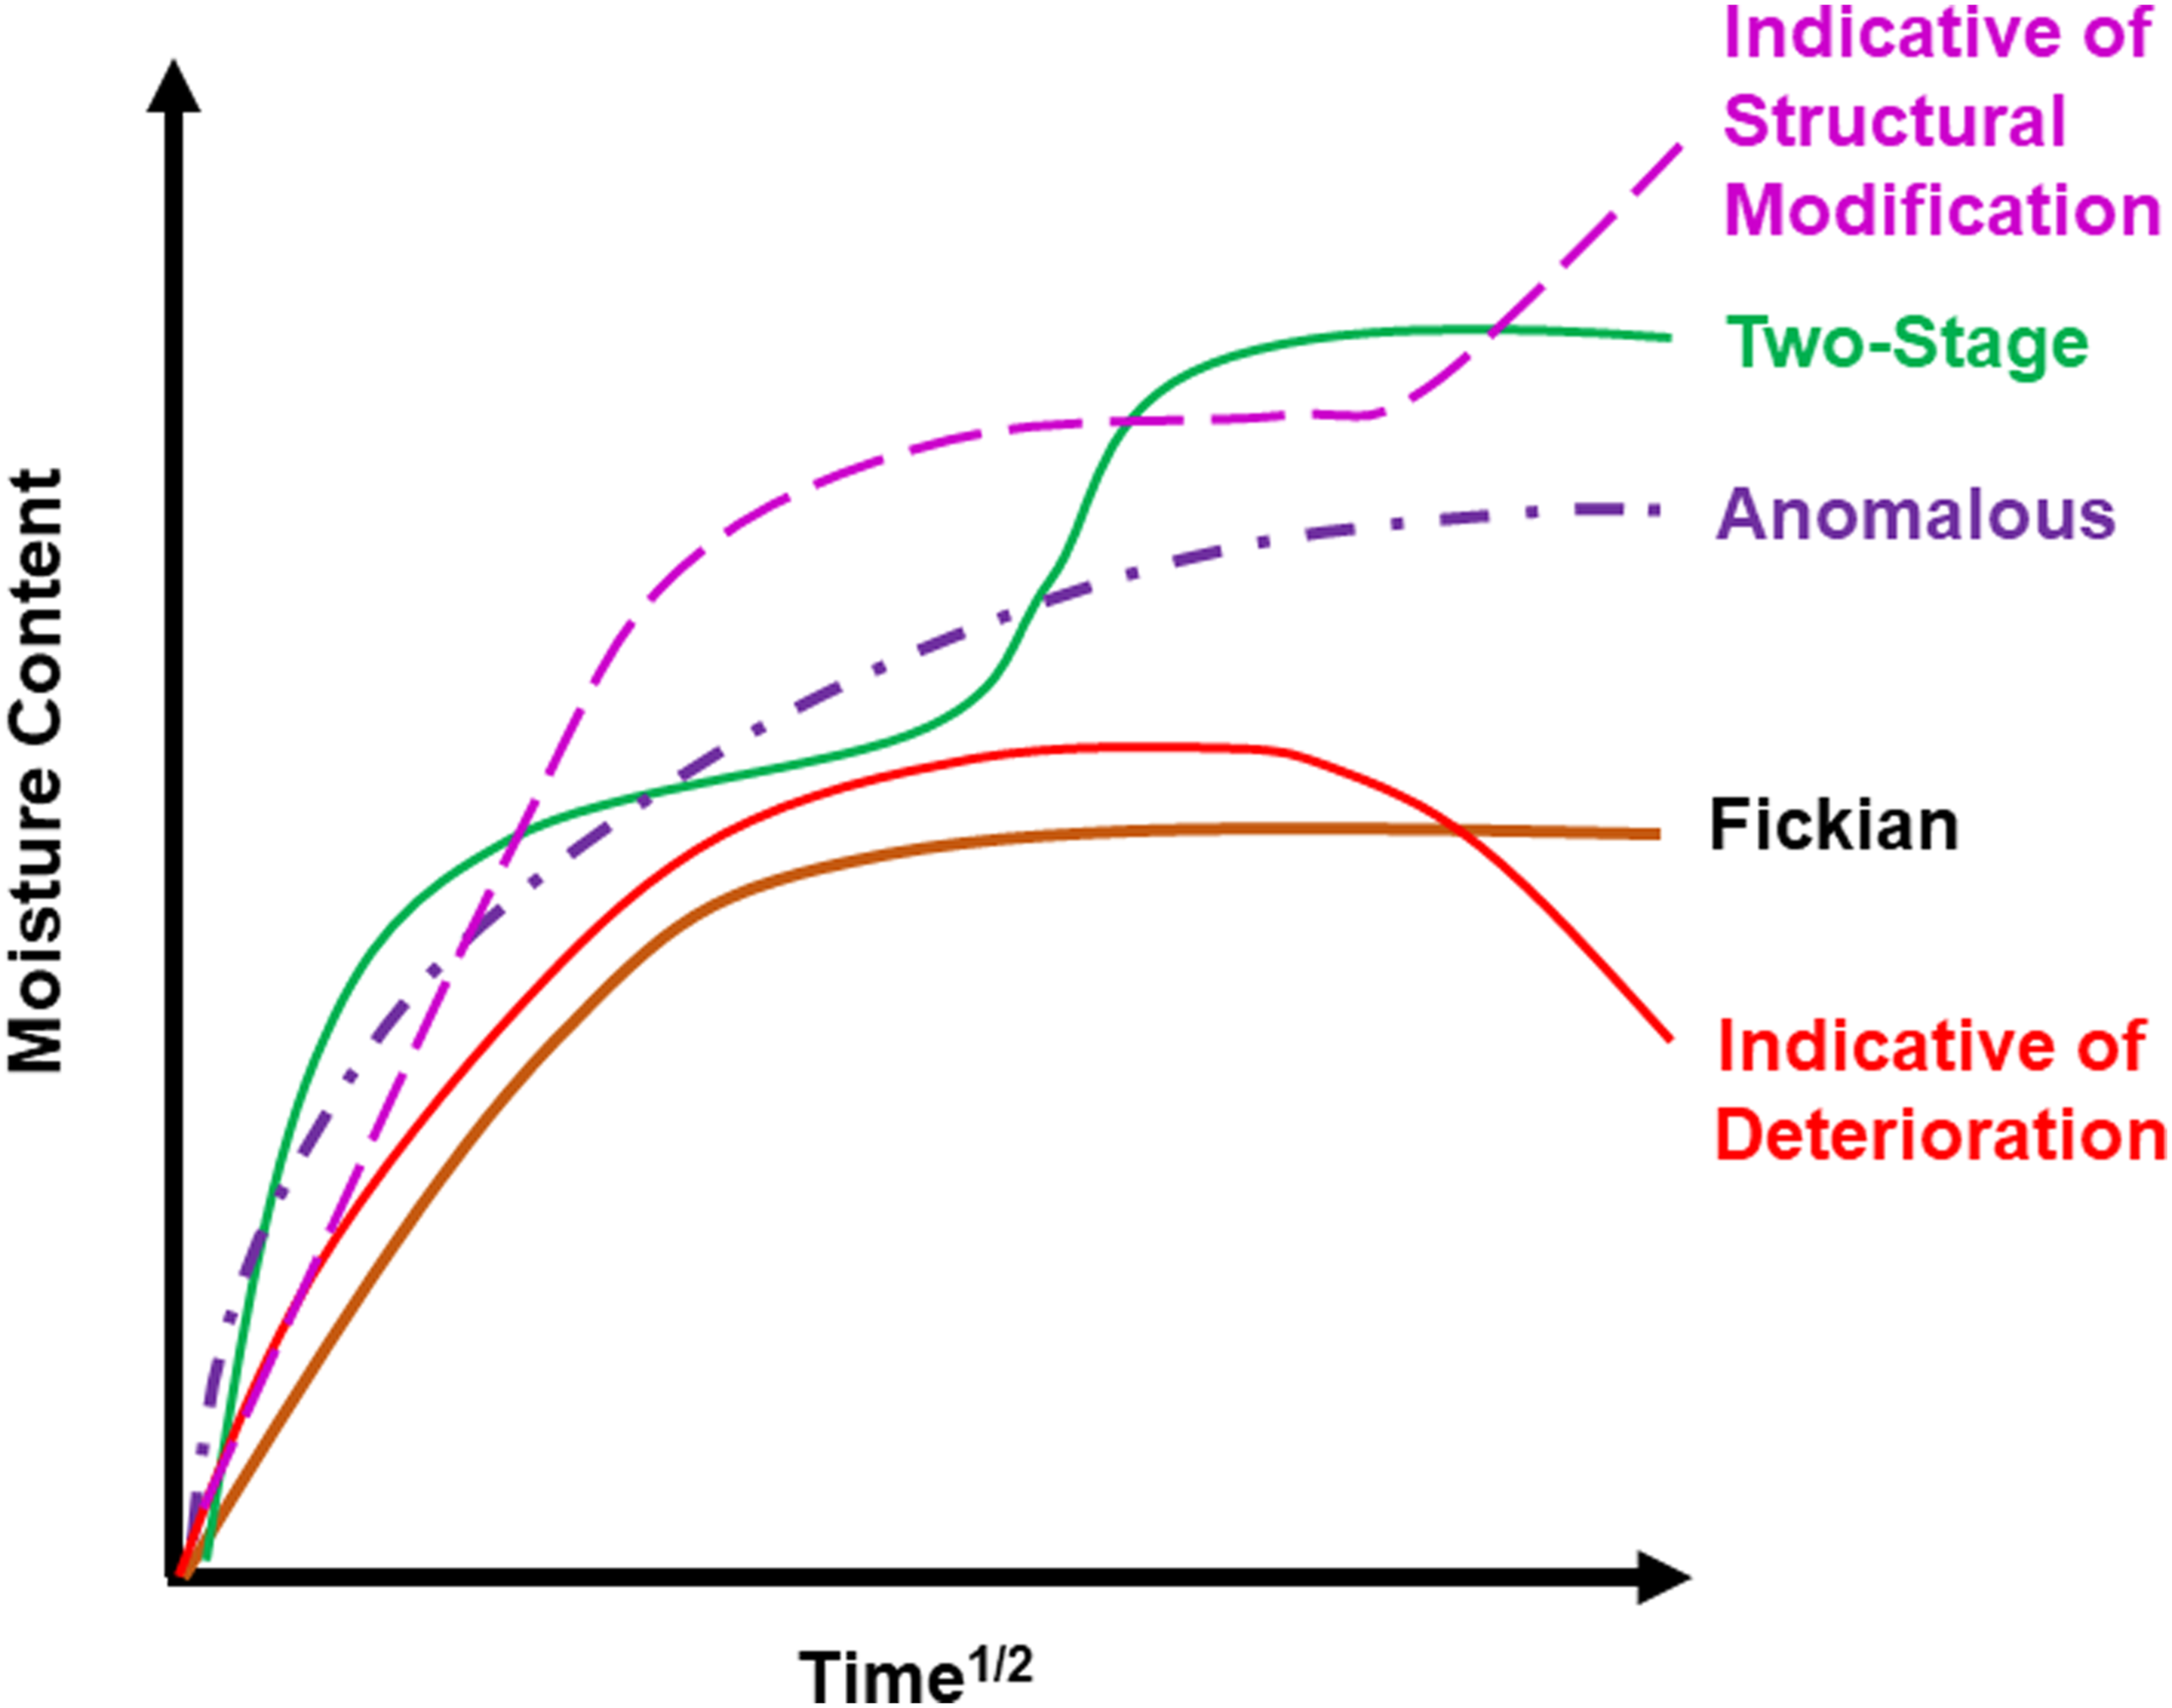
The different exposure conditions of humidity and immersion as a function of temperature thus show a range of trends from the conventionally assumed Fickian mode where initial uptake is linear to about Deterioration in the composite as a result of immersion in deionized water at an elevated temperature at 2800x.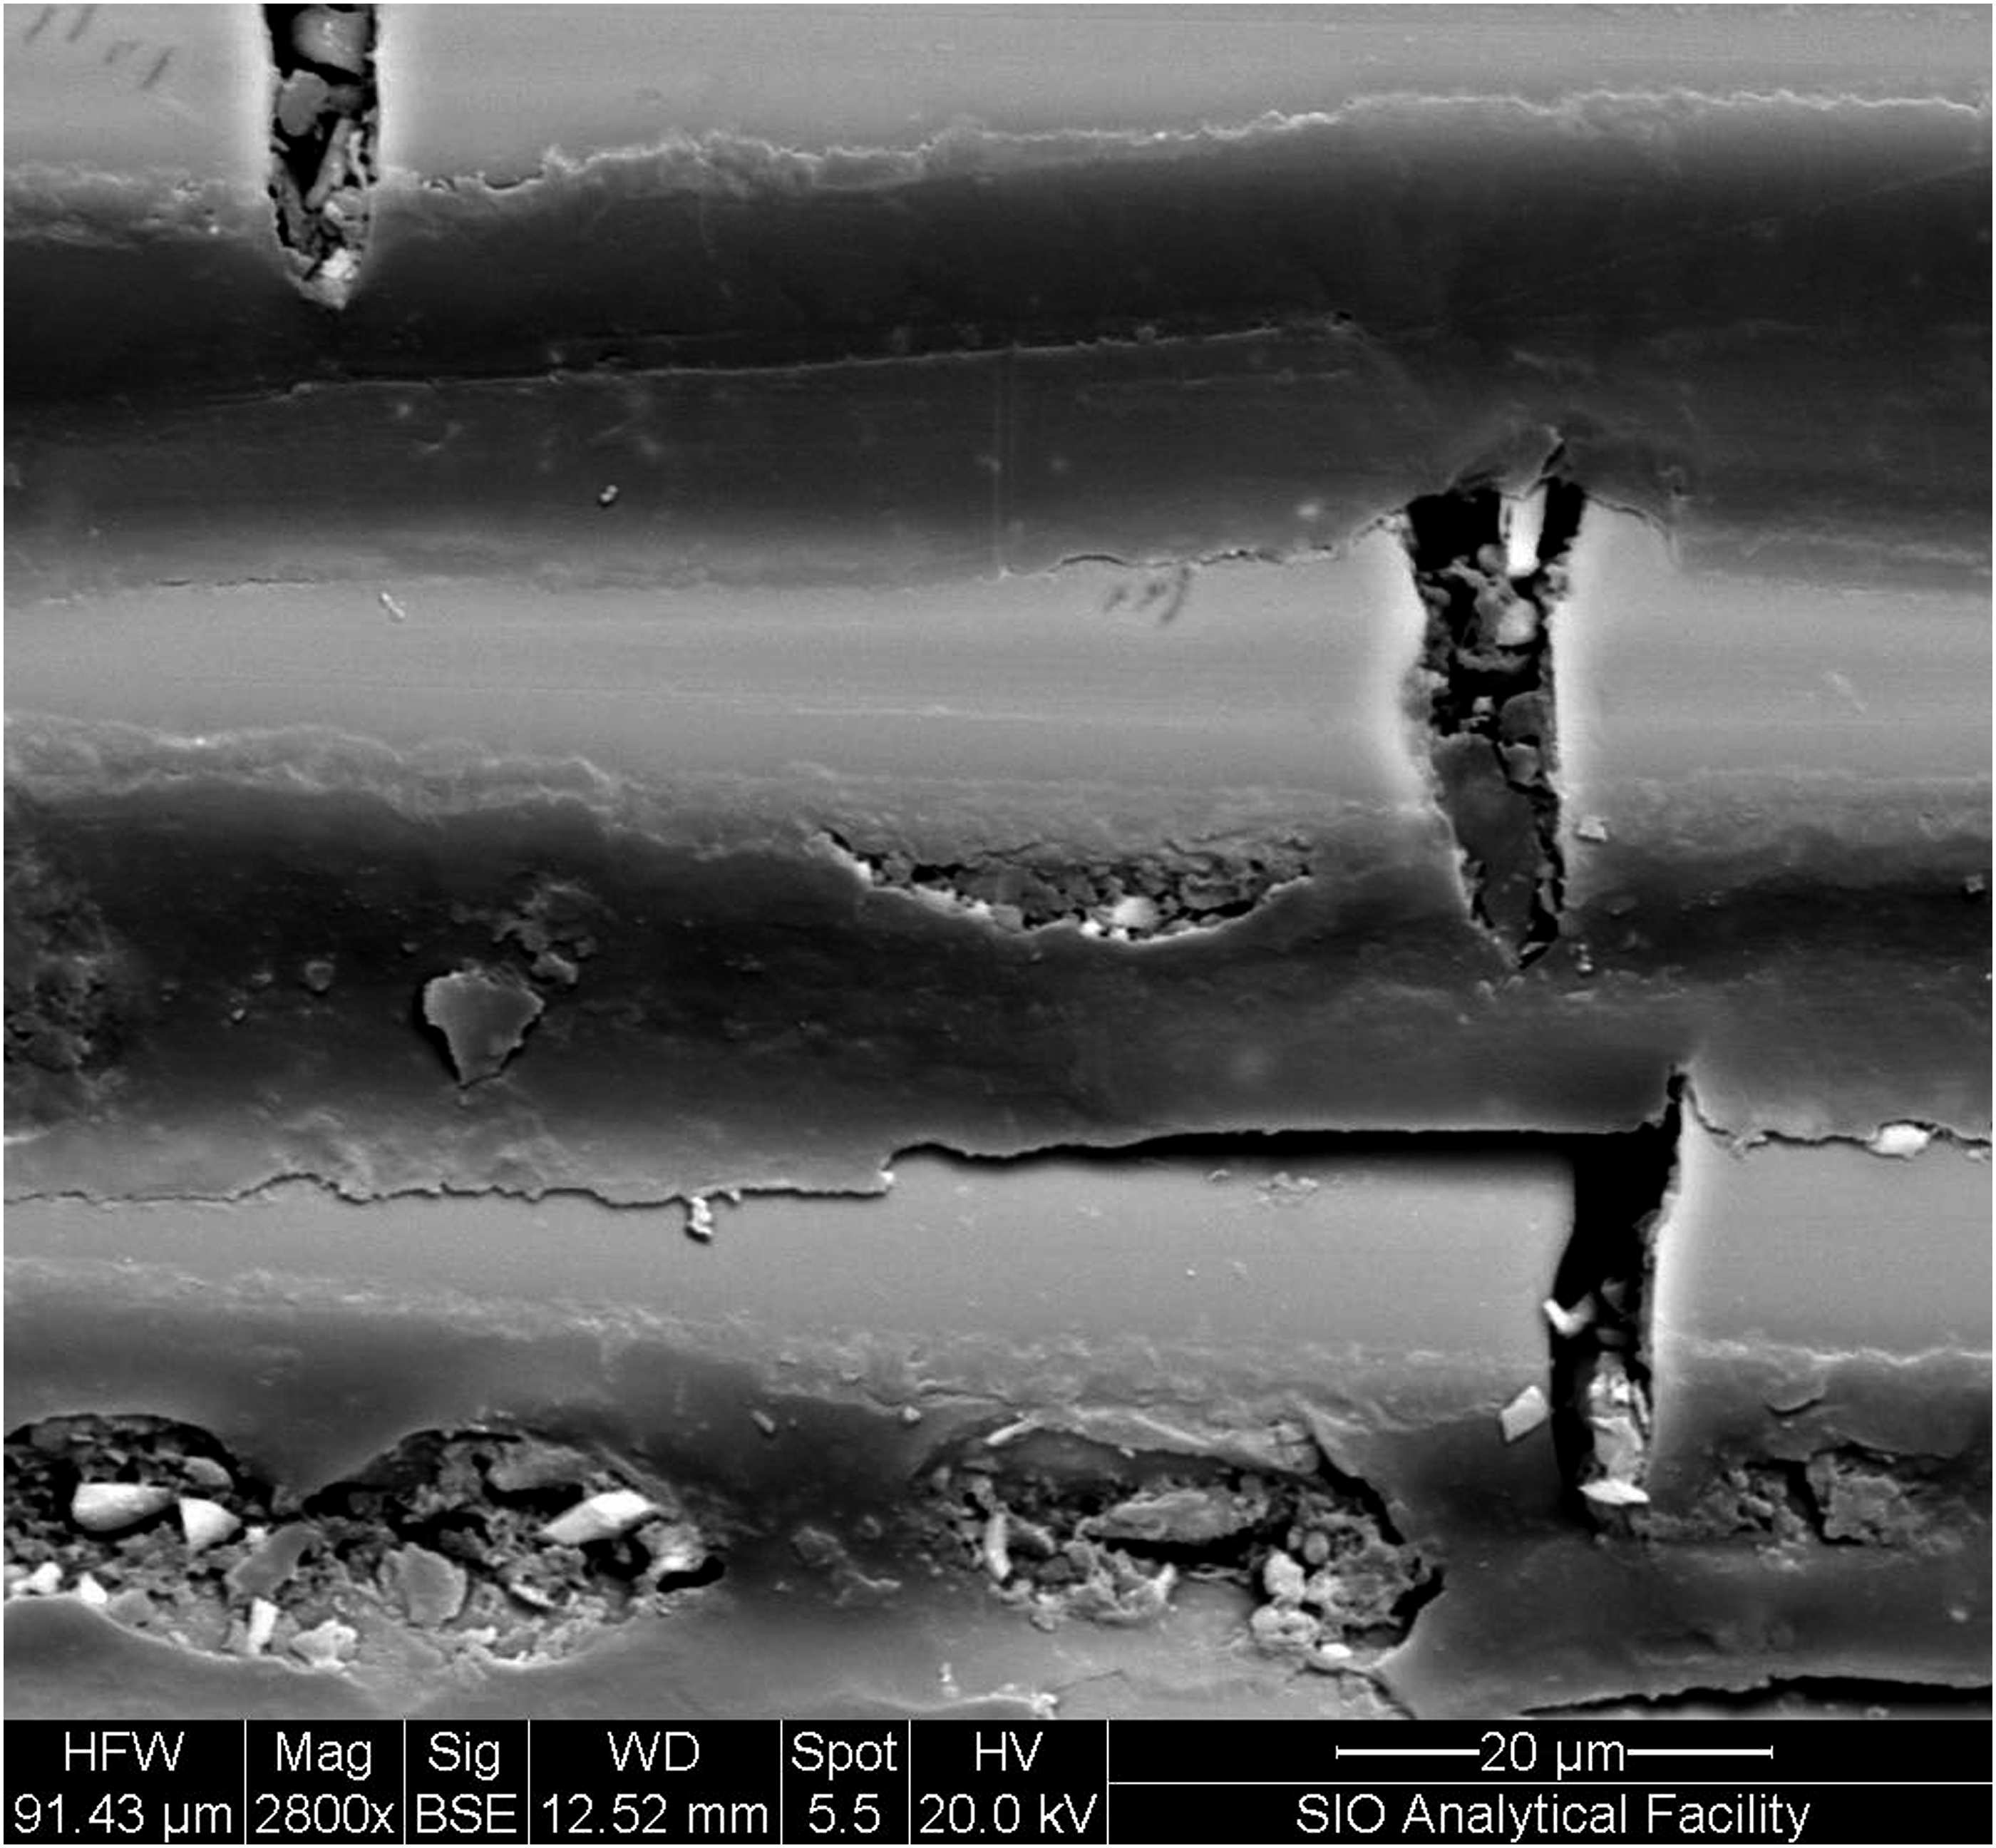
Maximum moisture content and isotherms
Levels of Maximum Moisture Content (%). Standard Deviations are in [ ].
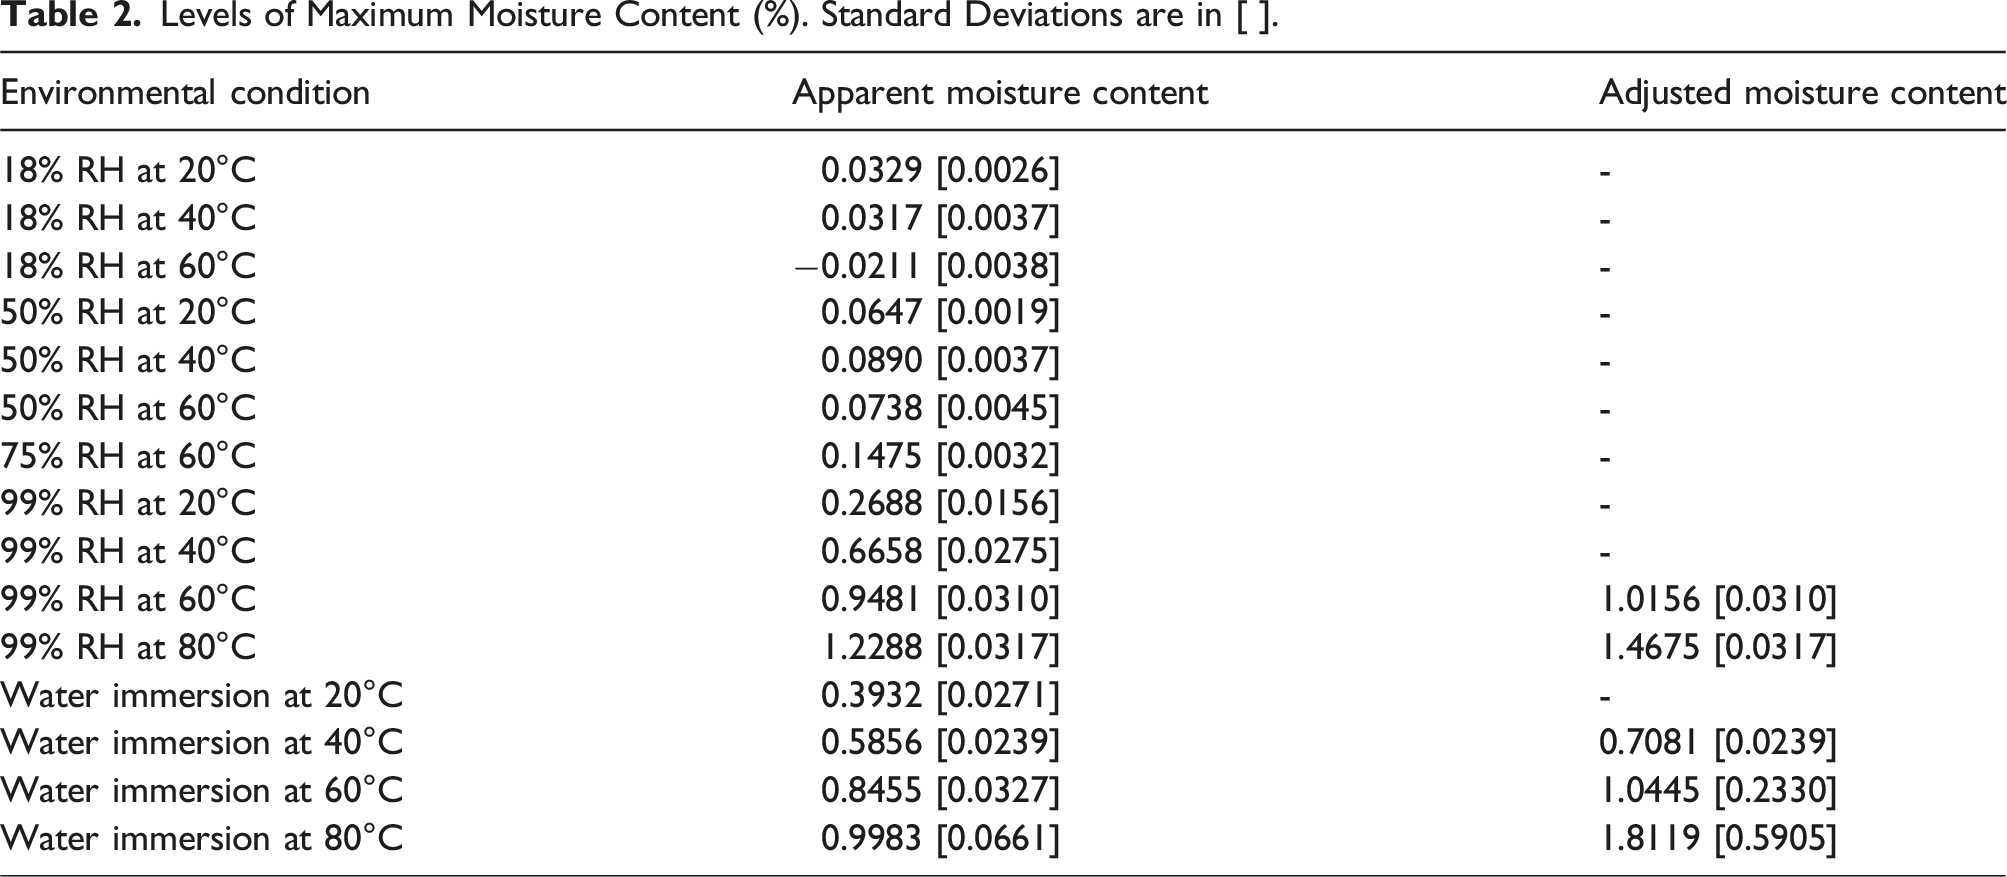
Table 2 also shows the maximum adjusted moisture contents for material exposed to conditions of 99% RH and immersion where M d < M 0 . Exposure to 99% RH at 20°C and 40°C for 96 weeks did not result any weight loss and hence adjusted moisture content is not reported for that case. Standard deviations reported for the adjusted contents are the largest standard deviations of the wet or dry set. The high level of scatter reported for material exposed to 80°C immersion is a consequence of unstable readings due to immediate evaporation of water from the highly degraded material as well as due to local deterioration at this level which can differ from specimen to specimen. It is noted that this exposure condition showed the highest adjusted level of moisture uptake as well. A comparison of the maximum uptake level due to immersion at 20°C (as shown in Figure 1(e)) which shows no apparent deterioration, indicates that the adjusted moisture uptake level at 80°C of 1.8119% is almost 4.6 times greater, indicative of significant deterioration. Under this condition of exposure there is deterioration at the levels of fiber, fiber-matrix interface, and resin as shown by the SEM image in Figure 3. Since these are largely local the high levels of standard deviation are to be expected.


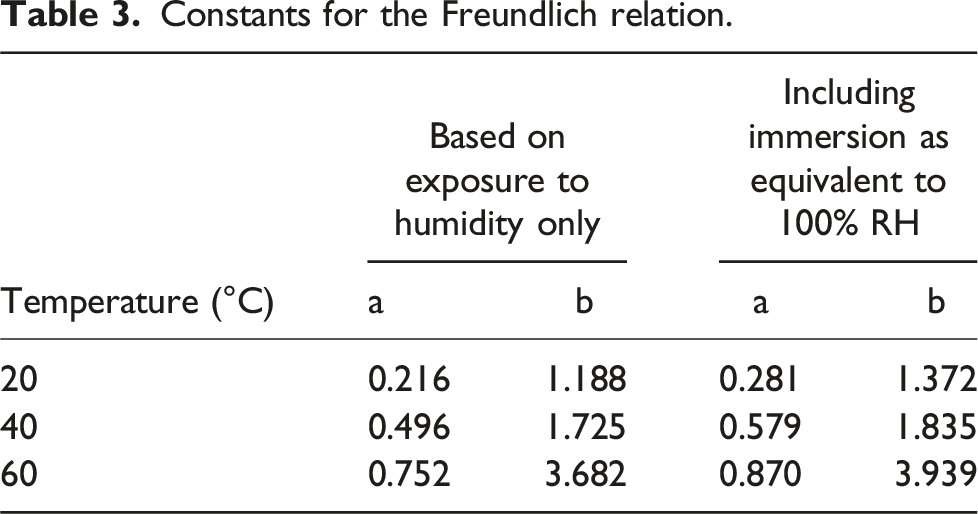
Constants for the Freundlich relation.
Comparison of diffusion models and characteristics
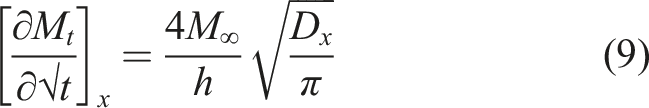
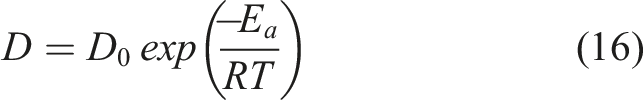
The diffusion of moisture into polymers and composites is often modeled using Fick’s law42,46 which intrinsically assumes the attainment of a saturation moisture content within the time period of investigation with diffusion driven entirely by the concentration gradient. However, the uptake profiles seen in Figure 1 and as shown schematically in Figure 2 show significant variation from this idealized response. The range of mechanisms at play in the bulk resin and at the interface level as well as aspects of slow progression of cure, leaching of low molecular weight species, and deterioration through debonding and cracking, in addition to the anisotropy of the material can result in complex phenomena and often competing mechanisms. In some cases, the response is better described by dual-phase diffusion models, 47 and in others by associating transport of moisture with both concentration gradient driven diffusion over the short-term and time-dependent relaxation and deterioration over the longer-term following the theories of Behrens 48 and Behrens and Hopfenberg. 49 In others, a stepped response that considers changes in internal morphology with two different Fickian mechanisms as suggested by Jacobs and Jones 50 may be more appropriate. Reviews of diffusion models and parameters for composites are discussed in Ref. 24,51–53 and hence will not be repeated herein. However, it is clear that a single model may not be sufficient to capture the full extent of behavior for the exposure conditions considered in this investigation, and as an extension during the service life of this class of materials over the wide range of humidities and immersion conditions likely to be faced. Thus, for the purposes of characterization, and comparison, 4 different models are considered in the current investigation.
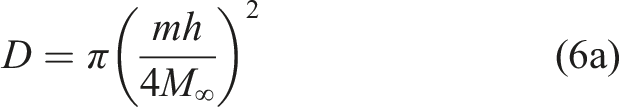
The Fickian diffusion model following Crank
46
is the simplest and assumes that moisture uptake is diffusion dominated with the coefficient of diffusion, D, for a unidirectional specimen, being independent of moisture content leading to a linear uptake regime followed by attainment of an equilibrium level as shown in Figure 2. Uptake can be described by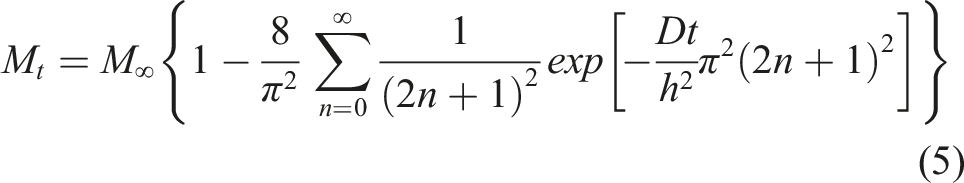

The third model is a non-steady state diffusion model based on Langmuir absorption theory as developed by Carter and Kibler
47
wherein consideration is given to the sorption of water occurring through the diffusion of free species into the sorbent concurrent with water molecules becoming bound to the polymer through adsorption processes. Equilibrium is achieved as the rates of conversion between free and bound molecules become equal. In this case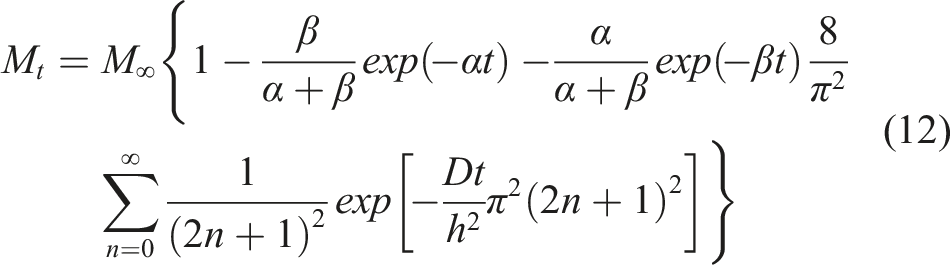
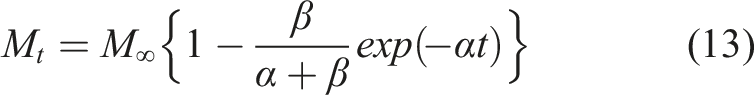
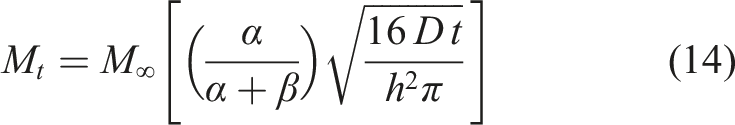
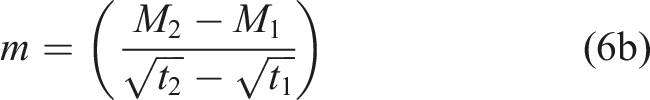
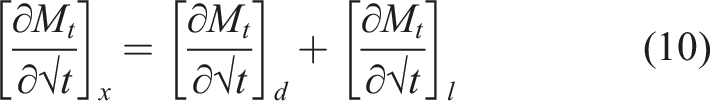
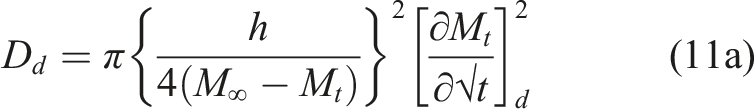
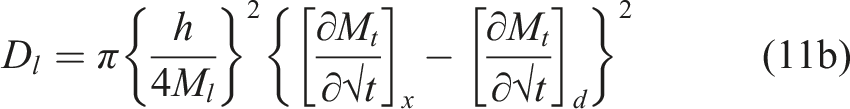
In many cases, however, equilibrium in moisture uptake levels is not achieved even after long term exposure due to a combination of diffusion and longer-term relaxation/deterioration. The fourth model considers this type of two-stage uptake with the first and second stages being diffusion and relaxation controlled, respectively, so as to take into consideration relaxation induced by absorbed water
59
as well as changes due to chemical degradation and moisture induced damage
60
which result in absorption at a rate much slower than the initial diffusion dominated rate. Moisture uptake following
59
is expressed as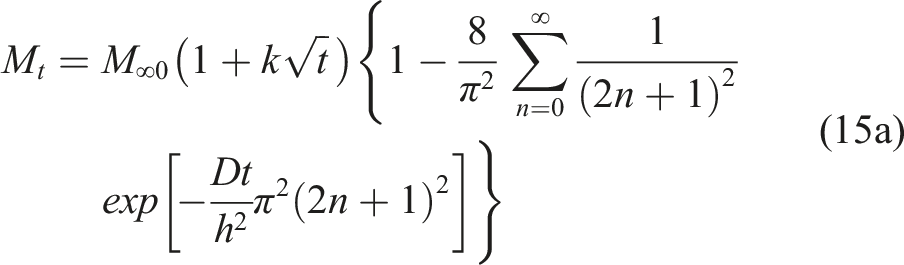
Results are first discussed by assessing the suitability of different models as related to describing uptake at 50% RH, 75% RH, 99% RH, and immersion conditions over the range of temperatures investigated, and then using those to further characterize and understand the overall uptake process and its implications. At each exposure condition the primary diffusion characteristics are noted and compared keeping in mind that the definitions of each can vary based on model and thus a true 1-to-1 comparison may not be possible, such as in the case of equilibrium moisture level where it refers to the final level for the Fickian model but the equilibrium level for the Phase 1 diffusion dominated regime in the two-stage model that incorporates relaxation and deterioration in the second stage.
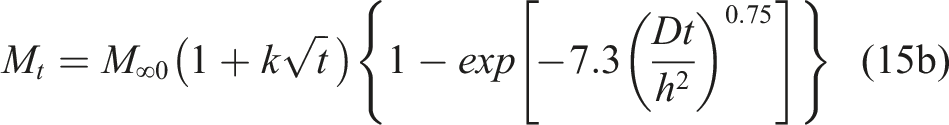
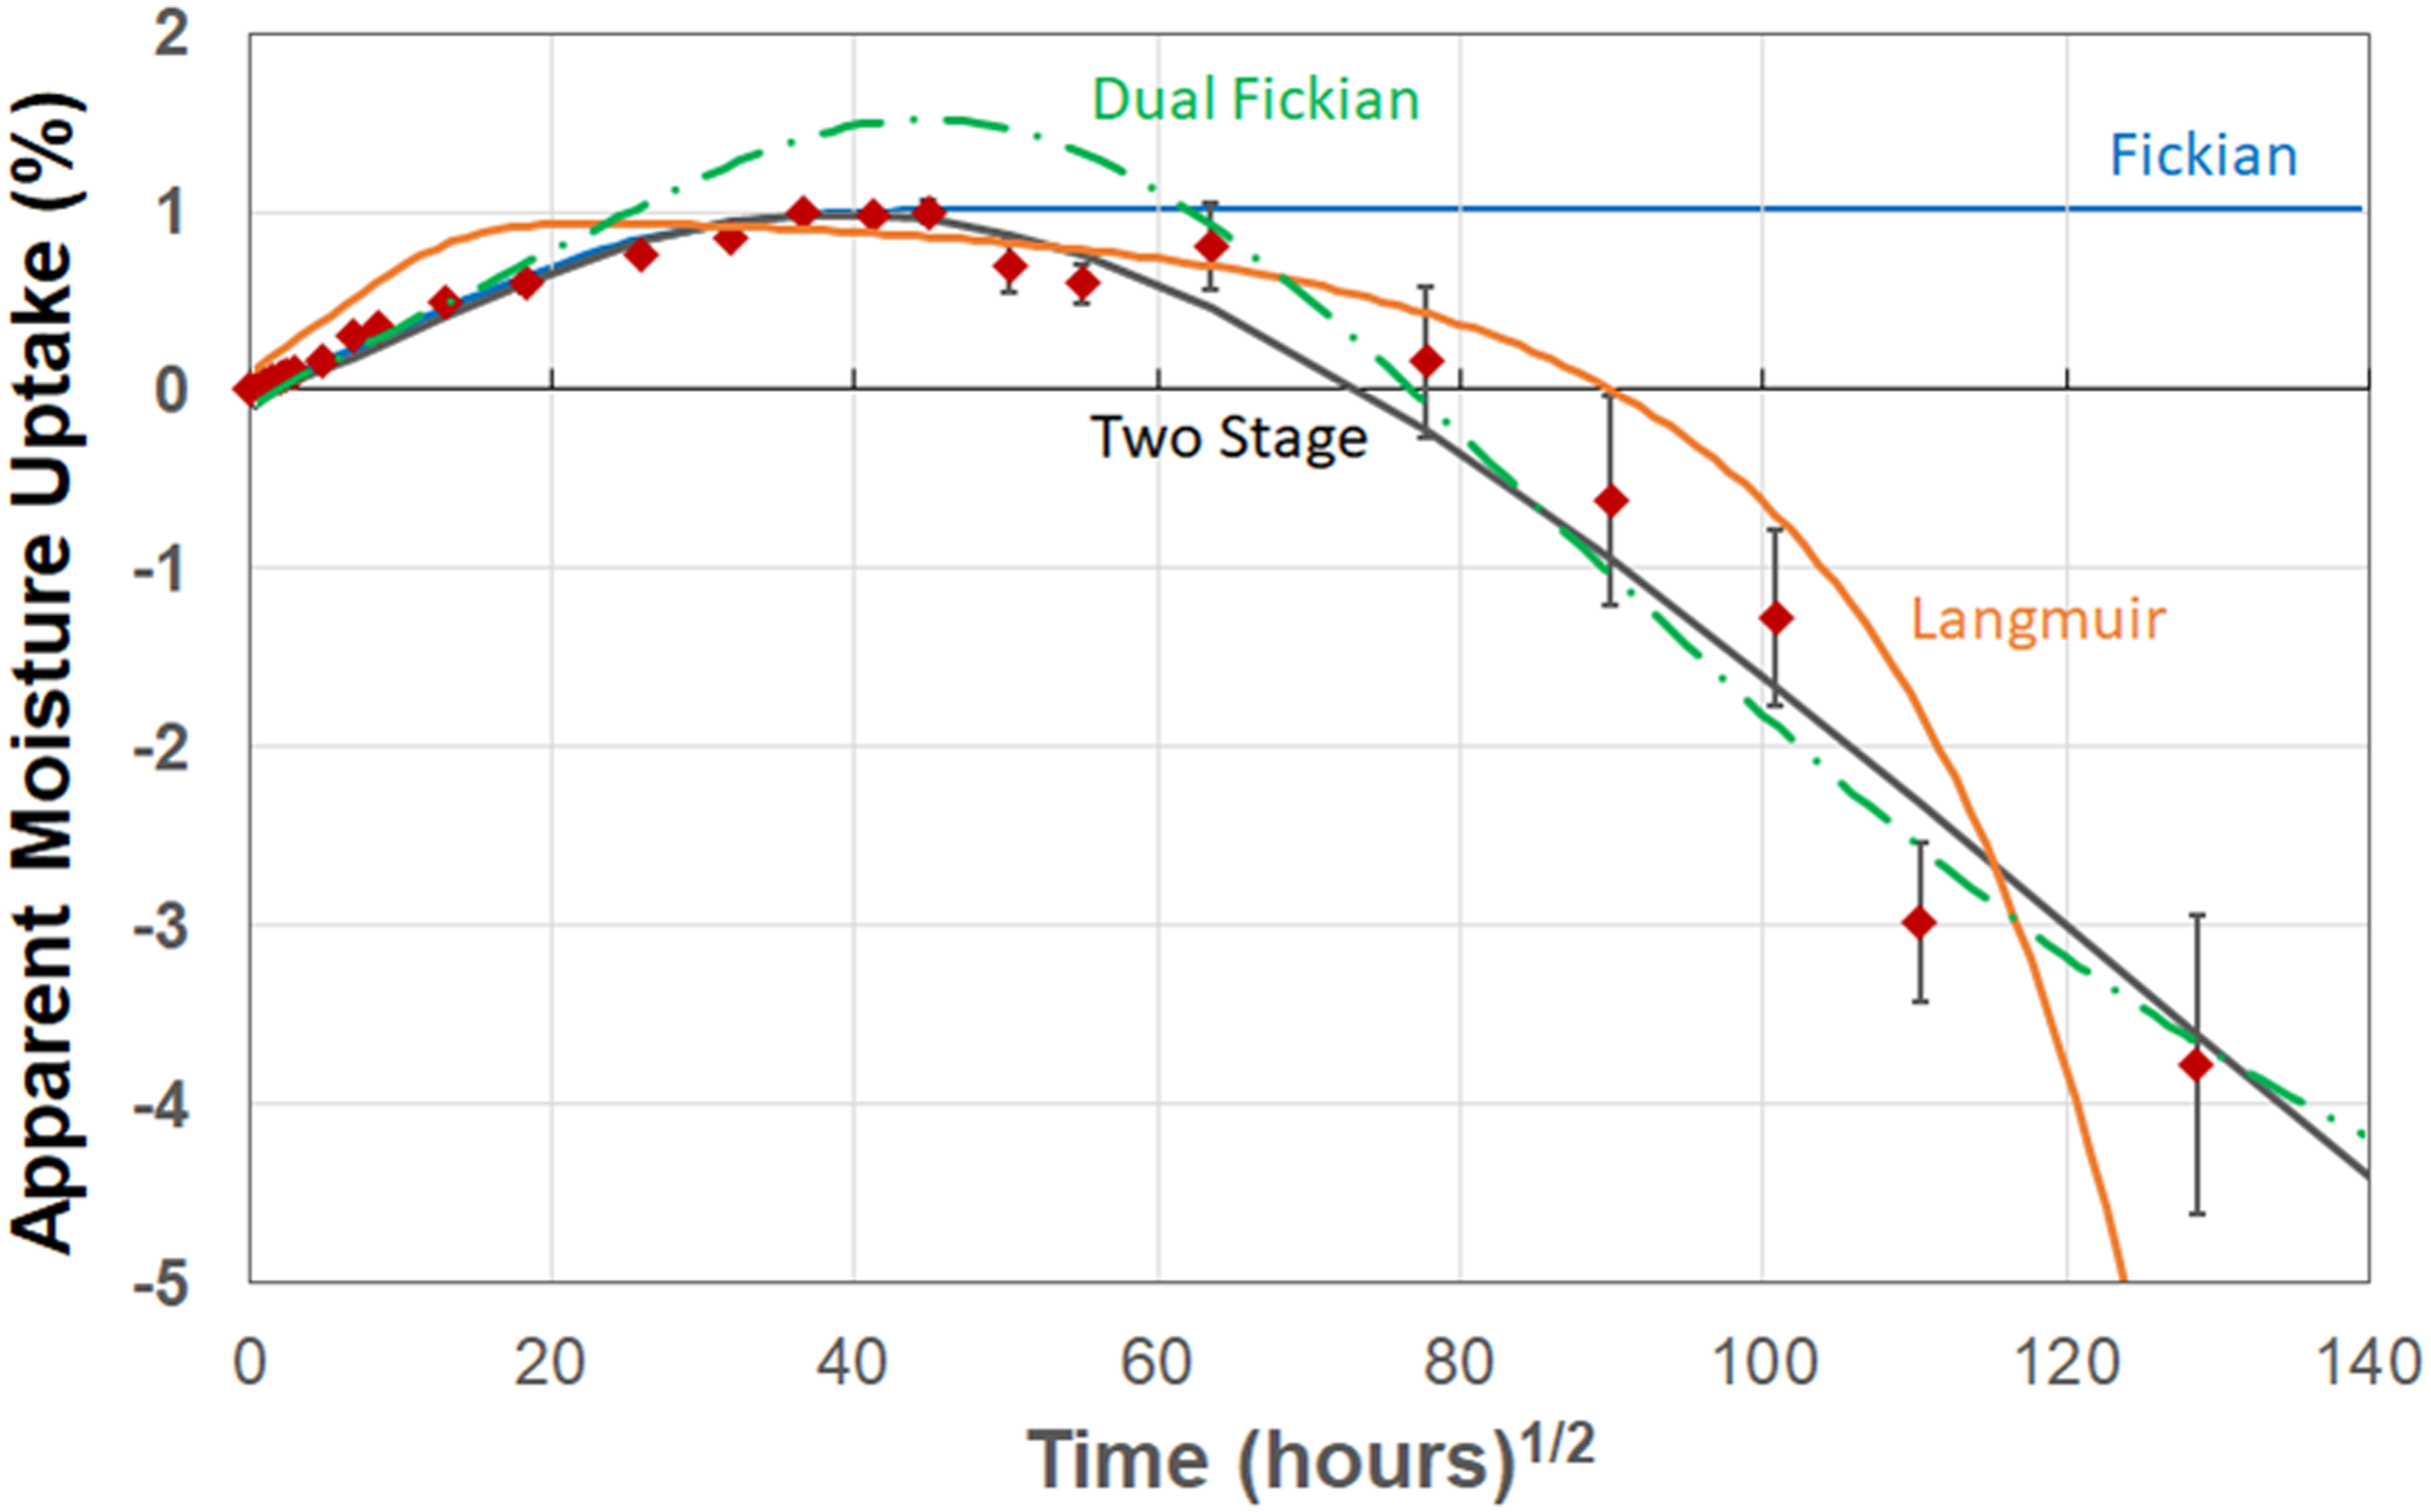
As seen in Figure 4(a) it is clear that after the initial uptake ranging from 7 days at the lowest temperature of immersion and 3 days at the highest temperature of immersion the Fickian model describes neither the rest of the uptake regime nor the end state given the clear stepped nature of uptake in the experimental data from exposure to 50% RH. In comparison, the two-phase diffusion model is able to better describe this response (Figure 4(b)) through consideration of two levels of moisture uptake. While the Langmuir model (Figure 4(c)) is able to capture the overall trends it does not describe nuances well even at the level of initial diffusion rate, whereas the structural-modification based diffusion theory (Figure 5(d)) appears to best capture both the initial and later stages through differentiation between the diffusion and relaxation dominated regimes and the transitionary moisture uptake level, M
∞0
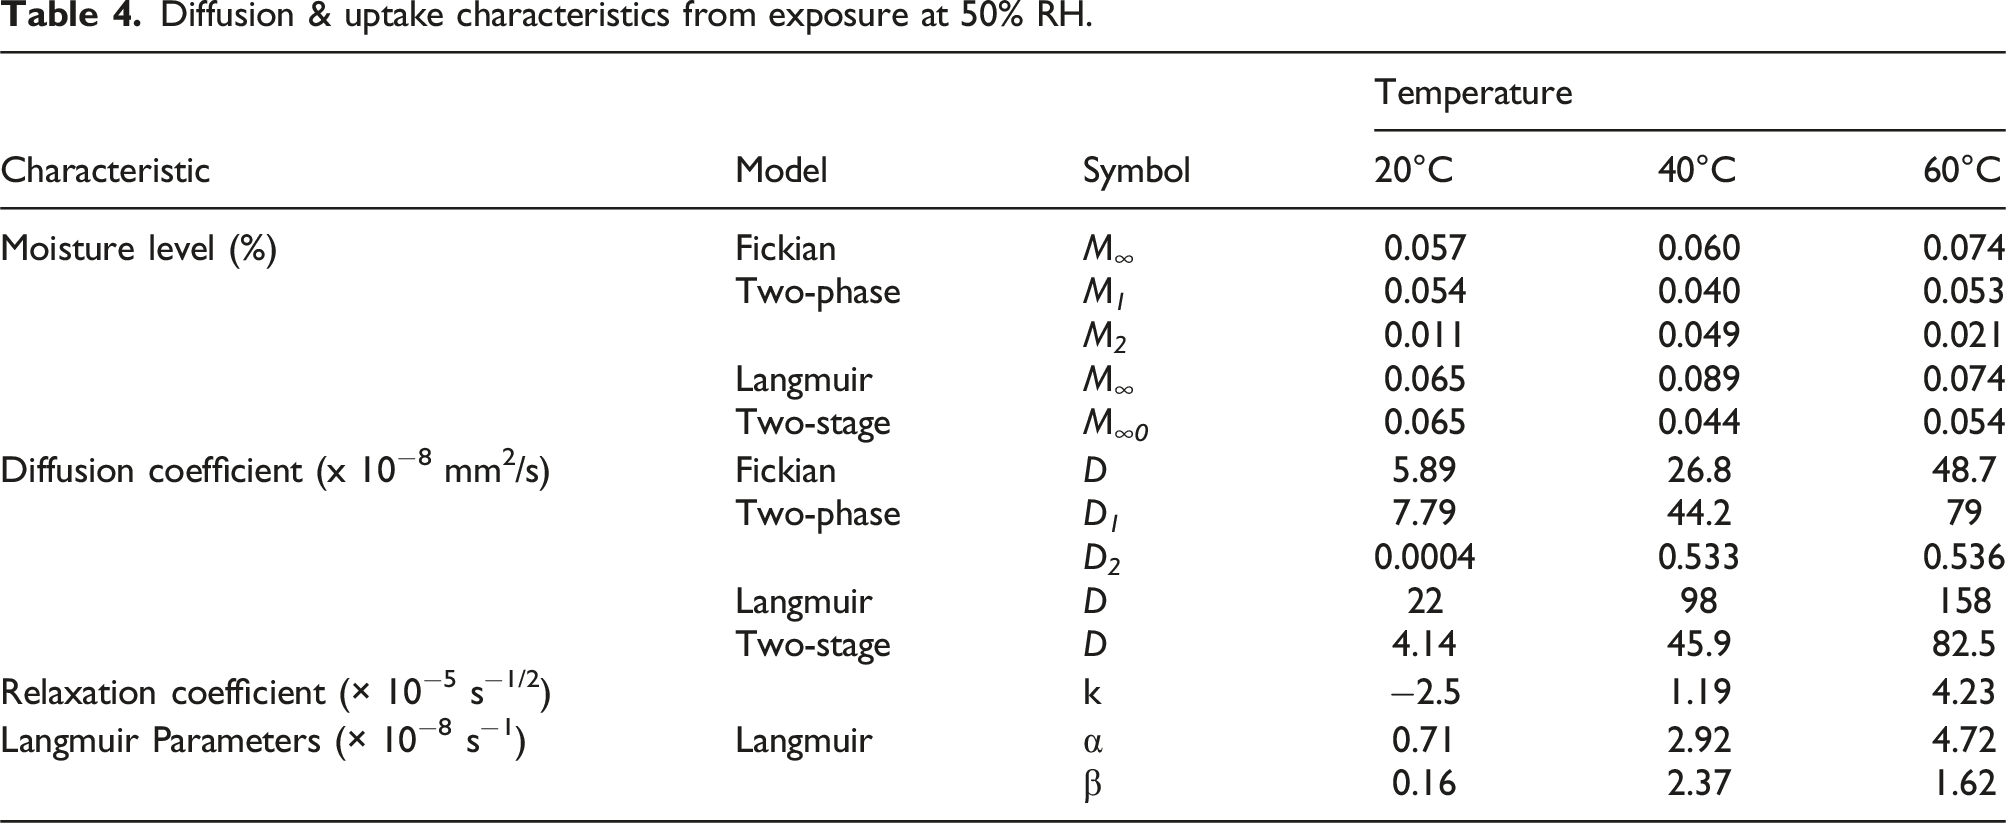
, which relates to the stage I diffusion dominated regime. A comparison of characteristics for the models is listed in Table 4. For purposes of comparison similar characteristics are grouped together. However, as mentioned previously since the definitions vary, comparisons cannot as such be based on absolute values, but are useful in terms of trends. As seen in Table 4 while the values of the diffusion coefficients are different, they all show an increasing trend with temperature. Comparison of model predictions (dashed lines) with experimental data (solid symbols) at 50% RH. (a) Fickian model, (b) Two-stage Fickian model, (c) Langmuir model, and (d) Two-stage, structural modification, model. Comparison of model predictions (dashed lines) with experimental data (solid symbols) at 99% RH. (a) Fickian model, (b) Two-stage Fickian model, (c) Langmuir model, and (d) Two-stage, structural modification, model. Diffusion & uptake characteristics from exposure at 50% RH.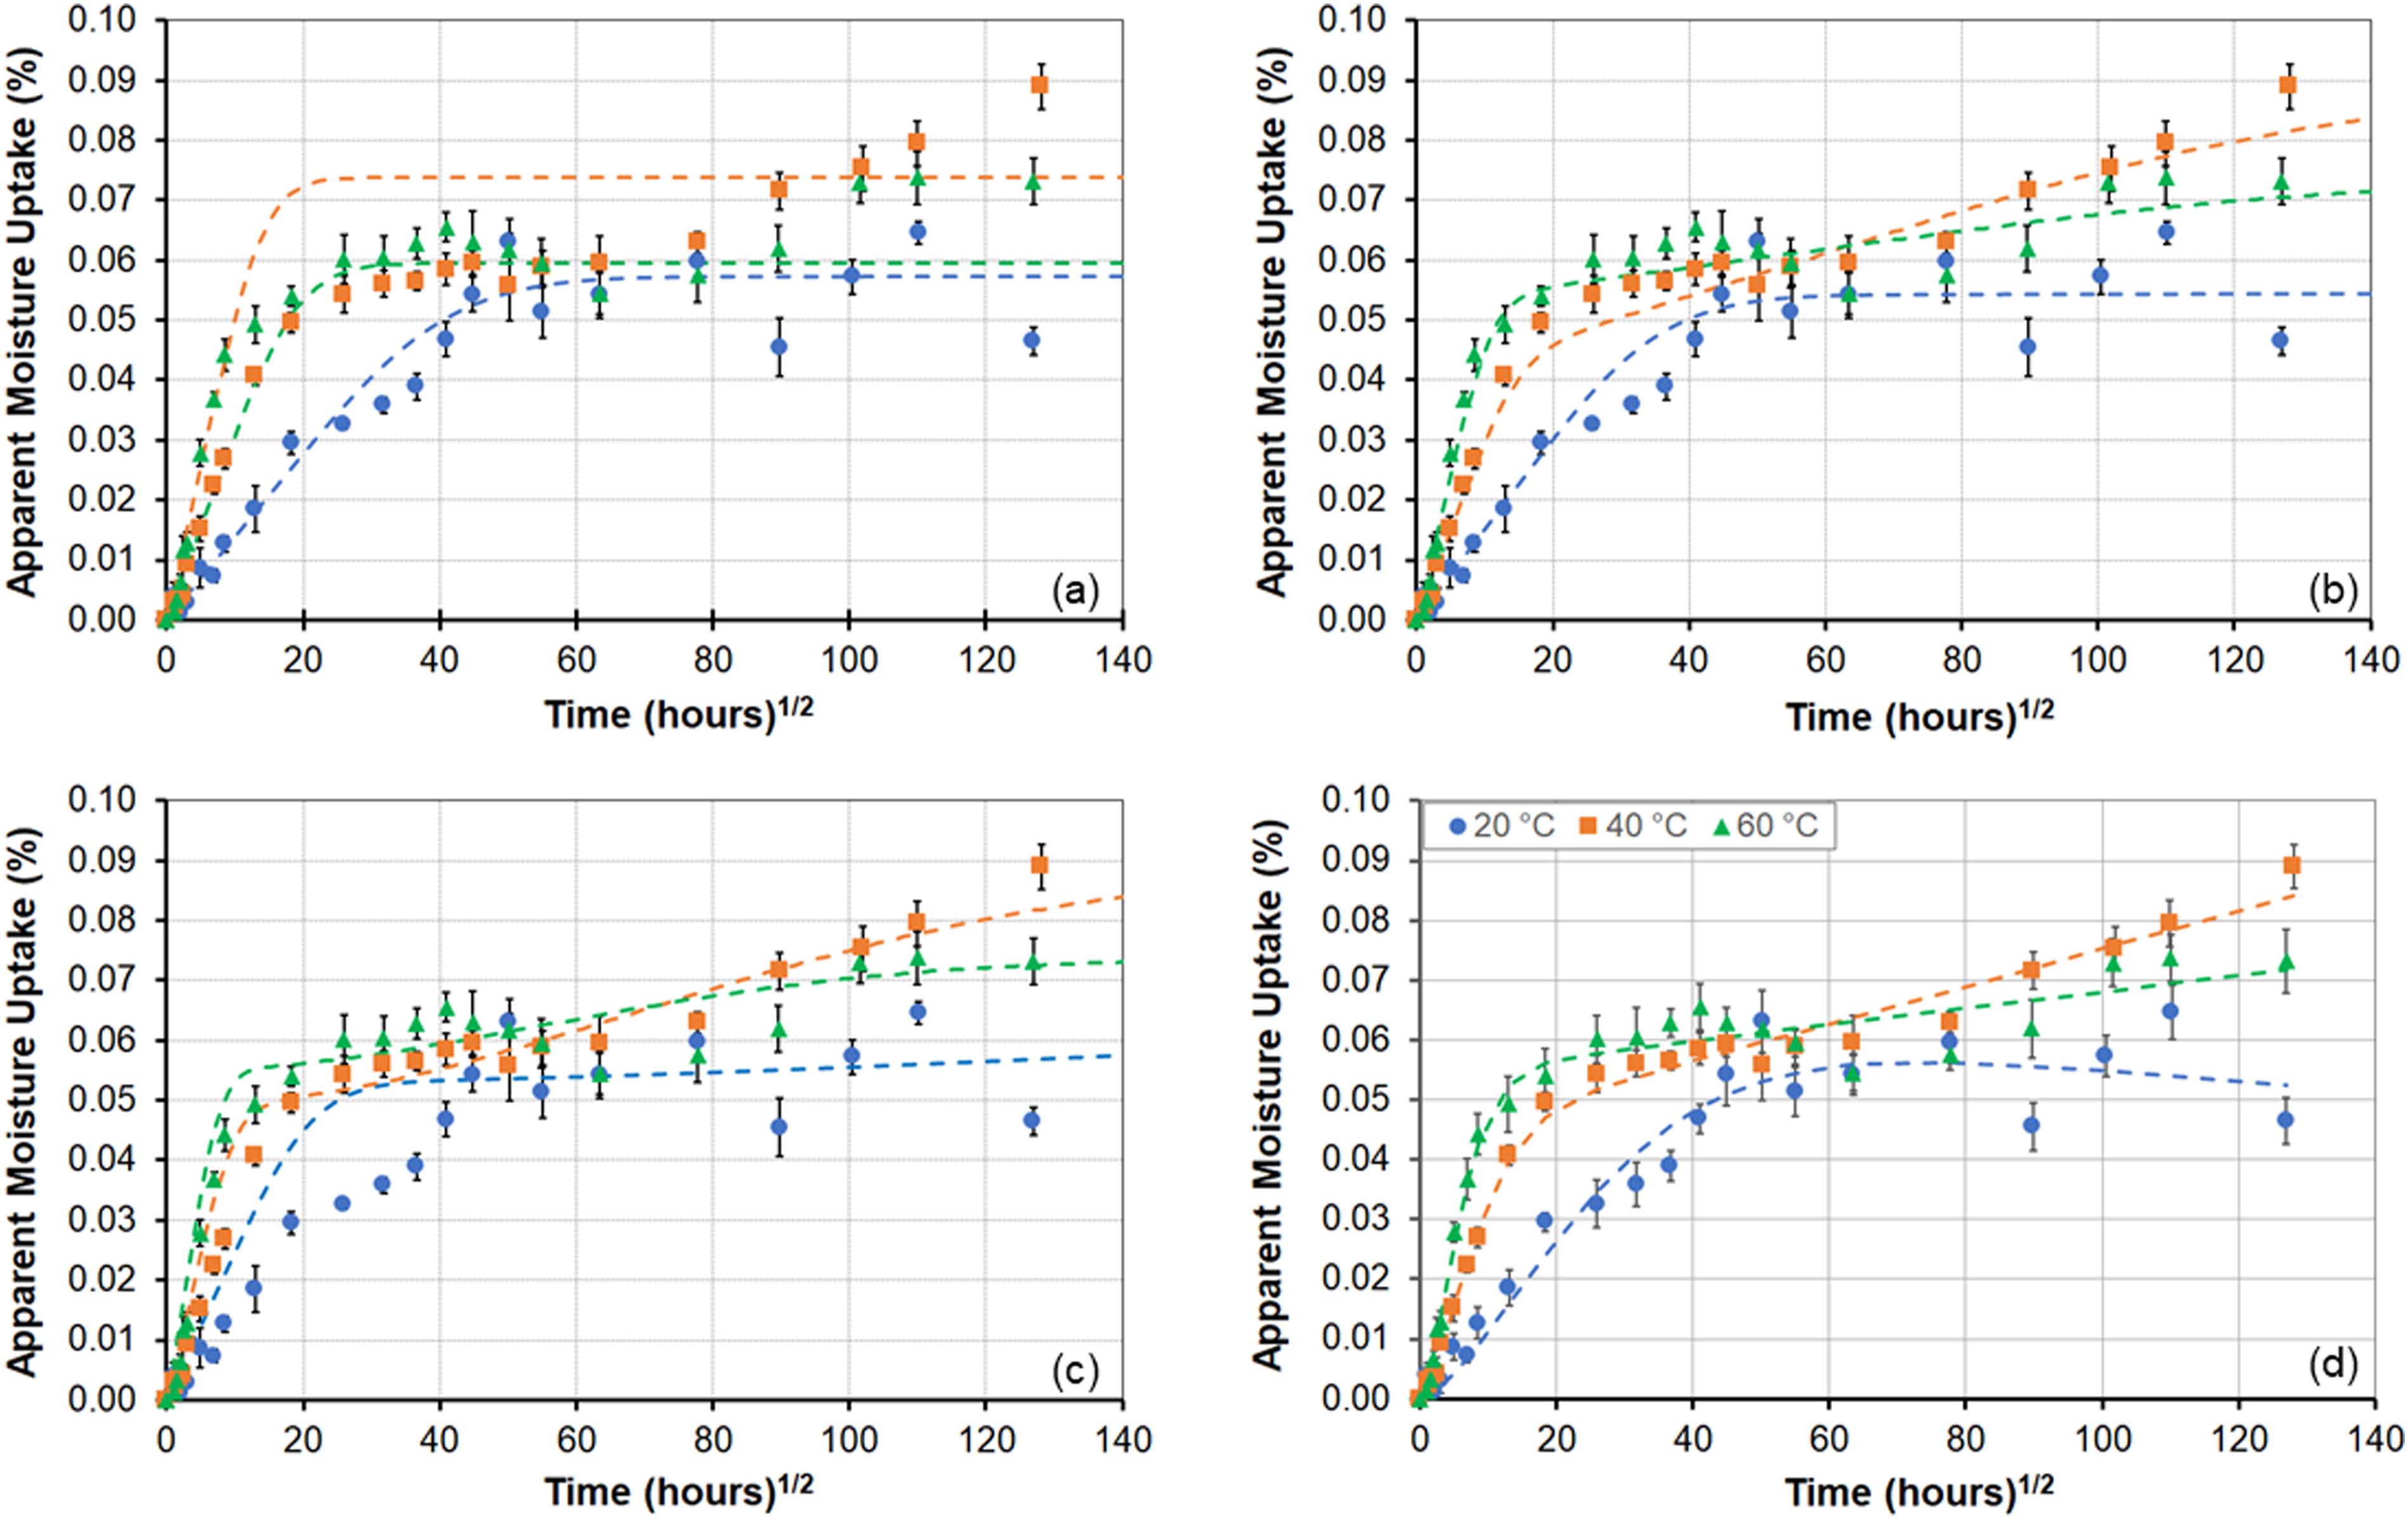
It is thus of interest to determine the activation energy that must be overcome for moisture uptake as represented by the first stage diffusion parameter for each of the models using an Arrhenius type relationship
61
Diffusion & uptake characteristics from exposure at 60°C and 75% RH.
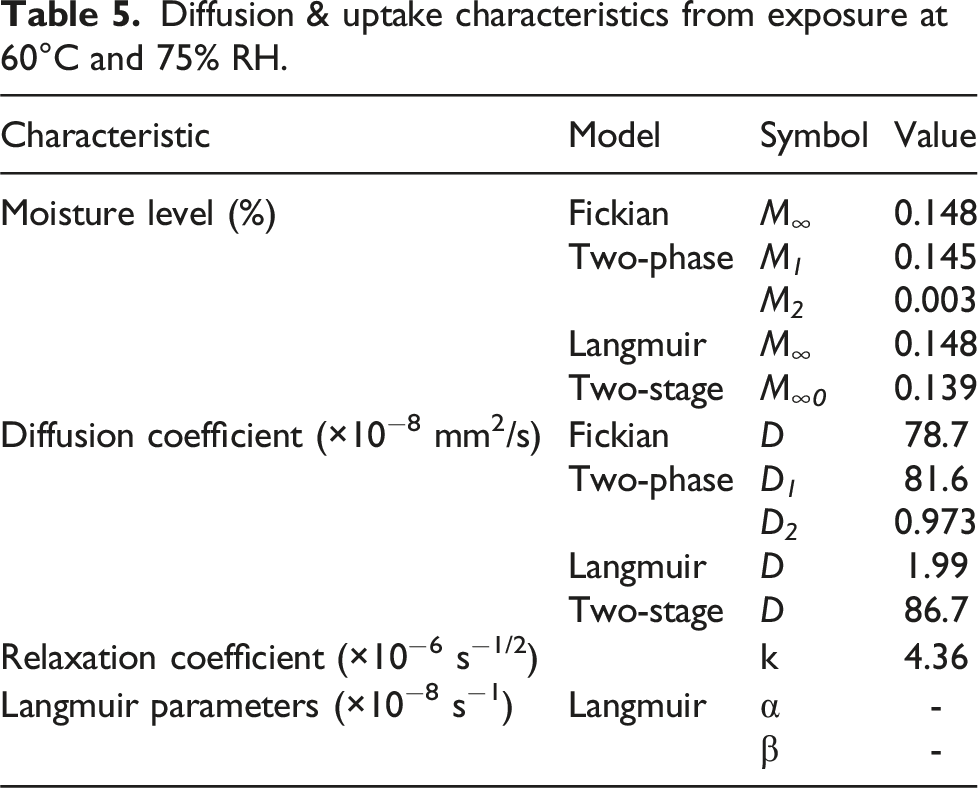
Values of the transition level, i.e., the point of change between mechanisms, are all fairly close between the models and as such very similar to the Fickian equilibrium value suggesting that the uptake response at 75% RH is largely diffusion dominated. This conclusion is further emphasized by the significant difference in the values of the two diffusion coefficients in the two-phase Fickian model where D 1 is equal to 81.6 × 10⁻⁸ mm2/s and D 2 is 0.973 × 10⁻⁸ mm2/s, i.e., the rate in the second phase is about 1.2% that in the first phase. Similarly, it can be noted that the value of the relaxation/deterioration coefficient, k, of 4.36 × 10⁻⁶ s−1/2 is only 10% of the value attained at the exposure condition of 50% relative humidity at the same temperature, 60°C, of 4.23 × 10⁻⁵ s−1/2.
Diffusion & uptake characteristics from exposure at 99% RH.
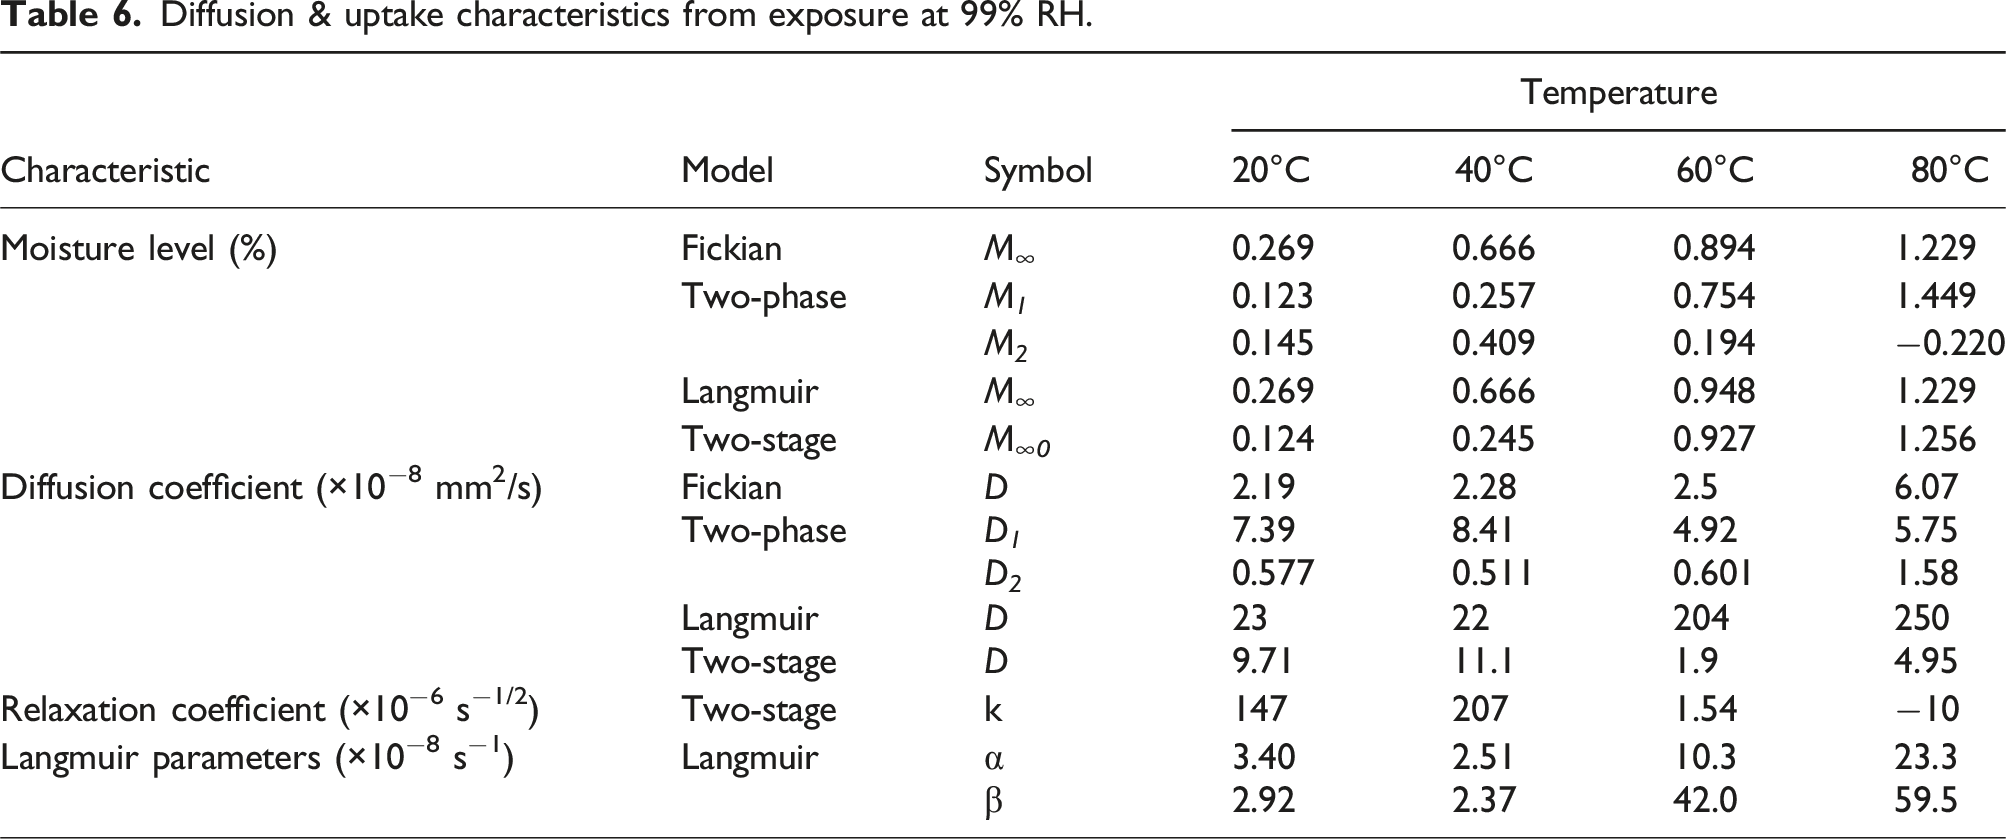
It is interesting to note that while the Fickian model shows an increase in value of diffusion coefficients with temperature of immersion the other three do not, suggesting a complex interplay with potential dominance of the non-diffusion type mechanisms such as relaxation, desorption of residual low molecular weight species, and leaching of degradation products over sorption of water. The relative dominance of these competing mechanisms is further reflected in the thermal trend of the parameter k, of the two-stage model, which decreases from positive to negative values with increasing temperature from 40°C to 80°C. In addition, the pseudo-equilibrium, i.e., first stage equilibrium, levels as differentiated from final equilibrium in the two-phase and two-stage models shows an increase with temperature indicating that the higher temperatures provide a greater capacity for moisture uptake. Together with trends for D and k this indicates that while capacity for uptake increases with temperature, the rates of change within the polymer structure are inhibited by increasing temperature. Given the variations with temperature the activation energy E a can strictly only be determined for the Ficken model at 13.08 kJ/mol which is significantly lower than that determined from exposure at 50% RH emphasizing the increasing effect as humidity is increased.
In light of the effects at the 99% RH level it is especially interesting to consider results from the immersion case since these two are often considered to be nearly equivalent. As seen in Figure 6, uptake increases at 20°C and 40°C but results in a sharp decrease after 48 weeks at 60°C. The drop in uptake is described well by the two-phase Fickian model and the two-stage, structural modification, model. However, neither is able to address the step in uptake prior to attainment of a peak. It should be noted that this anomaly is likely due to local mechanisms associated with greater diffusion after the step due to moisture catalyzed wicking and/or microcracking which provides greater access for free volume moisture uptake. Comparisons between the models for the case of immersion at 80°C are shown in Figure 7 separately since the loss in mass at 80°C is significant and cannot be shown at the same scale as the uptake loss at the other three temperatures. The trends clearly indicate the acceleration of deteriorative mechanisms at 60°C and 80°C under conditions of immersion as compared to that of exposure at 99% RH. Comparison of model predictions (dashed lines) with experimental data (solid symbols) for the immersion condition. (a) Fickian model, (b) Two-stage Fickian model, (c) Langmuir model, and (d) Two-stage, structural modification, model. Comparison of model predictions with experimental data (solid symbols) for immersion at 80°C.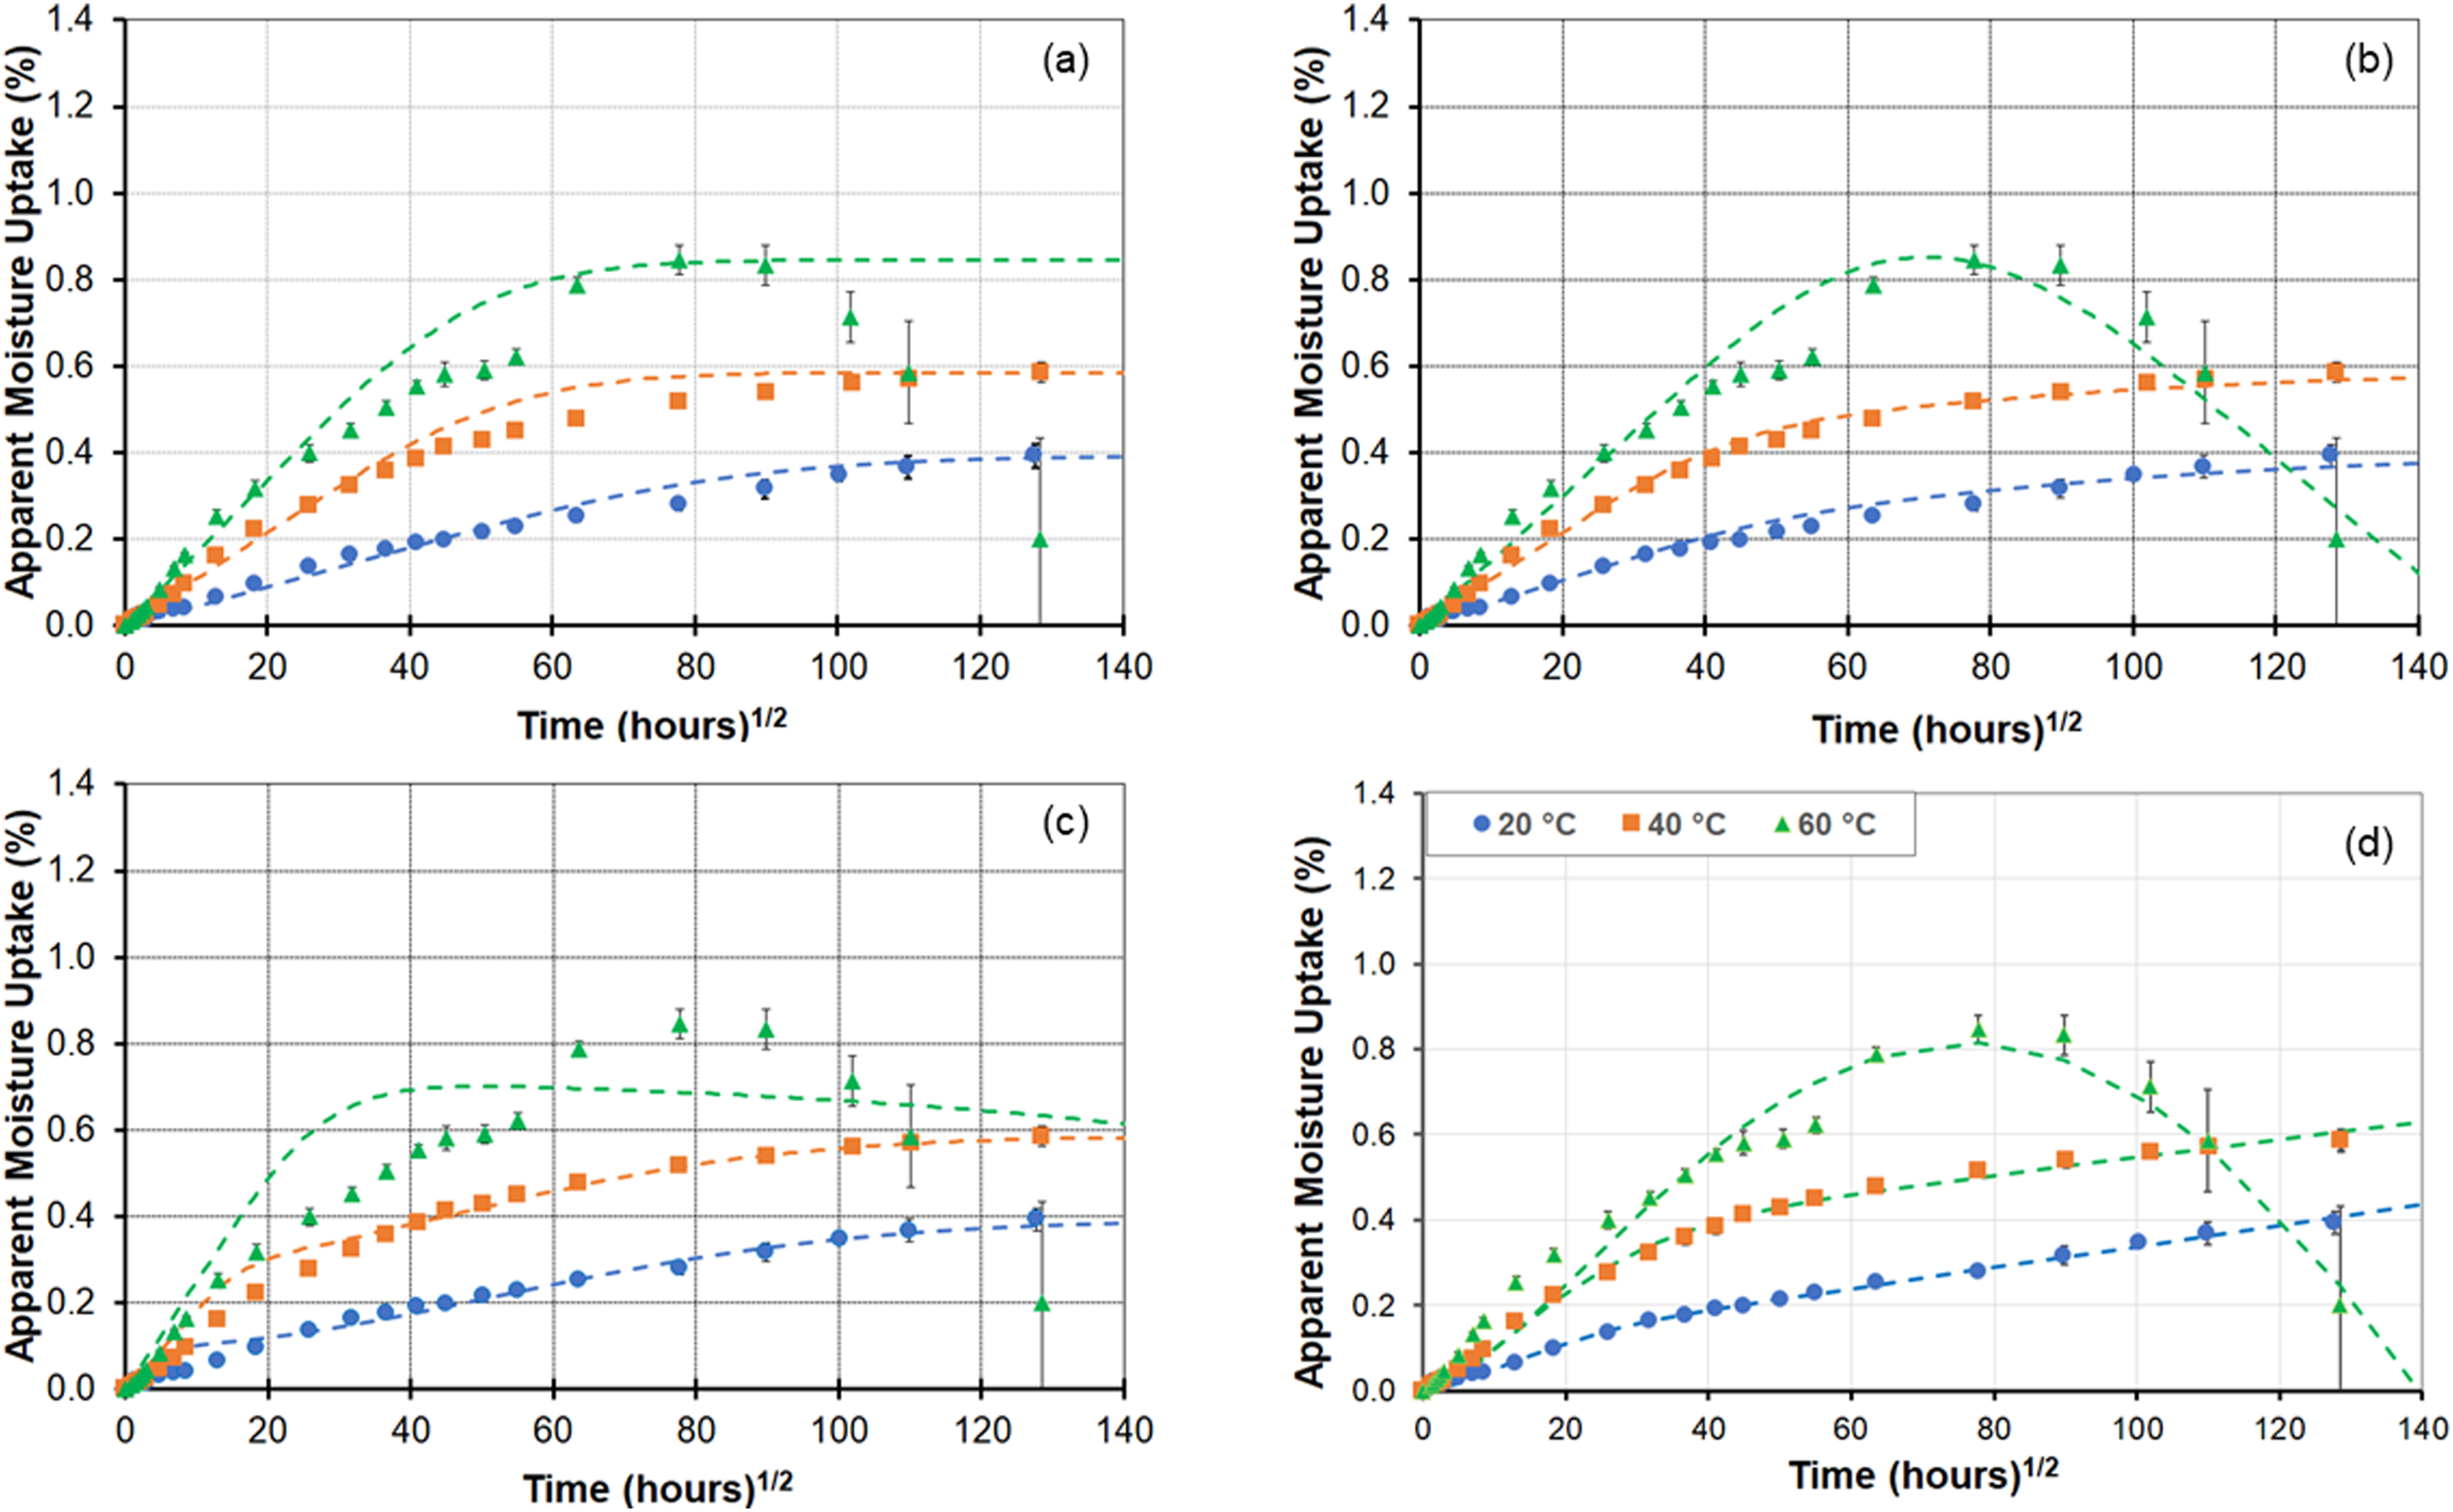
Diffusion & uptake characteristics from immersion in deionized water.
While the immersion condition is often used to assess durability of materials through the use of a range of temperatures to accelerate aging under the assumption of the principle of time-temperature superposition, in reality a large number of applications of pultruded components do not face immersion but rather are exposed to varying levels of humidity. It is thus of interest to compare characteristics over a range of humidity levels. As an example, experimental uptake response (represented by the solid symbols) and predictions using the two-stage, structural modification, model (represented by dashed lines) is shown in Figure 8 for humidity levels of 50% RH, 75% RH, and 99% RH and for immersion. As can be seen the apparent maximum uptake level increases with humidity level. The initial uptake levels (i.e. at the first stage pseudo-equilibrium level) for the cases of immersion and 99% RH are similar with immersion having a slightly higher level and rate prior to attainment of an apparent maximum after which there is a steep drop due to deterioration, whereas the specimens exposed to 99% RH continue to show increase in uptake till about 72 weeks after which there is a slight decline. Uptake profiles as a function of humidity level and immersion at 60°C. Solid symbols represent experimental data and dashed lines represent predictions using the two-stage structural modification model.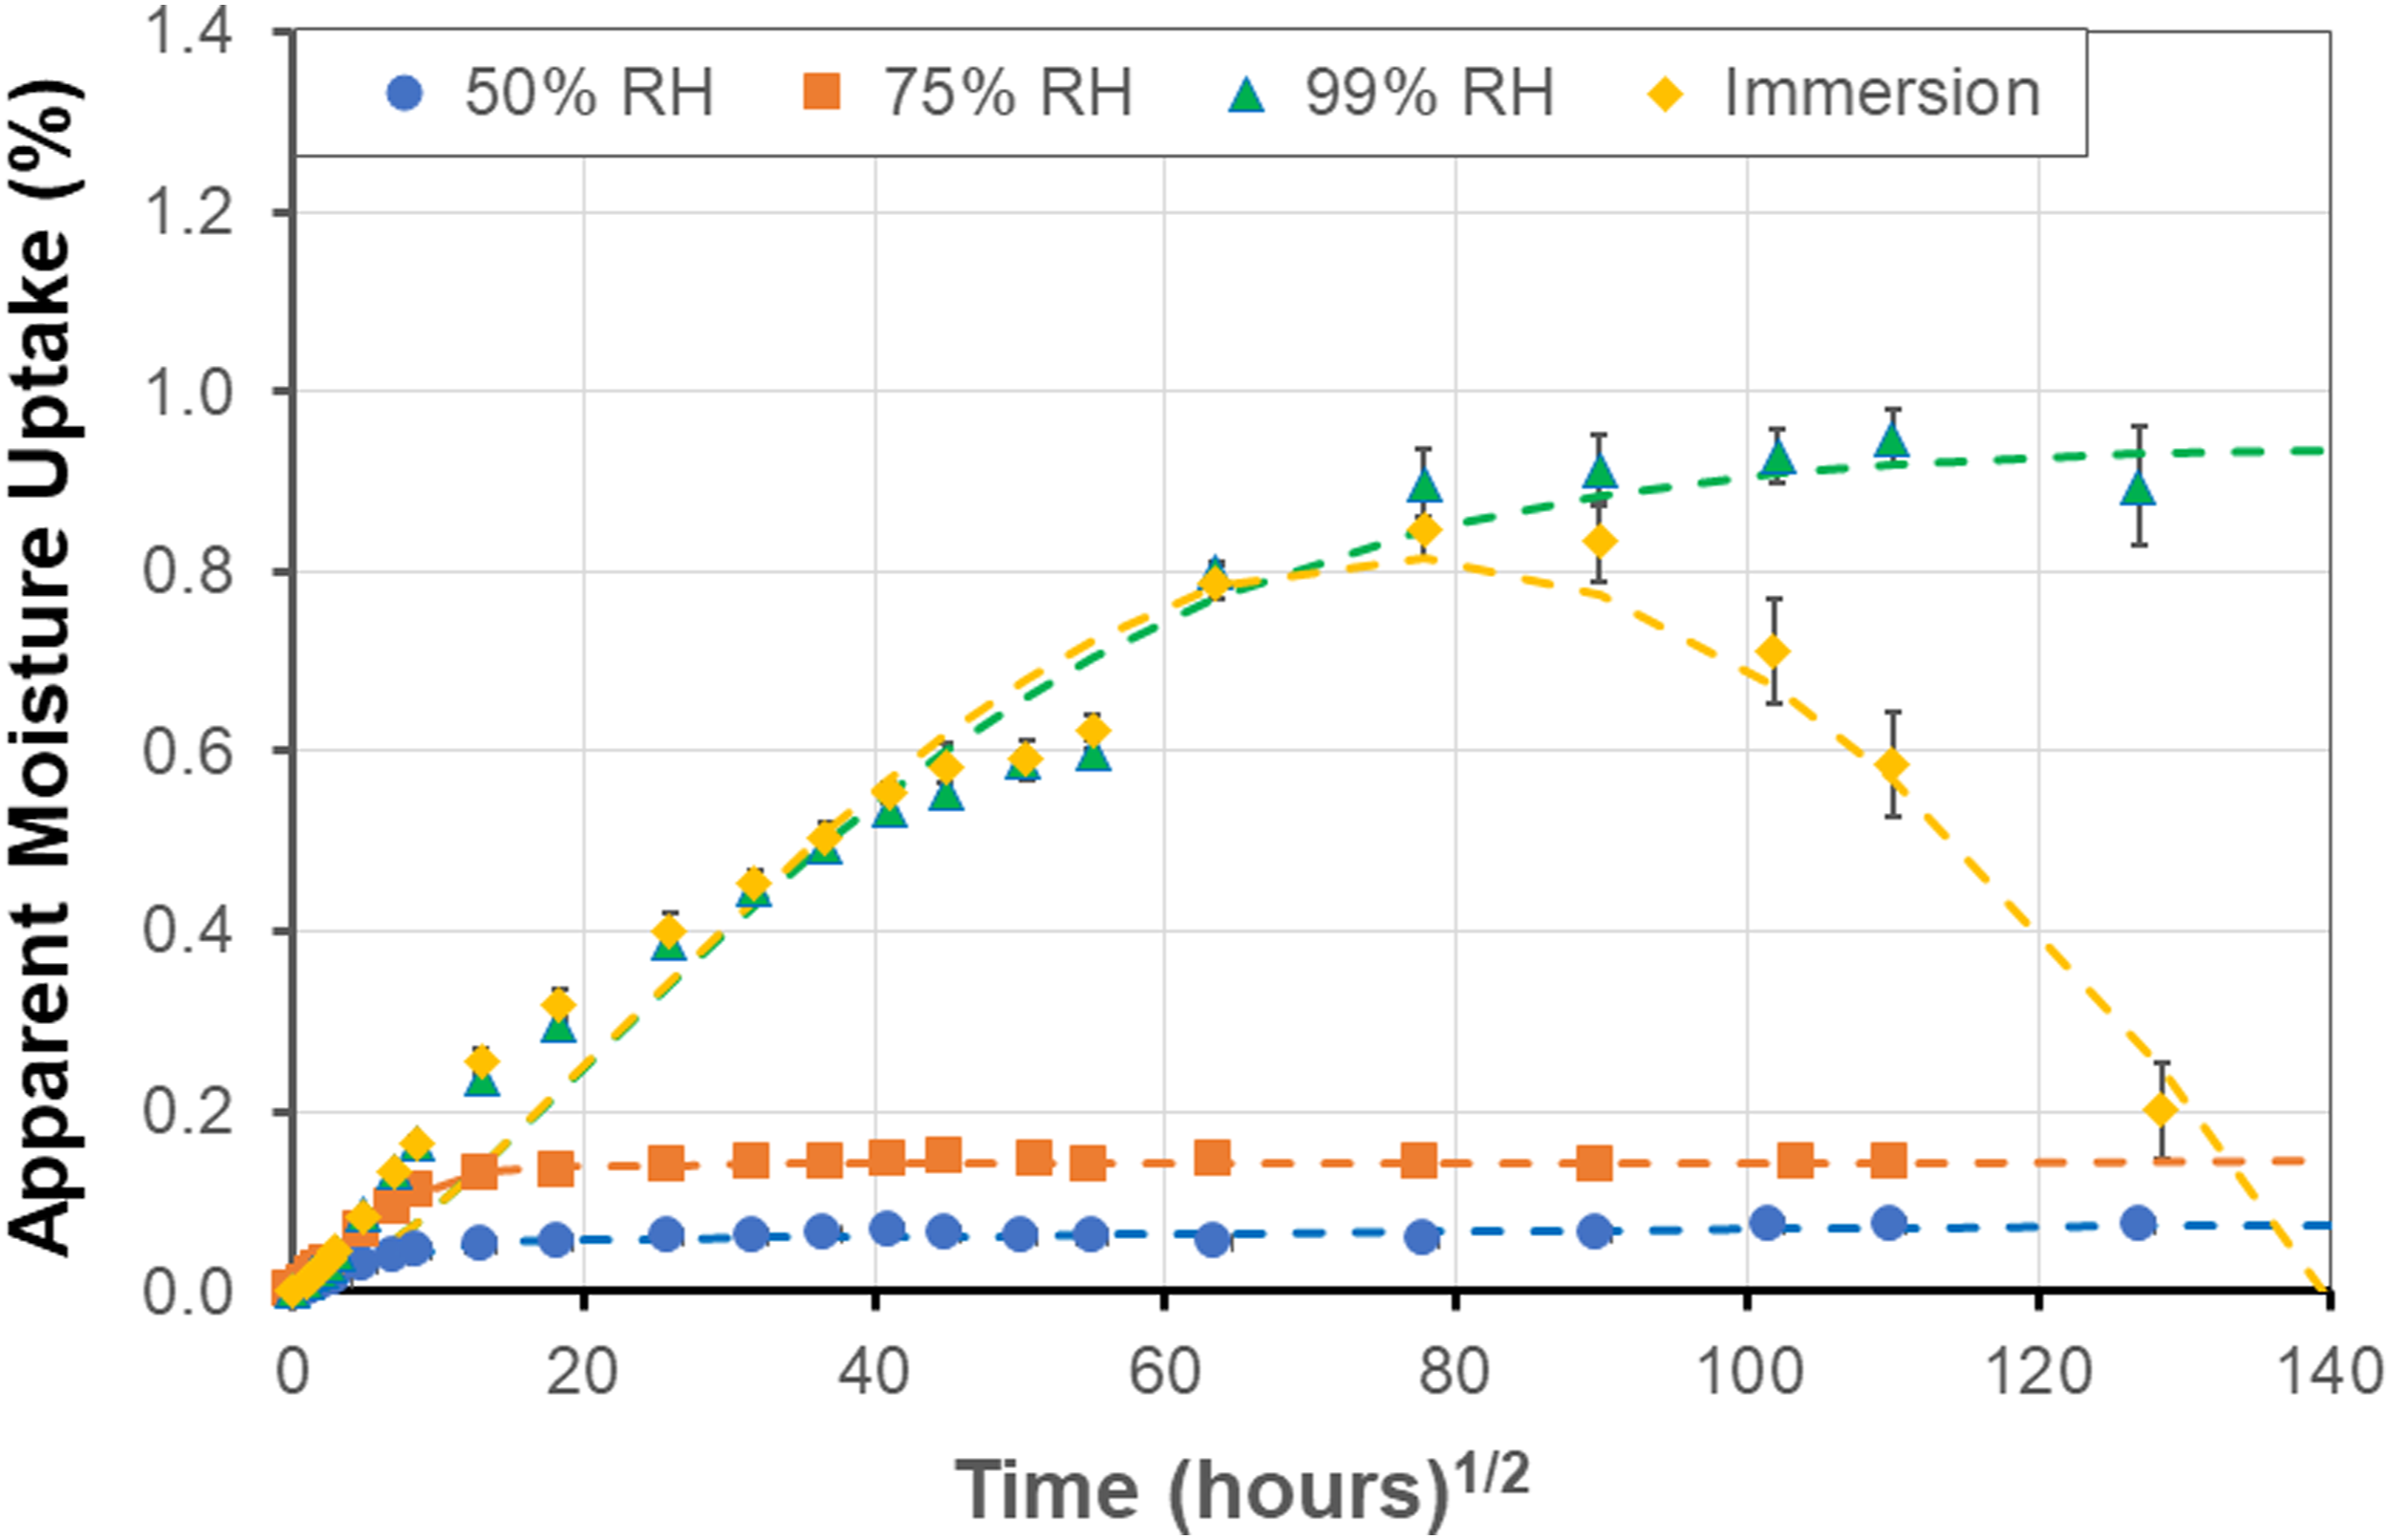
Initial uptake characteristics as a function of RH and immersion at 60°C.
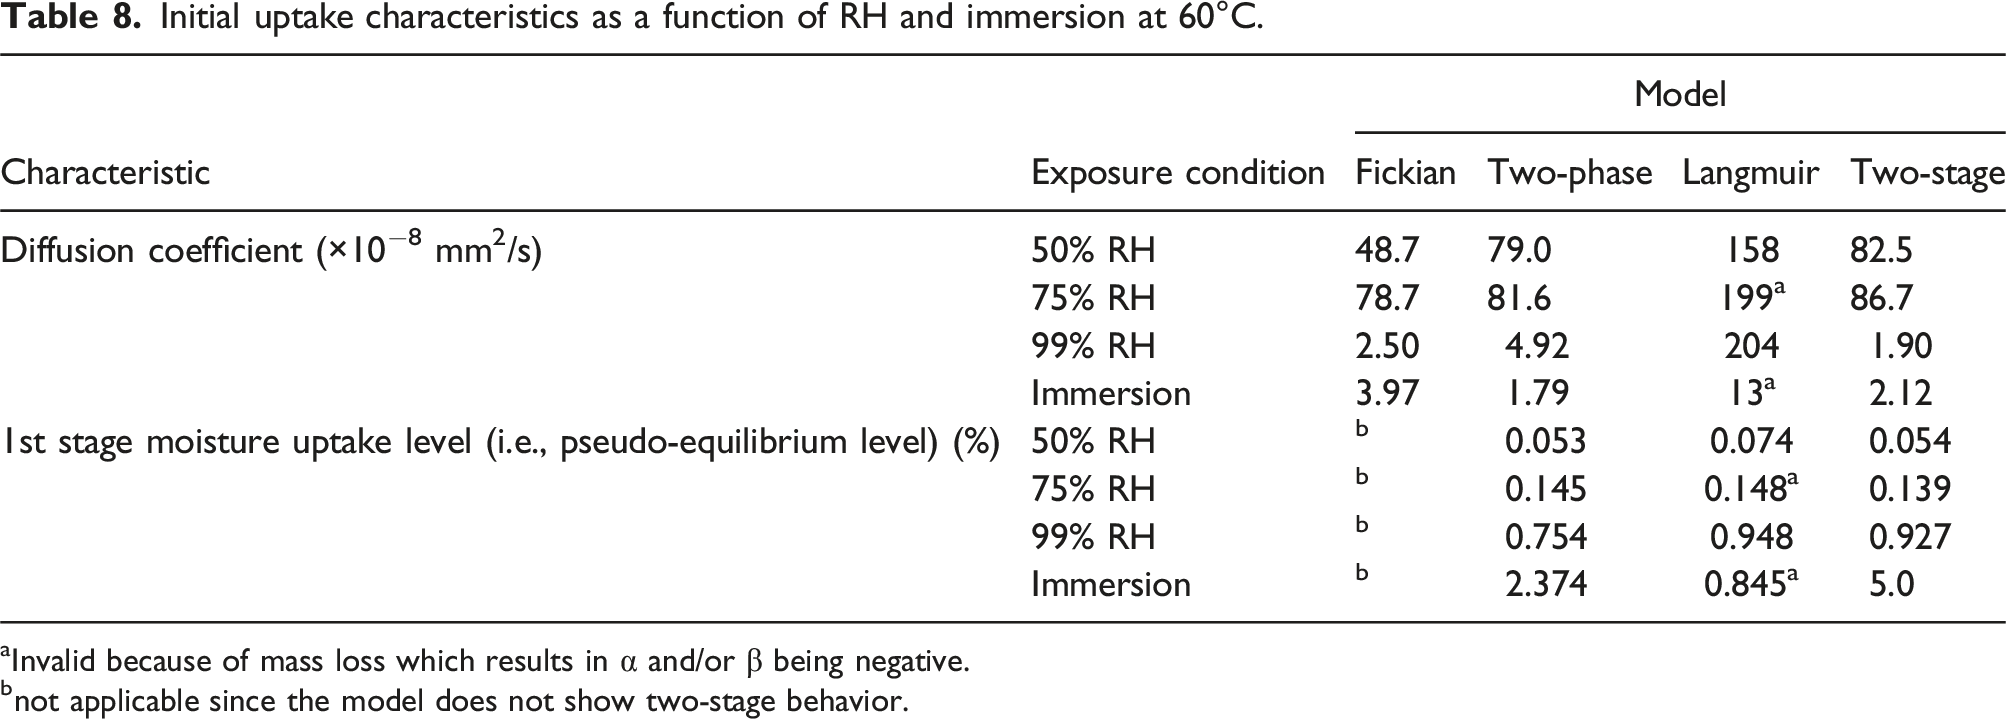
aInvalid because of mass loss which results in α and/or β being negative.
bnot applicable since the model does not show two-stage behavior.
As discussed earlier, the mass of specimens was measured both upon removal from the exposure environment after periods of exposure, and after reconditioning. The latter was done to enable an assessment of loss of materials which is seen through decreases in apparent moisture uptake levels, but which obscures the actual level of uptake that would have been attained had there been no such loss. This is done through equation (2) and provides an adjusted moisture content which can help in further understanding uptake response and trends. An example of the difference between the apparent and adjusted levels is shown in Figure 9 for the 99% RH exposure condition. In this case responses at both the 60°C and the 80°C levels indicate a higher adjusted uptake level. It should be noted that the decreases in apparent uptake significant enough (i.e., in magnitude and period over which the loss occurs) to result in a difference in model parameters and trends were only determined in the two cases of exposure to 99% RH and immersion at the higher temperature levels as listed in Table 8. As seen in Figure 9 deviation is primarily in the second-half of each uptake regime. At the 60°C temperature level the deviation initiates just prior to 24 weeks at a moisture content of 0.798% with the final moisture uptake being 1.007% for the adjusted case versus the 0.894% determined for apparent uptake. Similarly the adjusted levels deviate from the apparent at 12 weeks and a moisture content of 1.051% with the final levels being 1.464% for the adjusted versus 1.154% for the apparent with the difference of 0.31% attributed to mass loss due to leaching of lower molecular weight species and other constituents. Comparison of apparent (solid symbols) and adjusted (hollow symbols) moisture contents under conditions of 99% RH.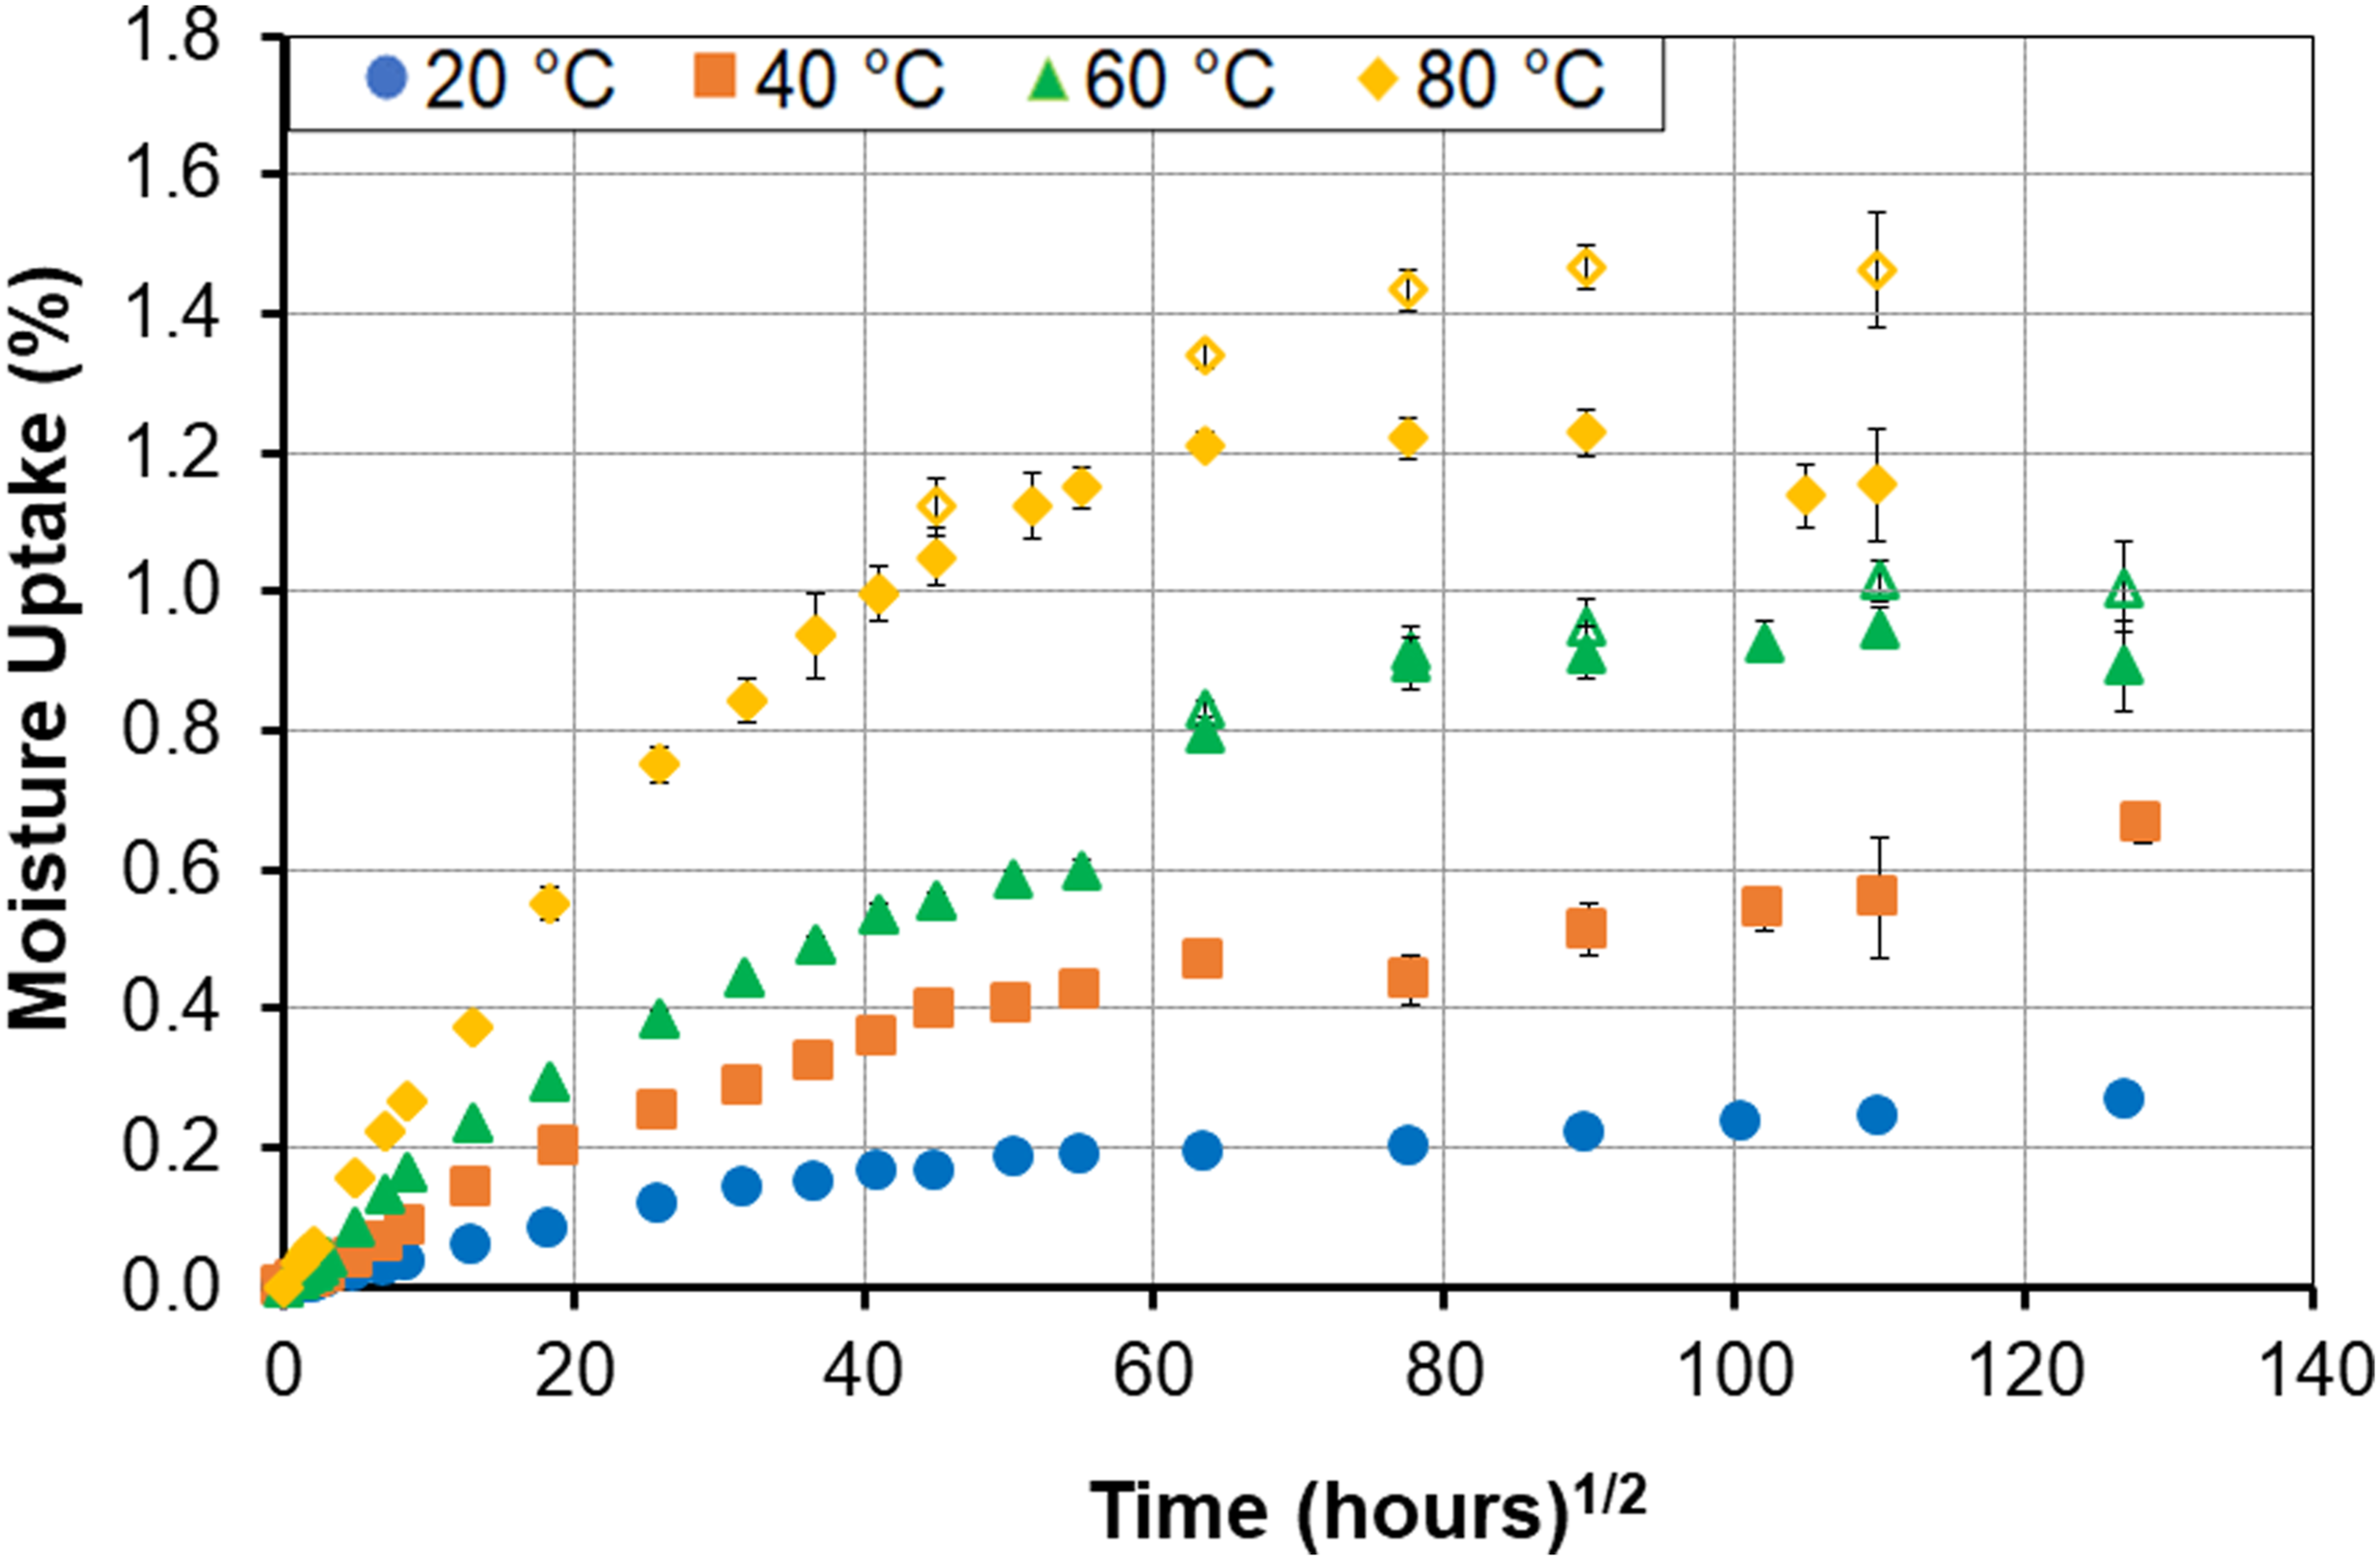
Since the uptake is adjusted for the level of mass lost due to leaching of LMWS and loss of constituents the parameters determined are not, as such, representative of the phenomenon observed and hence cannot be used to realistically model the response. However, they do provide an estimate of the level of loss and the effect of that loss on overall response. It is emphasized, that consideration of adjusted values inherently ignores competing degradation mechanisms other than possible early wicking, and hence is likely to result in erroneous predictions if used for purposes beyond the assessment of deterioration through the current models which do not explicitly account for mechanisms of loss except through the two-stage structural modification model which incorporates this through consideration of changes in k including negative values to represent dominance of deterioration in the second state regime.
Summary and conclusions
This study focused on the assessment of moisture uptake and kinetics of a pultruded GFRP composite exposed to a range of humidity levels and immersion over temperatures between 20°C and 80°C, as a means of providing a basic foundation for the further determination of long term durability. The moisture uptake regimes were noted to deviate substantially from the simplistic Fickian response generally assumed of an initial linear regime followed by attainment of an equilibrium level of uptake. Four different models were used to describe the response and the two-stage structural modification model which incorporates both an initial diffusion dominated regime and a subsequent slower relaxation/deterioration dominated regime was seen to most accurately describe the range of profiles obtained over all the exposure conditions considered in the investigation. The two-phase Fickian model was seen to be fairly accurate in predicting uptake profiles in cases of stepped and continuously increasing uptake response but was unable to address the larger levels of deterioration that led to significant decreases in uptake after attainment of an apparent peak. The Langmuir model was shown to be invalid in these cases through results of negative values of free end or bound water probability components α and/or β, which are a result of the curve fits rather than the actual phenomena. In general, moisture uptake rates and maximum levels were noted to increase with humidity level and with temperature. Increasing temperature was noted to not only speed up the rate of diffusion but also that of the relaxation of the polymer and/or deterioration of the composite. While immersion is often used in laboratory tests to represent the humidity in the field it is shown that the results of exposure to 99% RH and of immersion even at elevated temperature levels of the former are significantly different with parameters from immersion levels being lower, emphasizing the erroneous assumption of equivalence. While increases in temperature can be used as a means of accelerating response in time, it is noted that the use of the higher levels of temperature although still significantly below the unexposed glass transition level, do suggest changes in mechanisms within the bulk polymer and the composite as seen through shifts in the shape of the uptake profile and in kinetics of uptake as well as the resulting characteristics of diffusion coefficient, transition and maximum uptake levels, and parameters of the second stage, indicating a need for greater care in assuming the validity of time-temperature superposition over large ranges of temperature and/or humidity levels. The Fickian model, used extensively in previous investigations, is clearly deficient in modeling the full range of regimes seen in this investigation based on its inherent assumptions of an equilibrium threshold which is independent of temperature and of rates of sorption and desorption being identical. While these might have held for prepreg based composites they clearly do not characterize the response of the class of materials used herein. Overall, the two-stage model which incorporates separate, yet interacting, diffusion and relaxation dominated regimes is recommended as having greater applicability in accurately modeling the range of uptake regimes seen through exposure to a range of humidity levels and immersion in deionized water at different temperatures. While this paper provides insight into the phenomena and models it is emphasized that further work is needed in this area in the development of mechanistic models that can identify and describe the separate phenomena, of mass gain due to uptake and mass loss due to aspects such as leaching of lower molecular weight species, combining them to describe the true evolution of uptake and its effects.
Footnotes
Acknowledgments
The authors acknowledge the support of the California Department of Transportation for an earlier project that led to the collection of data used herein.
Declaration of conflicting interests
The author(s) declared no potential conflicts of interest with respect to the research, authorship, and/or publication of this article.
Funding
The author(s) received no financial support for the research, authorship, and/or publication of this article.
Ethical statement
Data availability statement
All data are available upon reasonable request from the corresponding author.