
Abstract
This research endeavors to utilize electrophoretic deposition (EPD) to coat copper (Cu) pipes with graphene oxide (GO) nanosheets, aiming to bolster their resistance against corrosion. To achieve this, a stable aqueous colloidal suspension of GO was meticulously prepared via liquid exfoliation in deionized water. This suspension served as an electrolytic solution for EPD. The EPD process involved the meticulous application of varied operational parameters such as deposition time, applied voltage, and GO nanosheet concentration to facilitate anodic deposition on the copper pipe’s surface. To gauge the efficacy of the GO coating, evaluations were conducted to assess adhesive force and stabilization using specialized coating adhesion scratch testing equipment. Further analysis of the resulting film on the Cu pipe was executed employing X-ray diffraction (XRD), scanning electron microscopy (SEM), Raman spectroscopy, and Fourier transform infrared spectroscopy (FT-IR). These methods provided detailed insights into the characteristics and properties of the GO material post-deposition. The study yielded noteworthy outcomes, revealing the achievement of a uniform, unbroken, and consistent coating film on the Cu pipe. This was accomplished by employing specific parameters as 60 s of deposition time, a GO concentration of 0.5 mg/mL, and a voltage of 20 V. Impressively, when subjected to a corrosive solution containing 3.5% sodium chloride, the corrosion protection exhibited a remarkable twofold enhancement compared to untreated copper tubing, boasting an efficiency (η) of 90.48%. These findings suggest that the Cu pipe, coated with GO using the EPD technique, holds significant promise for utilization in demanding industrial settings susceptible to corrosion challenges.
Keywords
Introduction
In metallic industries, corrosion prevention plays a significant role in protecting the lifespan of the metal and preventing contamination. Copper metals are widely used for different applications such as condensers for a water desalination plant. The frequent contact of the copper to the water makes it susceptible to corrosion due to its chemical reaction to nature limiting its application. Corrosion of metals occurs when there is an interaction of the copper with non-inert surroundings such as seawater and moist oxygen from the atmosphere 1 The presence of chlorine ions in the seawater attacks copper very harshly, thereby causing corrosion. It is, therefore, necessary to develop efficient and long-lasting corrosion-resistant coating to prevent the metal from corroding. 2 The advent of science and technology in the nanoscale made it possible to design environmentally friendly, robust oxidation and coatings that are resistant to corrosion to prolong the lifespan of the material, even under hard environmental conditions. In recent years, researchers have focused their attention on barrier films where liquid phase deposition is used; ceramic coatings 3 coatings from epoxy (polyaniline, etc.), and film coatings such as polymers 4 among others. Among all these, graphene oxide coatings are mostly investigated due to their electrical, optical, mechanical, and some other physical properties. Graphene oxide has a strong potential to be used as a transparent film with high conductivity in composite material and some other applications at the industrial levels.
Graphene oxide (GO) is a 2D material of single thick honeycomb atomic crystal lattice of allotropes of carbon composed of tightly packed sp2 hybridized carbon atoms with the ability to remain exfoliated as a single layer of atoms in water. It has high mobility of electron (250,000 cm2/V) due to its free electrons, effects of the quantum hall at ambient temperature and ballistic transport. 5 Various researchers have used solution based to deposit 2D graphene oxide on conductive material, including thermal decomposition, chemical deposition, 6 layer by layer coating, 7 filtration by membrane, 8 physical vapor deposition, 9 spin coating. 10 However, most of these methods use high temperature instead of low temperature. The low-temperature deposition has a lot of advantages over high-temperature techniques. 11 Application of high temperature techniques such as Langmuir-Blogget, inkjet printing makes it difficult in assembling graphene layers due to the complexity of its instrumentation and high temperature. 10 Electrophoretic (EPD) deposition is an example of a colloidal deposition route that uses low pressure and room temperature process. Recently, EPD has attracted much attention as a method of fabricating a nano-sized, thin composite film on a conducting material with a wide range of applications, simple and low cost. 11
The report shows that researchers have used graphene oxide layers to prevent metallic materials from corroding. Raman et al. reported Chemical Vapor Deposition (CVD) technique for coating graphene on copper which showed impedance of the copper to degradation of the electrochemical increasing with the reduction in the cathodic and anodic current densities of the coated copper. 12 Kang et al coated reduced graphene sheets on iron and copper foils to improve upon their resistance corrosion by oxidation. This was prepared by the transfer of the reduced graphene oxide multilayer from silicon oxide (SiO2) substrate. 13 Kirkland et al studied the properties of GO using CVD technique as a barrier for corrosion on copper and nickel. 14 Successful results have been achieved in depositing graphene oxide sheet on a metallic substrate employing the EPD technique. Raza et al employed EPD method for depositing GO on copper sheets using different parameters. The corrosion rate results after the experiment were outstandingly lower than the bare copper. 15 Singh et al prepared GO polymer composite coating by EPD method. Results showed that the inhibition efficiency increased much more than the bare copper. 16
Most of the failures in corrosion resulting from coating through the usage of the different technique have shown to be as a result of defects in the coating. 17 The coating adhesion on the surface of the metal plays a key role in the efficacy of the coating in prevention corrosion. 18 EPD deposition has proved beyond doubt in producing a uniform and homogenous with fantastic adhesion coating. This breaks the barrier of the defects associated with coating. This is a simple technique where charged particles of colloids dispersed in a liquid medium, move with the influence of electric current to the cathode through the application of a DC voltage. 19 The technique is versatile, rapid, and easy in controlling thickness, rate of deposition, coatings uniformity, and concentration of suspension. EPD involves the use of organic fluids as a suspending media due to their excellent stability chemically, high density, and it’s less conductive. 20 However, the use of inorganic fluid or aqueous medium is effective and advantageous as lower voltage, less cost, and risk of explosion is minimal. 21 These advantages attracted researchers’ interest in using water as the solvent for graphene oxide in preparing the colloidal suspension for corrosion protection. 15 This study is aimed at developing graphene oxide (GO) coating on a copper pipe from transparent colloidal suspension in the aqueous medium by electrophoretic (EPD). The objective is to (i) to characterize the as-synthesize GO and the coatings using various characterization techniques; (ii) to examine the efficacy of the coatings preventing the copper pipe from undergoing oxidation and corrosion using electrochemical impedance (EIS) in NaCl by direct testing of the copper pipe’s coatings for corrosion protection.
Experimental work
Materials and chemicals
A copper pipe with a purity of 99%, procured from the market, served as the foundational substrate for the EPD coatings in this study. To prepare its surface, a meticulous process was followed. Initially, the copper sheet underwent polishing using 400 and 200 grit carbide paper of silicon to eliminate any contaminants and activate surface atoms, facilitating improved adhesion. Subsequently, it underwent ultrasonication with acetone for 20 min, followed by rinsing with distilled water, and ultimately air-dried at room temperature. For the synthesis of graphene oxide (GO), graphite powder with an average particle size of 10 µm was utilized as the precursor material. The chemicals employed in the process including analytical-grade sulfuric acid (H2SO4), hydrogen peroxide (H2O2), potassium permanganate (KMnO4), nitric acid (HNO3), hydrochloric acid (HCl), and acetone were procured from Sigma Aldrich, ensuring high-quality standards throughout the experimental procedure.
Graphene oxide synthesis
Modified Hummers method 22 was used in synthesizing graphene oxide. In brief, 10 g of graphene powder was added to 160 mL of HNO3 and 200 mL H2SO4 under continuous stirring and ultrasonication using (Cole-Parmer, USA). 60 g of KMnO4 was added dropwise (1 g/min) to the mixture under ice bath and vigorous stirring for 4 days to improve the powder’s degree of oxidation. The resulting mixture was transferred carefully into a two-necked round bottomed flask containing 1 L of distilled ice. 20 mL of H2O2 (30%) was slowly added dropwise maintaining the temperature at 60°C till the color of the mixture changed from brown to yellow gradually, indicating the climax of the reaction. 100 mL HCl was used to wash the solution and stirred for 1°h for three consecutive days. The residual ions were further washed with distilled water. Furthermore, the centrifuge was used to separate the supernatant till a neutral pH was attained, dried at 60°C for 12 h, thus GO flakes obtained.
Preparation of graphene oxide suspension
As reported by, 23 260 mg of the synthesized graphene oxide was dispersed in 260 mL distilled water and sonicated for a period of 2 h. The suspension after 2 h was left to settle for about 24 h. The settled graphene oxide was decanted from the stable colloidal suspension. The graphene oxide sediment was dried and measured and the concentration of the stable colloidal suspension was determined by arithmetic calculation (0.6 mg/mL) indicating GO’s maximum solubility in water. 24 The liquid suspension’s concentration was modified utilizing distilled water to reach a concentration of 0.5 mg/mL.
Sample preparation for electrophoretic deposition (EPD) of GO on Cu pipe
The suspension of graphene with 0.5 mg/mL concentration was attained by dissolving graphene nanosheets (30 mg) with 1∼3 μm diameter, 1∼5 nm thickness, and 99.9% purity mixed in 60 mL ethanol and isopropanol solution. The obtained solution was sonicated for 1 h to completely disperse it for EPD. Prior to EPD, copper pipe with 3/9 in its outer diameter from a local market in Alexandria, Egypt was cut 7 cm long utilized as anode was polished mechanically using a grinding paper made from silicon carbide (SiC) with (grit size range of 2000) to remove the layer of oxide from the copper pipe. Surface smoothness increases rate of adhesion and subsequently coating.
25
Then the pipe was sonicated for 20 min in acetone to eliminate organic contaminant and finally rinsed in distilled water. A stainless-steel pipe was used to surround the anode and cathode aligned with Teflon ring at a fixed distance of 10 mm as seen in Figure 1d. The technique of EPD was in various voltages (3-10 V) and deposition time (15-90 s) applied utilizing a DC power source (Model: TB160V22A1080 W, Matsasuda, Japan). (a) Chemical oxidation of graphite (G), (b) GO liquid exfoliation and ultrasonication, (c) stable aqueous suspension of GO, (d) Schematic diagram of the EPD technique, and (e) Cu pipe coated with GO by EPD.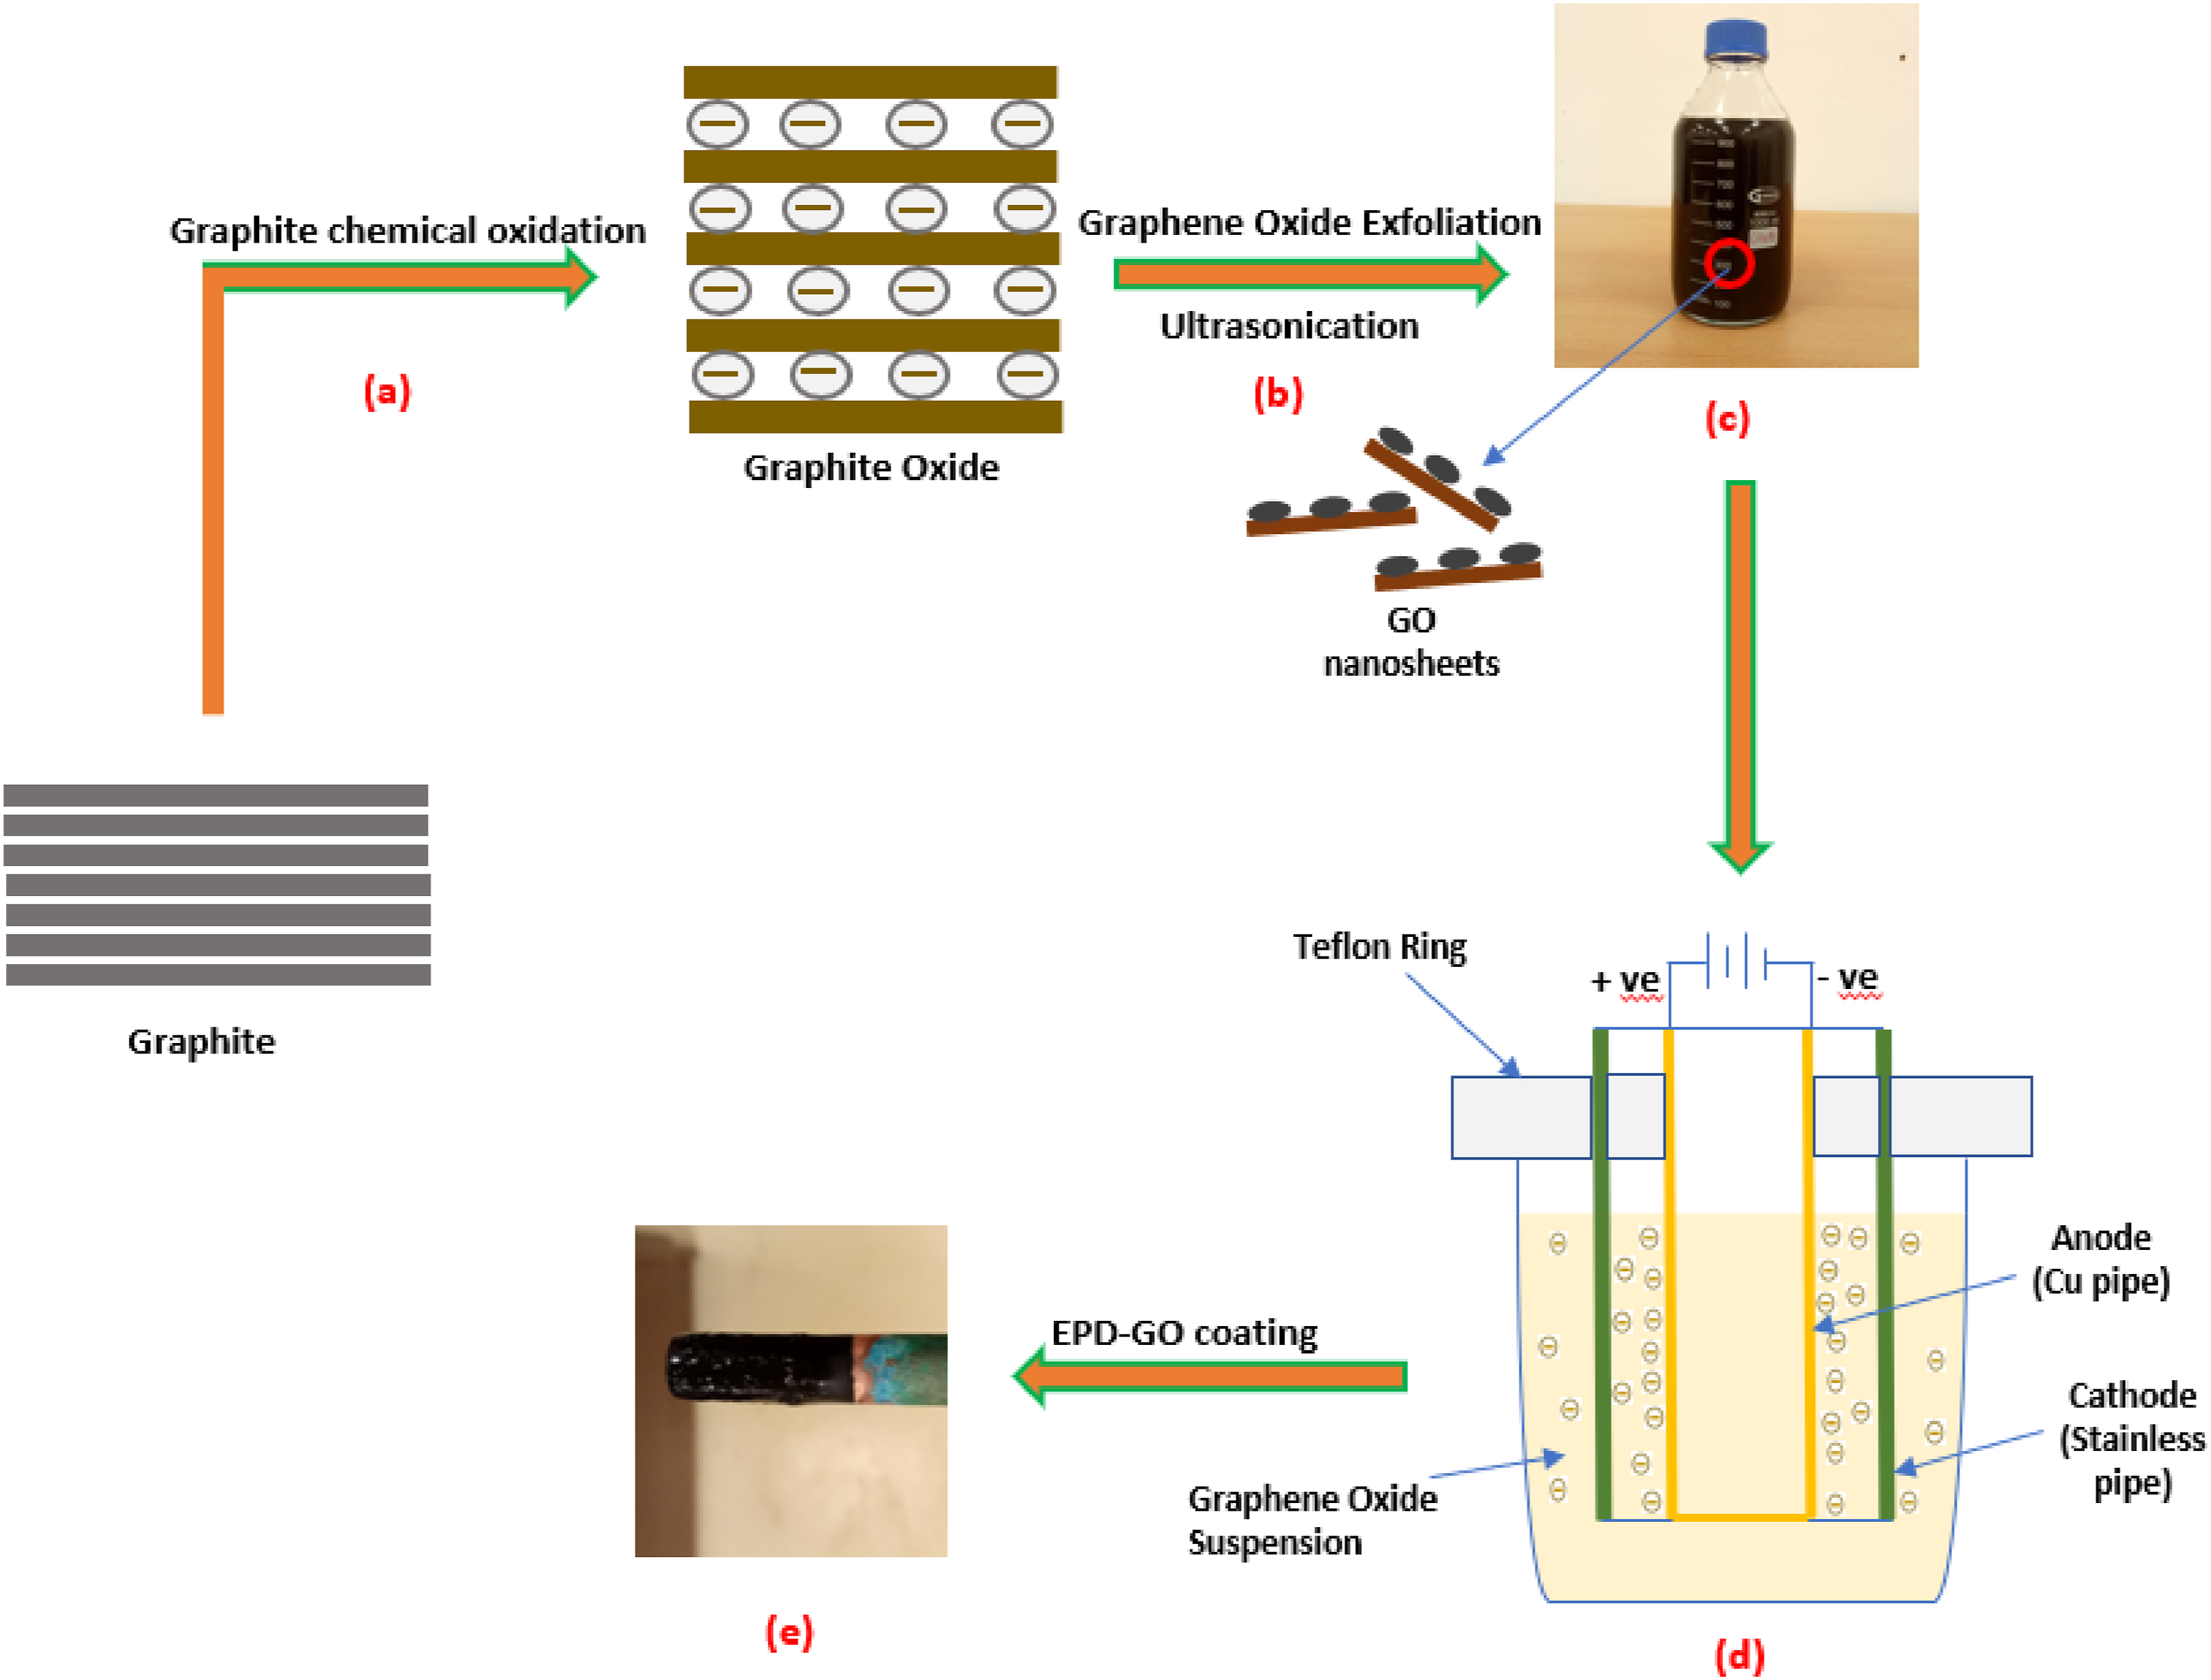
Characterization
Scanning electron microscopy (SEM) images of G, GO and the various copper coatings were taken using JOEL-JSM 6010LV. X-ray diffraction (XRD) pattern was captured with (Shimadzu XRD-6100) loaded with Cu Kα of radiation for λ=1.54
To evaluate the corrosion behavior, the open circuit potential (OCP) was continuously monitored until reaching a stable value. Following the OCP recordings, polarization (Tafel) scans were conducted at a scan rate of 1 mV/s, ranging from −0.5 V to +0.5 V. Additionally, electrochemical impedance spectroscopy (EIS) was carried out at the OCP, encompassing a spectrum of frequencies from 100,000 to 0.010 Hz with a voltage amplitude of 0.01 V. From the polarization curves, the corrosion current density (
Results and discussion
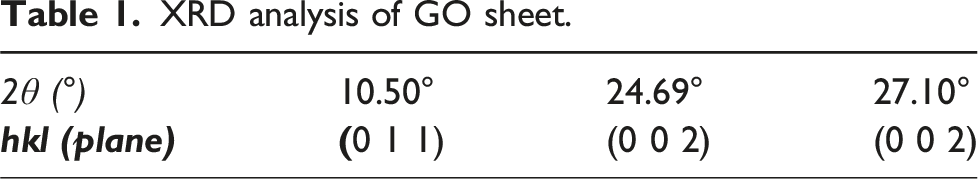
The pattern of XRD of the graphite, graphite oxide, and graphene coated layers are shown in Figure 2. The pattern of the graphite indicated a sharp and strong peak at 26.50°, which correspond to (002) calculated utilizing Braggs equation (1) planes of graphite (pristine) indicating a highly layer of organized structure of graphite where XRD diagrams for (a) graphite, (b) graphite oxide, and (c) EPD-GO coated cu pipe. XRD analysis of GO sheet.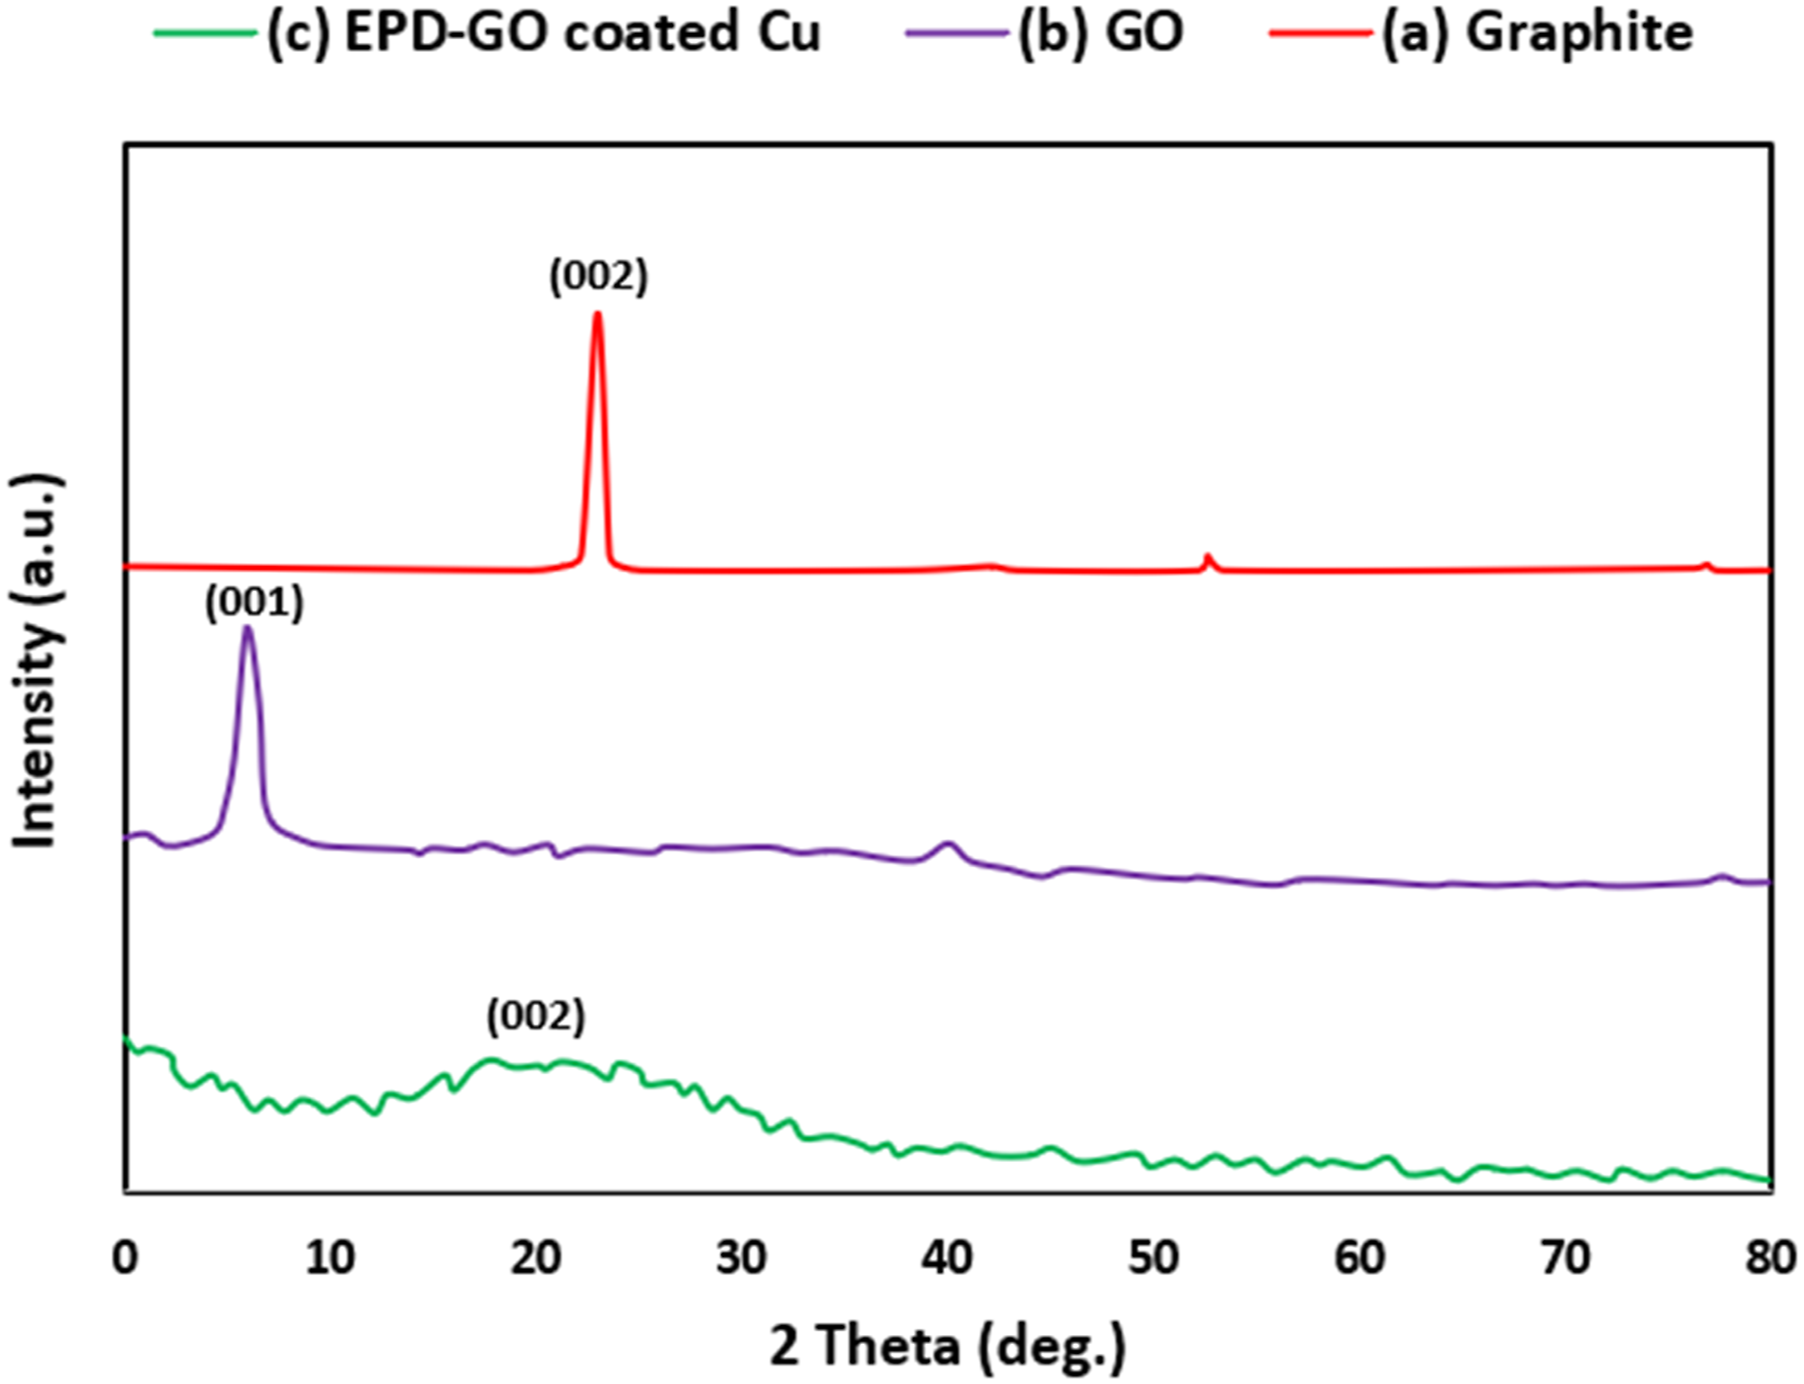

The spectra of FT-IR of as-synthesized GO powder (Figure 3) indicates a broad and strong peak at 3406 cm−1 which corresponds to the C-OH group and an intercalated water molecules into the graphene oxide. The hydrogen bonds between carboxyl and hydroxyl groups may be the consequence of the effect of broadening which ranges from 3500 to 2000 cm−1, typically the observed peak at 2890 cm−1, (CH2-group). Additionally, the functionalities of C-O bonds at 1045 cm−1 (RCO-group), 1628 cm−1 (COOH-group) and 1400 cm−1 (-COO-group) clearly are visible. The spectrum also demonstrates a peak at 1729 cm−1 (-C = O group), upon which oxidation of the graphite has been raised.
29
The various functional groups are given in Table 2. Spectra of Raman for (a) Pure GO, (b) EPD-GO coated copper pipe. IR frequencies of GO sheet.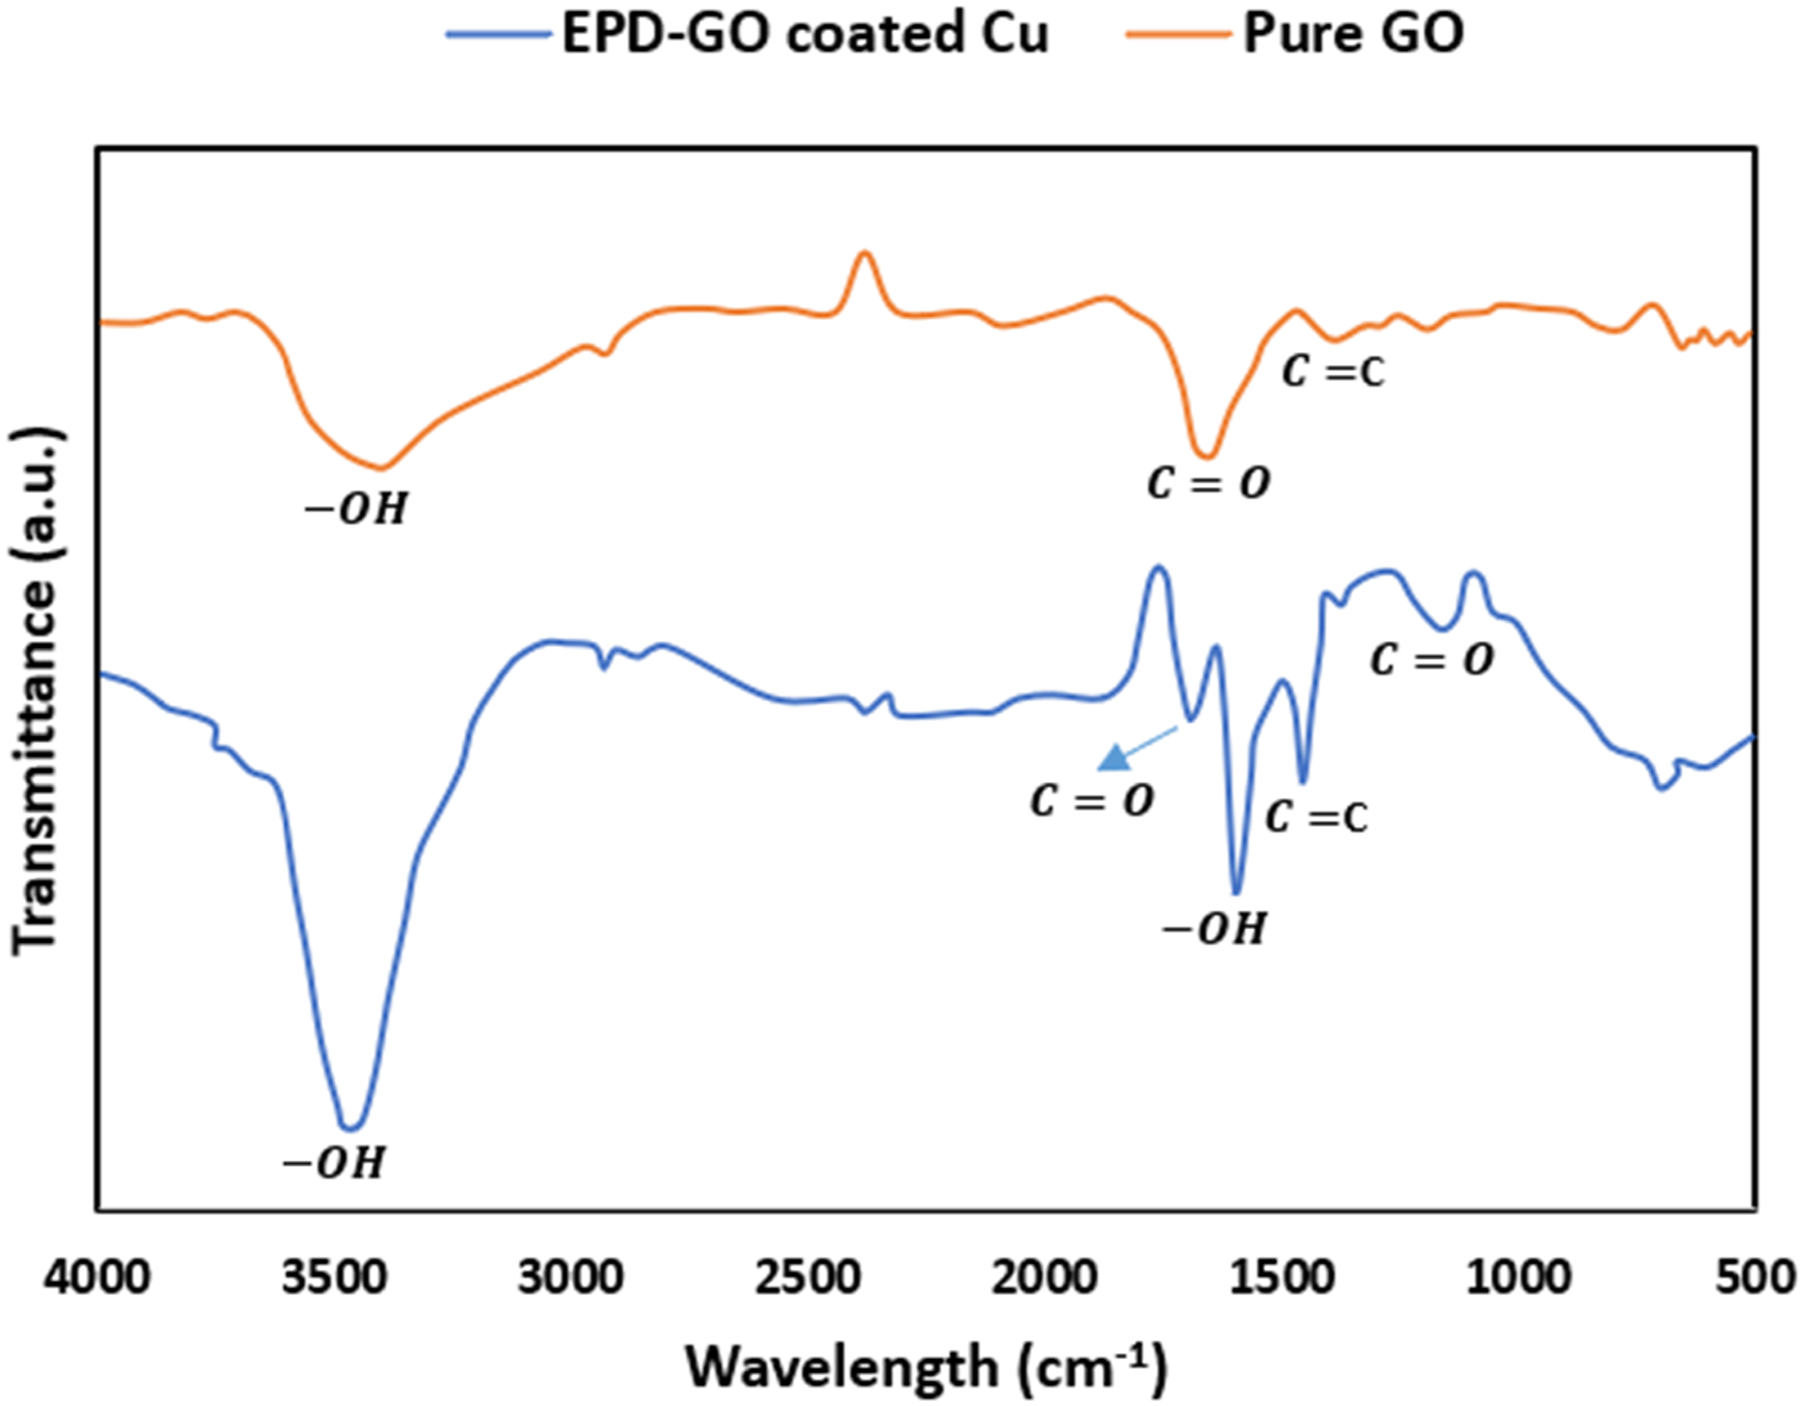
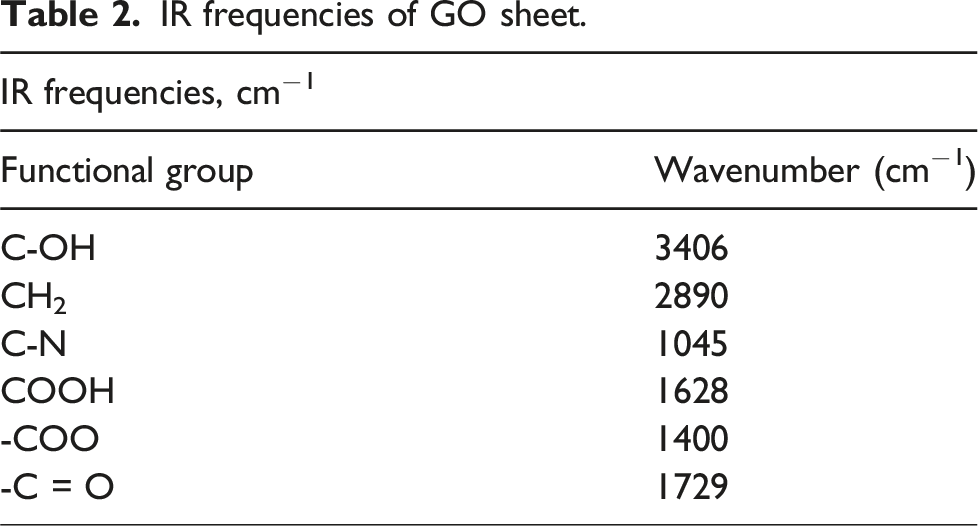
Figure 3 illustrates the Raman spectra of both graphene oxide (GO) and the GO-coated copper pipe. Each spectrum exhibited two prominent characteristic peaks: the D band around 1350 cm-1 and the G band approximately at 1583 cm-1. The D band corresponds to the phonon breathing mode at the κ-point of A1g symmetry, while the G band primarily signifies the E2g phonons of C Sp2 atoms.30,31 The presence of various defects, edges, and groups in graphene leads to disorder, contributing to the intensity of the D peak. Higher degrees of disorder typically result in a stronger D peak. Additionally, the F peak plays a significant role in indicating the level of graphene’s reduction. Interestingly, the absence of the band 2D suggests a certain degree of graphitization missing from these spectra.
The ratio of peak intensities between F and E bands (ID/IG) inversely correlates with the size of the graphene sp2 zones, often serving as a characterization parameter for graphene’s defect level. The calculation from the spectra revealed an increase in the IF/IE ratio, ranging from 0.96 to 1.08, for both GO and the GO-coated copper pipe. This suggests the presence of localized sp3 defects within the carbon sp2 network resulting from GO reduction. However, despite these observations, the findings indicate that the EPD-GO process might not be solely responsible and could potentially be accompanied by an electrochemical reduction process.
The image of TEM was utilized to assess the structural features and the morphology of the GO produced. Generically, Figure 4 demonstrates that the GO produced has a morphology of nanosheet which agglomerate forming multilayer aggregates. The image clarifies vividly that graphene oxide had a quintessential structure (2D) of grooved morphology. Dark spots indicate GO’s multilayer, whiles layers of lower density results in the exfoliated nanostructure highlighted via the areas of transparency. Moreover, the image also shows the transparency number of sheets higher than the dark spots showing most layers of GO been well exfoliated. TEM image of graphene oxide (GO).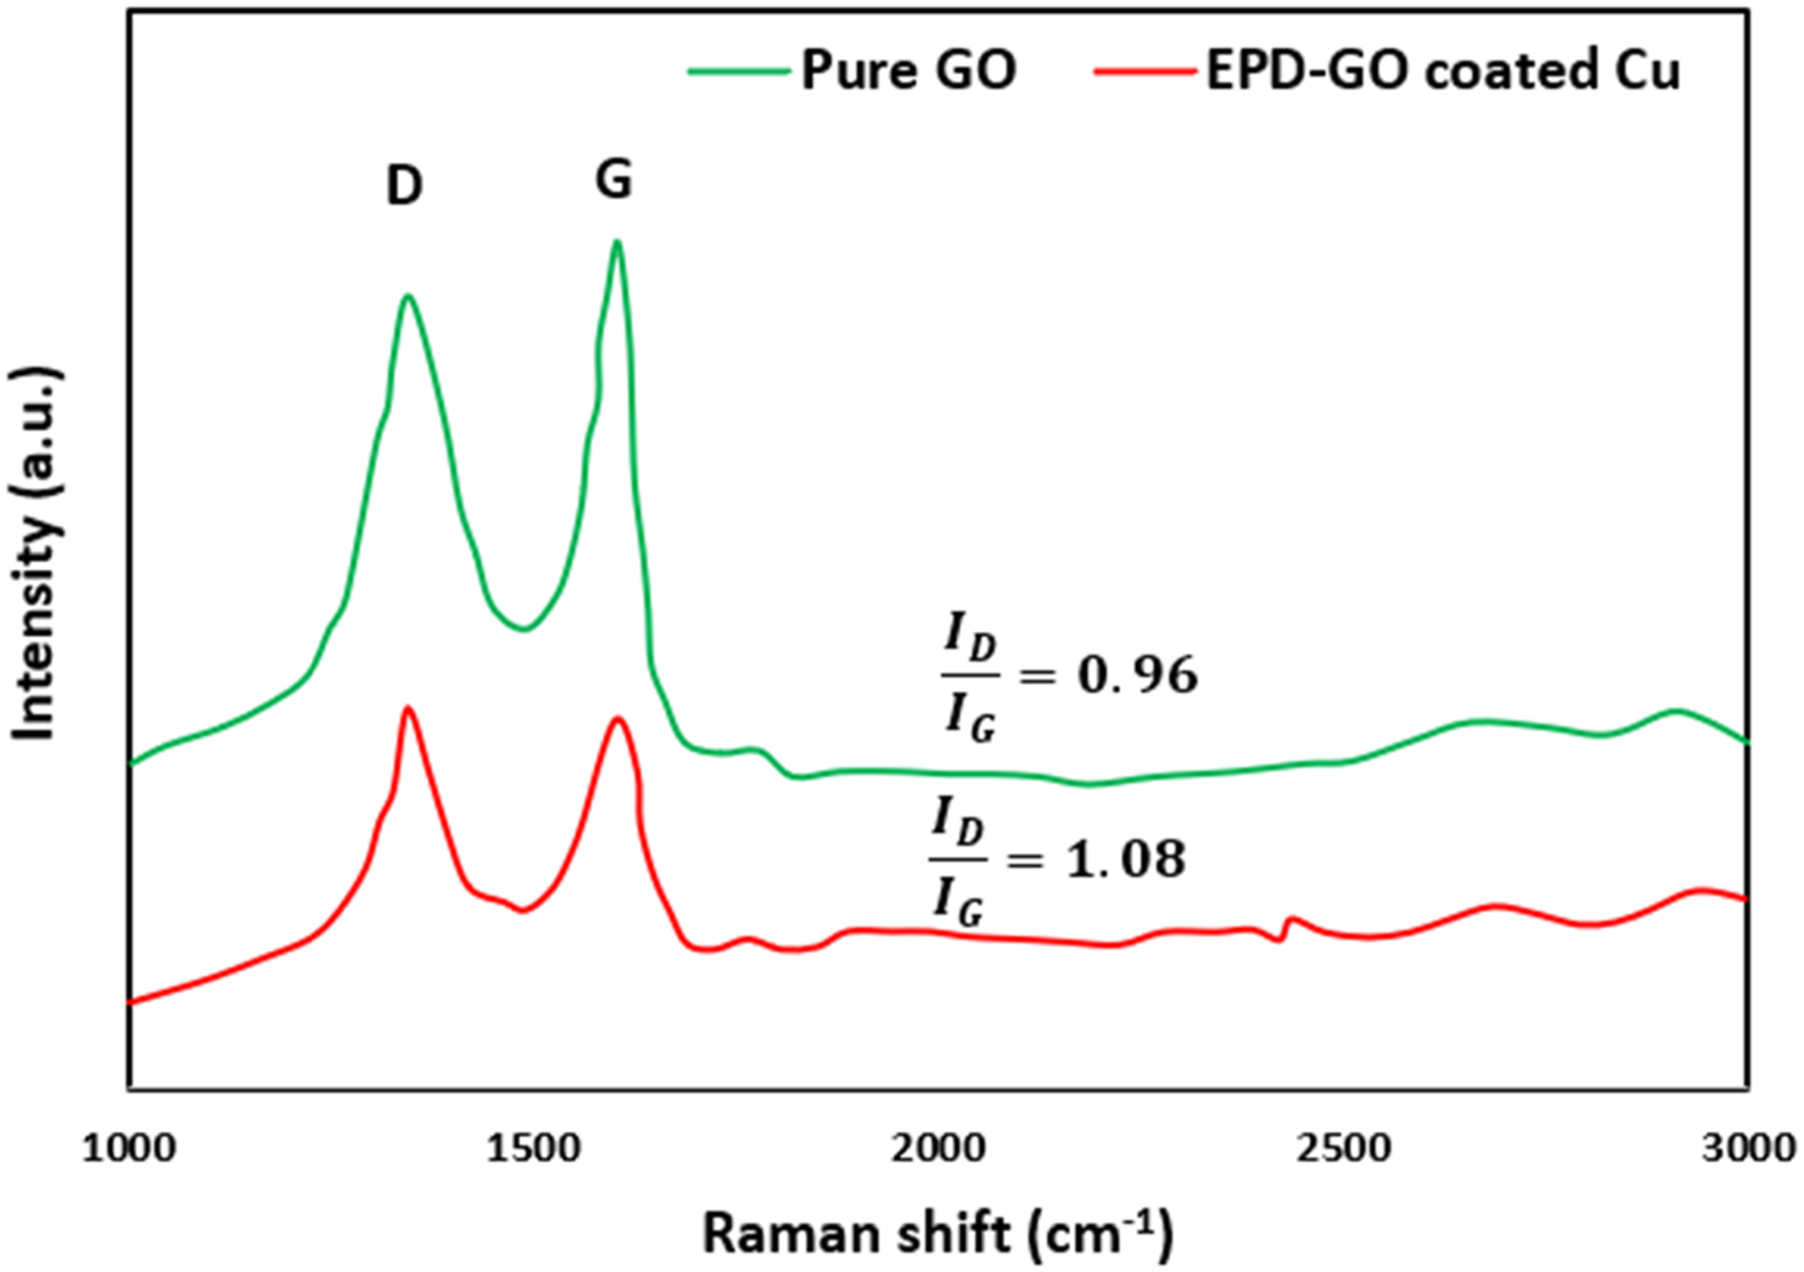
The spectra of UV of the EPD-GO Cu pipe’s deposition processes are shown in Figure 5. The GO suspension utilized as an electrolyte for the EPD process, the peak at 234 nm in the UV spectrum of the GO corresponds to π-π* transition of the sp2 C = C bonds.
32
After the EPD process, the peak of the absorption redshifted to 340 nm after GO reduction to graphene. This increased the π-conjugation restoring conjugation network.
33
As the π-conjugation increases, it requires less energy for such transition, corresponding to the shift observed in the absorption to the region of longer wavelength. Considering the edges and surfaces carrying significant amount of functional groups of oxygen, GO was successfully dispersed in the water as electrolyte which produced a yellowish-brown stable solution. Thus, EPD-GO coated Cu pipe surfaces were dark brown with few aggregated particles. This redshift showed electrochemical elimination of unstable functional groups of oxygen after EPD. UV/Vis spectra of (a) Graphite, (b) GO, (c) EPD-GO coated cu pipe.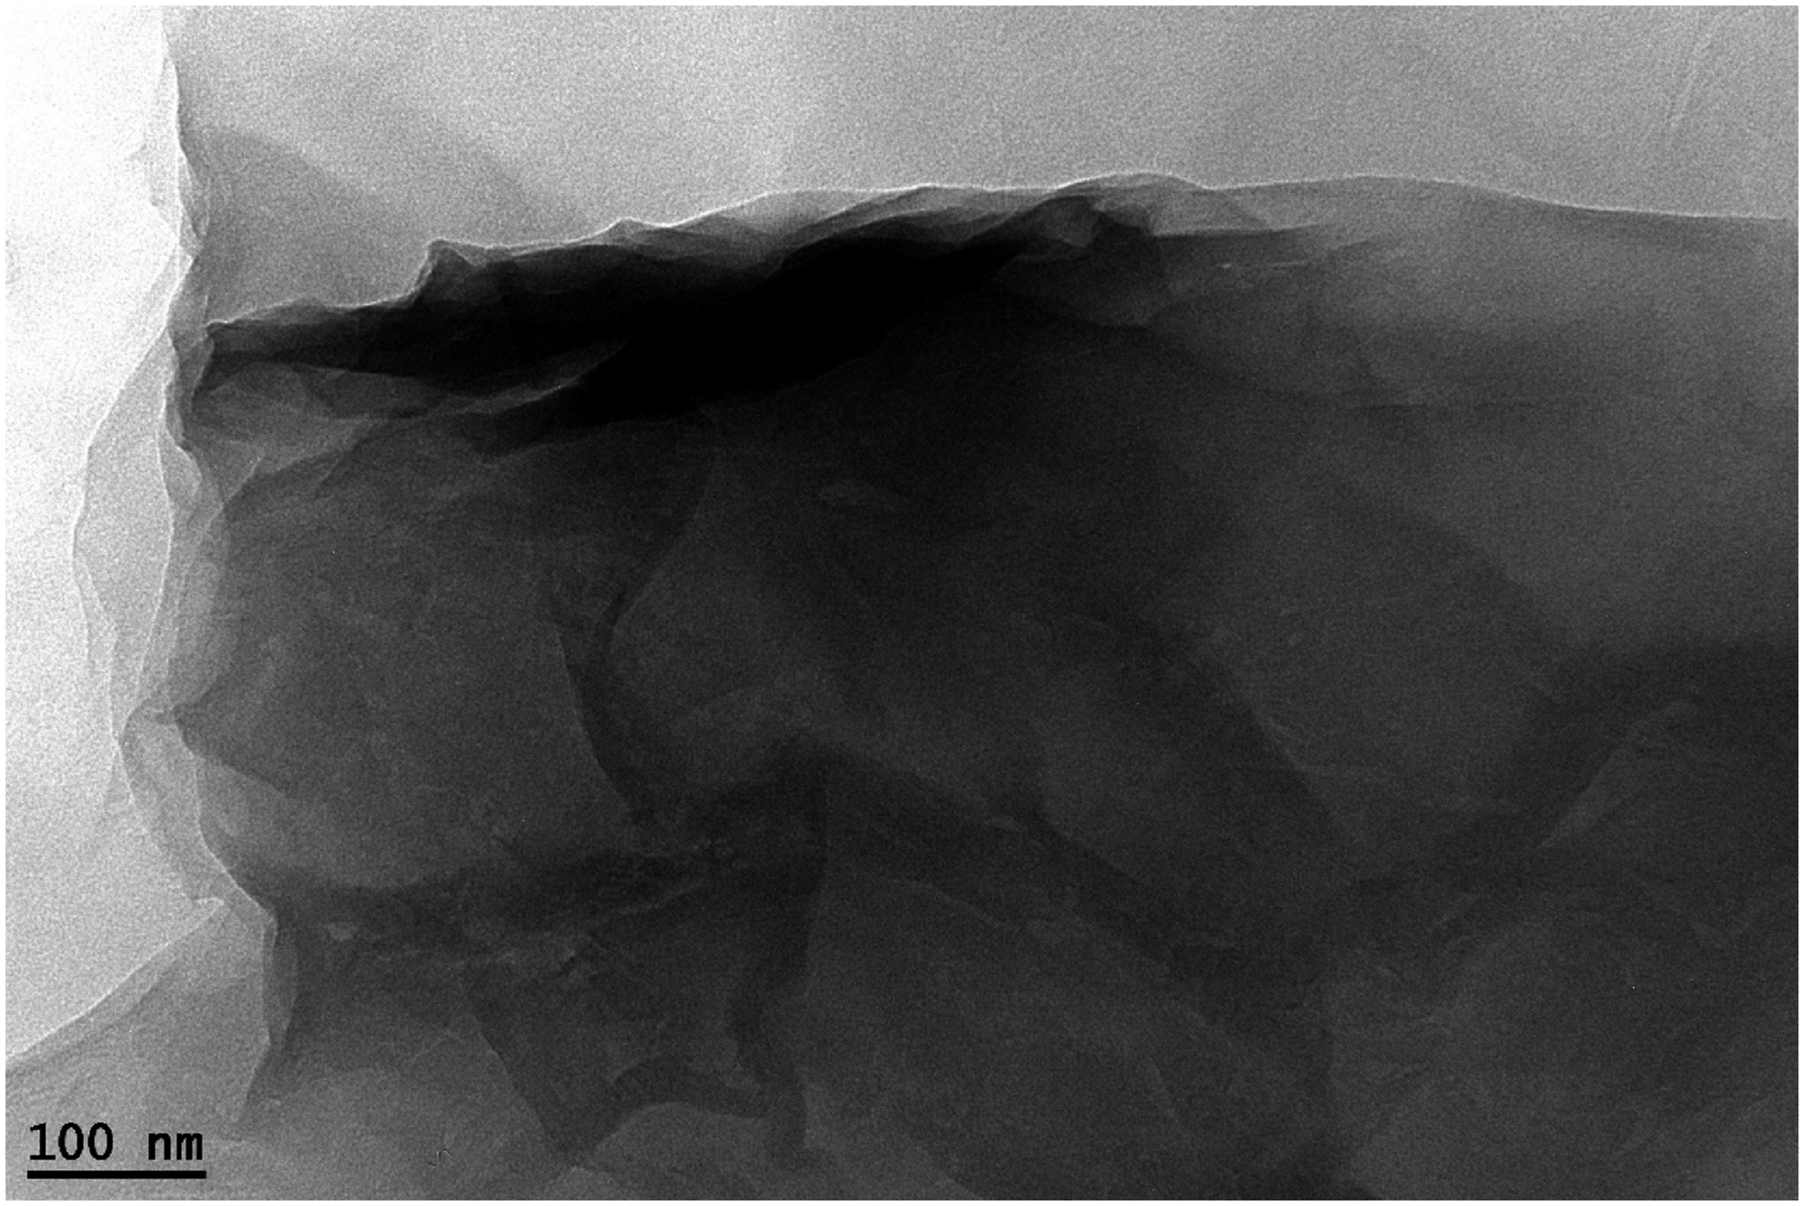
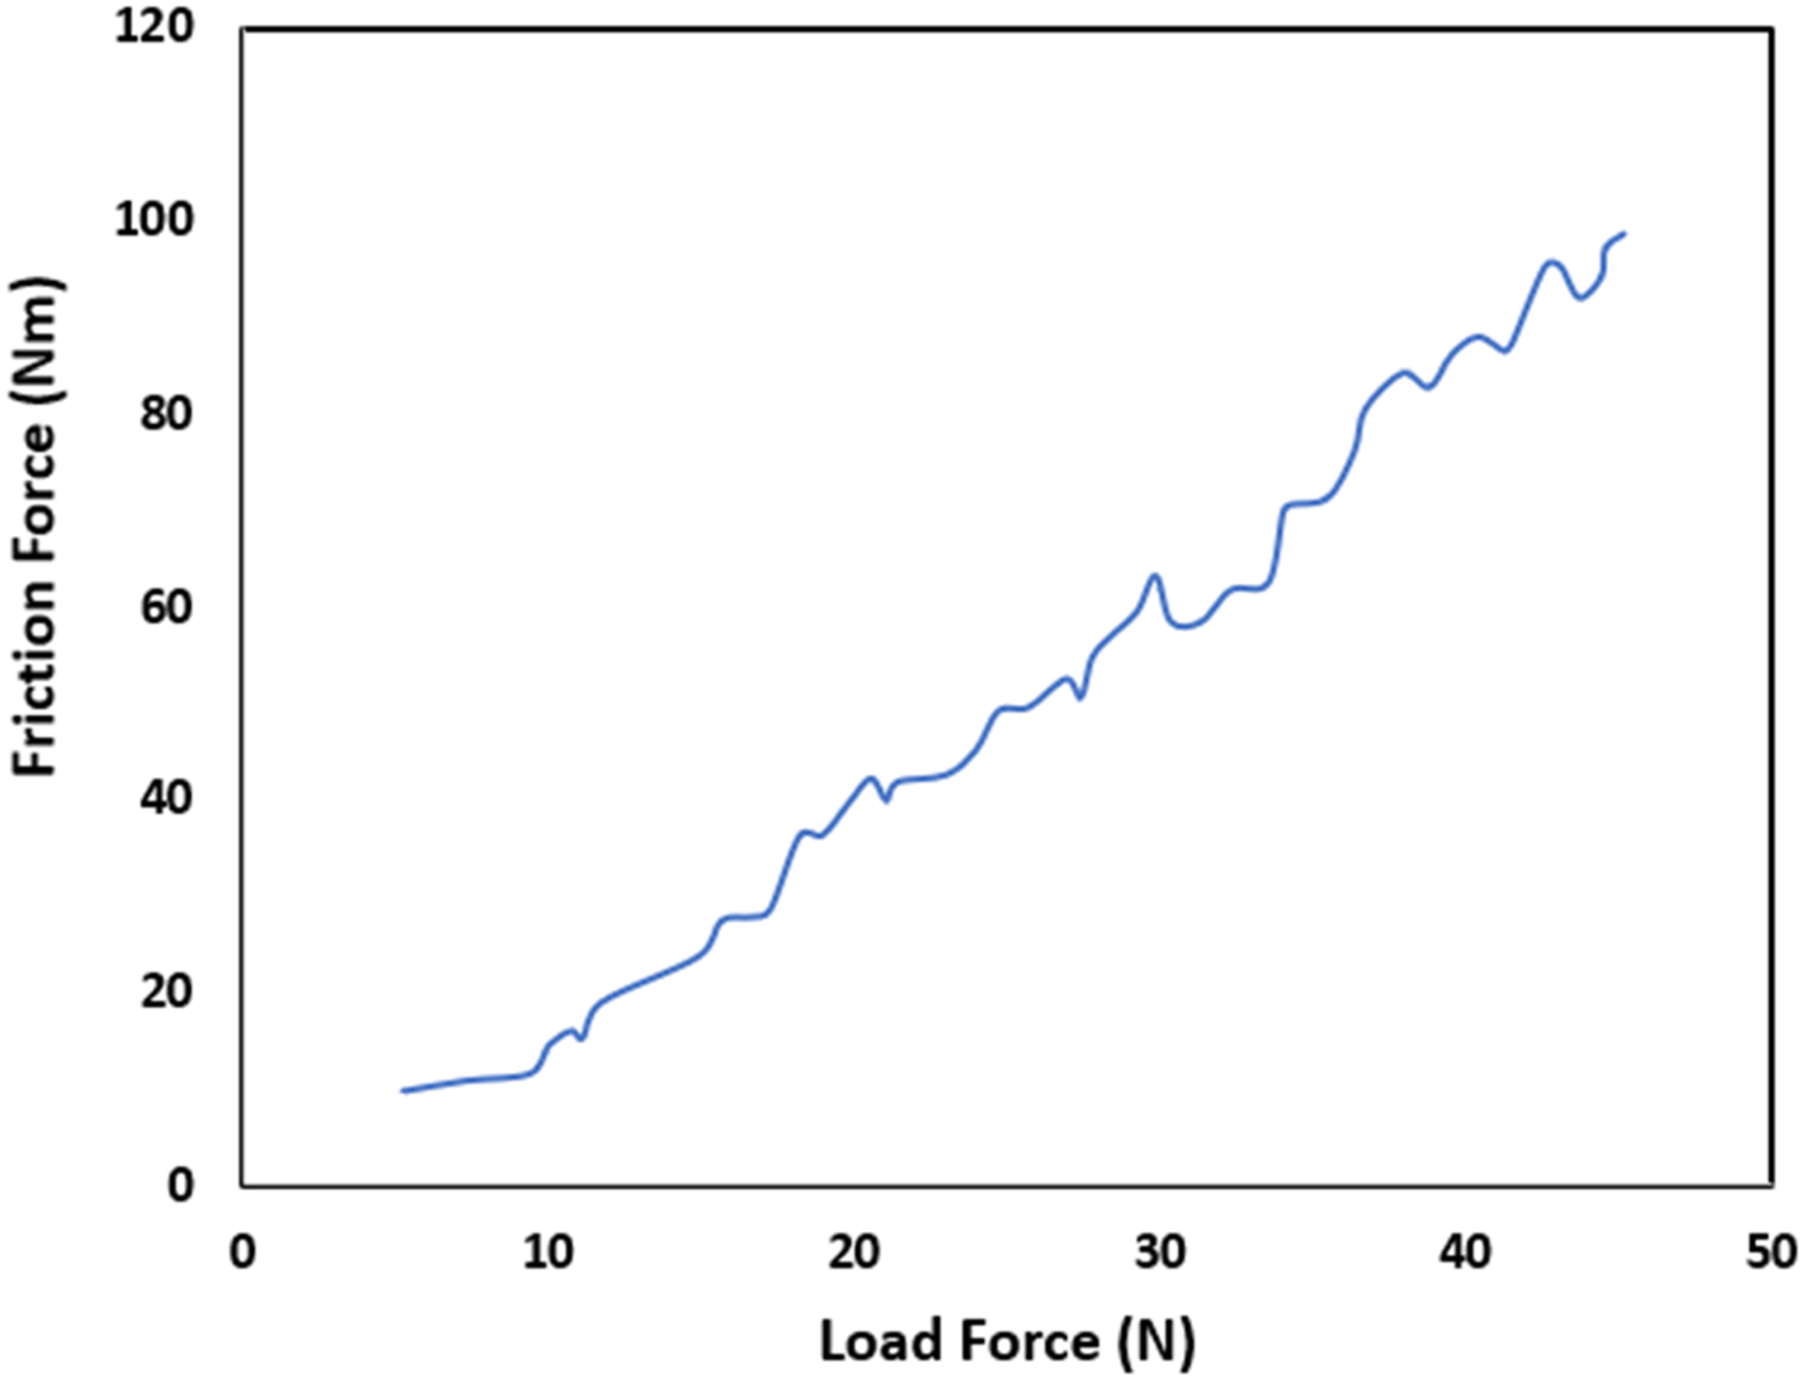
The bonding strength between the copper pipe and graphene is intricately tied to the stretching dynamics between the copper surface and the carbon atom’s surface configurations, dictated by their unique surfaces. Illustrated in Figure 6 is the adhesion force observed in the EPD-prepared GO-coating. With a gradual increment in load from 0 to 4.6 N, the friction force exhibited a steady, incremental ascent characterized by a constant slope.
34
Upon reaching 4.6 N, a notable, abrupt escalation in friction force occurred, indicating a shift in the contact condition between the coating and the indenter. This change was visibly marked by a distinct spot observed on the surface of the GO-coated copper pipe, discernible to the naked eye. The adhesion strength was determined based on this observed spot’s appearance on the metal surface, signifying the coating’s adhesion. The adhesion force of GO coating prepared by EPD.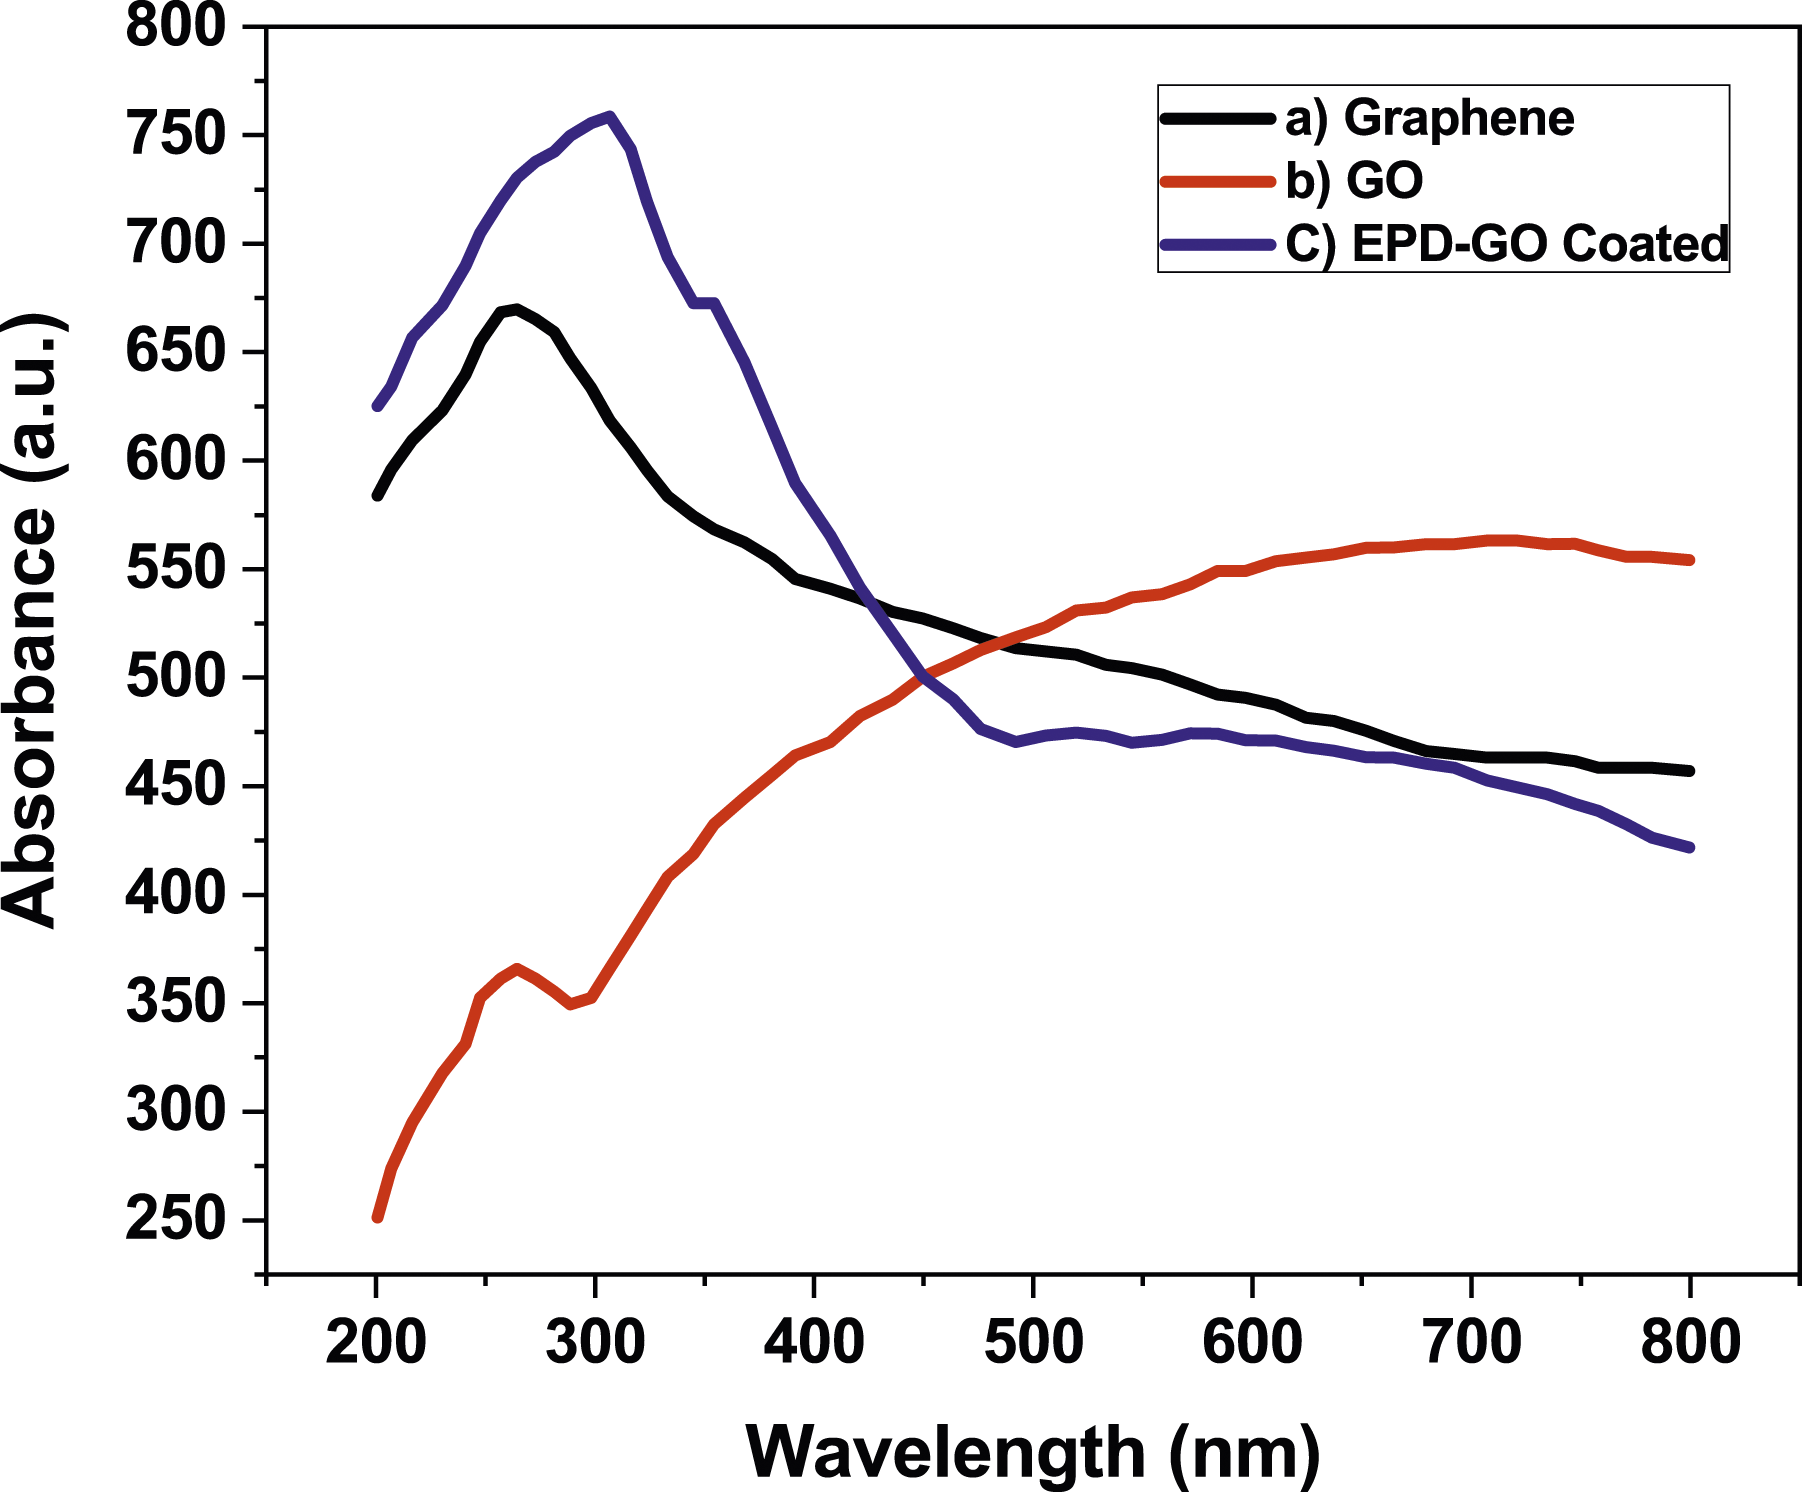
After exceeding the 4.6 N load, almost all surface abrasions on the coating vanished, indicating a significant compromise in the coating’s adhesion. Particularly noteworthy was the role played by the adhesion force between the coating and the substrate’s surface in bolstering the coating’s corrosion resistance. More precisely, the carboxyl groups located at the coating’s periphery established covalent bonds with the hydroxyl groups on the surface of the copper pipe post pretreatment, markedly amplifying the adhesion force beyond mere physical adherence.
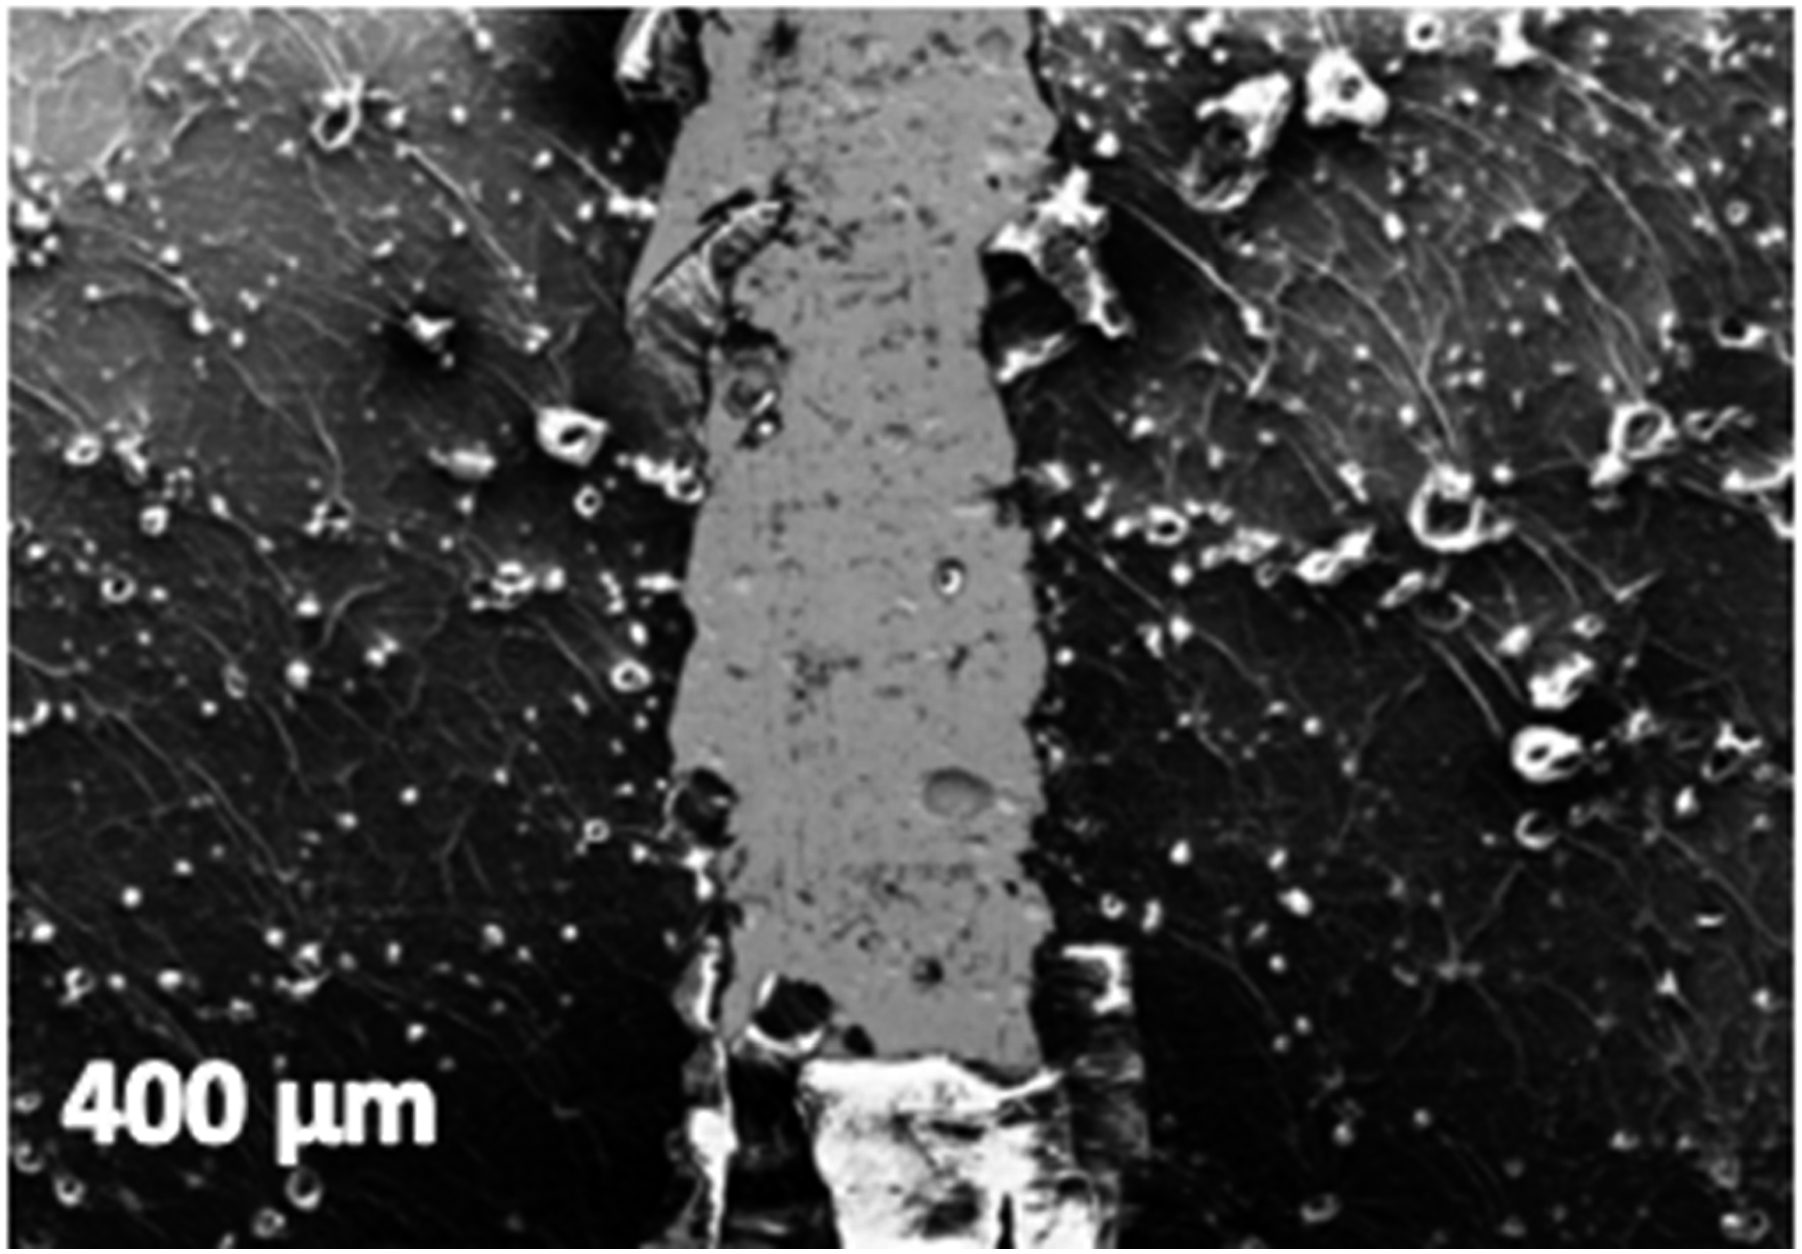
The investigation into the morphology and composition of graphene oxide (GO) applied onto copper was conducted using scanning electron microscopy (SEM). Displayed in Figure 7(a) is the SEM depiction illustrating the bare copper surface. In contrast, Figure 7(c) showcases a distinctly uniform and exceedingly thin layer of GO sheets coating the copper substrate. The transparency of this layer is such that it allows the passage of an electron beam through the sample. Figure 7(d) shows an imaging of the copper pipe that was coated by GO through EPD technique, which shows that the GO coating forms a consistent and continuous film across the surface of the copper pipe. Besides, the graphene oxide coating contributed to a less rough surface texture compared to the bare copper pipe in Figure 7(a). The SEM images depict minor irregularities resulting from the presence of the graphene oxide layer. This analysis reveals improved coverage of the copper pipe surface by the graphene oxide coating, indicating a successful and uniform deposition process. Notably, the graphene oxide coating exhibits a tightly adhering nature to the copper substrate, indicating a well-defined and interconnected three-dimensional network of graphene sheets as shown in Figure 7(b). This structure resembles a porous arrangement akin to a loosely structured sponge, implying a cohesive and integrated morphology of the GO coating on the copper substrate. Examining the scratch morphology through field emission scanning electron microscopy (FESEM), as shown in Figure 8, revealed that the peeling zone of the coating was confined within the scratch, displaying characteristic spalling and buckling phenomena. As load and pressure increased, fractures and cracks emerged at points of maximum tensile stress, with crack propagation accelerating at the point of failure, indicating a sudden loss of adhesion in the coating. The coefficient of friction decreased from an initial value of approximately 0.6 before failure to around 0.3 after failure, reflecting reduced surface resistance as cohesion weakened post-failure. SEM images of (a) bare copper pipe, (b) GO coating, (c) EPD-GO coated Cu, and (d) EPD-GO coated Cu pipe. FESEM morphology of GO coating after scratch test.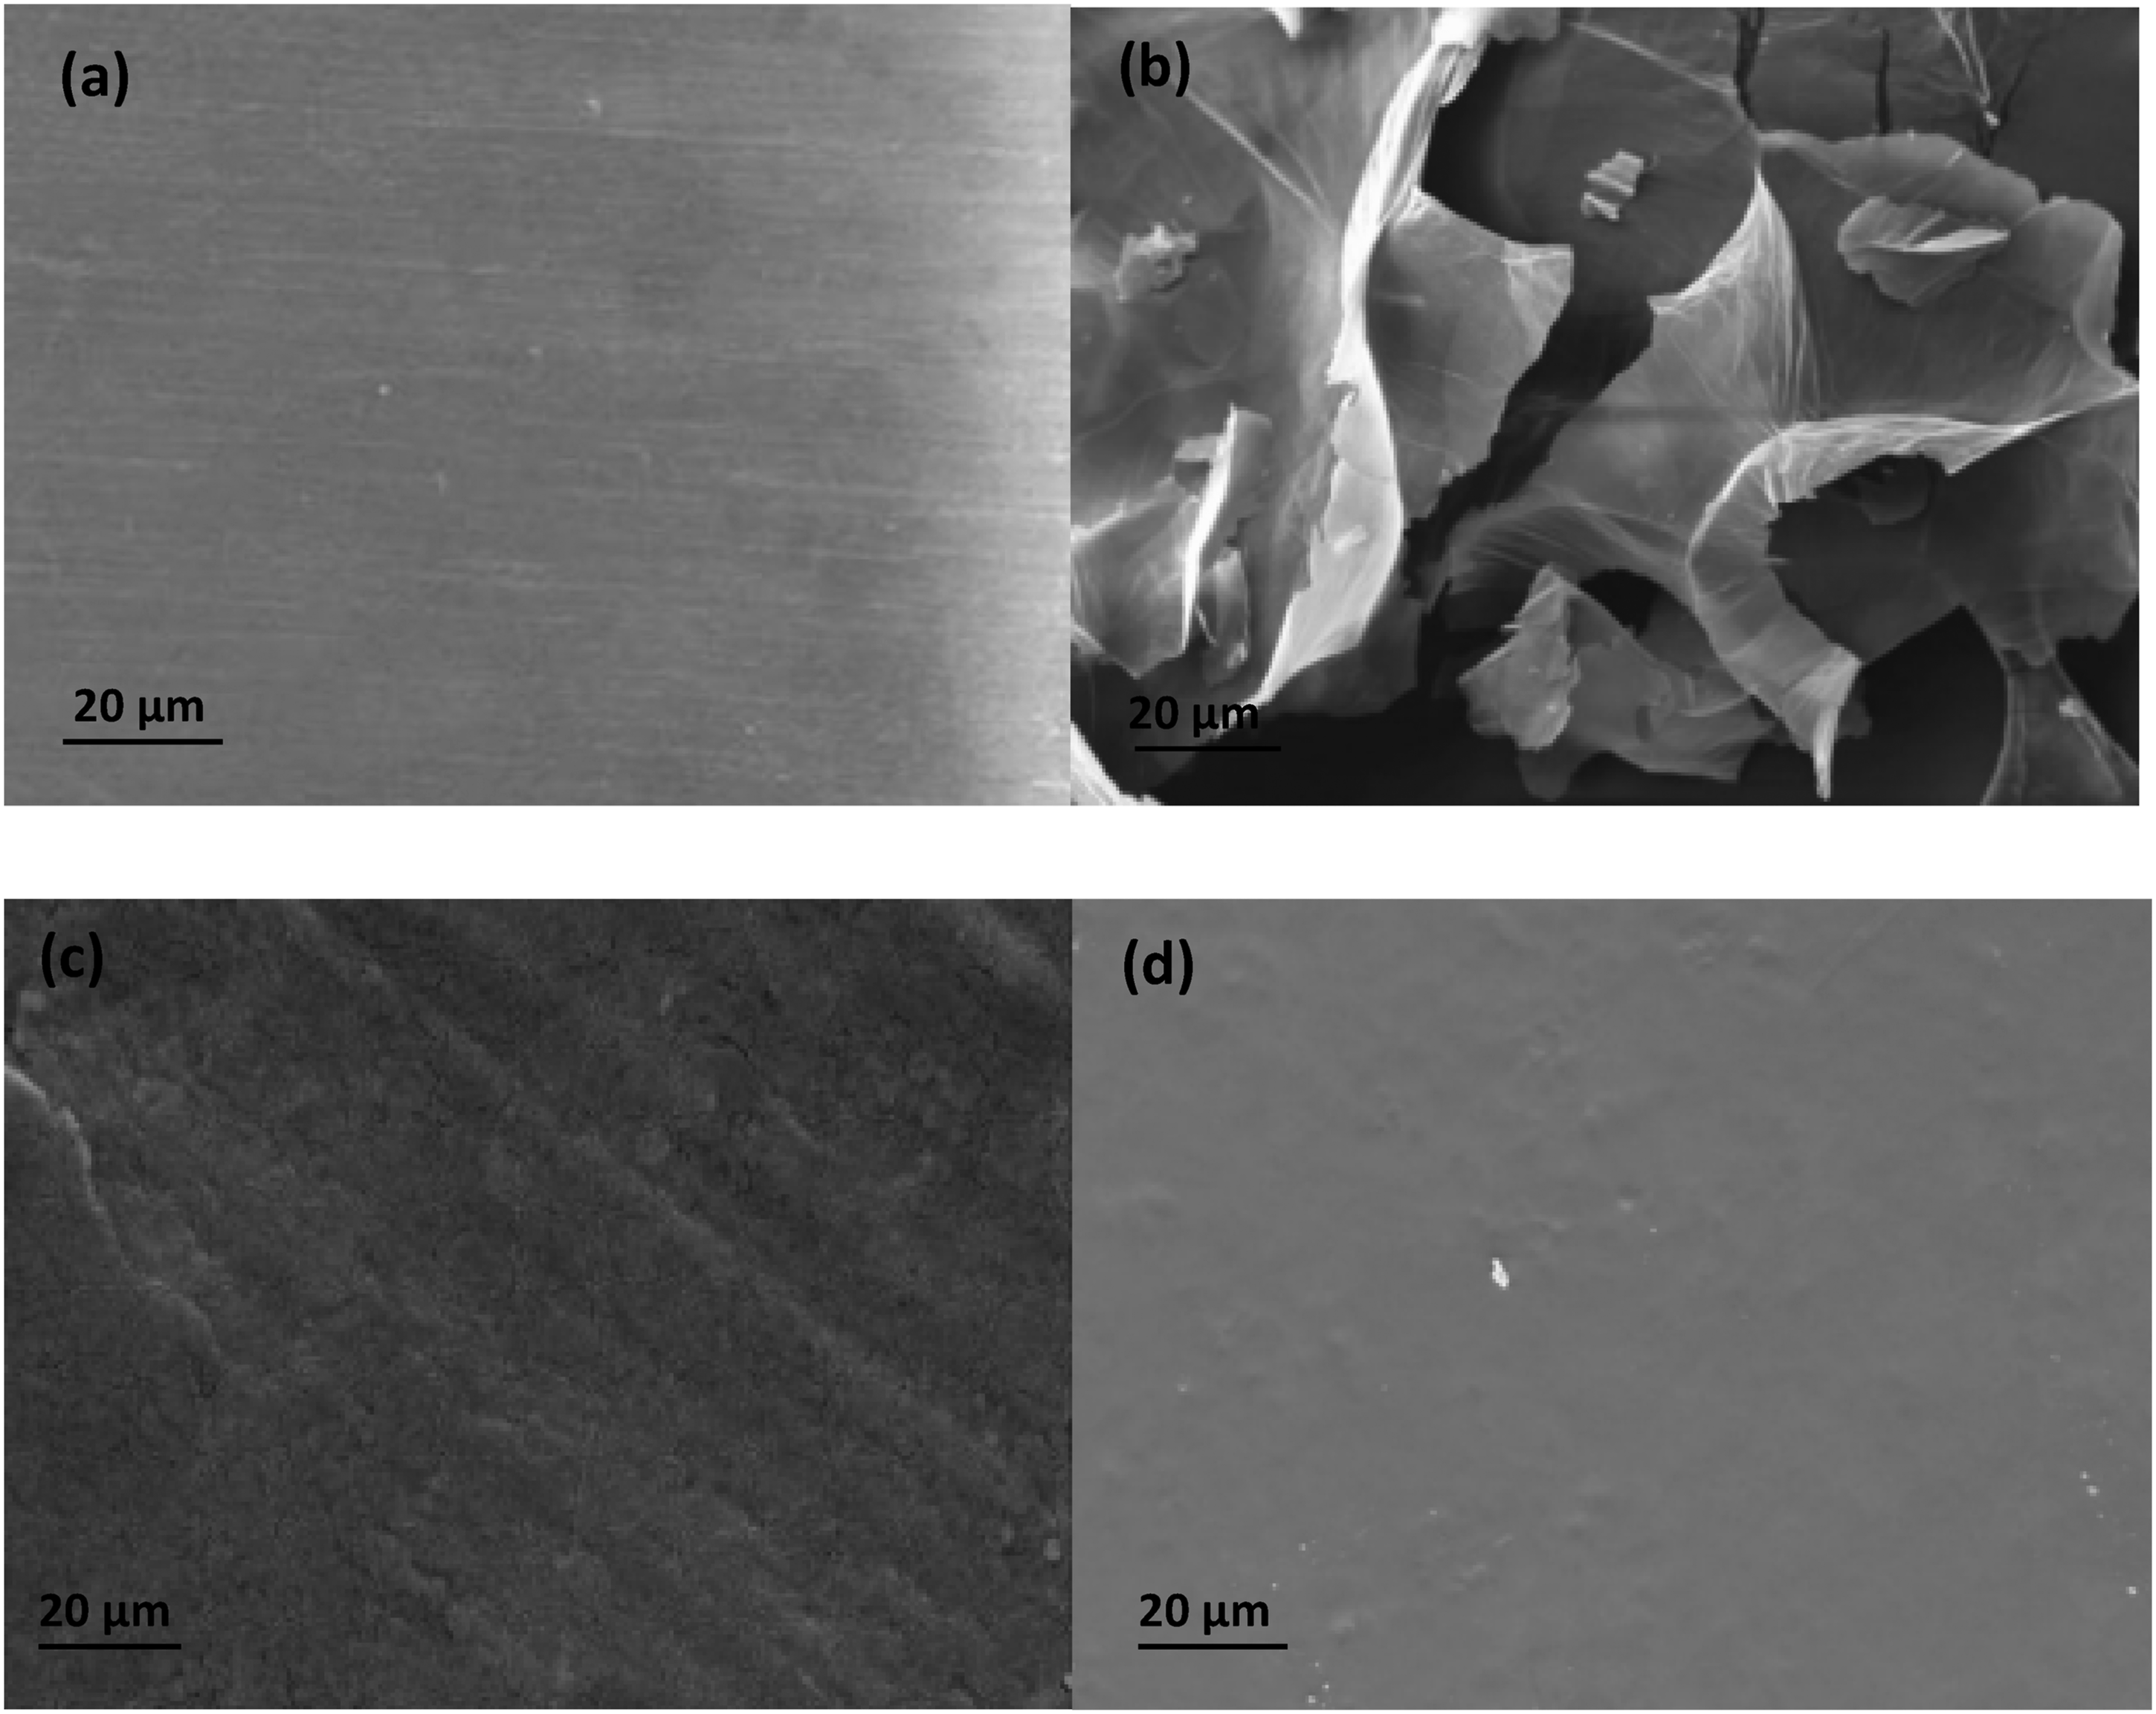
Zeta potential is part of the important characteristics which influence the quality of the deposited film and its morphological structures in the EPD, notwithstanding its kinetics. Zeta potential is homologous to mobility via equation (1). Zeta potential dispersion analysis of graphene oxide suspended in aqueous solution.
Synthesis and analysis of coatings through electrophoretic deposition techniques
Electrophoretic deposition (EPD) was employed to achieve a uniform application of graphene oxide (GO) as both thick and thin films onto copper pipes. In an aqueous environment, the GO sheets acquired a negative charge, indicated by a zeta potential value of −62.50 mV. Consequently, during the EPD process, these negatively charged GO sheets moved towards the positive electrode. Electrolysis provides both beneficial and challenging roles during EPD as it assists in GO reduction which improves electrical conductivity, thereby enhancing adhesion. However, it also influences coating uniformity and also affects stability. To address this issue, prior to the electrophoretic deposition (EPD) process, the colloidal suspension was thoroughly degassed under reduced pressure to remove dissolved gases that could lead to bubble formation.
Upon the application of voltage (low voltages; between 3 and 10 V), electrolysis of water occurred, releasing oxygen molecules at the anode’s surface. The functional groups like carbonyl and carboxylate (RCOO−) present on the GO platelets interacted with the produced H+ ions from water dissociation, leading to their deposition onto the anode’s surface. Simultaneously, partial dissolution of the metal occurred, releasing metal ions (Mn+) that interacted with RCOO−, also depositing onto the anode’s surface. This interaction might contribute to a reduction in the adhesion of the GO layer on the copper pipe.
Research suggests that once an electronic connection is established at the anode, electrons migrate away from the GO platelets, triggering the oxidation of more carboxylic groups.
35
Consequently, unpaired electrons within the GO framework migrate freely, seeking other unpaired electrons to form covalent bonds. The presence of remnant carbonyl groups observed in the FT-IR results Figure 10 supports this mechanism. However, while this reaction may account for the loss of carboxylates, it fails to fully explain the reduction of oxygen atoms in GO. FT-IR spectra for, (a) graphite oxide, and (b) EPD-GO coated on cu pipe.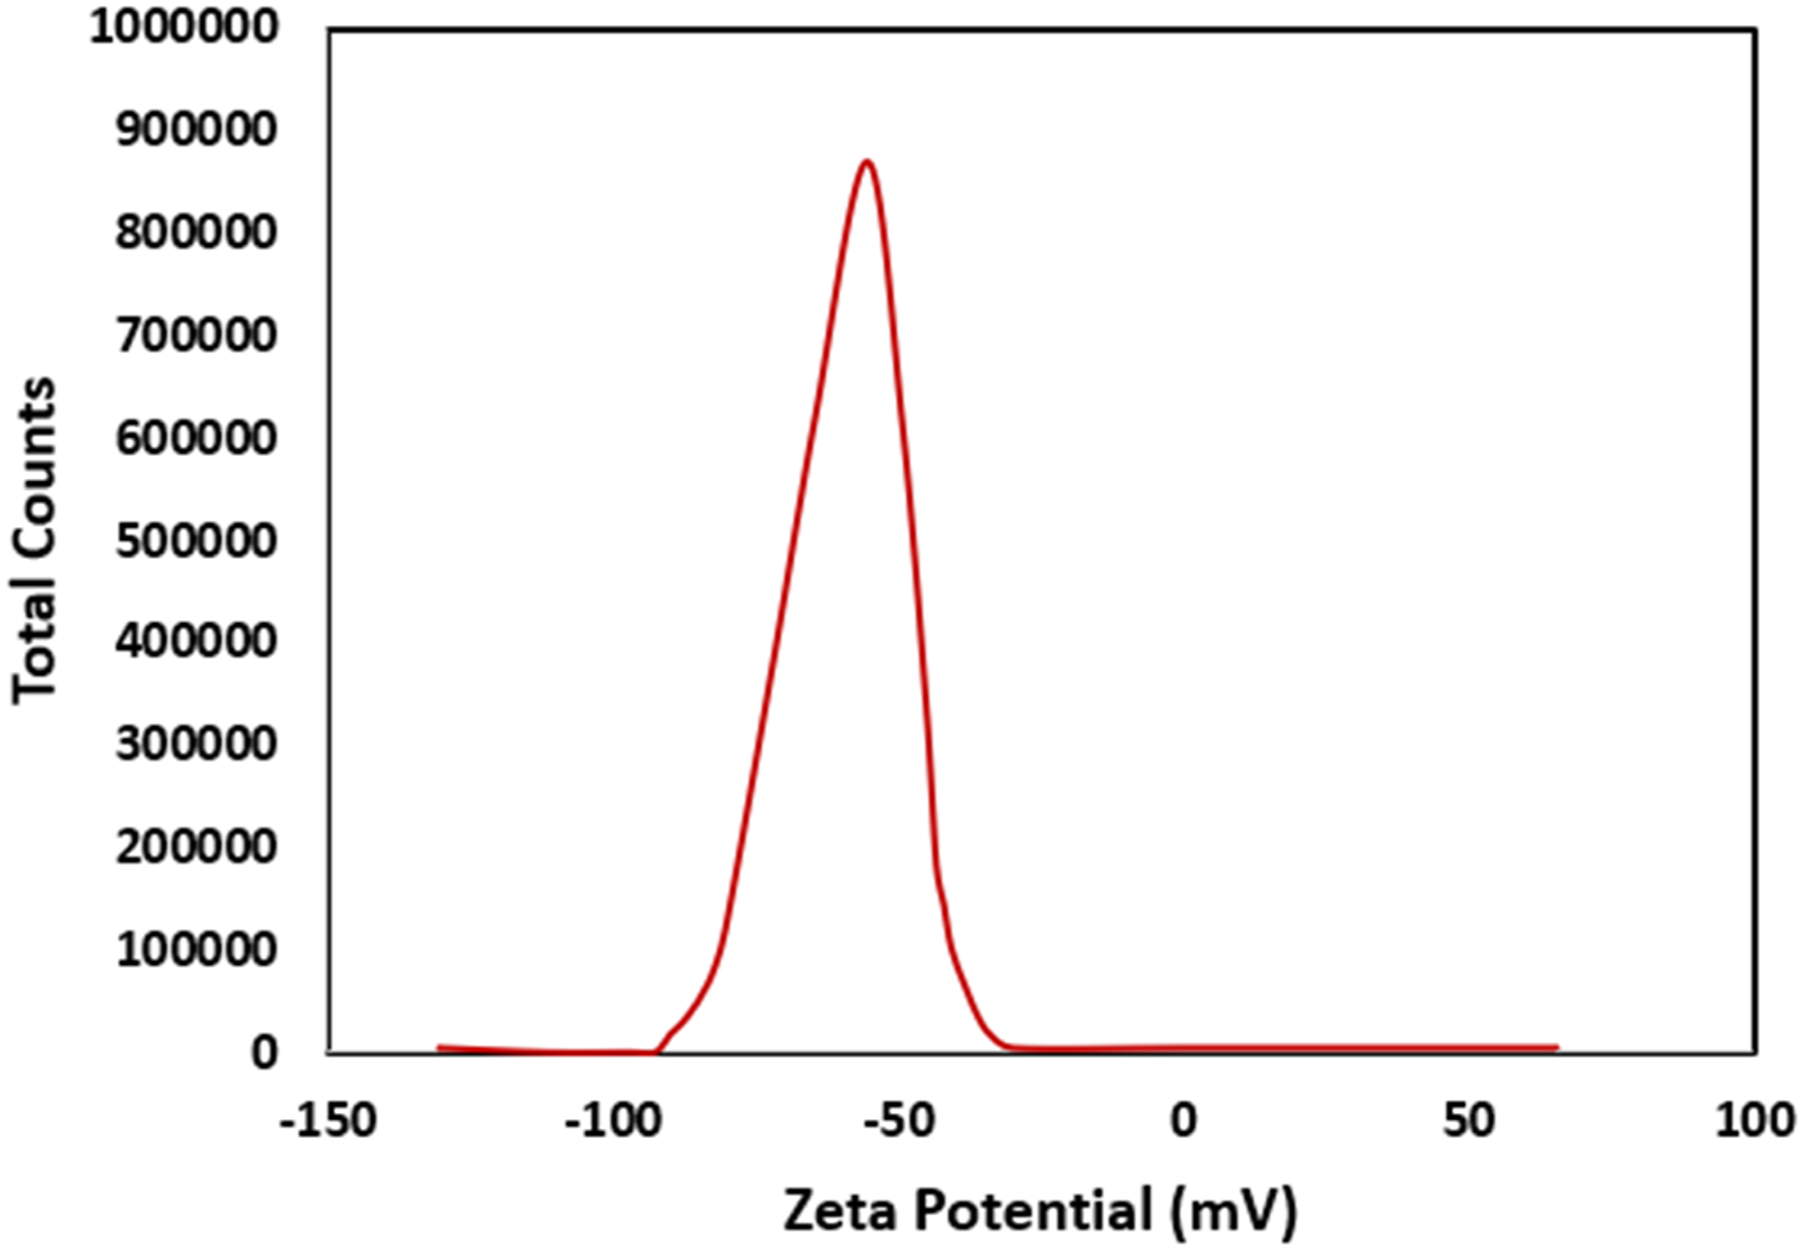
This reaction mechanism might be applicable for depositing GO in a bath without additives. Despite offering insight into the process, it does not entirely clarify the reduction of oxygen atoms within GO (GO reduction) or the specific role of certain chemical additives in this deposition process.
GO film on the copper pipe
The Figure 1(e) shown indicates the images of the layers of GO-EPD formed on copper pipe with different parameters. The film formed on the substrate cannot be easily peeled off by a simple tape test due to homogeneity and uniformity. Under the conditions of the used parameters such as low voltages and short time of deposition, the colour (brown) of the deposit reflects pristine conjugated domains of graphene oxide 36 with the colour changing from brown to black when applied voltage was increased due to increase in film thickness and time.36,37
Corrosion analyses
Figure 11 presents the electrochemical impedance spectroscopy (EIS) measurement in the form of Bode plots for both the bare copper pipe and the graphene oxide (GO)-coated copper pipe. The comparison between the two plots reveals that the GO-coated copper pipe exhibits a larger phase angle and impedance magnitude across a wide frequency range compared to the bare copper pipe. This increased impedance and phase shift suggest enhanced corrosion resistance provided by the GO coating. The larger impedance magnitude is indicative of an effective barrier that slows ion diffusion and inhibits electrochemical reactions responsible for corrosion. Consequently, the GO-coated pipe demonstrates superior corrosion protection, resulting in a lower corrosion rate relative to the uncoated copper pipe. These findings are consistent with similar studies in the literature, where coatings integrated with GO and other nanomaterials have significantly improved corrosion resistance. For instance, sol-gel modified films with GO, polyvinyl alcohol/graphene nanocomposites, and graphene/polyaniline composites have all demonstrated similar trends in corrosion protection by increasing impedance and acting as robust physical barriers.38,39,40 Electrochemical measurement of Bode plot for the corrosion of (Blue) bare copper pipe, (Orange) GO-coated Cu pipe in 0.5 M NaCl.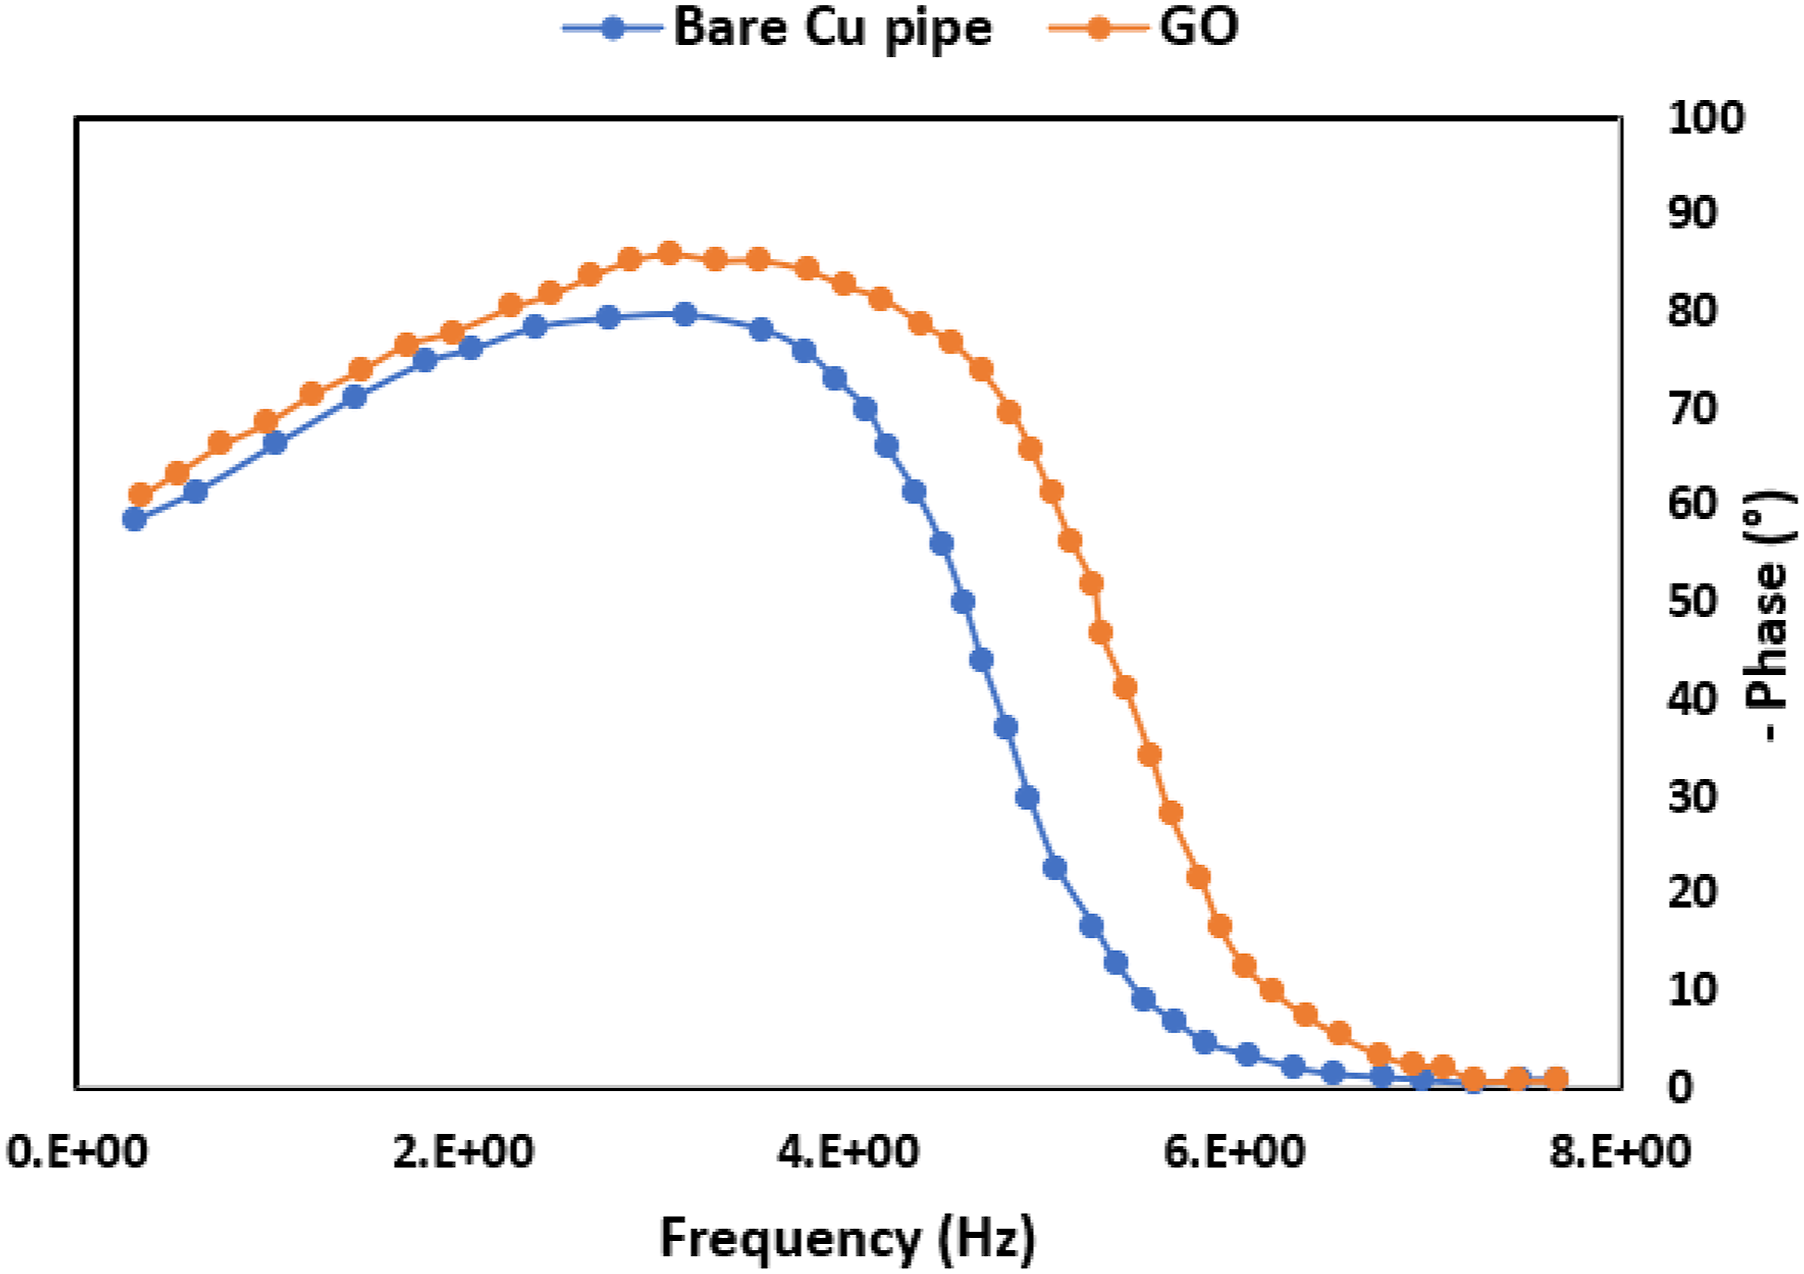
The Electrochemical Impedance Spectroscopy (EIS) results of the Nyquist plots for both the bare and GO-coated copper pipes were best represented by an equivalent circuit model as seen in Figure 12. This model comprised parameters such as the resistance (Rs) of the electrolyte solution, charge transfer resistance of the corrosion reaction (R
c
), Warburg impedance (Y
o
), and capacitance (C
dl
), linked to the copper pipe’s O2 diffusion. Notably, this model differed from a previous study
41
that proposed a two-layer oxide film representation, featuring an inner layer as a barrier-like structure and an outer porous layer. Since the GO deposition in this study was directly on the copper pipe, the model used here was distinct. Electrochemical measurement of Nyquist plot for corrosion of copper pipe with protective coating in 0.5 M NaCl.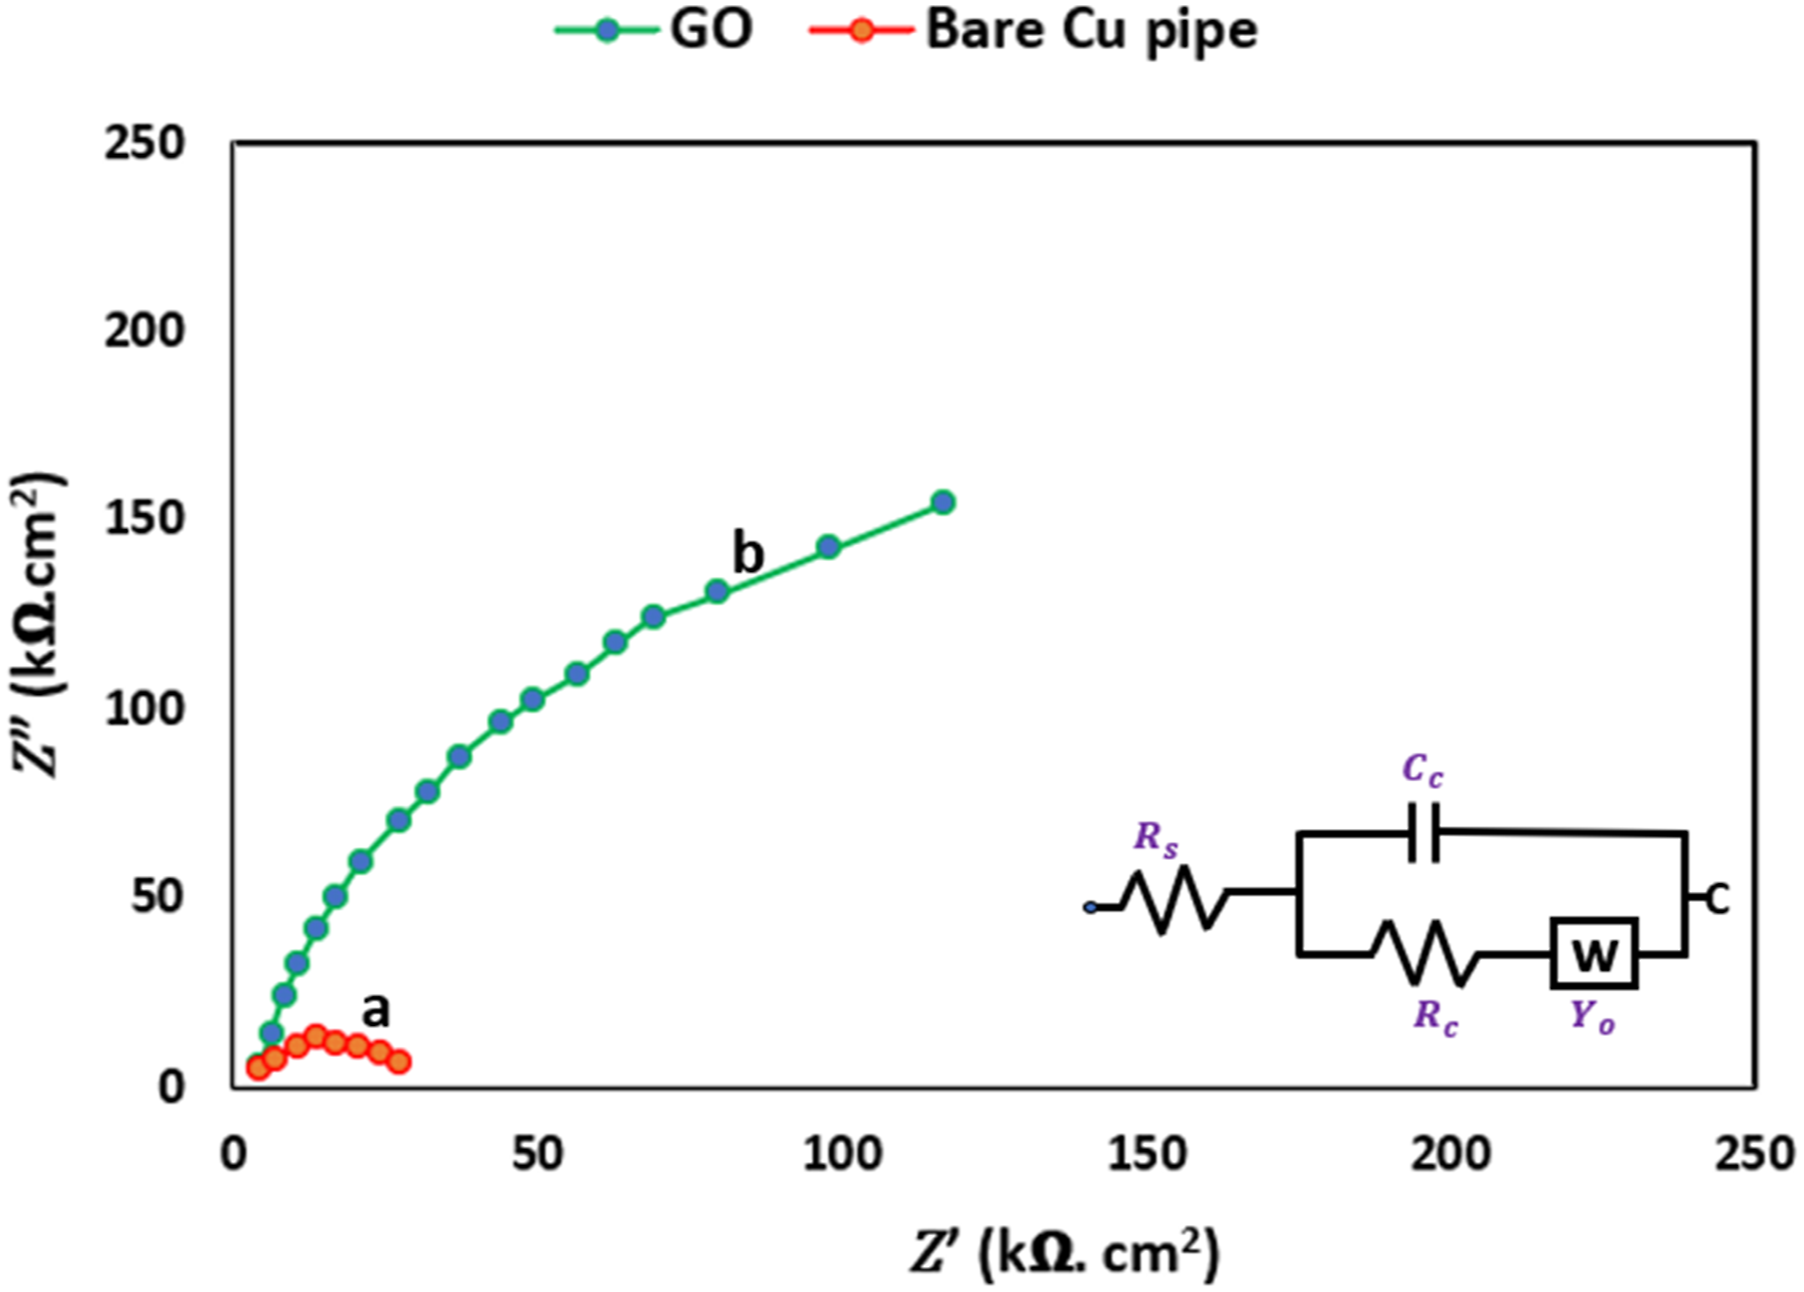
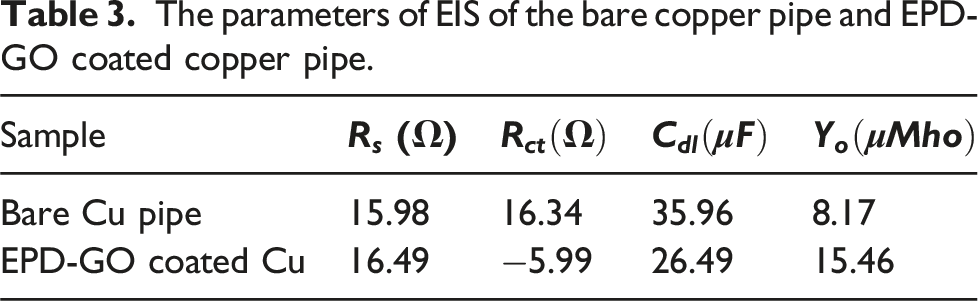
The parameters of EIS of the bare copper pipe and EPD-GO coated copper pipe.
The corrosion mechanism of Cu is oxidation at the anode which occurs at the working electrode alongside the process of reduction in the cathode utilizing released of the electrons during Cu’s oxidation. Various cathodic and anodic reactions which occurs on the Cu electrode is given below:
Other reaction might occur during the process in the NaCl solution
On the surface of the cathode, occurrence of reduction reaction via which electrolyte (such as 

According to a study, 43 the flattened capacitive semi-circle and circle’s sector shows dispersion of frequency because of phosphate covering defects. 44 However, the EIS data indicates that the statement is true but for only corrosion process under neutral media. The diameter of the semi-circle increased until it reached maximum at which the GO content could not further increases. The larger the size of semicircle, the higher the resistance of polarization. 45 The Bode plots presented in Figure 11 align with the observations from the Nyquist plots in Figure 12, showcasing a similar trend in the changing impedance values |Z|.
The negative phase angle (-θ) observed at higher frequencies holds significance in evaluating the integrity of a coating when exposed to a corrosive electrolyte. 46 Specifically, the θ value at 10 kHz is recognized as indicative of the coating’s condition when subjected to such an environment. An intact coating with no defects typically exhibits a θ around −90°, while for uncoated steel, the θ approaches zero. 47 As depicted in Figure 11, the presence of a high θ at higher frequency ranges (10 kHz) correlates with superior corrosion protection characteristics. This suggests that the coating possesses higher density with fewer defects, a conclusion supported by the low corrosion rate (1.03 × 10⁻⁶ mm/yr.) and high corrosion efficiency (90.48%) observed in the assessment.
The Nyquist plot in Figure 12 includes a Randles-modified equivalent circuit, which consists of two key components: (Ro), representing the uncompensated resistance of the electrolyte solution, and (Rt), which corresponds to the polarization resistance. Here, instead of using ideal layer of double capacitor (Cdl), an element of constant phase (CPEdl) was utilized to simulate accurately the characteristic frequency of distribution,
48
including Warburg (W) element, corresponding to the resistance of diffusion. CPE contains ratio of impedance dispersion,
By utilizing the Tafel method of extrapolation at the convergence of anodic and cathodic polarization curves, various electrochemical parameters were derived. These parameters include corrosion current density (icorr), corrosion potential (Ecorr), corrosion rate (CR), equivalent weight (EW) of the copper pipe, resistance efficiency, and η values for both the bare copper pipe and the EPD-GO coated copper pipe. These parameters were extrapolated employing specific equations standardized for such analyses. ASTM G102 – 89
51
:
Furthermore, the passive current density (ip) was determined by measuring midway between Epit and Ecorr. It’s noteworthy that all measurements were conducted three times to ensure accuracy and reliability. Additionally, the surface of some specimens was examined after the electrochemical testing to further analyze their condition and characteristics.
The EPD-GO coated copper pipe restricted either the oxidation at the anode or prevented the OH− ions contact. It is highly practical to inhibit copper pipe’s corrosion. Aside that, adequate O2 and H2O are required for the corrosion to occur and copper pipe’s dissolution.
52
Consequently, EPD-GO coatings play a significant role in adding to the pathway of O2 and H2O molecules dissolution to the copper pipe. Figure 13 exhibits the Open Circuit Potential (OCP) measurements of both the bare copper and EPD-GO coated Cu pipes in a 3.5 wt% NaCl solution. Initially, the EPD-GO coated Cu pipe showed a significant reduction in potential, transitioning from 138 mV to −33 mV within 600 s. Subsequently, it gradually stabilized, reaching −51 mV after 1600 s. In comparison, the bare Cu pipe started at −118 mV and experienced a slight decrease to −169 mV after 600 s, stabilizing at −174 mV after 1600 s. The EPD-GO coated Cu pipe displayed a notably higher positive OCP (−49.8 mV) in contrast to the bare Cu pipe (−174.5 mV). This difference indicates that the application of the GO coating significantly reduces the corrosion rate (CR) of the Cu pipe.53,54 The corrosion current density ( Open Circuit Potential for (a) Bare copper pipe, (b) EPD-GO coated copper pipe. Tafel polarization curve of (a) bare copper, (b) GO-coated copper pipe. Comparative assessment for Tafel curve parameters for bare copper pipe and EPD-GO coated copper.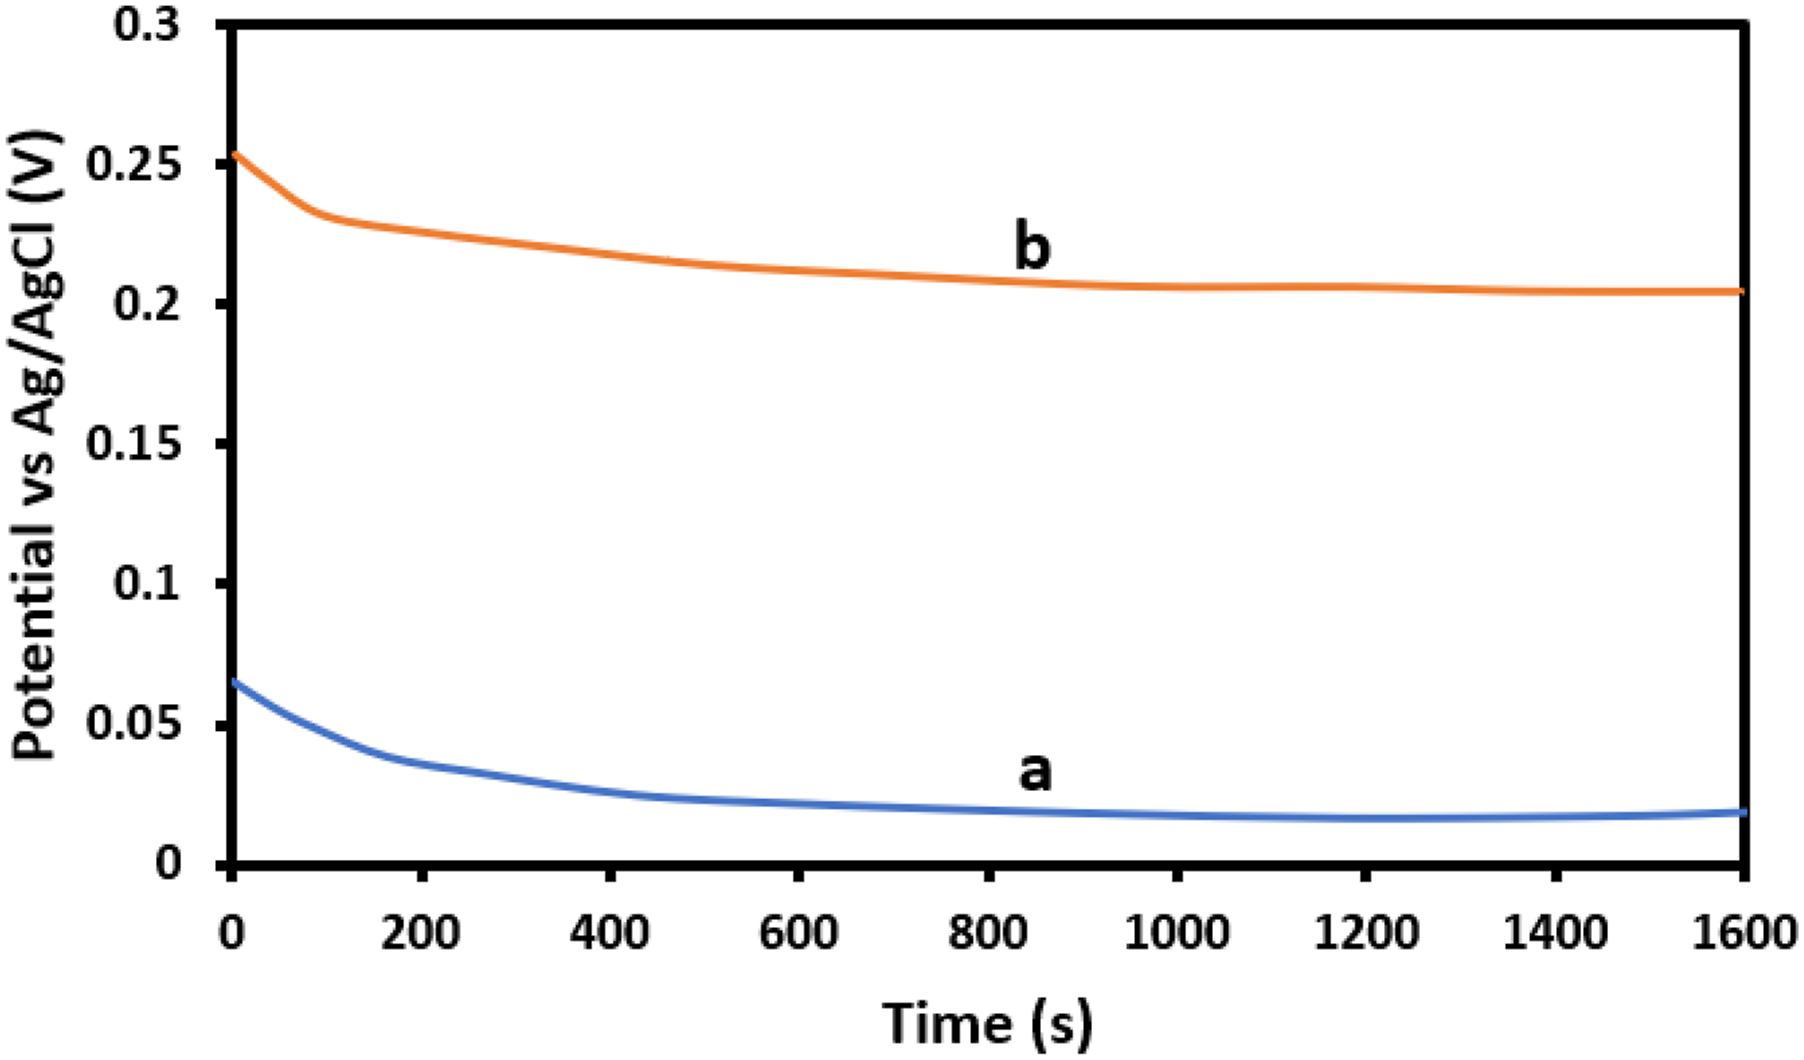
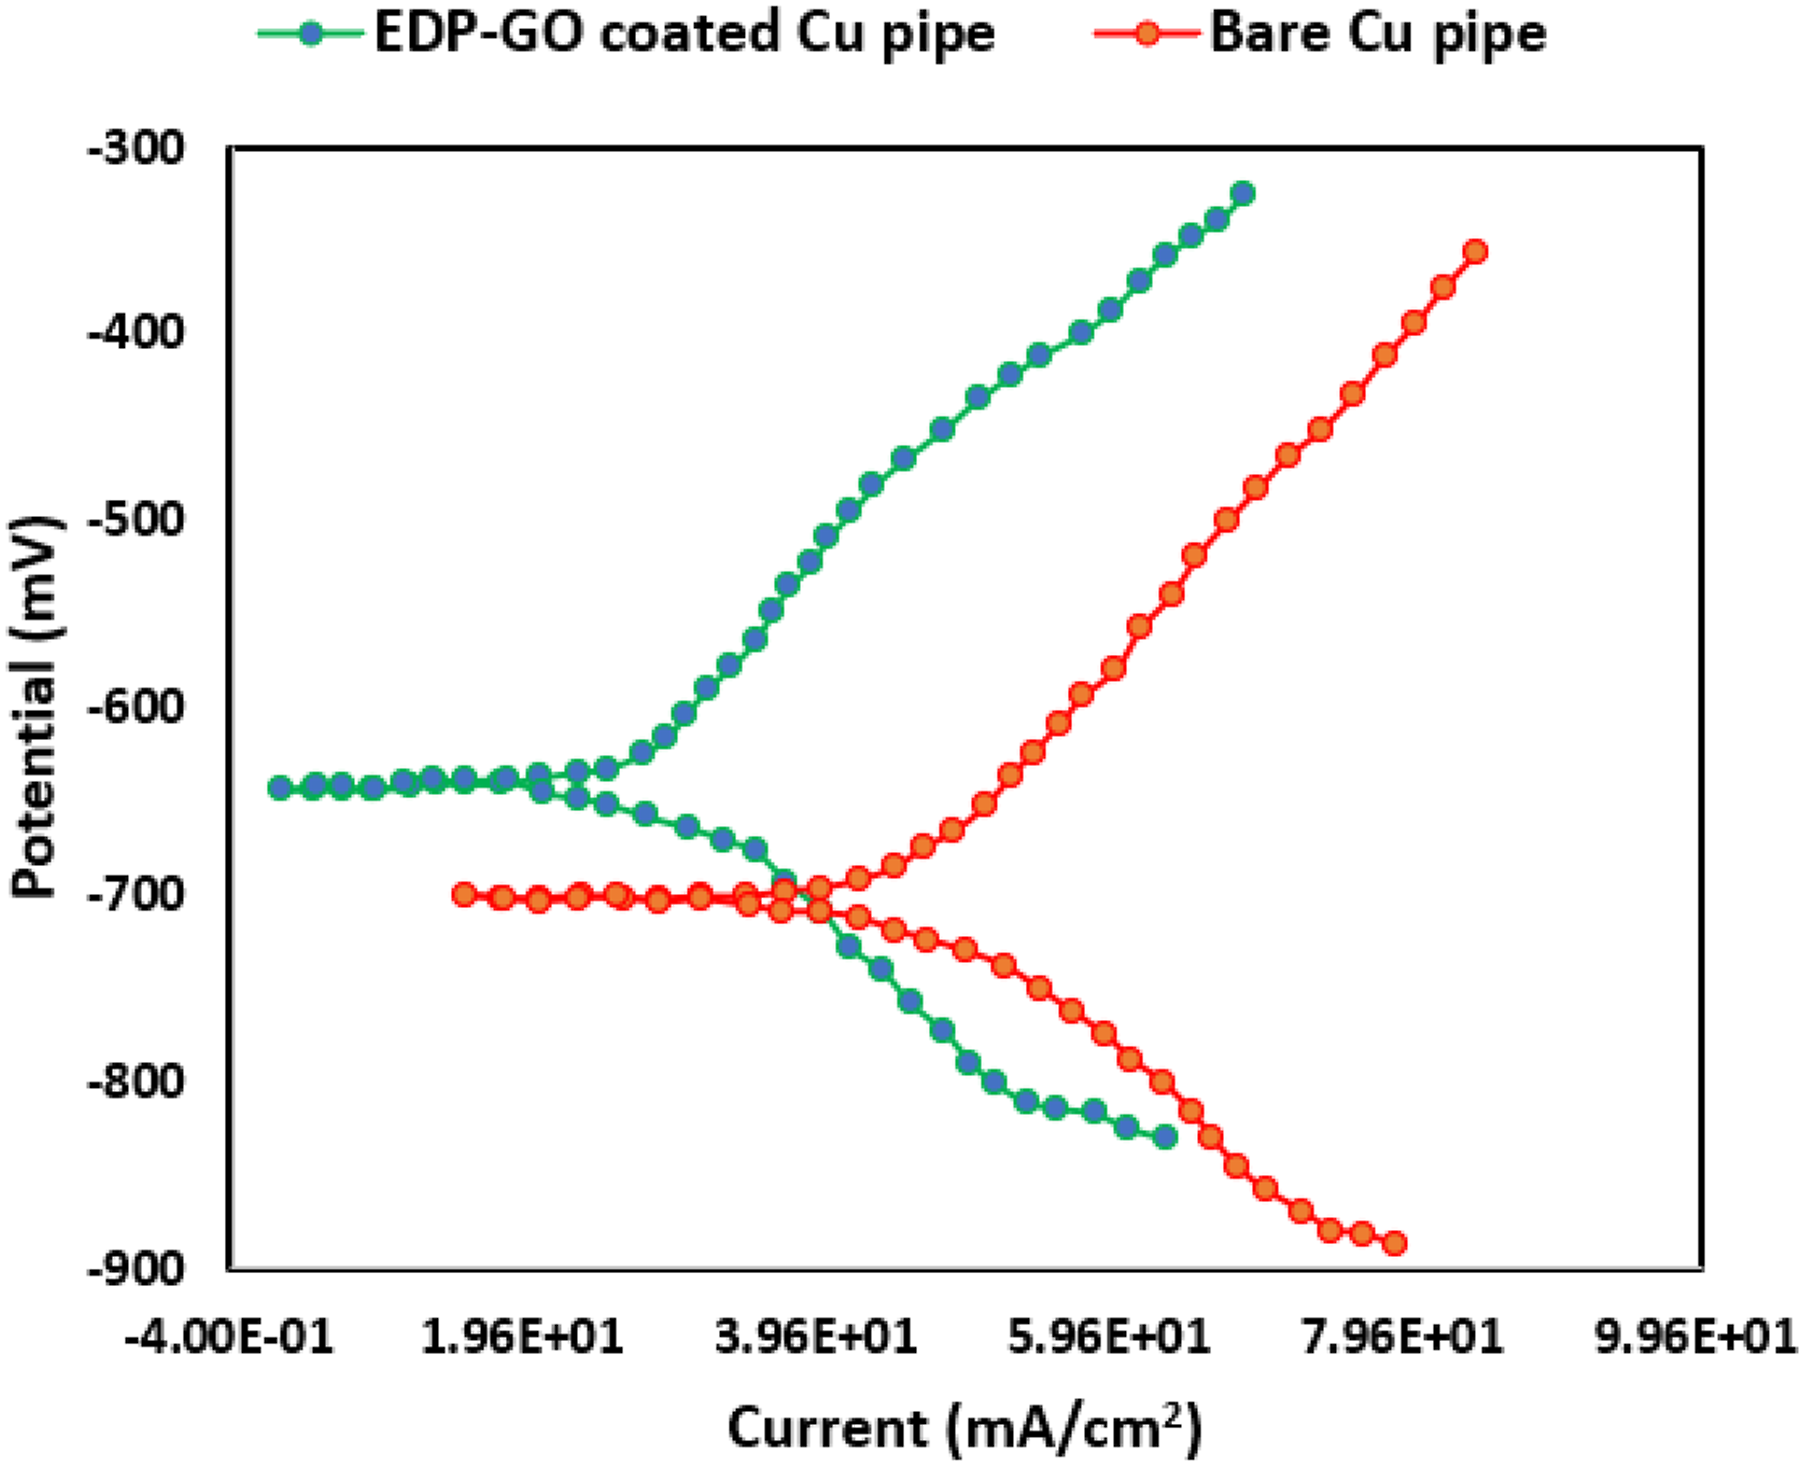
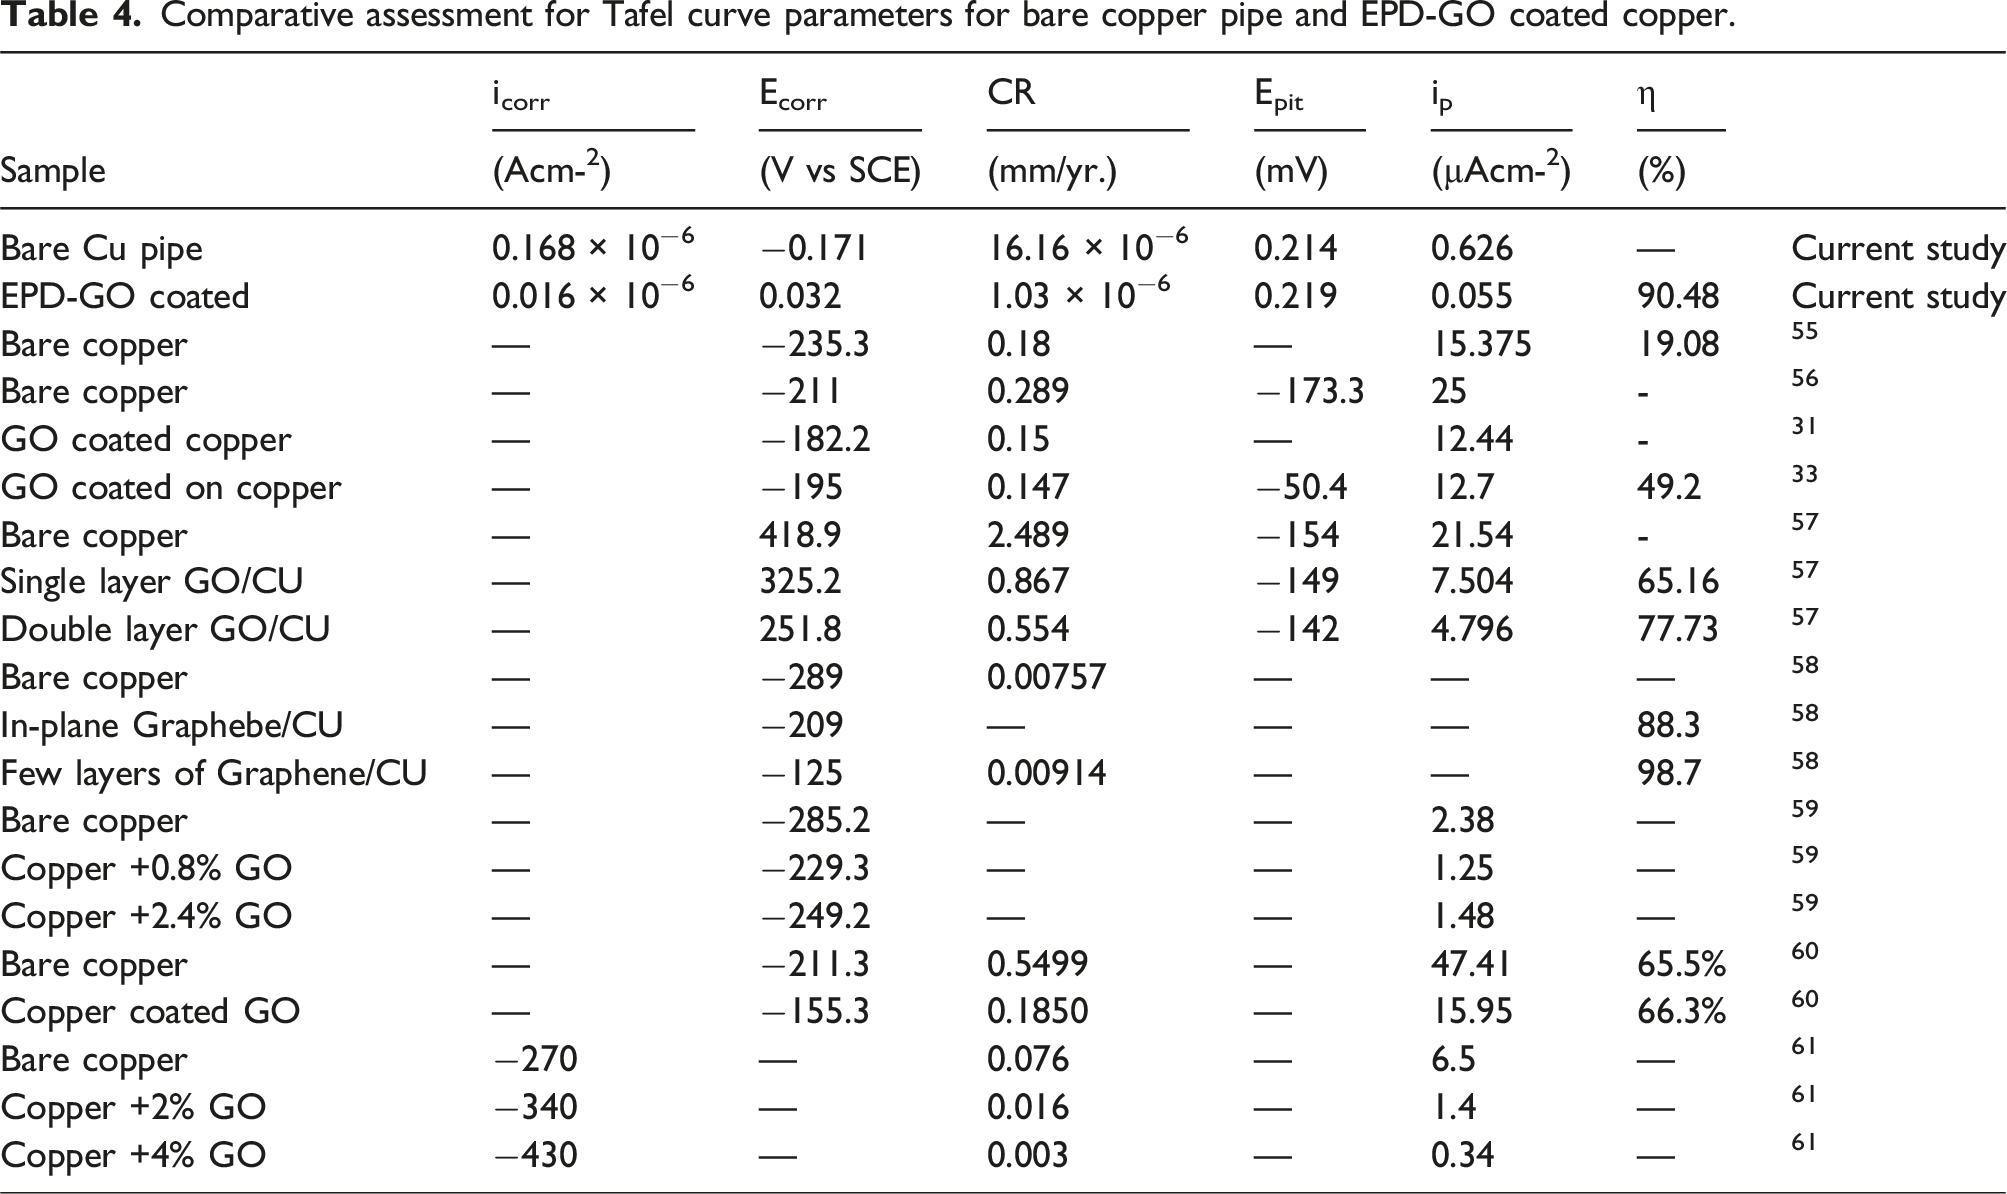
Moreover, the observed passive current density (I p ) values in Table 4 indicate the applied potential for both bare copper pipe and EPD-GO coated copper pipe. Both substrates displayed lower values of I p , indicating the formation of highly stable passive films on the copper pipe’s surface. This stability further contributes to their improved corrosion resistance. This evidence supports the protective corrosion barrier of EPD-GO coating as previously mentioned. In summary, the comparative assessment of Tafel curve parameters between bare copper and EPD-GO coated copper provides valuable insights into the electrochemical behaviors, corrosion resistance, reaction kinetics, catalytic activities, and stability of these materials in various electrochemical applications.
In addition, bare copper pipe’s corrosion rate was recorded as 1.616 × 10⁻⁵ mm/yr, whiles that of the EPD-GO coated copper pipe was 1.03 × 10⁻⁵ mm/yr. The corrosion rate value obtained for the bare copper pipe lies between results obtained by Zhang et al,
65
that is, 2.4 × 10⁻⁴ mm/yr and Chembath et al,
66
that is, 6.98 × 10⁻⁶ mm/yr. Additionally, it was found out by Zhang that EPD-GO coated corrosion resistance to be 1.4 × 10⁻⁴ mm/yr but unlike ours, the corrosion resistance (1.03 × 10⁻⁵ mm/yr) was better than theirs. This might be because of low voltage utilization (10 V) in their work than ours which is 25 V for EPD-GO coating. Additionally, the hypercritical potential happens to be the pitting potential (
Conclusion
Utilizing the Electrophoretic Deposition (EPD) method, a copper pipe underwent a uniform coating process with a fine layer of graphene oxide (GO) nanosheets, sourced from a stable aqueous colloidal suspension. The suspension’s stability was verified through zeta potential measurement, yielding a value of −28.9 mV. Ideal parameters were established to achieve a well-bonded deposit on the Cu pipe: employing a suspension concentration of 0.5 mg/mL alongside an applied potential of 20 V for 60 s. Examination via SEM imaging unveiled a deposited layer measuring 2.23 μm in thickness. Evaluation through XRD, FT-IR, and the C/O weight ratio confirmed the reduction of GO throughout the EPD process.
Electrochemical corrosion tests showcased the superiority of the EPD-GO coated copper pipe. It exhibited increased impedance, higher resistance efficiency, and notably lower corrosion rate (CR) values compared to the uncoated copper pipe. Moreover, the GO coating functioned as a barrier, preventing charge exchange between the Cu pipe and its surrounding environment while remaining inert to other substances. This significantly bolstered the Cu pipe’s protection, especially when subjected to testing in a 3.5% NaCl solution. The application of GO treatment using EPD deposition demonstrates promising potential for utilizing Cu pipes in severe corrosive industrial settings.
Abbreviations
Copper
Hydrogen Peroxide
Chemical Vapor Deposition
Sulfuric Acid
Electrochemical Impedance
Hydrochloric Acid
Electrochemical Deposition
Nitric Acid
Field Emission Scanning Electron Microscopy
Potassium Permanganate
Fourier Transform Infrared Spectroscopy
Open Circuit Potential
Graphite
Scanning Electron Microscopy
Graphene Oxide
Silicon Carbide
Silicon Oxide
Transmission Electron Microscopy
X-ray Diffraction
Footnotes
Acknowledgments
The authors extend their appreciation to the Japan International Cooperation Agency (JICA) for their gracious financial backing, and to the Egypt-Japan University of Science and Technology (E-JUST) for their indispensable technical guidance.
Author contributions
M. M. Y. Z., Conceptualization, Methodology, Resources, Formal analysis, Investigation, Visualization, Writing - original draft, Writing - review & editing, Supervision. M. F., Conceptualization, Methodology, Resources, Writing - original draft, Writing - review & editing. D. A., Writing - review & editing. M. M. Y. Z., Conceptualization, Methodology, Resources, Formal analysis, Writing - review & editing.
Declaration of conflicting interests
The author(s) declared no potential conflicts of interest with respect to the research, authorship, and/or publication of this article.
Funding
The author(s) received no financial support for the research, authorship, and/or publication of this article.
Data availability statement
Some or all data, models, or code that support the findings of this study are available from the corresponding author upon reasonable request.