
Abstract
This study investigated the influence of the cooling rate on the crystallinity and mechanical properties of carbon fibre-reinforced polyether ether ketone (CF/PEEK) composites. Interlaminar shear and compressive performance of CF/PEEK composites were studied under different cooling rates ranging from 1.5°C/min to 300°C/min. The bond strength, crystallinity and crystalline morphologies were correlated. The crystallinity percentage was measured by differential scanning calorimetry, X-ray diffraction, and the crystalline morphology was revealed by focused ion beam etching. The study found a 14% decrease in crystallinity with an increase in cooling rate. The interlaminar shear strength (ILSS) and the compressive strength (CS) were assessed by short beam shear (SBS) and combined load compression (CLC) tests, respectively. The increase in cooling rate was observed to reduce the ILSS and CS by 6-11% and 1-30%, respectively. The reduction in ILSS and CS was attributed to the presence of void and the decrease in crystallinity. The failure modes for both tests were examined at macro and microscopic levels, providing practical insights into the behaviour of CF/PEEK composites under different cooling rates.
Keywords
Introduction
Thermoplastic (TP) composites are becoming popular over traditional thermoset composites due to their unique features. 1 These include, unlike thermosets, they can be stored as prepreg at room temperature and have demonstrated potential for re-processability and recyclability, which are essential considerations in today’s challenges.2,3 Therefore, they have attracted considerable attention for utilising structural components in aircraft components like fuselages or turbines.
Although there has been significant progress in the development of carbon fibre-reinforced TP composites (CFRTP), challenges still need to be addressed. One such challenge is their high viscosity, which makes it difficult to manufacture a structure without voids and with uniform properties. This can result in higher processing temperatures and costs. 4 Additionally, the mechanical properties of CFRTP can vary greatly depending on the process parameters used in manufacturing the material. 5 However, advancements in out-of-autoclave processes, such as hot-pressing or laser-assisted automated tape placement (LATP), have sparked further investigation into CFRTP to understand better how different processing parameters can affect mechanical properties.6,7 The mechanical properties of CFRTP are influenced by various manufacturing parameters, including processing temperature, pressure, consolidation time, and cooling rates, as noted by Ma et al. 8 Post-processing heat treatments like annealing can also impact the material’s performance. Therefore, it is essential to clearly define variables such as temperature 9 or time10,11 to achieve optimal results.
Within various processing parameters, the cooling rate plays a significant role in controlling the microstructure, crystallinity, and, consequently, the mechanical properties of the composite material.12–14 The cooling rate varies from one manufacturing method to another. For example, the crystallinity of CF/Polyetheretherketone (PEEK) in the autoclave was approximately 40% due to slow cooling, while for LATP of the CF/PEEK, it was 17% due to fast cooling. 15 The fibre/matrix interface and the matrix ductility have been identified as critical parameters in the variation of mechanical properties.16,17 Previous research has extensively investigated the influence of cooling rate on CF-reinforced composites with various thermoplastic matrices such as PEEK,18–20 PA6, 21 PP 22 or PPS 23 and observed specific trends in terms of crystallinity and mechanical performance. Moreover, it is typically believed that as the cooling rate increases, the crystallisation temperature decreases,24,25 leading to a greater number of nuclei. This may result in the formation of smaller spherulites at relatively high cooling rates. However, an increased cooling rate typically reduces overall crystallinity, as mentioned above. While increased crystallinity lowers the impact strength, it does not necessarily affect the material’s toughness. 26 The reduced spherulite size has been reported to increase the yield stress of Nylon 66 polymer, 27 but the crystallinity of the tested samples varied from 45% to 52% in the meantime.
Within various TP matrices, PEEK has excellent chemical resistance, high-temperature stability, and high fracture toughness, making it ideal for aerospace and automotive applications where components face extreme environments.28,29 PEEK is a semi-crystalline polymer that impacts the failure of composites based on its crystallisation performance. 24 The level of crystallinity during manufacturing depends on the cooling rates.
Regarding CF/PEEK, the cooling rate does not significantly affect the longitudinally tensile/compressive properties such as strength and modulus.22,30 This is because the properties of the fibre have a more substantial influence than those of the matrix in that direction.12,18 On the other hand, the cooling rate and matrix crystallinity level strongly impact other properties. Decreasing the cooling rate improves the bond strength at the interface.18,31,32 Since bond strength and matrix are critical parameters in determining the composite’s in-plane shear and interlaminar properties, 16 slower cooling rates lead to enhanced interlaminar strength and other shear properties like modulus and strength.33,34 This trend is also observed in the flexural strength and elastic modulus.16,22,23 As the flexural modulus increases, the mode I and II fracture toughness decreases with decreasing cooling rate, but only up to a saturation level due to the opposing effects of matrix ductility and the fibre/matrix interface.13,19,21 It is also important to mention that as the fibre/matrix interface is a crucial parameter, the fibre’s presence may attenuate the cooling rate’s influence on the fracture toughness compared to the neat polymer. 23 In the meantime, CFs are possible nucleation sites for thermoplastics, leading to higher crystallinity, with an increase of up to 25% for CF/PEEK compared to neat PEEK. 35 Indeed, as fracture toughness is linked to the material’s brittleness, a slower cooling rate decreases the ductility of the composite as fewer amorphous zones are present.18,36 Lowering the cooling rate can also reduce the impact energy absorption and damage resistance due to the less tough and ductile matrix.20,30 Interlaminar shear stress (ILSS) behaviour in thermoplastic composites varies with cooling rates and matrix-fibre combinations, leading to inconsistent trends. Slower cooling enhances the ILSS of composites like CF/PEEK 18 , CF/PP 21 , and CF/PPS.34,37 Adhesion between fibre and matrix improves with slower cooling, possibly due to crystallinity nucleation sites on fibres. 37
To summarise, the cooling rate strongly influences the crystallinity of the matrix, leading to variations in the mechanical properties whose fibre/matrix interface and matrix strength are key parameters. Common trends have been observed, but several studies have also noticed opposite behaviour depending on the matrix type, such as the interfacial shear strength evolution of CF/PP and CF/PPS with the cooling rate.21,32 A transition in the matrix morphology, the matrix/fibre interface and the failure mode occurred at a specific cooling rate for CF/PEEK and CF/PPS.16,34
Additionally, a direct comparison of various fibre types on final crystallinity and mechanical properties, such as compressive strength (CS) and interlaminar shear strength (ILSS), still needs improvement. This gap presents a challenge in optimising process parameters for manufacturing CF/PEEK composites, aiming to attain matrix-dominant properties through precise modulation of their crystalline morphology and crystallinity and desired fibre-dominant properties through altering the fibre types.
This study investigates how different cooling rates affect the crystallinity, ILSS, and compressive properties of CF/PEEK composites manufactured using hot-pressing with CF/PEEK prepreg sheets. Four different cooling conditions were employed: cooling in the hot press with pressure, cooling in the hot press without pressure, air-cooled, and quenching in water. Temperature and cooling rates were recorded using thermocouples, and DSC and XRD were used to evaluate crystallinity. Focused Ion Beam (FIB) Etching and Scanning Electron Microscopy (SEM) were used to assess crystalline morphology. The ILSS was measured using a short beam shear (SBS) test, and compressive strength (CS) was measured using a combined loading compression (CLC) test.
Material and manufacturing
Materials
HTS45/PEEK prepregs were supplied by Teijin®, which are mentioned as HTS in the manuscript. The technical properties of HTS can be found in the manufacturer’s datasheet. 38
Preparation of prepregs
To manufacture eight laminates with HTS fibres under four different cooling conditions, twenty layers of CF/PEEK prepregs measuring 160 mm × 160 mm with unidirectional fibres were utilised. To determine the cooling rate, a Type K thermocouple with a 0.3 mm diameter and temperature range of -200°C to 1100°C was placed to measure the temperature history of all samples. Initially, eight thermocouples were embedded between layers to measure the temperature difference, but only a maximum difference of 1°C was found. Therefore, two thermocouples were used for actual samples, placed between the top two and bottom two layers.
Manufacturing
The composite laminates were manufactured using a Carver hot press at the University of Limerick, Ireland. The stacking of prepreg sheets was sandwiched between two aluminium plates with two Polyimide (PI) sheets, as shown in Figure 1. A release agent, Freekote, was applied on both the aluminium plates and PI sheet to avoid sticking of molten material. The assembly was consolidated in a hot press at 385°C for 60 min under 7 bar pressure. Schematic of the hot-press manufacturing.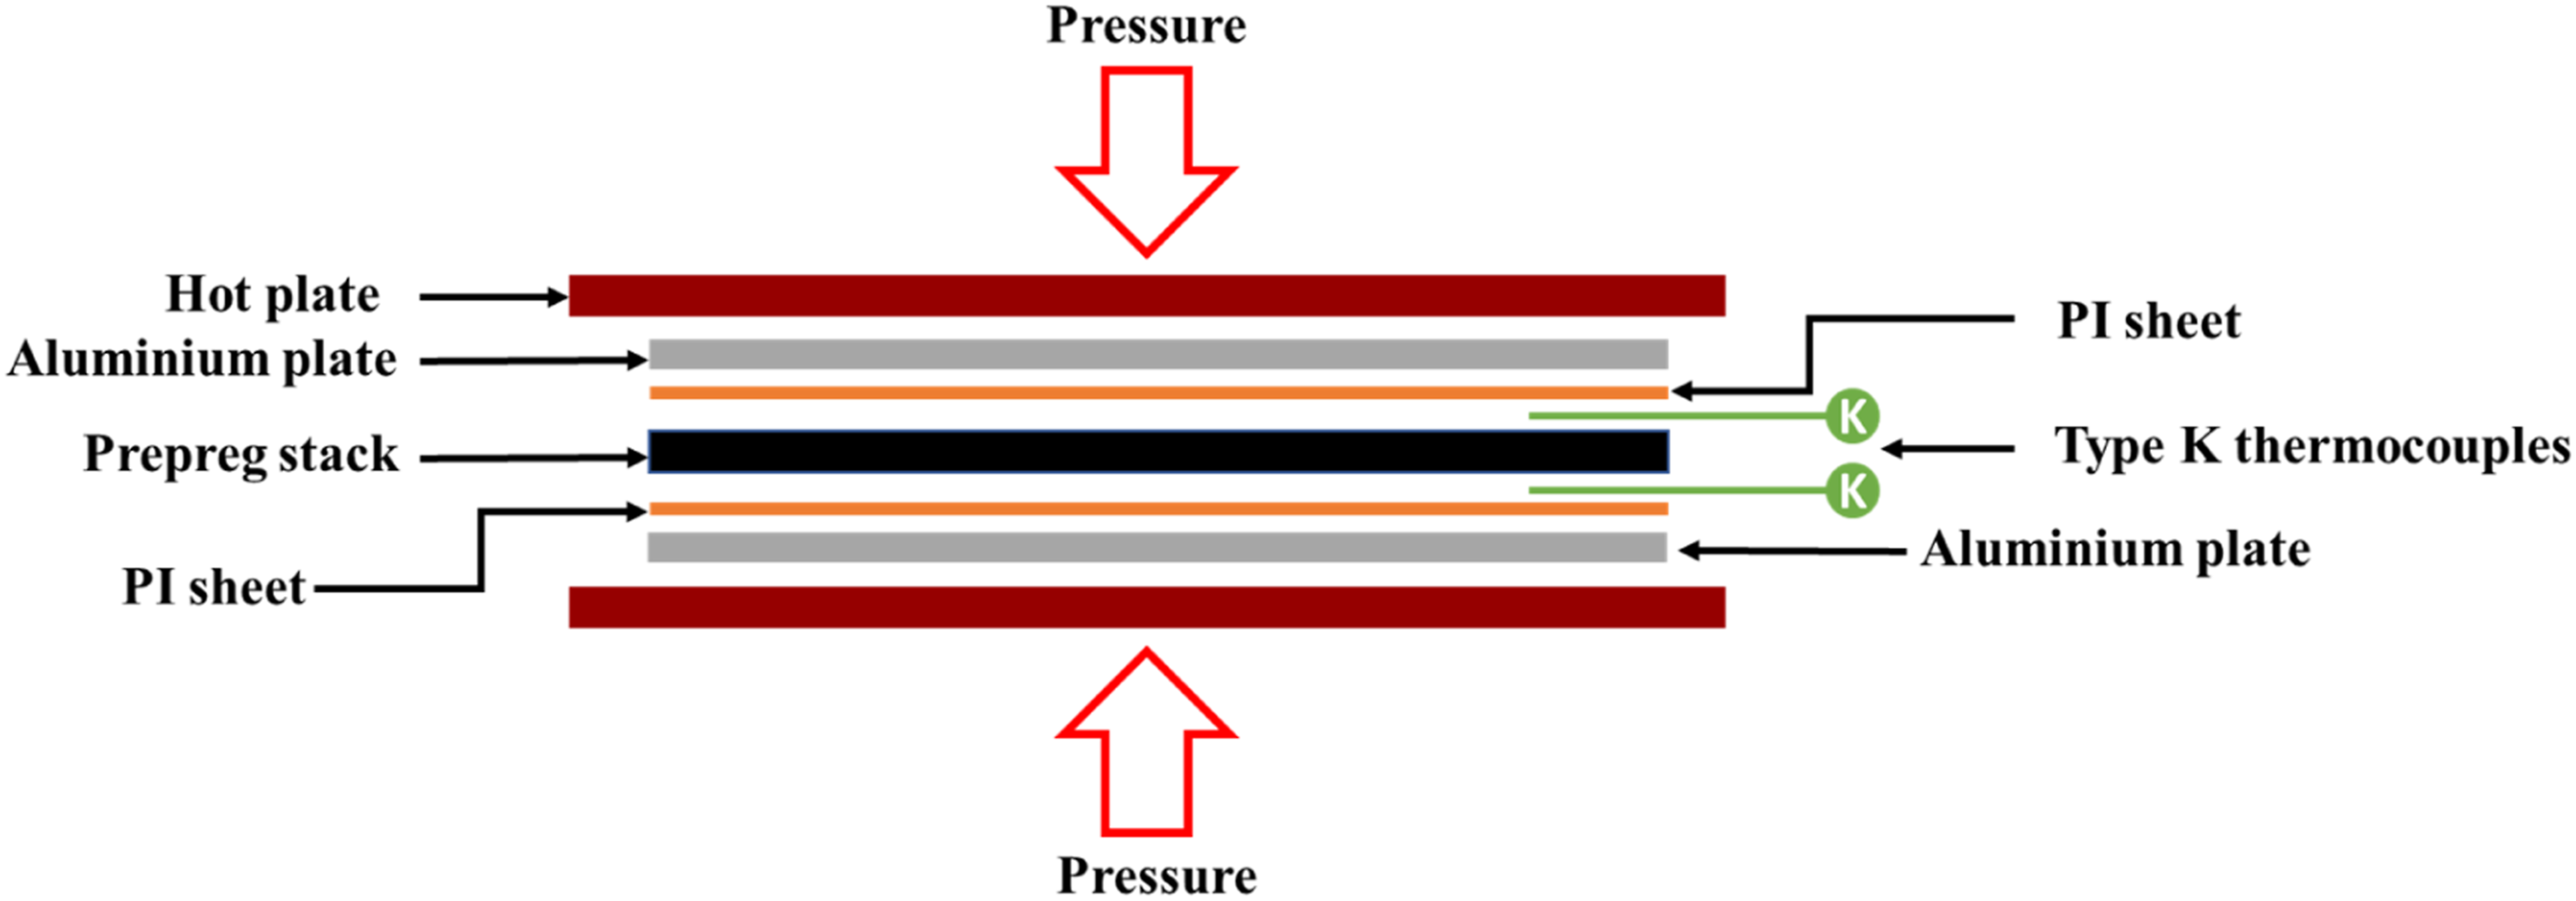
Cooling conditions
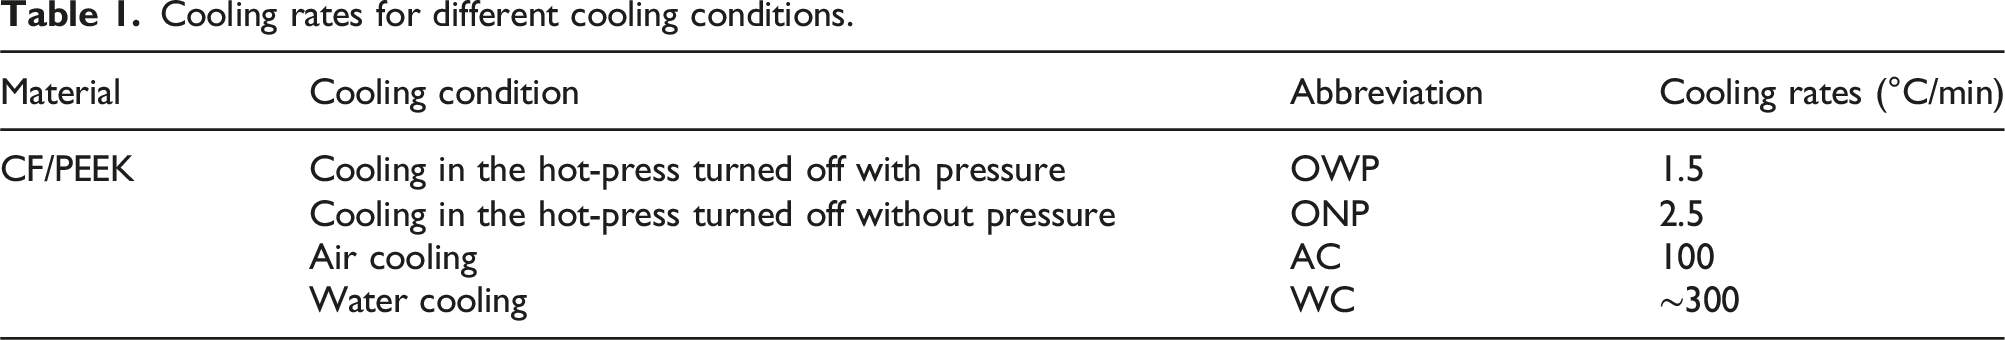
As soon as manufacturing was completed, laminates were cooled to room temperature by four cooling conditions to attain different cooling rates: • Cooling in the hot press with pressure (OWP) (Furnace cooling) • Cooling in the hot press without pressure (ONP) (Furnace cooling) • Air cooling: Removing laminates from the hot press and allowing them to cool at room temperature (AC) • Quenching: As soon as the consolidation cycle was finished, the laminates were removed from the hot press and put in a water bath (WC)
For the CF/PEEK composites, cooled with OWP, ONP and AC conditions, the temperature history was continuously recorded using a data acquisition system attached to the thermocouples. The system has a sampling rate of 1 point per minute. The variation of cooling rates for different samples is shown in Figure 2. It was known that the crystallisation temperature range varies with the cooling rate. As noted by Tierney et al.,
39
at a low cooling rate of 0.6 to 60°C/min, the crystallisation temperature range was from 320°C to 190°C, and the increase of cooling rate resulted in the crystallisation temperature range to a lower value. So, for OWP and ONP conditions, the cooling rate was calculated by linear fitting at a temperature range from approximately 360°C to 190°C. In contrast, for AC condition, the cooling rate was linear fitted at a temperature range of 320°C to 150°C. The details of CF/PEEK composites and their cooling rates are listed in Table 1. Due to the high cooling rate of WC condition, the cooling rate was approximately 300°C/min.
40
The tangent lines at the start and end of the selected temperature ranges of the OWP and ONP cases are shown in Figure 2(b). It should also be noted that a higher cooling rate results in a greater temperature gradient during cooling, while in the present study, the cooling rate of the surface was used to represent the overall cooling rate, which may introduce overestimation in the interpretation of results related to cooling rate. (a) Temperature history of CF/PEEK composites under different cooling conditions and (b) tangent lines at the start and end of the selected temperature ranges. Cooling rates for different cooling conditions.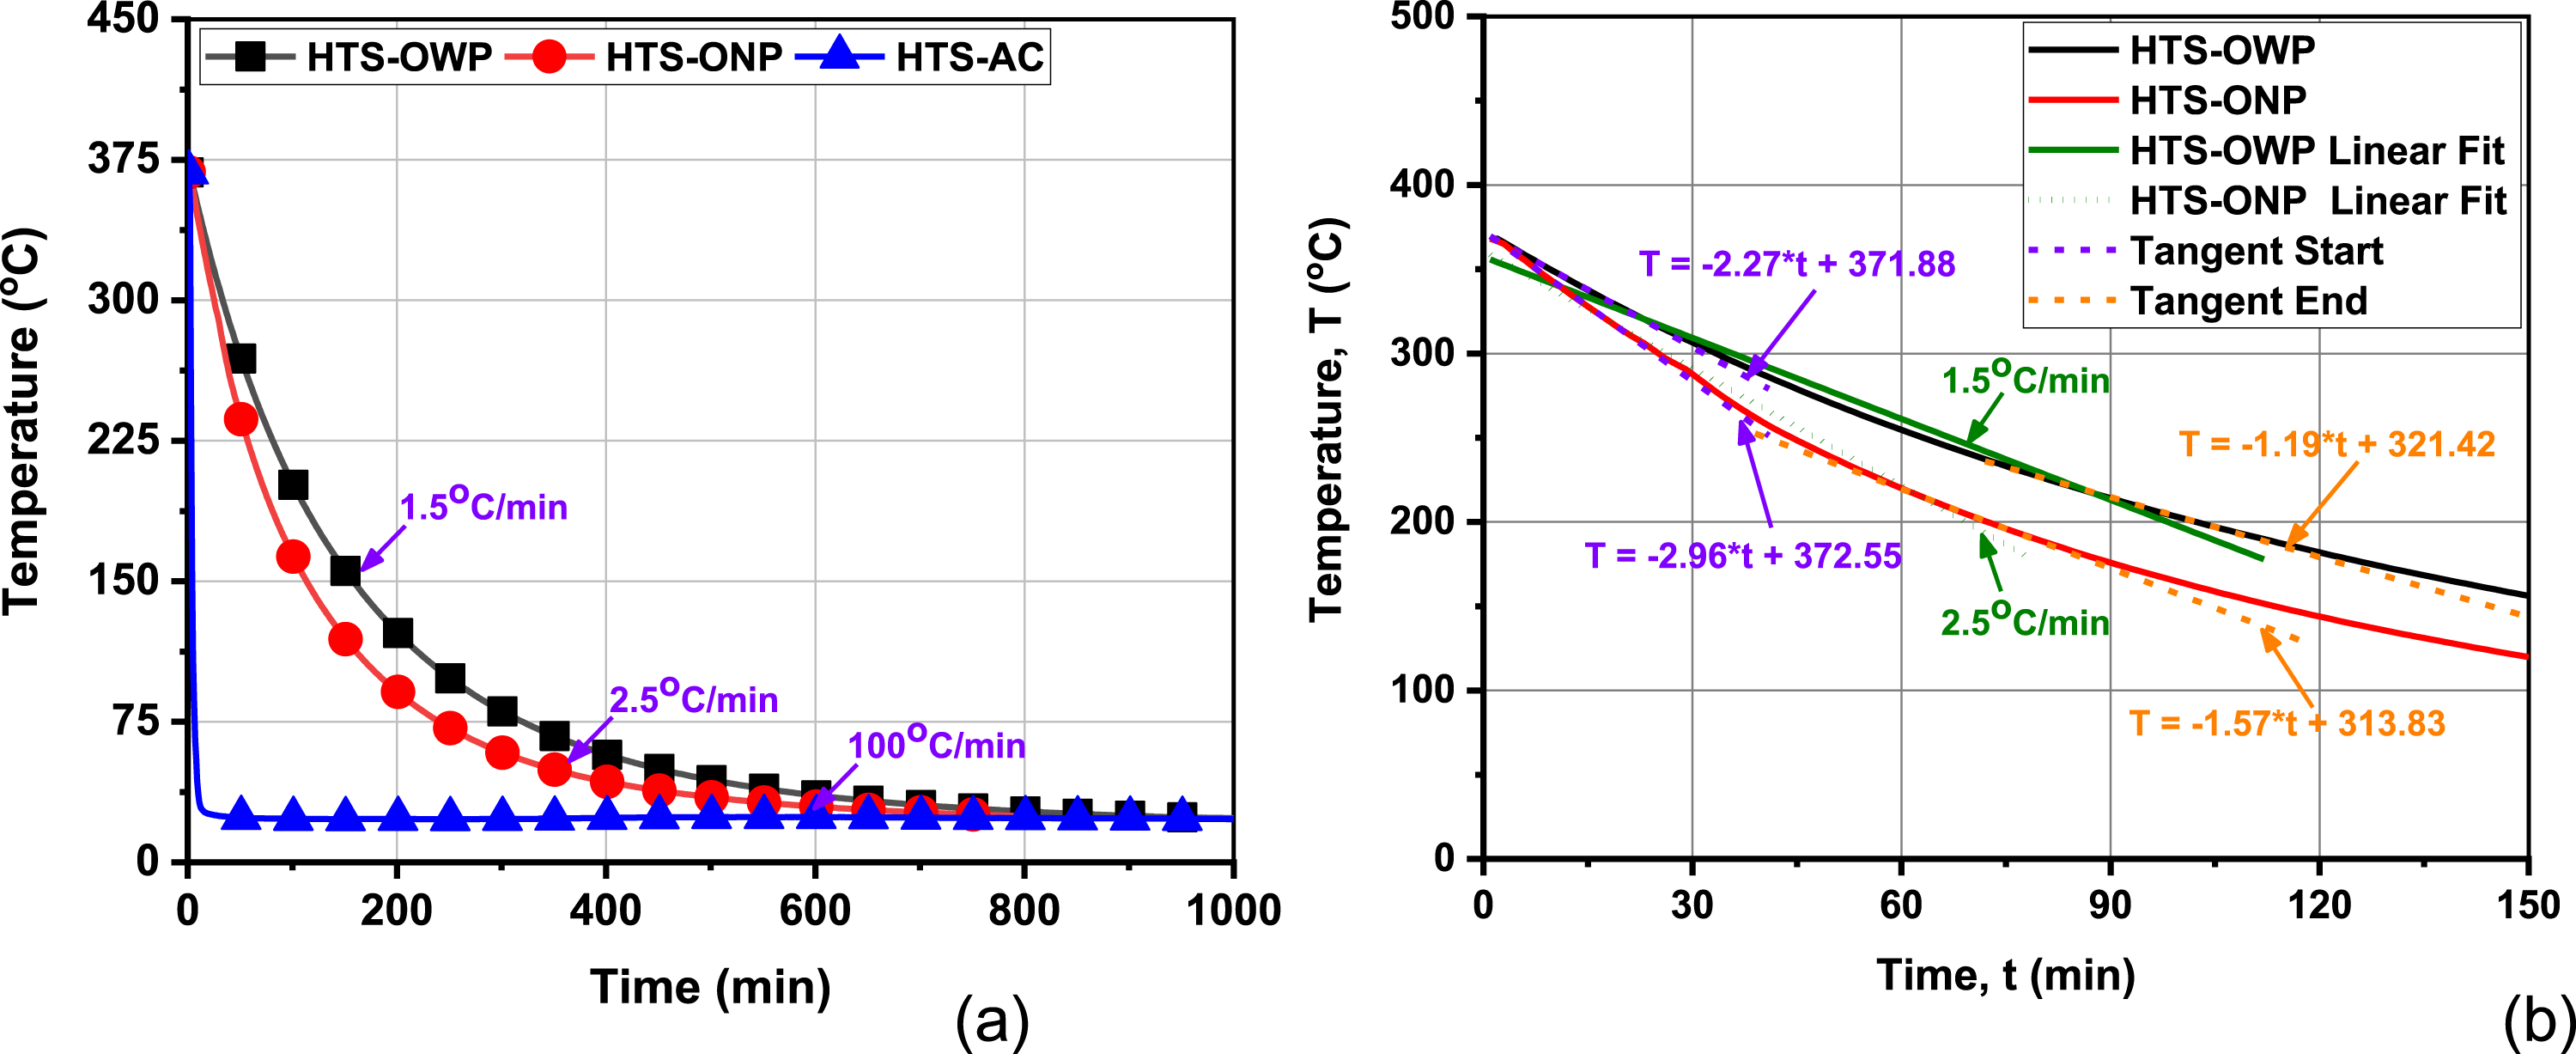
Physical properties
Physical properties such as thickness, fibre volume fraction (FVF), and density were measured as per ASTM D792 and ISO14127 standards. Each sample’s thickness was measured at six different points. The density was measured using a Sartorius density measurement apparatus (0.00001 units) based on the water displacement method. The FVF of each sample was estimated as per ISO 14127. Void content was obtained from high-resolution optical micrographs using image analysis software (Image J®).
Crystallinity
The crystallinity was calculated using two different methods: differential scanning calorimetry (DSC) and X-ray diffraction analysis (XRD).
Differential scanning calorimetry
The crystallinity was measured using a Netzch Polyma 214 system. Specimens of approximately 5-8 mg were analysed from 20°C to 450°C at a heating rate of 10°C/min. The specimens were kept at 450°C for 5min and then cooled to 20°C at a cooling rate of 10°C/min. The degree of crystallinity is measured by: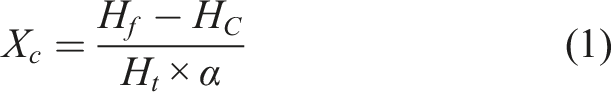
X-ray diffraction
The crystallinity of CF/PEEK composites was estimated using XRD Empyrean with a Cu-Kα radiation at 40 mA and 45 kV, scanning 2 theta from 10° to 35° at 1°/min in a continuous mode. The crystallinity was determined as the ratio of the integrated intensity of the crystalline phase to the integrated intensity of the amorphous and crystalline phases, as shown in equation (2):
Crystalline morphology
To determine the morphology of the crystallites, the Focused Ion Beam (FIB) etching technique was used, as described in Ref. 41 This technique helps reveal the crystalline structure, and the appropriate detailed images were captured using Scanning Electron Microscopy (SEM). The energy intensity used for etching plays a crucial role. Crystalline regions have a higher binding energy of molecular structure, while amorphous regions have a higher ablation rate. Thus, the crystalline structure is exposed after etching, and the surface height is observed with an electron detector on a microscope. Based on the quantity of ordered polymer chains, it is possible to distinguish three morphological structures: purely amorphous polymer, crystallite phase (early crystallisation stage), and spherulites (circular superstructures). 42
Etching was performed using a Gatan MET-ETCH (Model 691) at the University of Limerick, Limerick, Ireland, a precision ion polishing system, for 75 min for each sample. The beam energy of 6 keV, a tilt angle of 45°, and a rotation speed of 6 rpm revealed the morphologies. Then, the morphologies were observed in a Hitachi SU3800 SEM.
Interlaminar shear strength
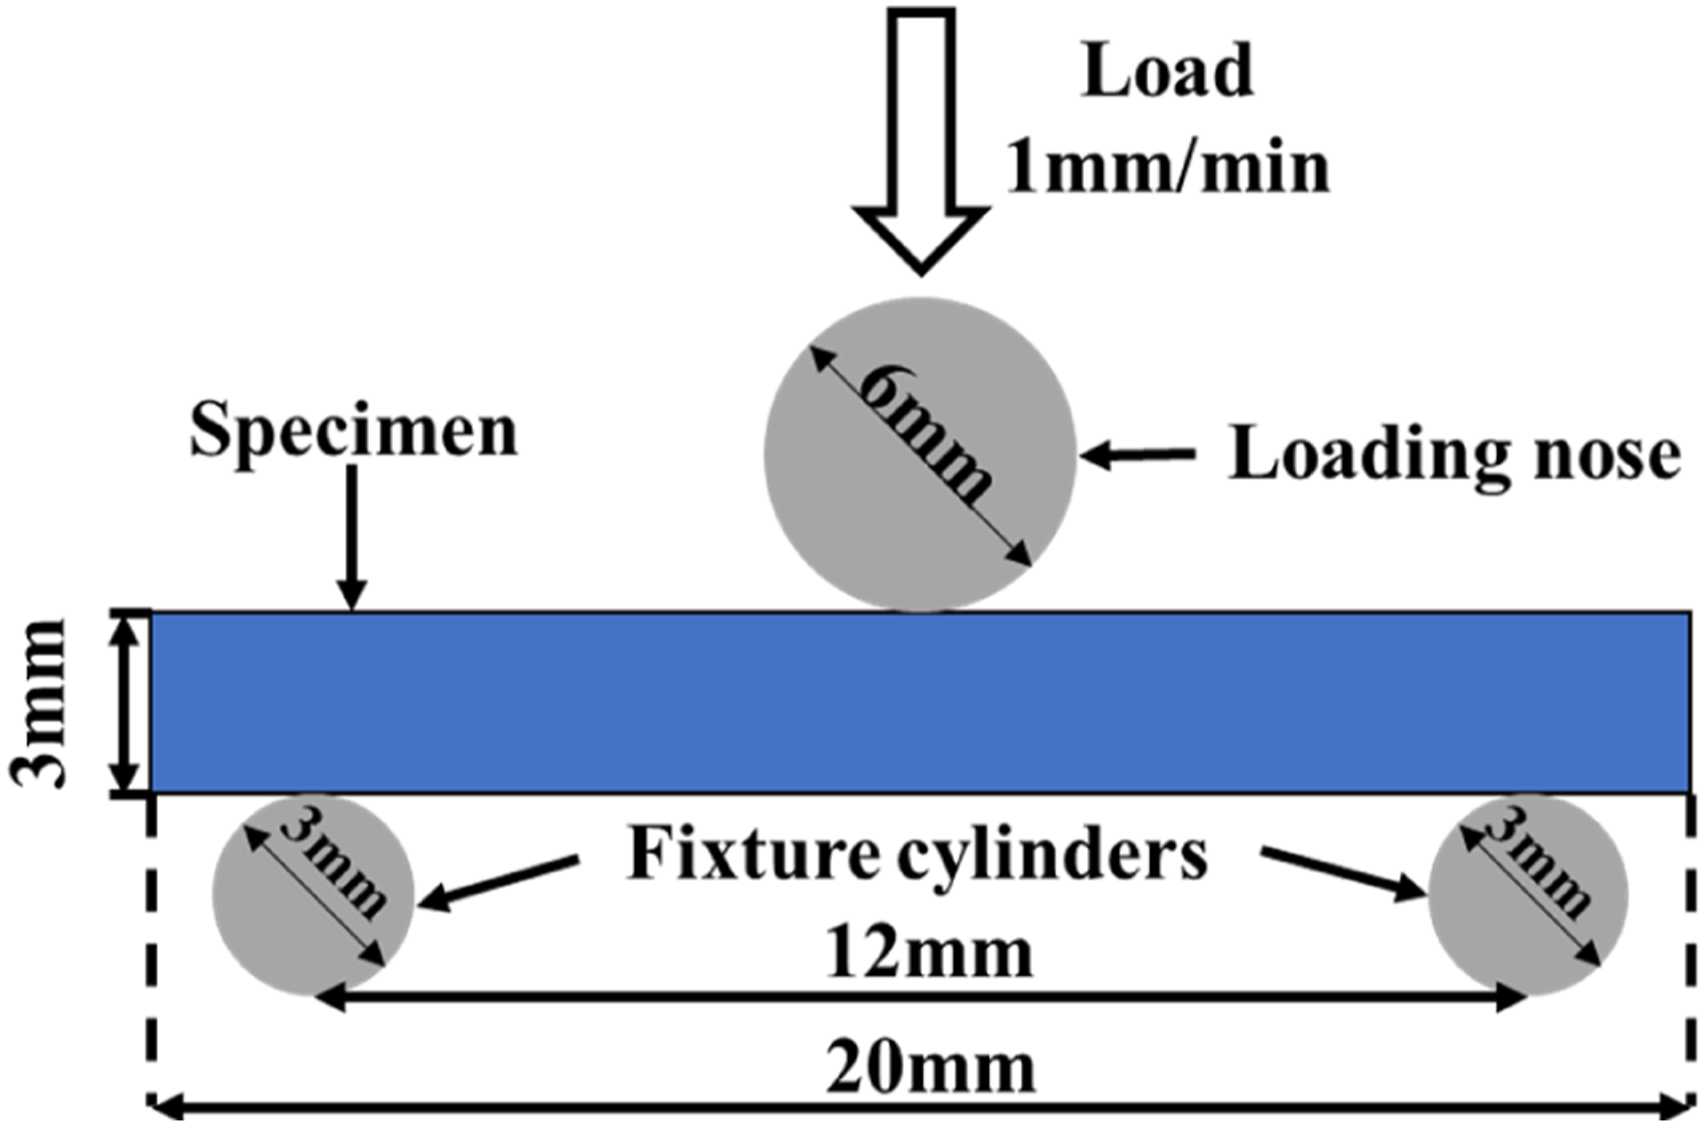
A Tinius Olsen HK25S with a 10 kN load cell was used to measure ILSS using ASTM D2344 with a 1 mm/min loading rate. Specimens with nominal dimensions 20 mm × 10 mm were set on a horizontal fixture with the cylindrical rollers, as shown in Figure 3. Five samples were tested for each cooling condition, and their average ILSS was presented. The ILSS (MPa) was calculated based on the maximum load P
s
(N), the specimen’s width w (mm) and thickness t (mm), using the equation (3): Schematic of the short beam shear test.
Compressive strength
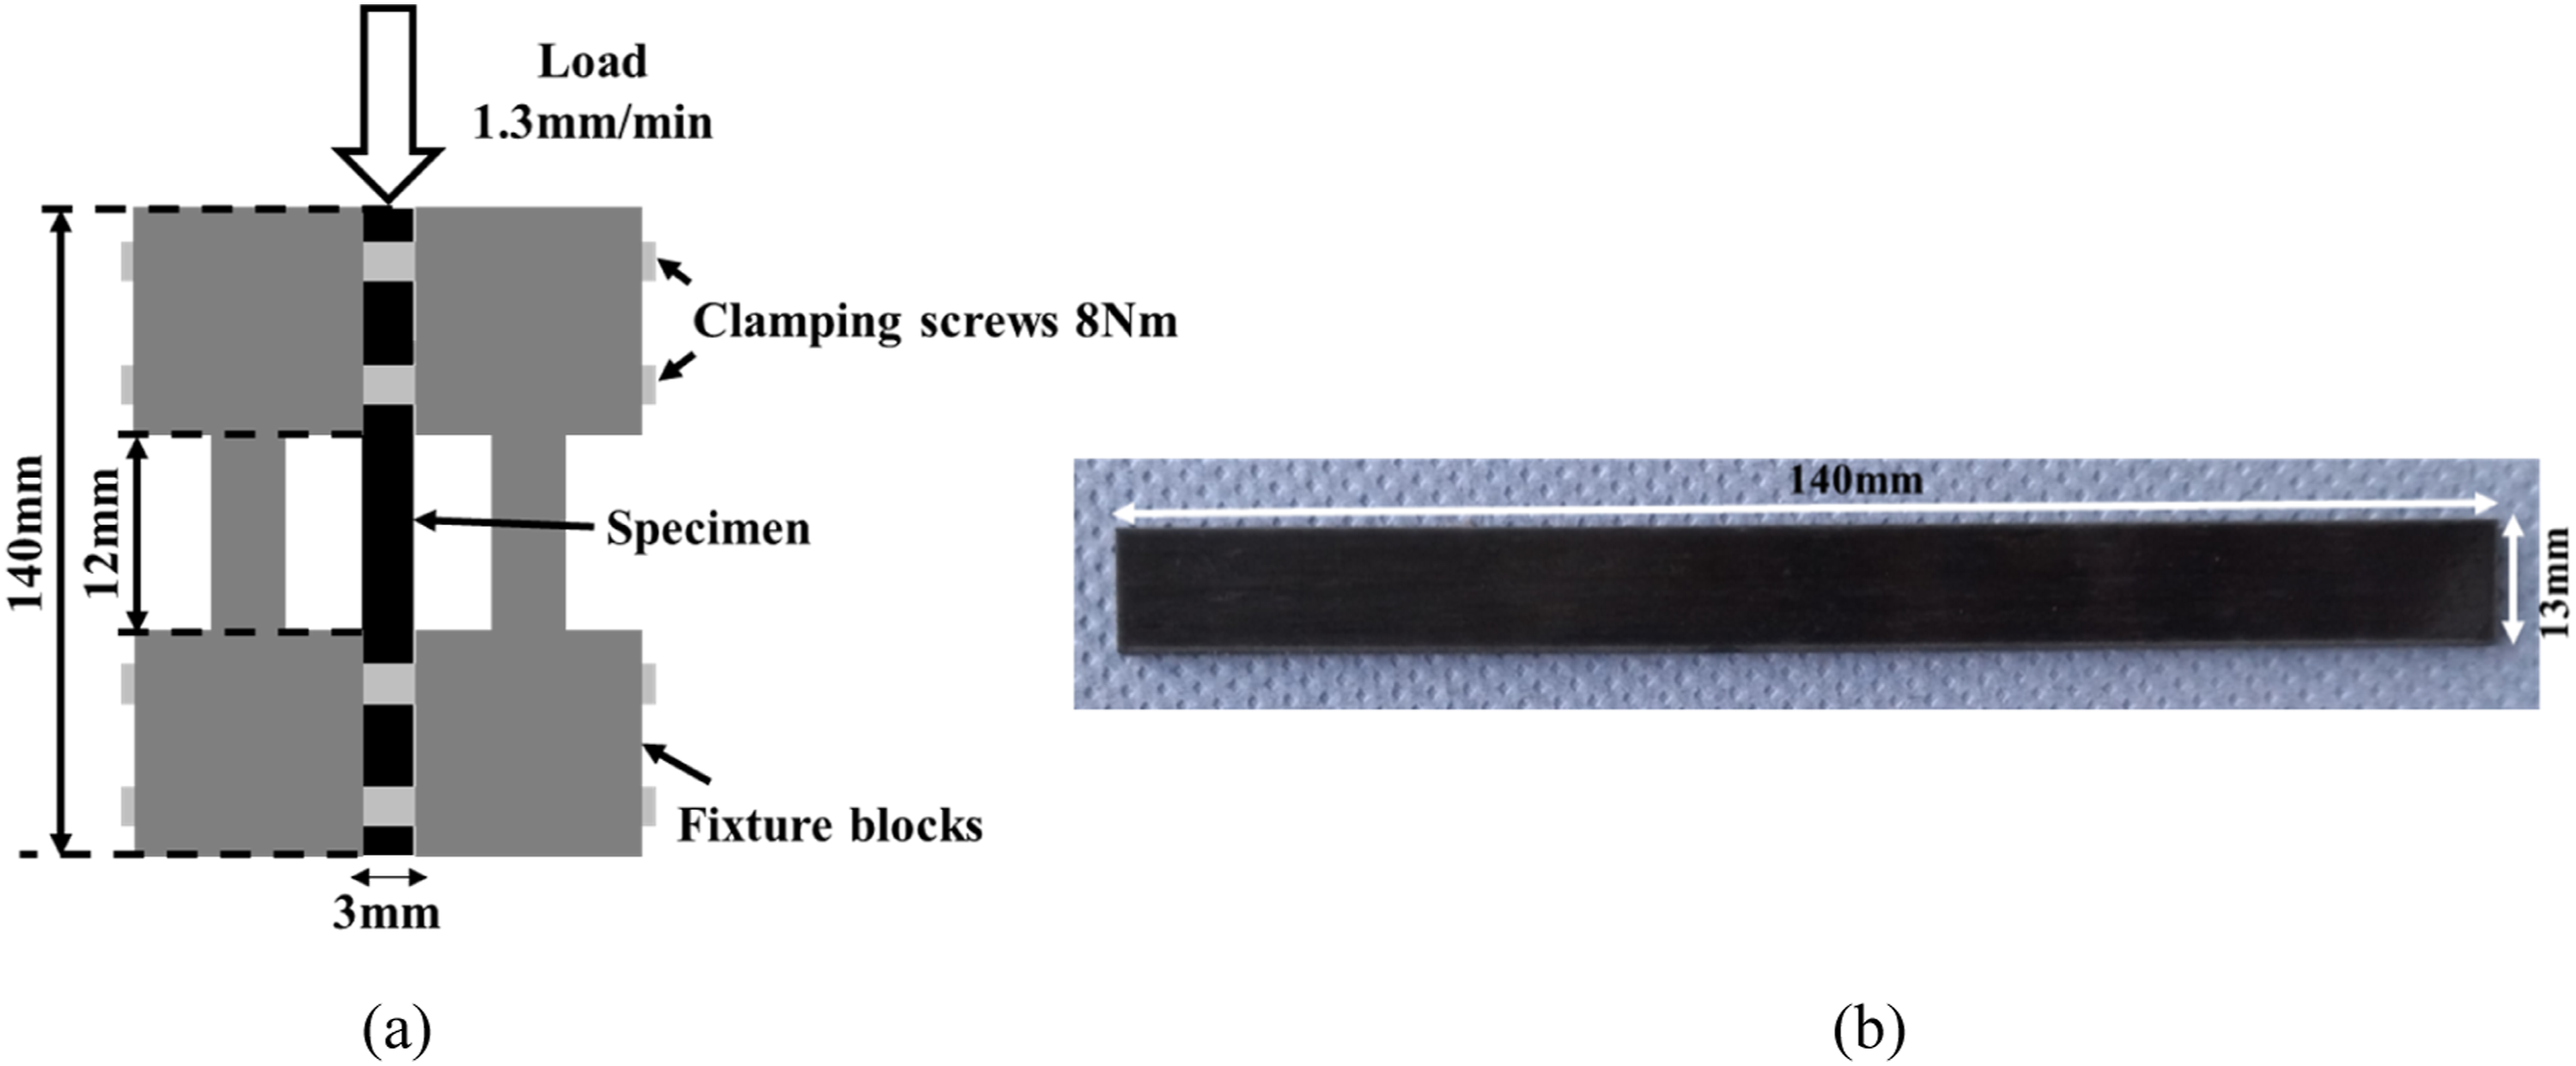
The test was carried out using Zwick 100 kN equipment at a 1.3 mm/min loading rate. Sample with a nominal dimension of 140 mm × 13 mm × 3 mm were set in a CLC test fixture, as shown in Figure 4, with a gauge length of 12 mm. Compressive strength was measured using combined loading compression (CLC) test as per ASTM D6641. Five samples for each cooling condition were tested and their average compressive strength was presented. The compressive strength σ
c
(MPa) was calculated based on the maximum load F
c
recorded (N) and the specimen’s width w and thickness t (mm), using the equation (4): CLC test: (a) Schematic of test setup and (b) test sample.
Results and discussion
Physical properties
Variation in physical properties of CF/PEEK composites with cooling rate.
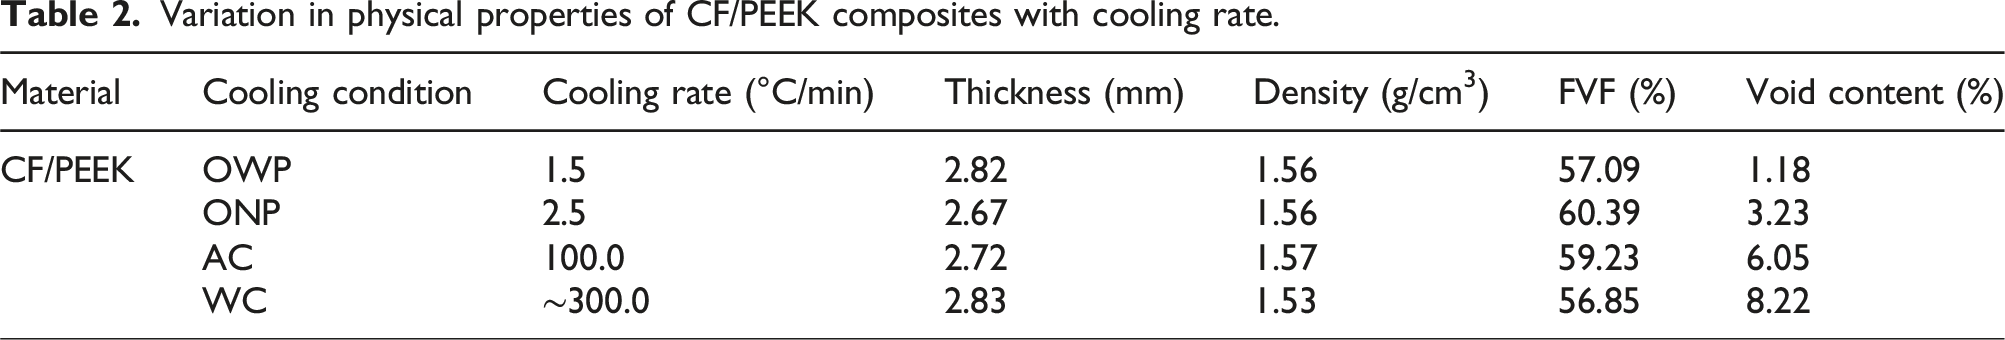
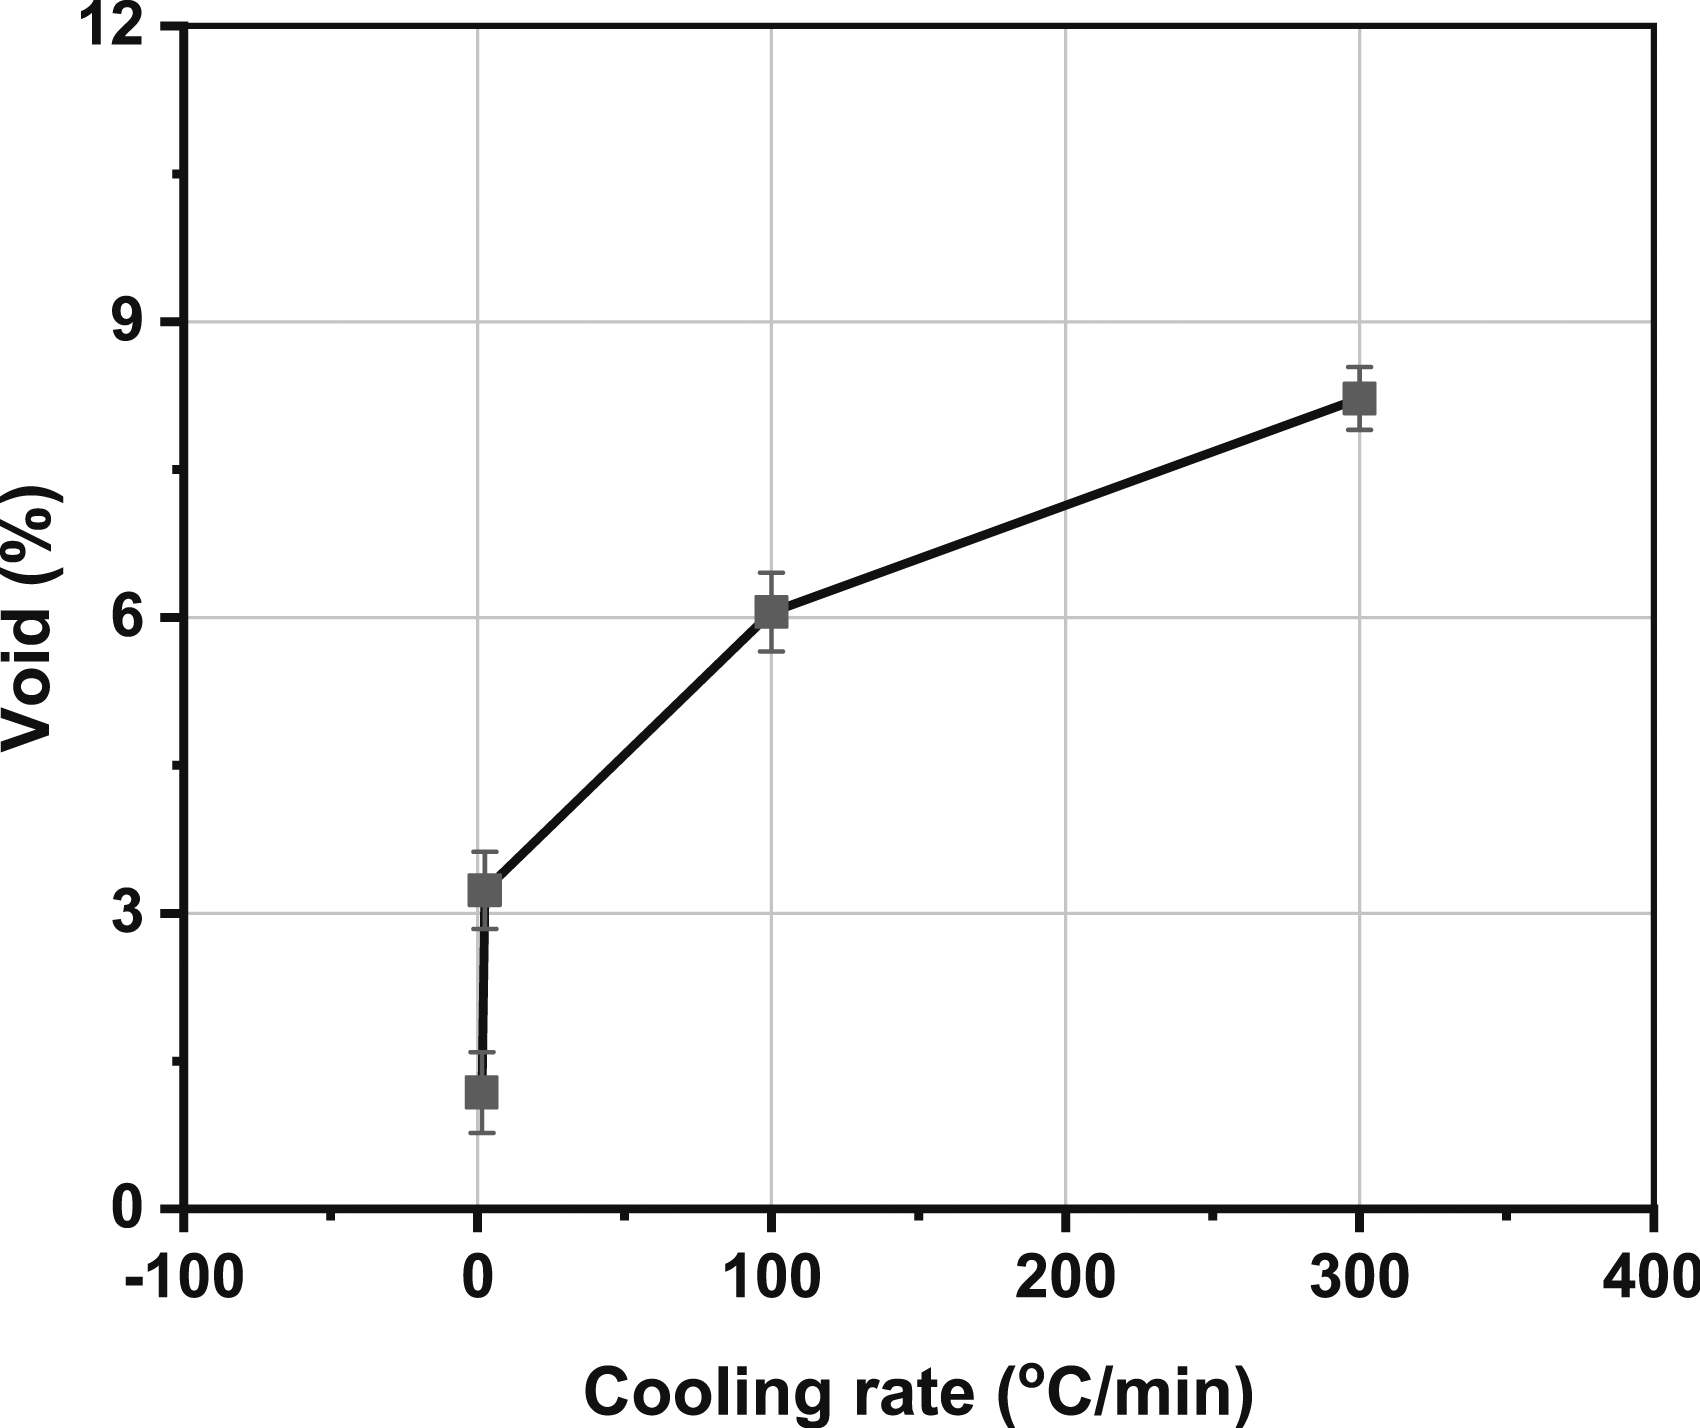
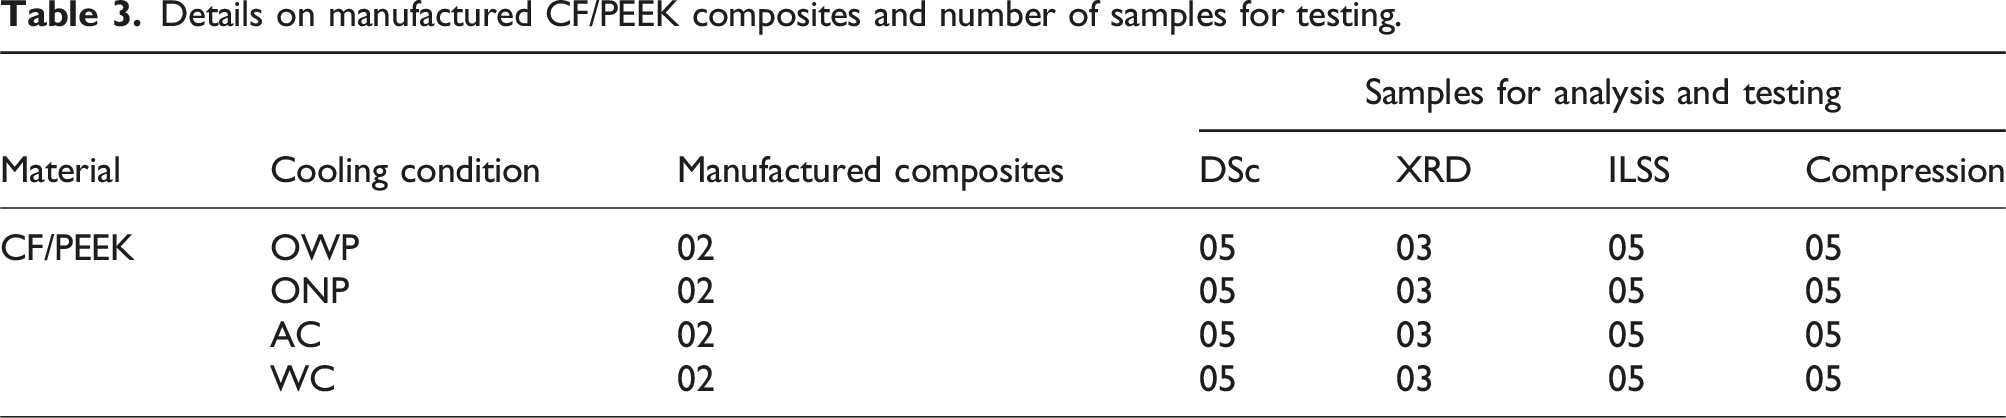
The formation of voids in each sample was assessed through optical microscopy, shown in Figure 5, and the variation is shown in Figure 6. The void content increased with the cooling rate. The slower cooling allows more time to evacuate trapped gases and reduces the likelihood of void formation. The most noticeable increase in void content occurred between OWP and ONP specimens. This may be explained by the pressure applied during the cooling of those samples, which contributed to the fewer void formations in OWP samples as the plies were more closely compacted than ONP. In the case of void content in AC and WC samples, the shape of voids was very significant in size. For all the cooling rates, the variation and the trend were almost the same, confirmed by the optical micrographs. Table 3 details the number of CF/PEEK composites manufactured for each cooling condition and tested samples. Optical micrographs of voids for CF/PEEK composites (OWP: 1.5°C/min, ONP: 2.5°C/min, AC: 100°C/min: WC: ∼300°C/min). Variation of void content with cooling rate. Details on manufactured CF/PEEK composites and number of samples for testing.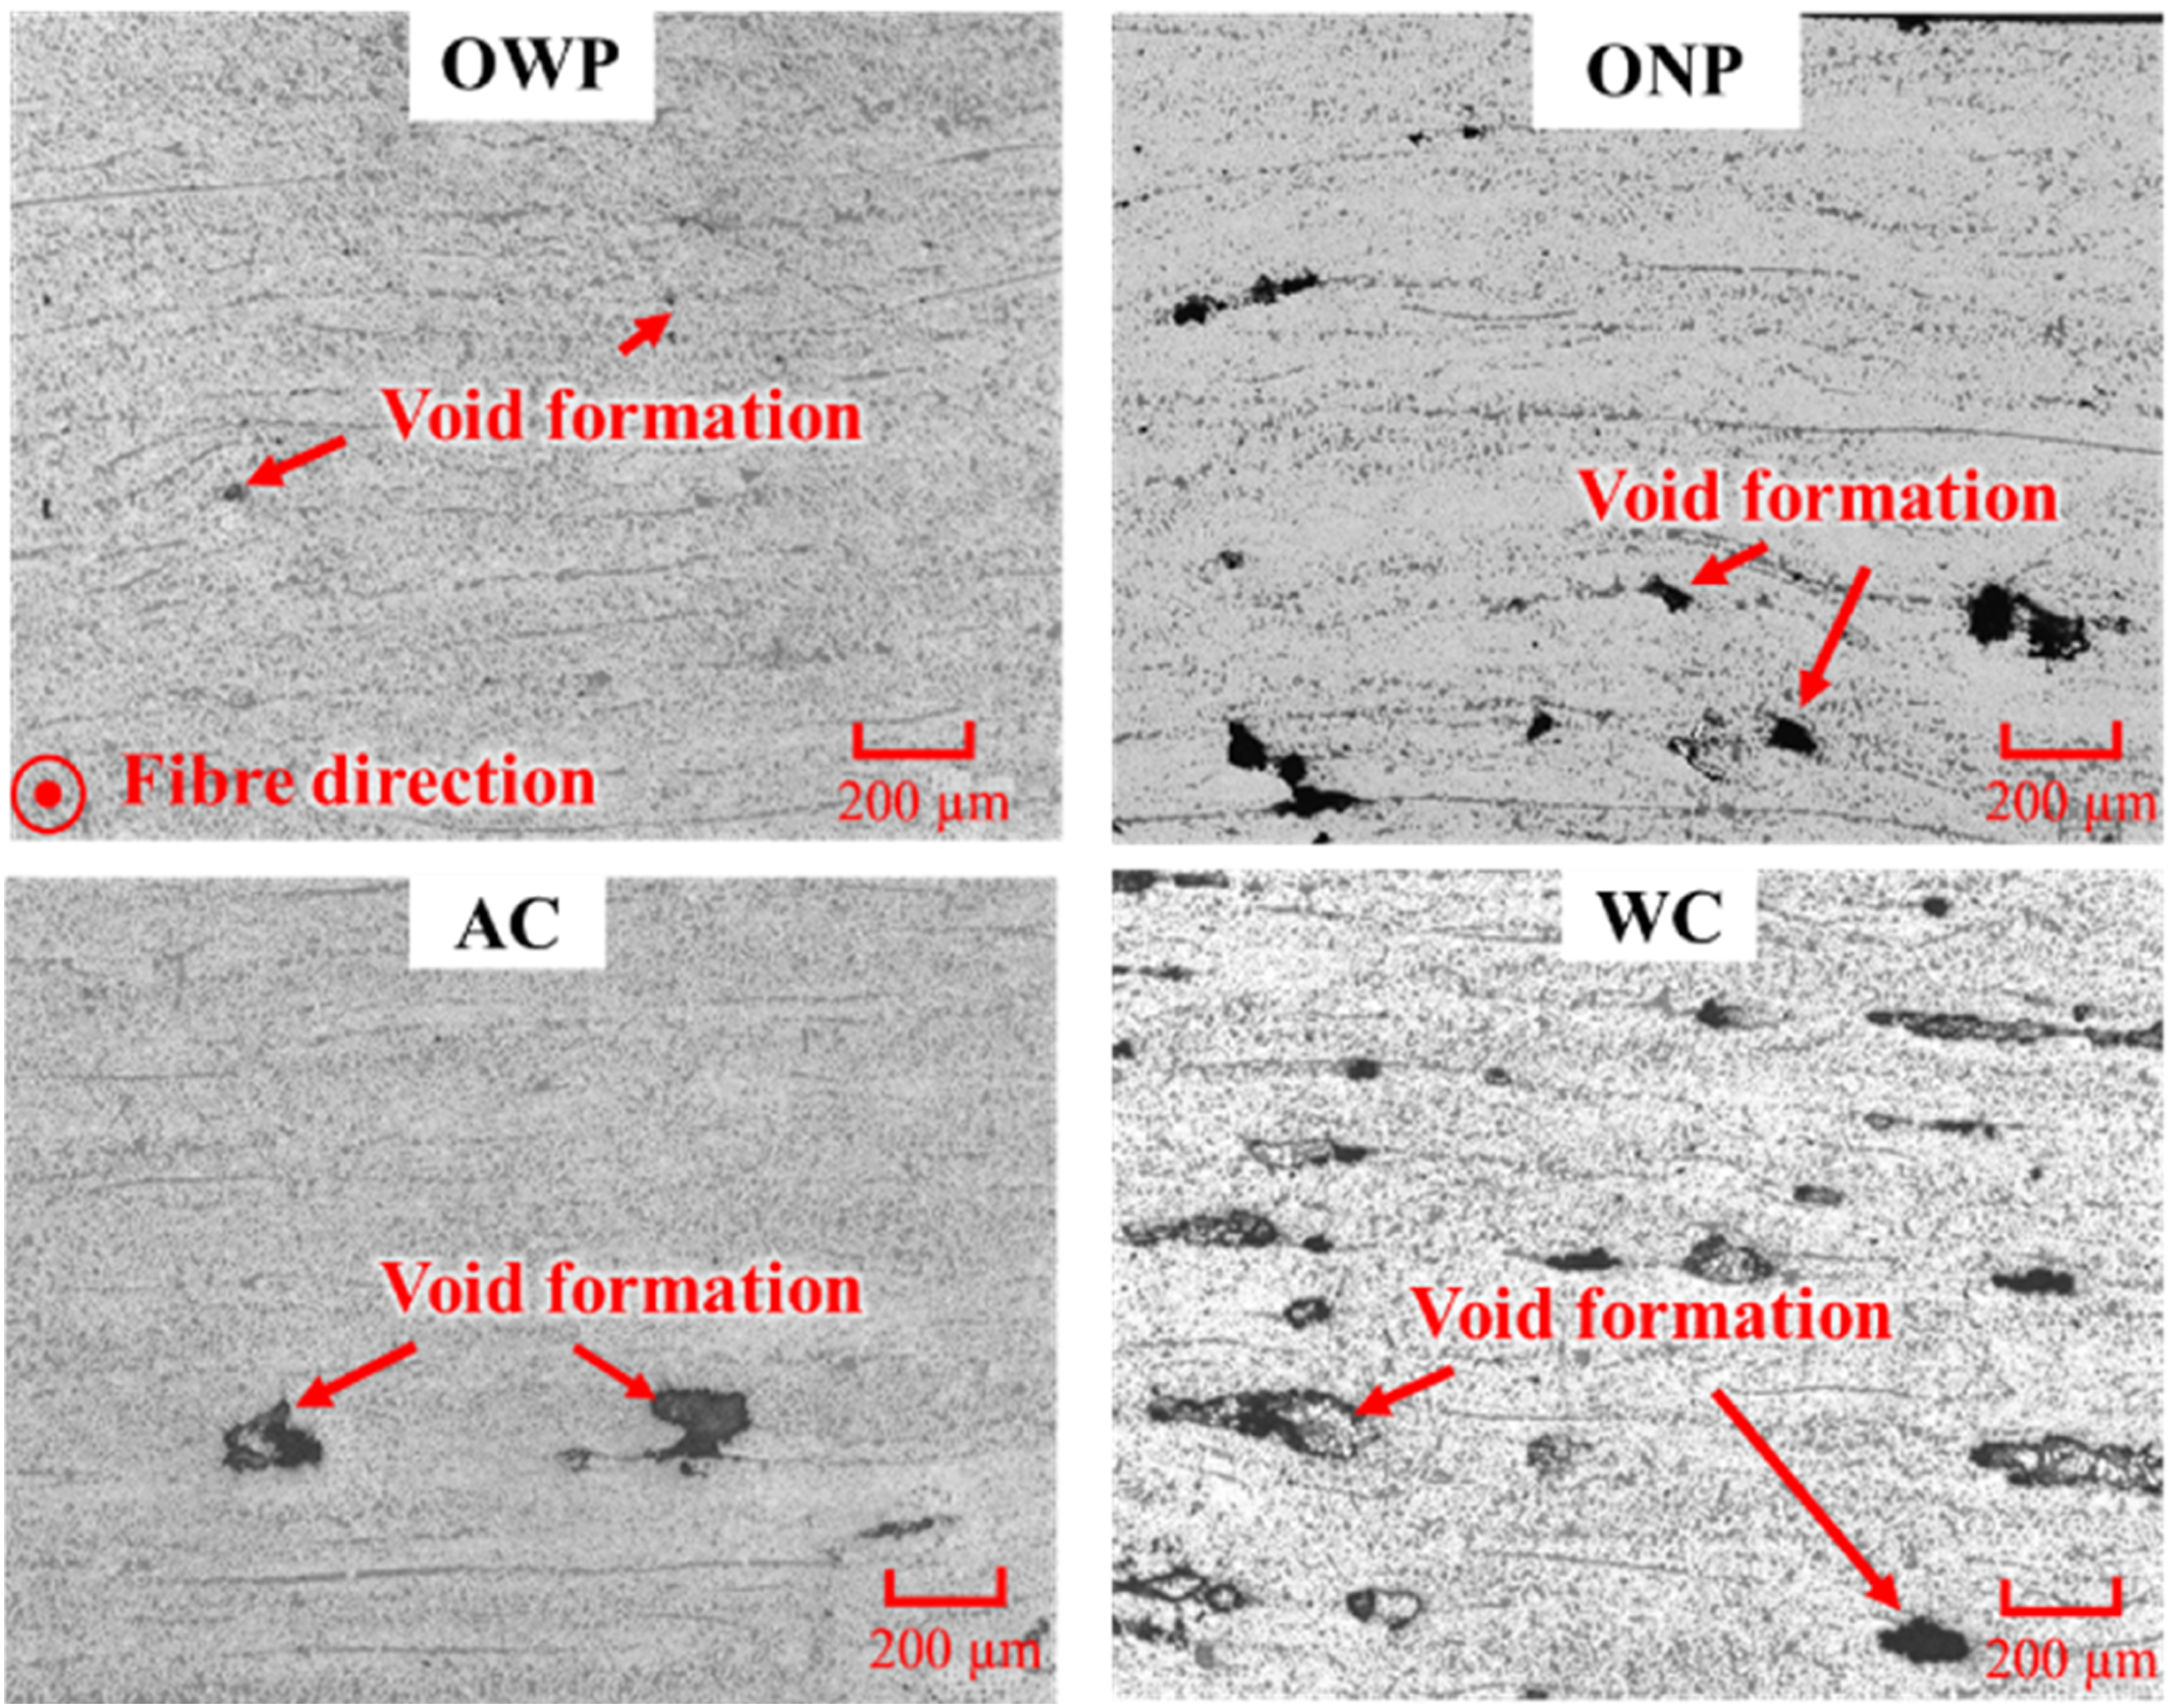
Crystallinity
DSC
The crystalline phase’s melting behaviour was analysed by examining the crystallisation of CF/PEEK. Figure 7 shows that in both the CF/PEEK composites, an exothermic peak becomes increasingly visible as the cooling rate increases. When subjected to thermal treatment, cold crystallisation is activated at a Tg and Tm temperature range due to the rearrangement of polymer chains from the rest of the amorphous regions. A material with low crystallinity is expected to exhibit a more noticeable cold crystallisation exothermic peak. During a subsequent heating cycle, such as a DSC heating scan, uncrystallised polymers will crystallise after absorbing enough energy at a high temperature. DSC curves of CF/PEEK composites processed under different cooling rates.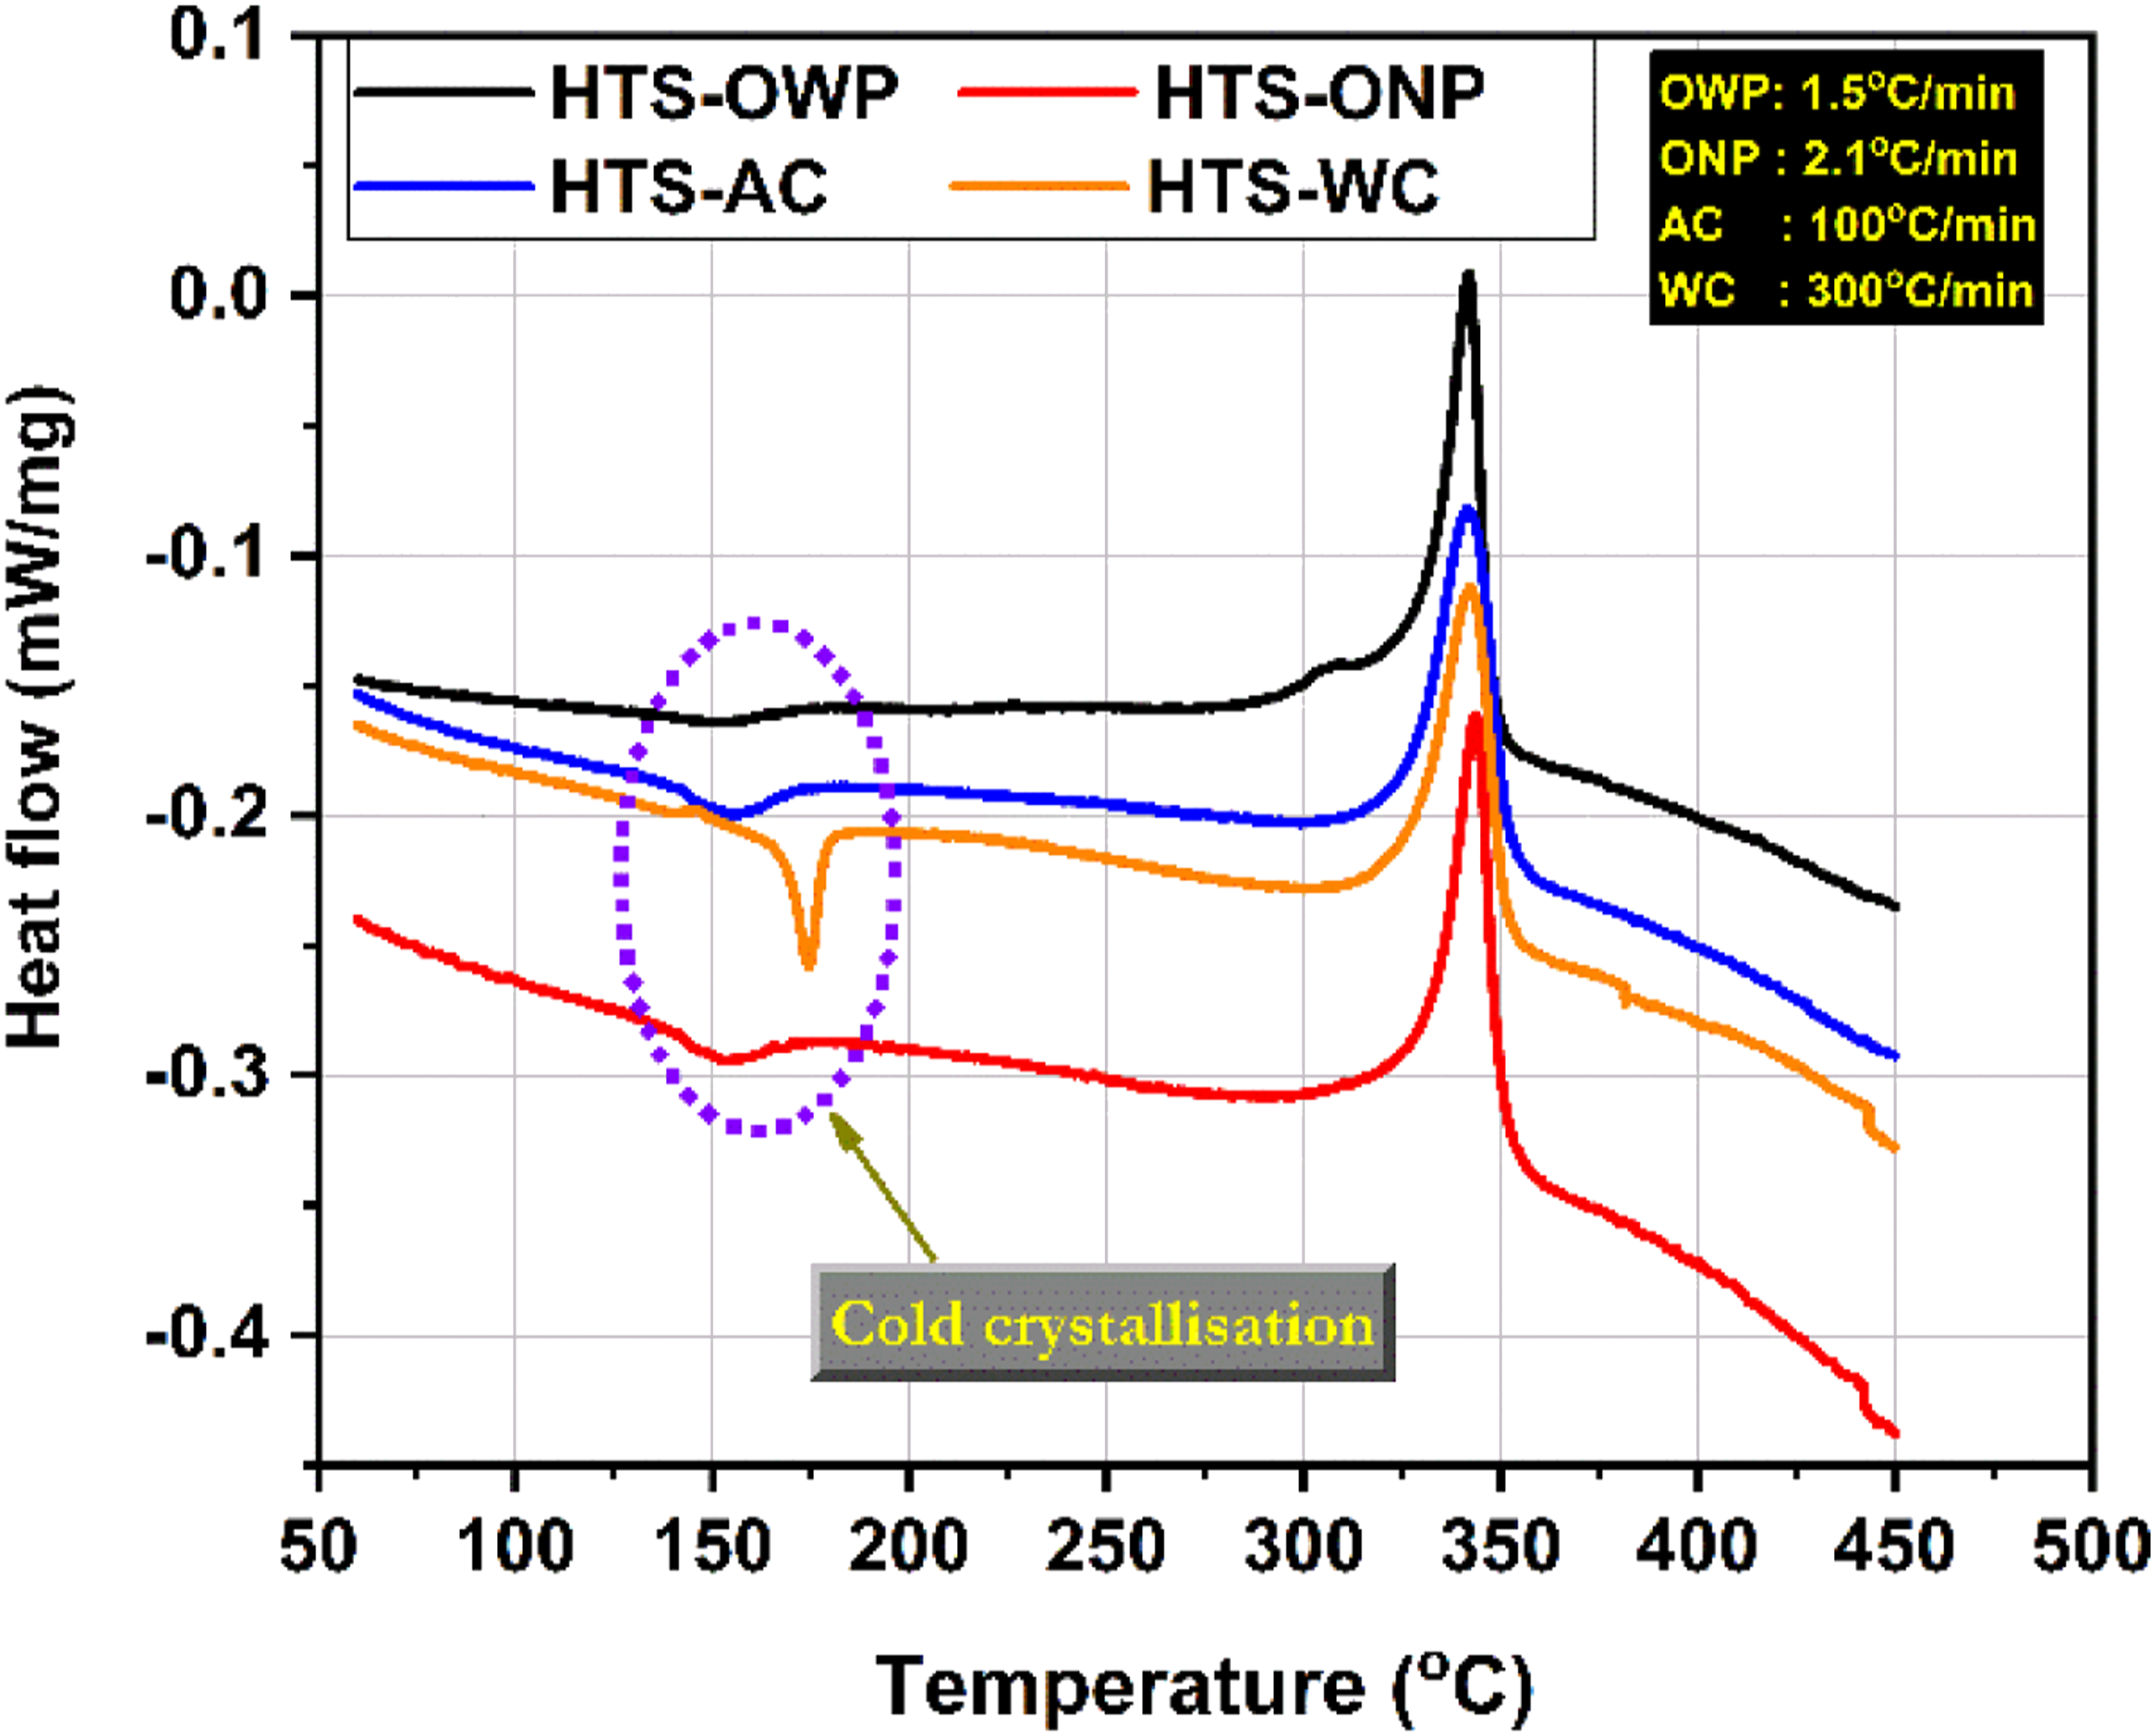
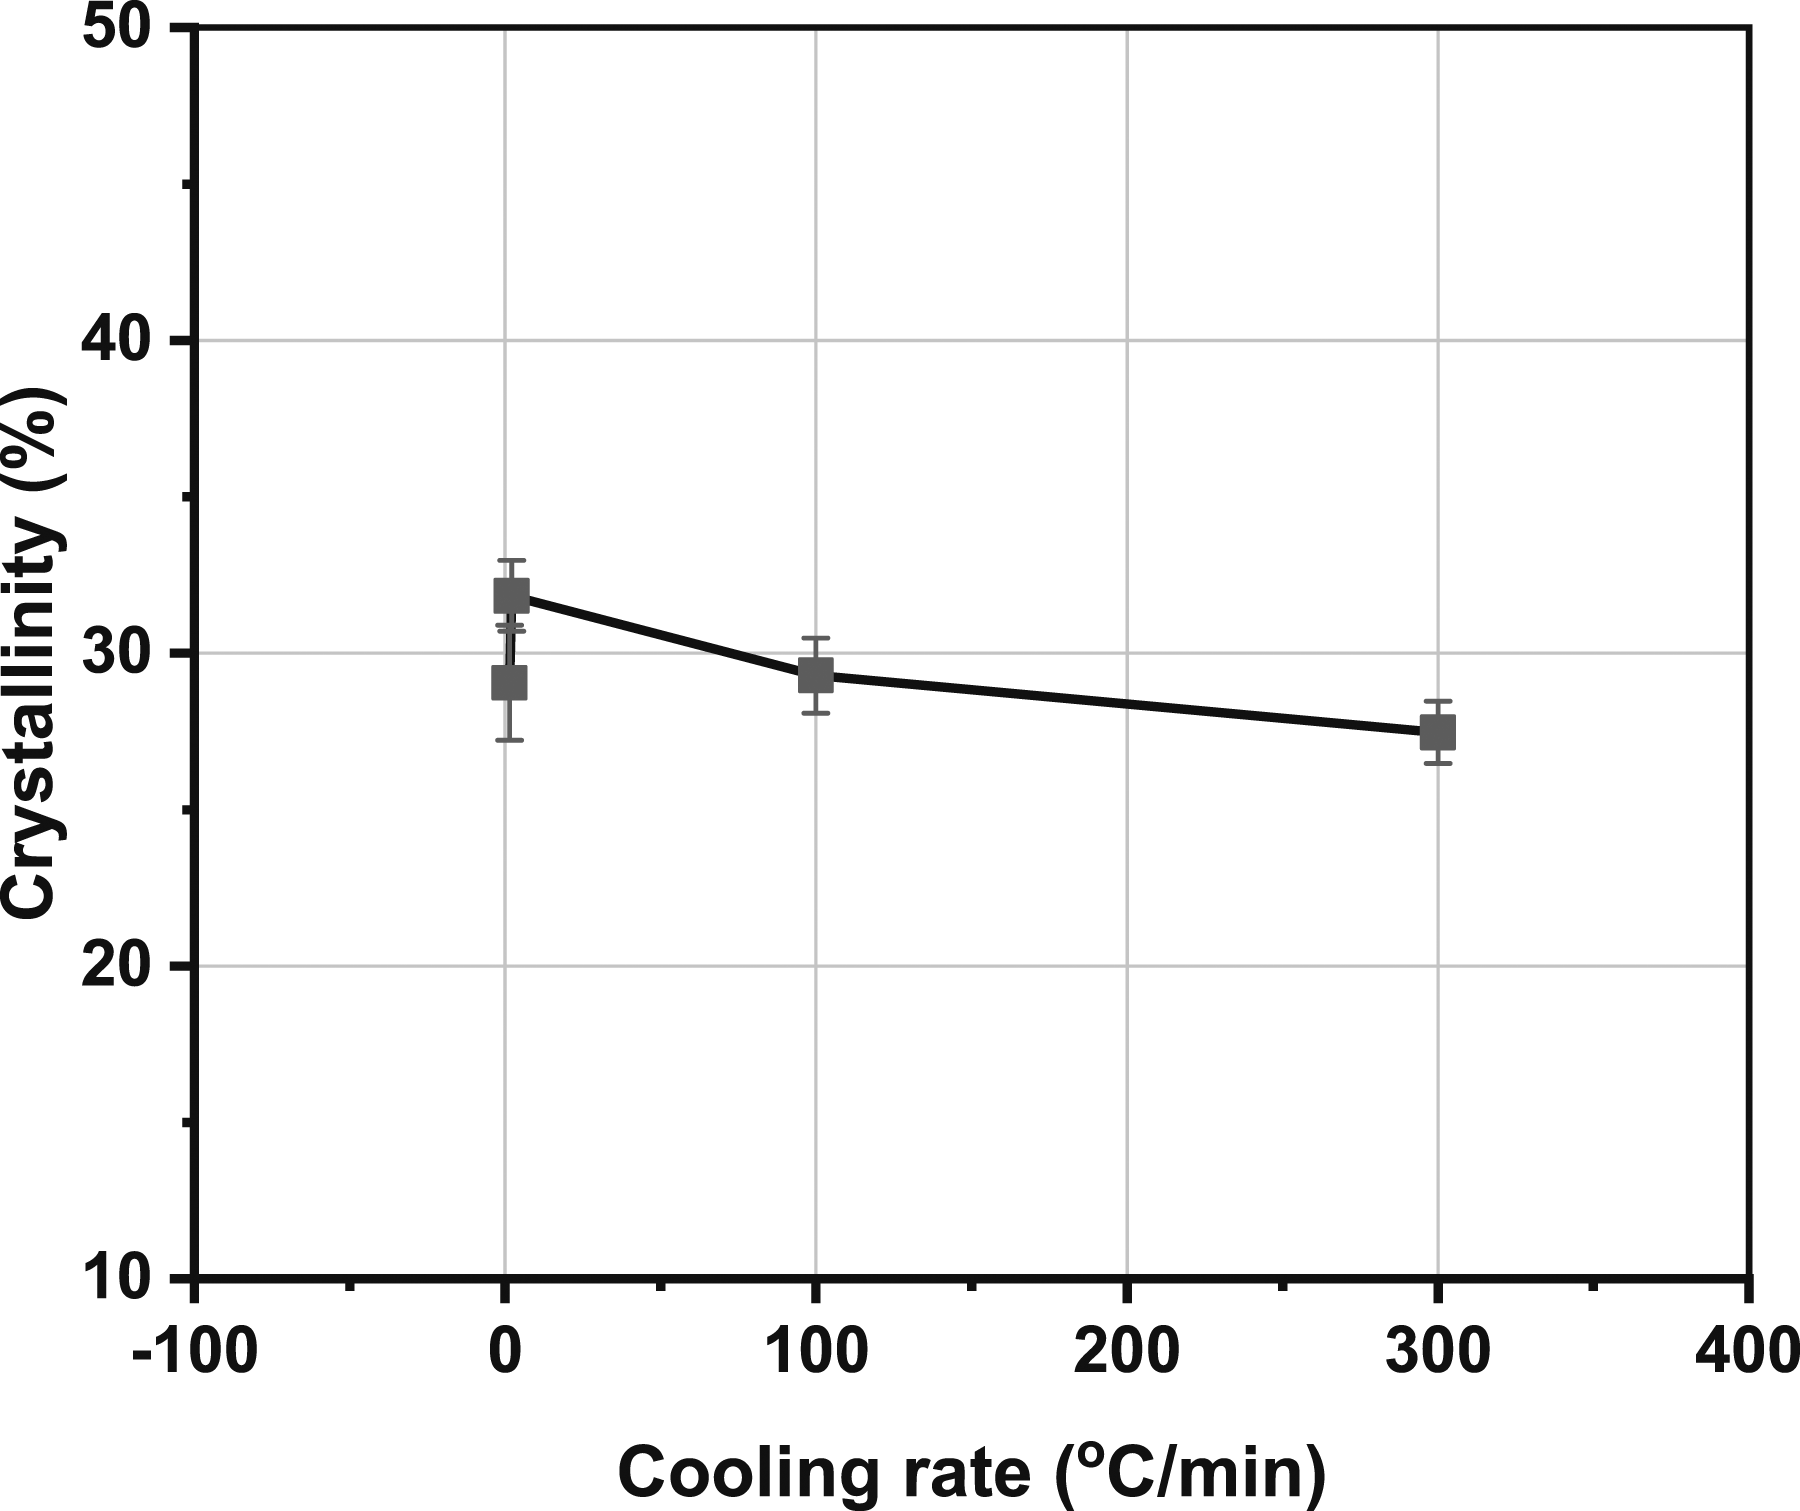
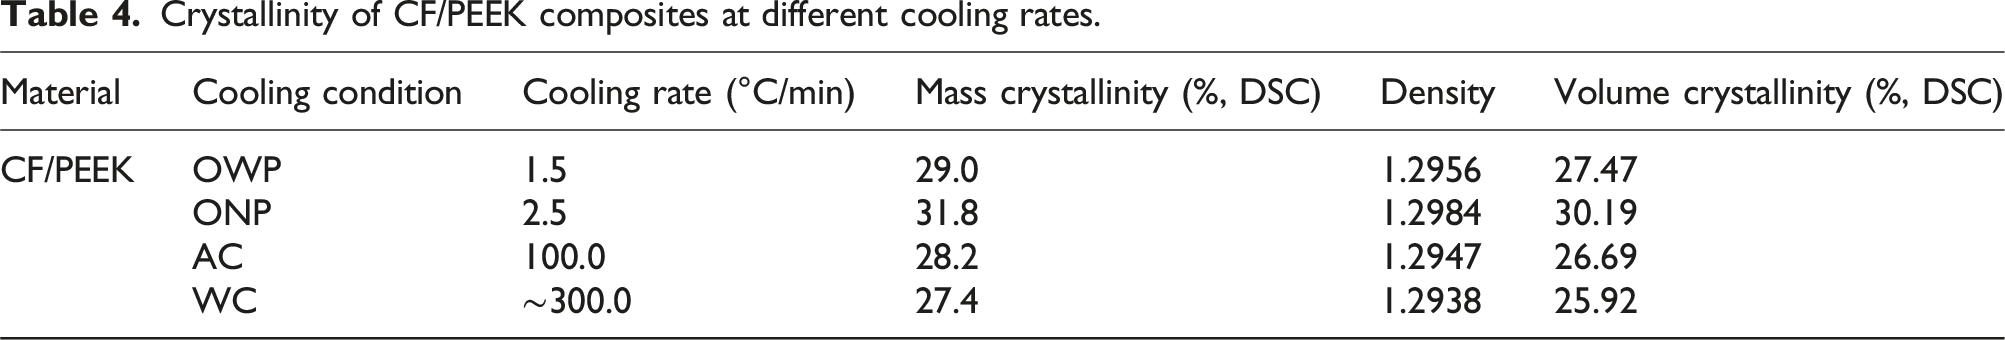
The calculated crystallinity from DSC is shown in Figure 8 and Table 4. Overall, the crystallinity level decreased with the increase in the cooling rate. With initial cooling rates, i.e., 1.5-2.5°C/min, the crystallinity change was minimal. As the cooling rate increased to 100-300°C/min, crystallinity decreased by 3-5%. This is because, at slow cooling, polymer chains have more time to rearrange themselves to create crystals, which leads to higher crystallinity, as discussed before. That trend, followed by the crystallinity level, is in line with what was obtained in previous studies on CF/PEEK.12,18,43 DSC measures the mass crystallinity, while XRD measures the volume crystallinity. So the mass crystallinity Degree of crystallinity at different cooling rates. Crystallinity of CF/PEEK composites at different cooling rates.
XRD
Figure 9 displays the XRD diffractograms of CF/PEEK under different cooling rates. The crystalline peaks are visible in all tested samples. Altering the cooling rate and type of CF has minimal impact on the structure of the crystalline phases, as evidenced by the identical 2 Theta values of peaks in different samples (Figure 9(a)). Figure 9(b) shows the calculated crystallinity from XRD, with the DSC results also presented for comparison. Similar to DSC’s observations of crystallinity, a higher cooling rate results in lower crystallinity. However, the values calculated by XRD are slightly higher than those by DSC, possibly due to the contribution of crystalline CF to the deflected peak intensity. Diffractograms of CF/PEEK composites: (a) XRD and (b) XRD versus DSC.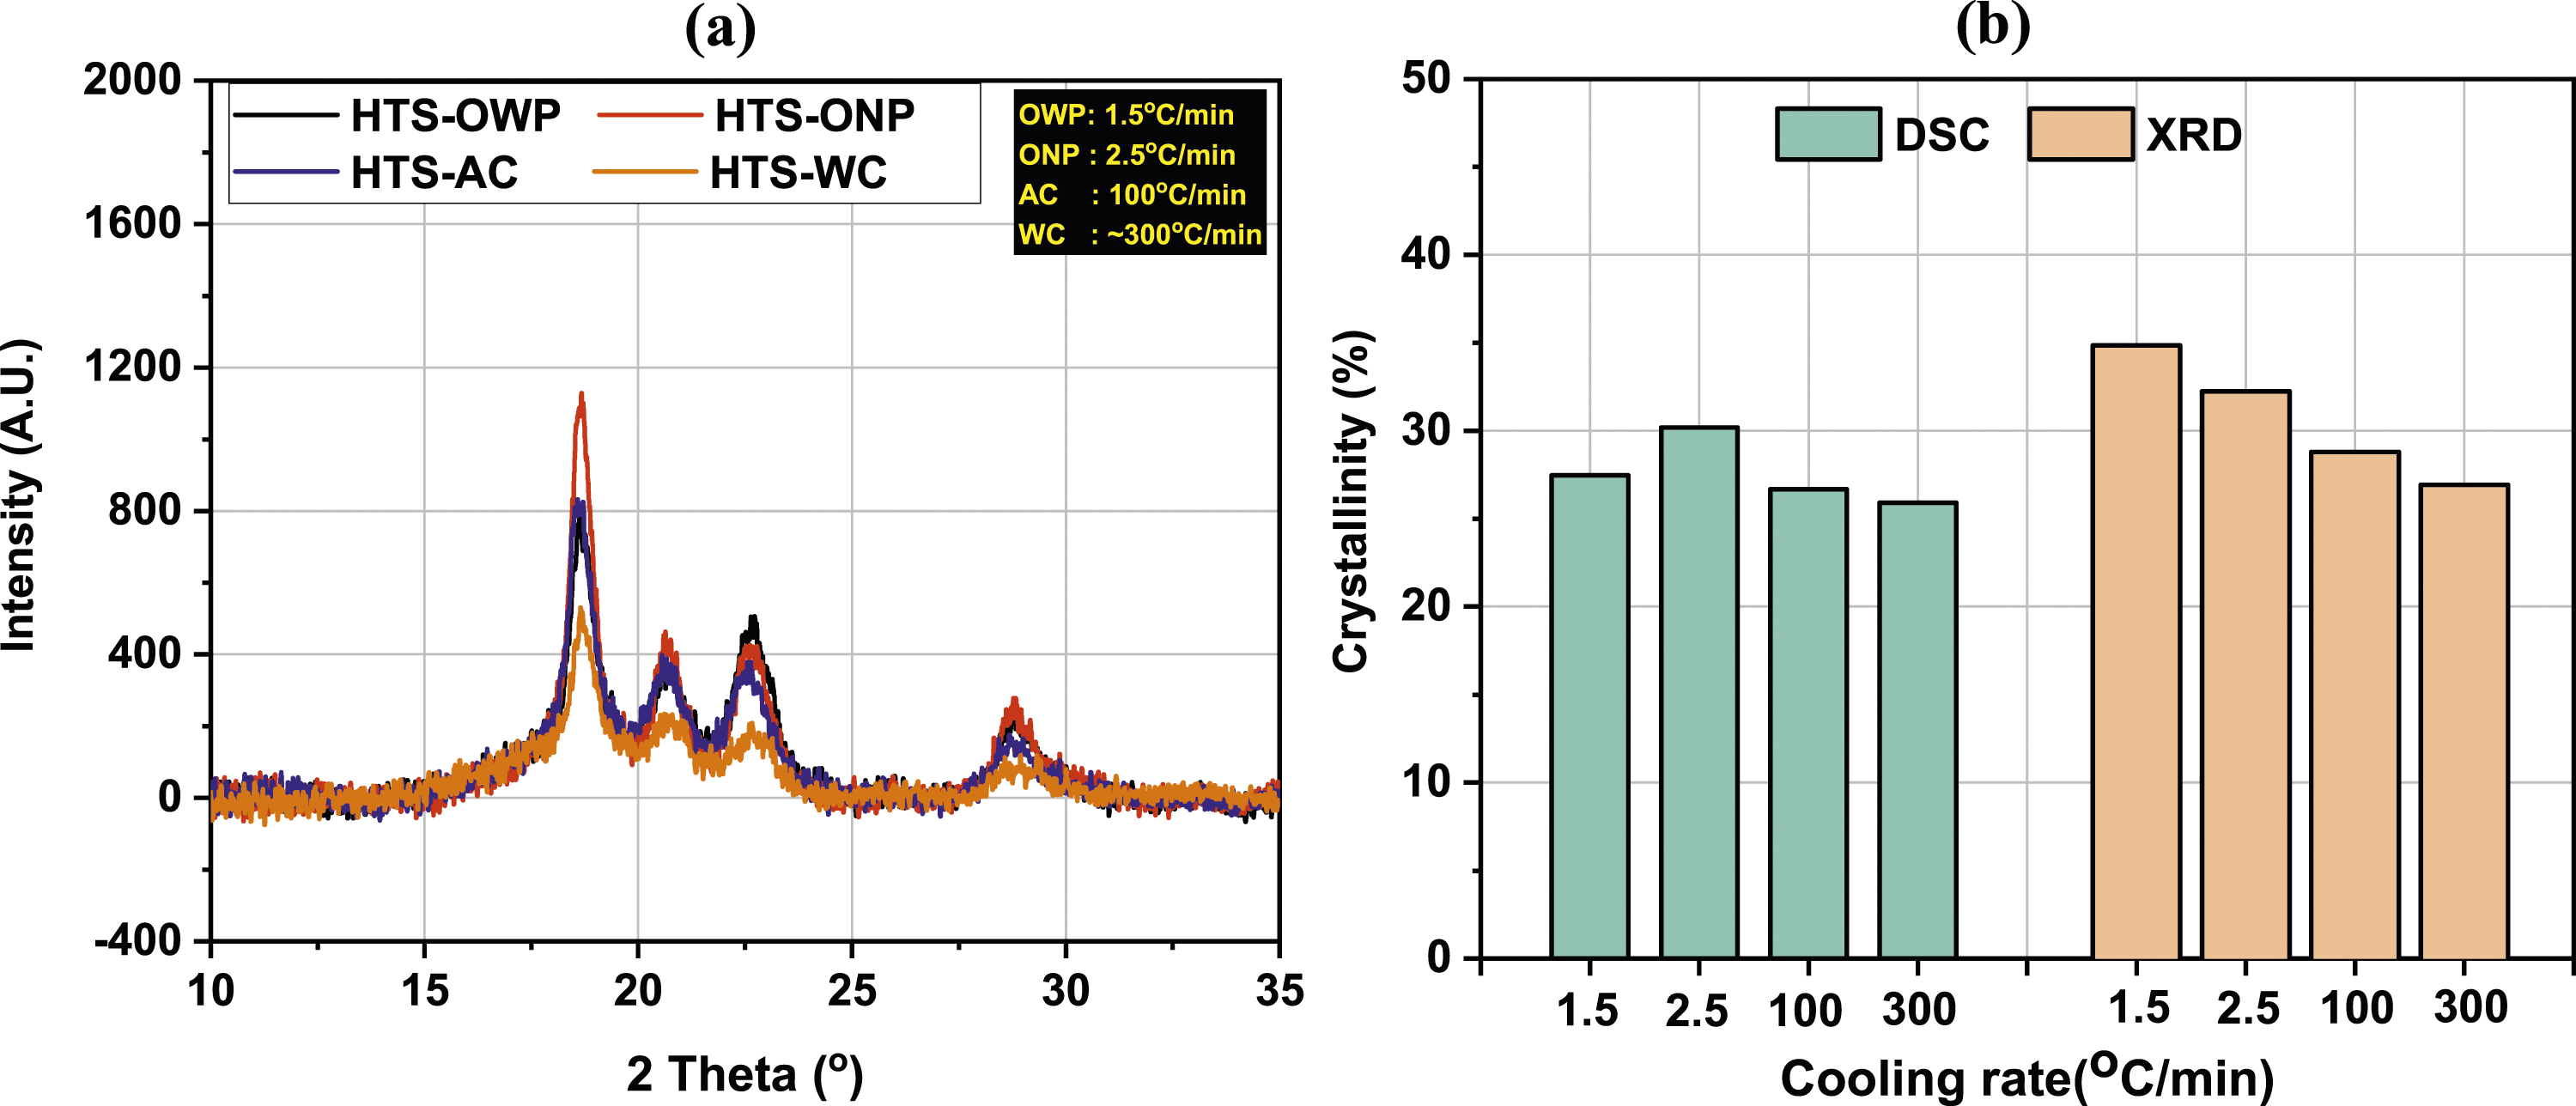
Crystalline morphology
The morphologies of CF/PEEK composites under different cooling rates are demonstrated in Figure 10. These phases are visible in the samples in varying proportions depending on the cooling rate, represented by three morphological structures: amorphous areas, where the molecule chains did not organise themselves into an aligned periodical structure; lamellar areas,
45
where chains begin to fold and rearrange themselves at the early-crystallisation stage; and spherulite areas, which are crystallites that had enough time to grow and form superstructures fully. The diameter of spherulites increases as they contain more polymeric chains. Morphologies of CF/PEEK composites: (a) OWP-1.5°C/min, (b) ONP-2.5°C/min, (c) AC-100°C/min, (d) WC-∼300°C/min.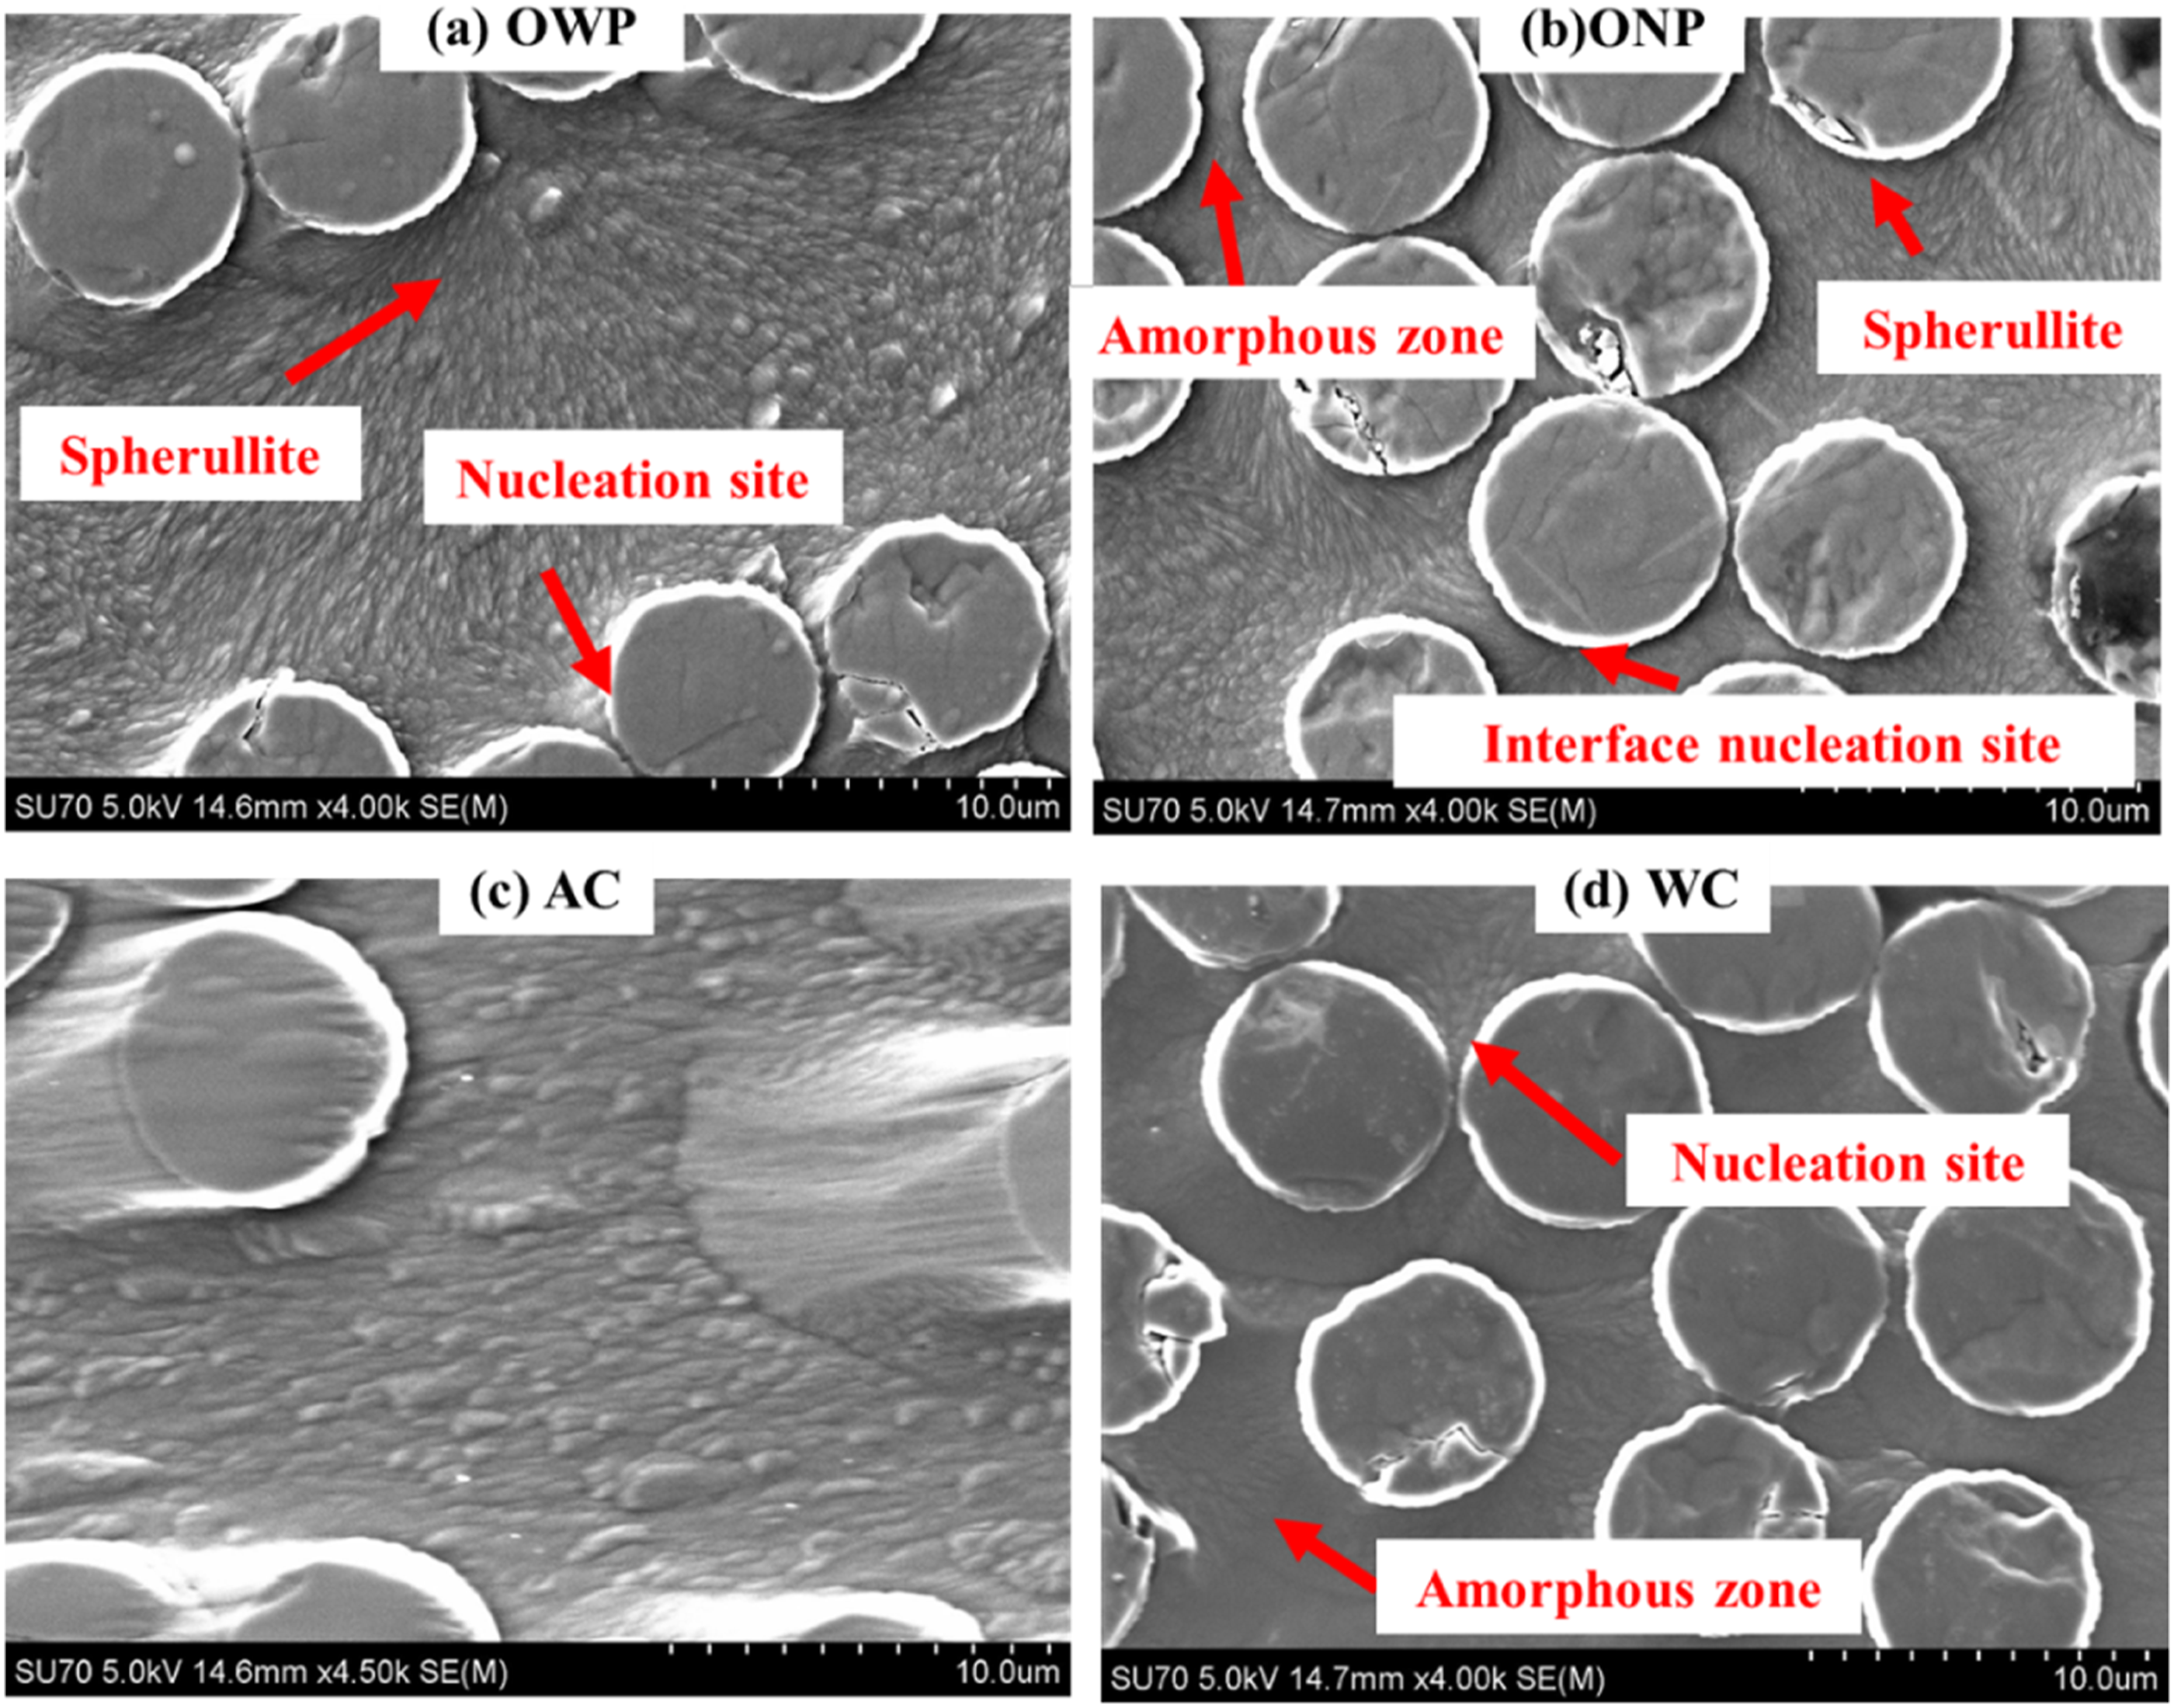
When cooled at a rate of 1.5°C/min (OWP), (represented by Figure 10(a)) displayed a highly crystalline matrix with large spherulites. The formation of spherulites begins at a point on the fibre and expands to create a circle or semi-circle. The nucleation sites for crystallisation are mainly on the fibres, consistent with prior observations.41,46 This crystallisation occurring at the fibre interfaces could be observed, which is believed to be significantly promoted by the heterogenous nucleation and shear induced nucleation. 47 At higher cooling rates, such as 2.5°C/min (ONP) (as shown in Figure 10(b)), in the region with a denser fibre intensity, the size of the spherulites was smaller, probably arising from a higher nucleation density and the presence of fibre restricting further growth of spherulites. For faster cooling rates such as 100°C/min (AC) (Figure 10(c)), molecule chains had less time to rearrange themselves, and the early crystallisation was stopped at its early stage. Subsequently, most crystallites are located within the matrix without a defined pattern, contrary to spherulites forming on the fibre surface. They were elongated, thin, and more randomly oriented crystalline regions. At the fastest rate (∼300°C/min), WC (Figure 10(d)), the matrix is primarily amorphous as crystallisation did not have time to occur sufficiently. However, some spherulites can still nucleate in the region, with two fibres being closely packed. The formed crystalline morphology is consistent with the crystallinity results, where large spherulites characterise high crystallinity in composites. Crystallites can occasionally be observed in the composite with lower crystallinity.
Interlaminar shear strength
Figure 11 presents the load-displacement response of CF/PEEK composites under SBS tests. All the samples responded similarly to a displacement of about 0.75 mm. However, depending on the processing conditions, the load response varied beyond this point. Except for WC samples, OWP, ONP, and AC samples had similar extensions with different loads. WC specimens experienced more deformation before failing. As a result, an increase in cooling rate leads to a change from brittle to ductile behaviour between slow and fast (water) cooling, and the load drop is not sudden, unlike in other samples. This increase in ductility is due to the matrix having a lower crystallinity, indicating that the fibre response is less influential. Load-displacement response of CF/PEEK composites.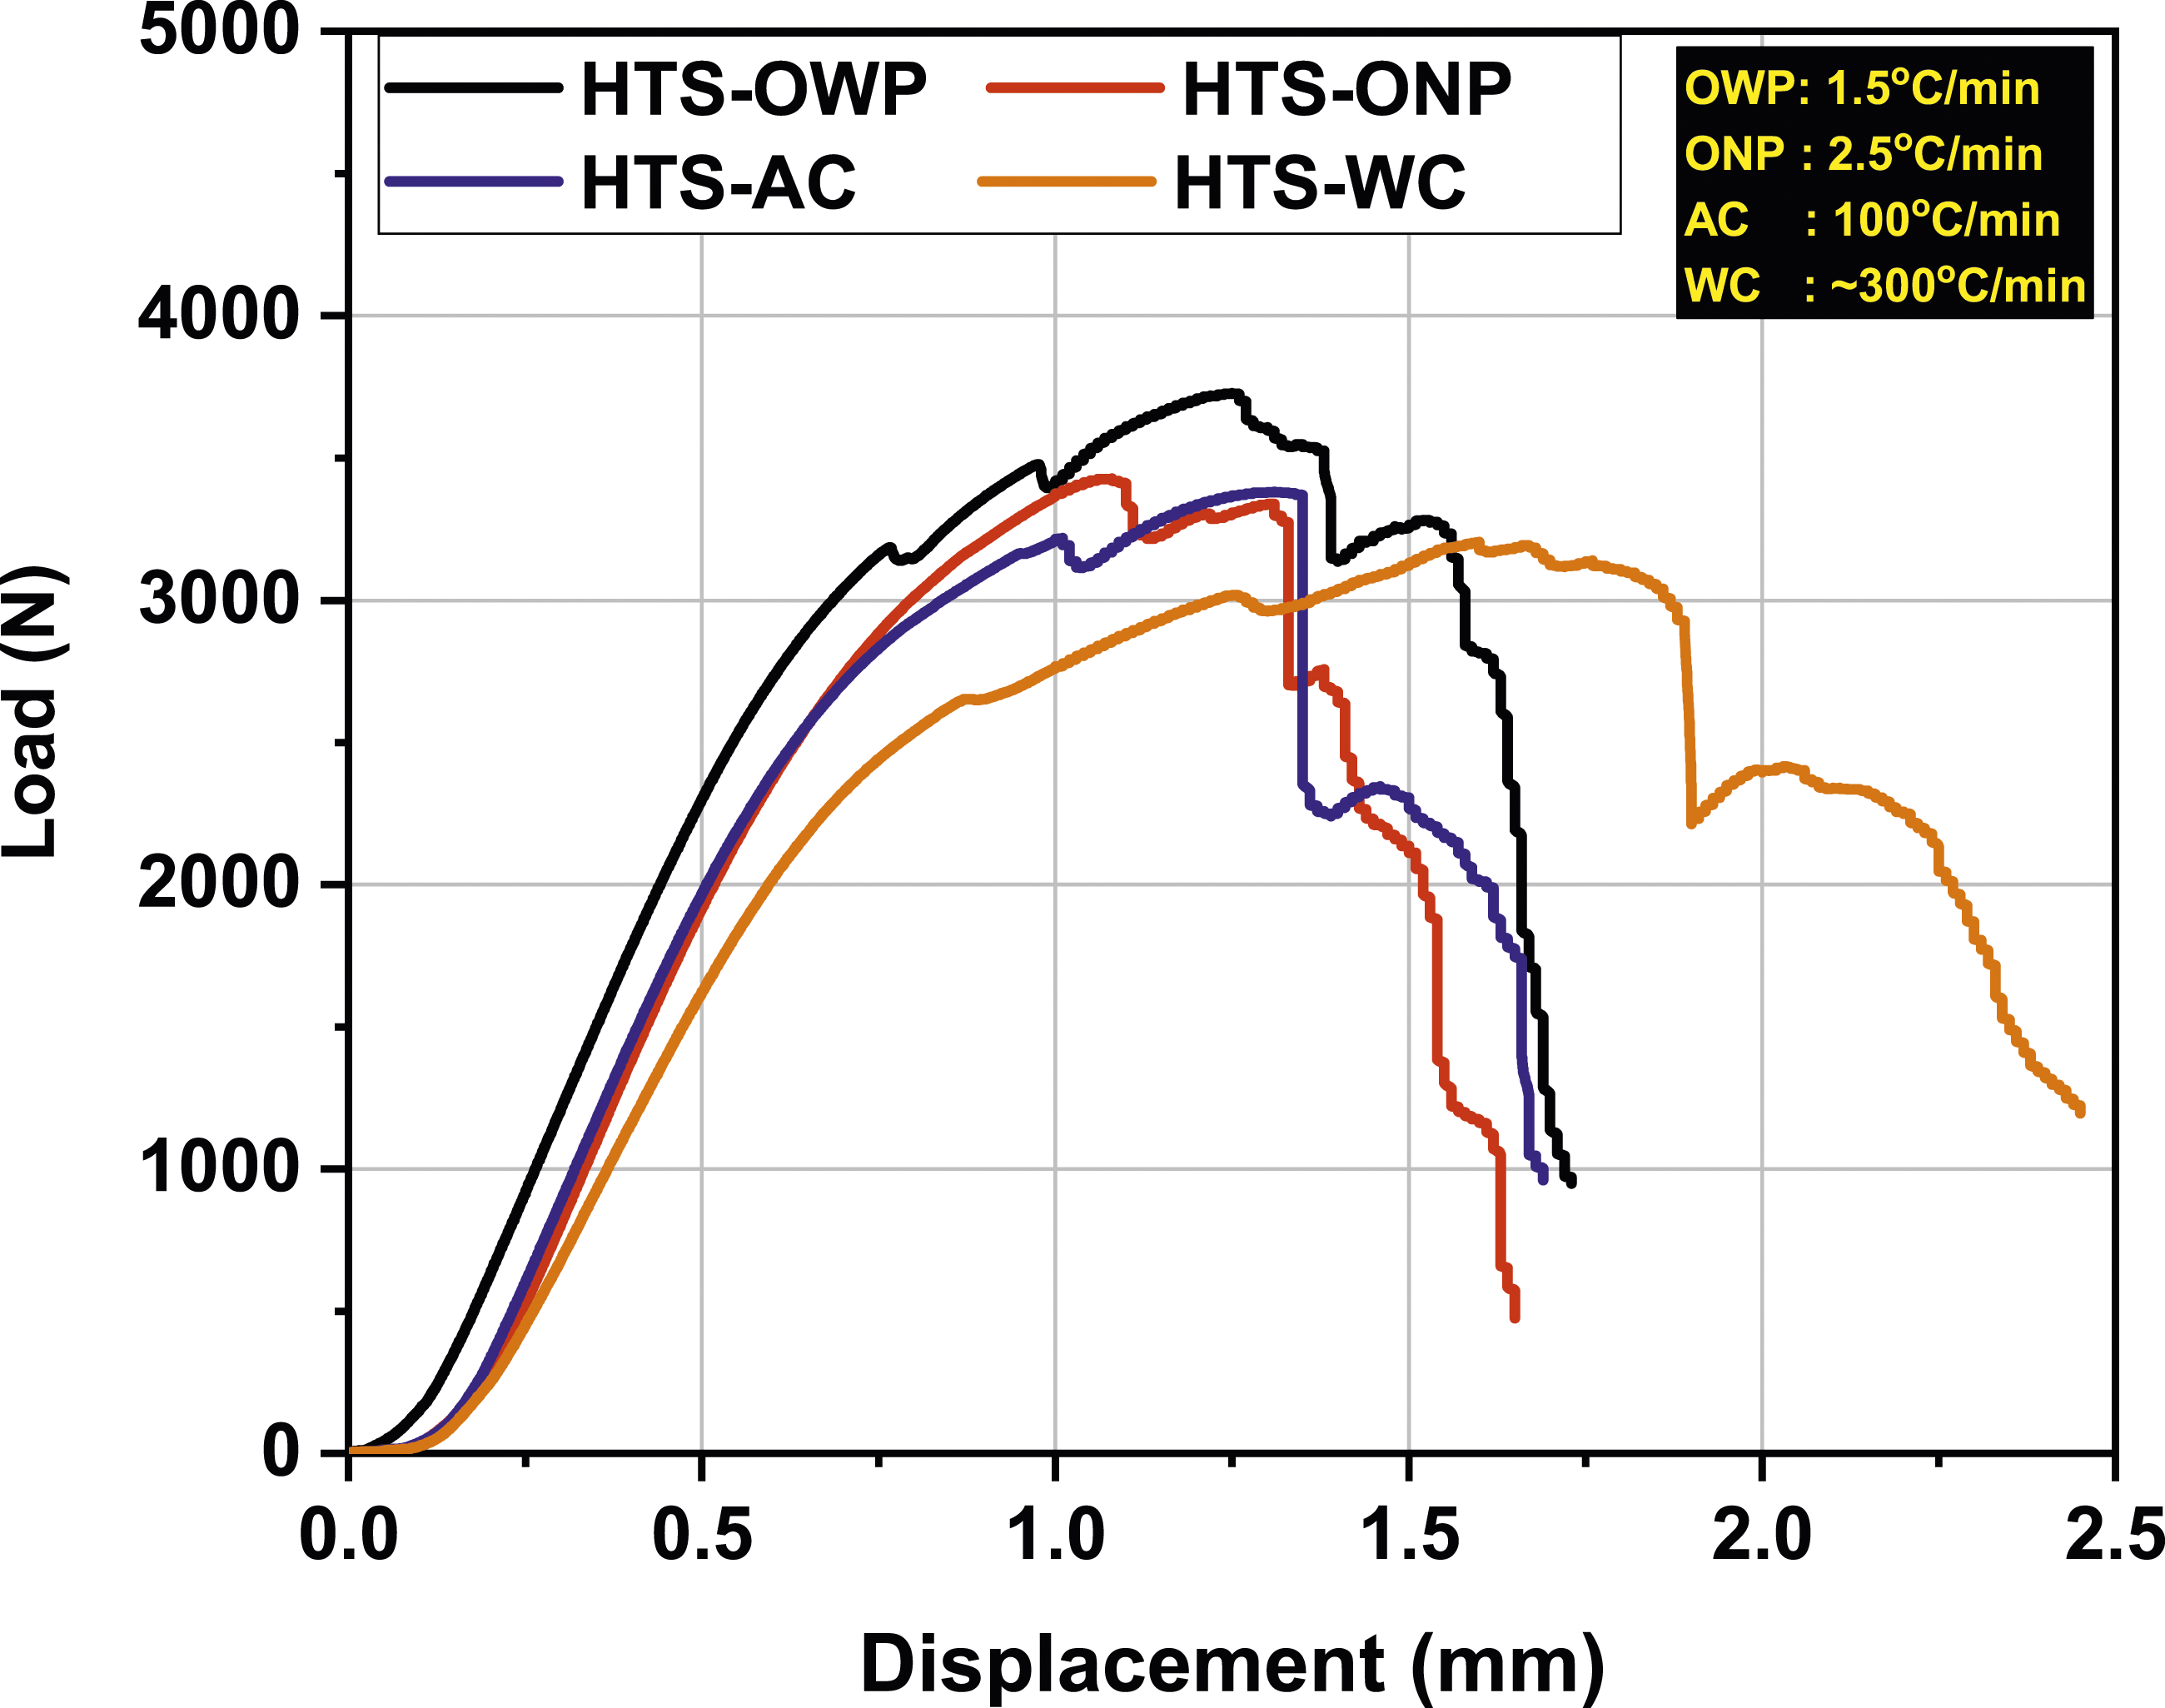
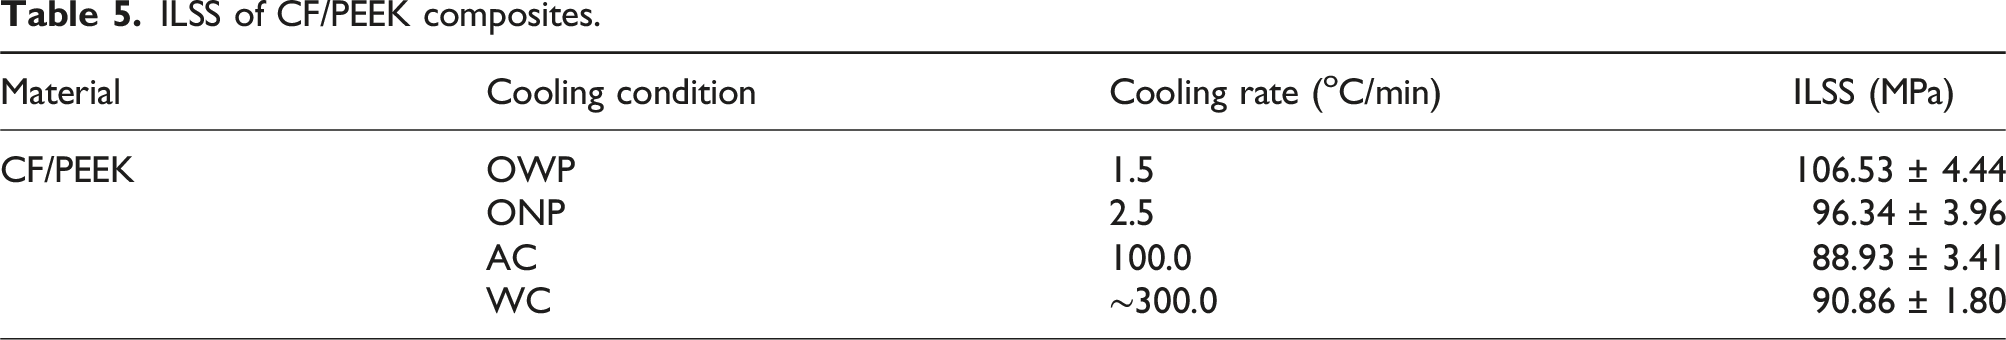
The resulting ILSS concerning different cooling rates for CF/PEEK composites are shown in Figure 12 and Table 5. As the cooling rate increased from 1.5°C/min to 300°C/min, the ILSS decreased by 6-17%. The low crystallinity, high void content and reduced fibre/matrix interaction could explain the reduction in ILSS at a high cooling rate. The slower cooling allows for more complete crystallisation and better molecular organisation within the matrix, as observed in the present case. During the slow cooling process, the transcrystalline phase around the CFs also grows better. Other studies observed similar trends.18,37 This gives better interfacial bonding and fibre/matrix adhesion, improving ILSS. The formation of voids with an increase in cooling rate also contributes to the reduction in ILSS. Voids act as stress concentration points, weakening the composite’s ILSS.
48
Slower cooling allows more time to evacuate trapped gases and reduces the likelihood of void formation, leading to higher ILSS. Moreover, pressure applied during the samples’ cooling reduced the voids.
49
Table 5 presents the ILSS of CF/PEEK composites. The ILSS of present CF/PEEK composites was equivalent to previous studies on CF/PEEK.18,33 A sharp decrease in ILSS was observed when the cooling rate increased from 1.5 to 2.5°C/min. It is believed that the decrease of crystallinity is one factor,18,33 while the abrupt increase (300%) in void content might also be another important reason for a more significant drop in ILSS. Variation of ILSS with cooling rate. ILSS of CF/PEEK composites.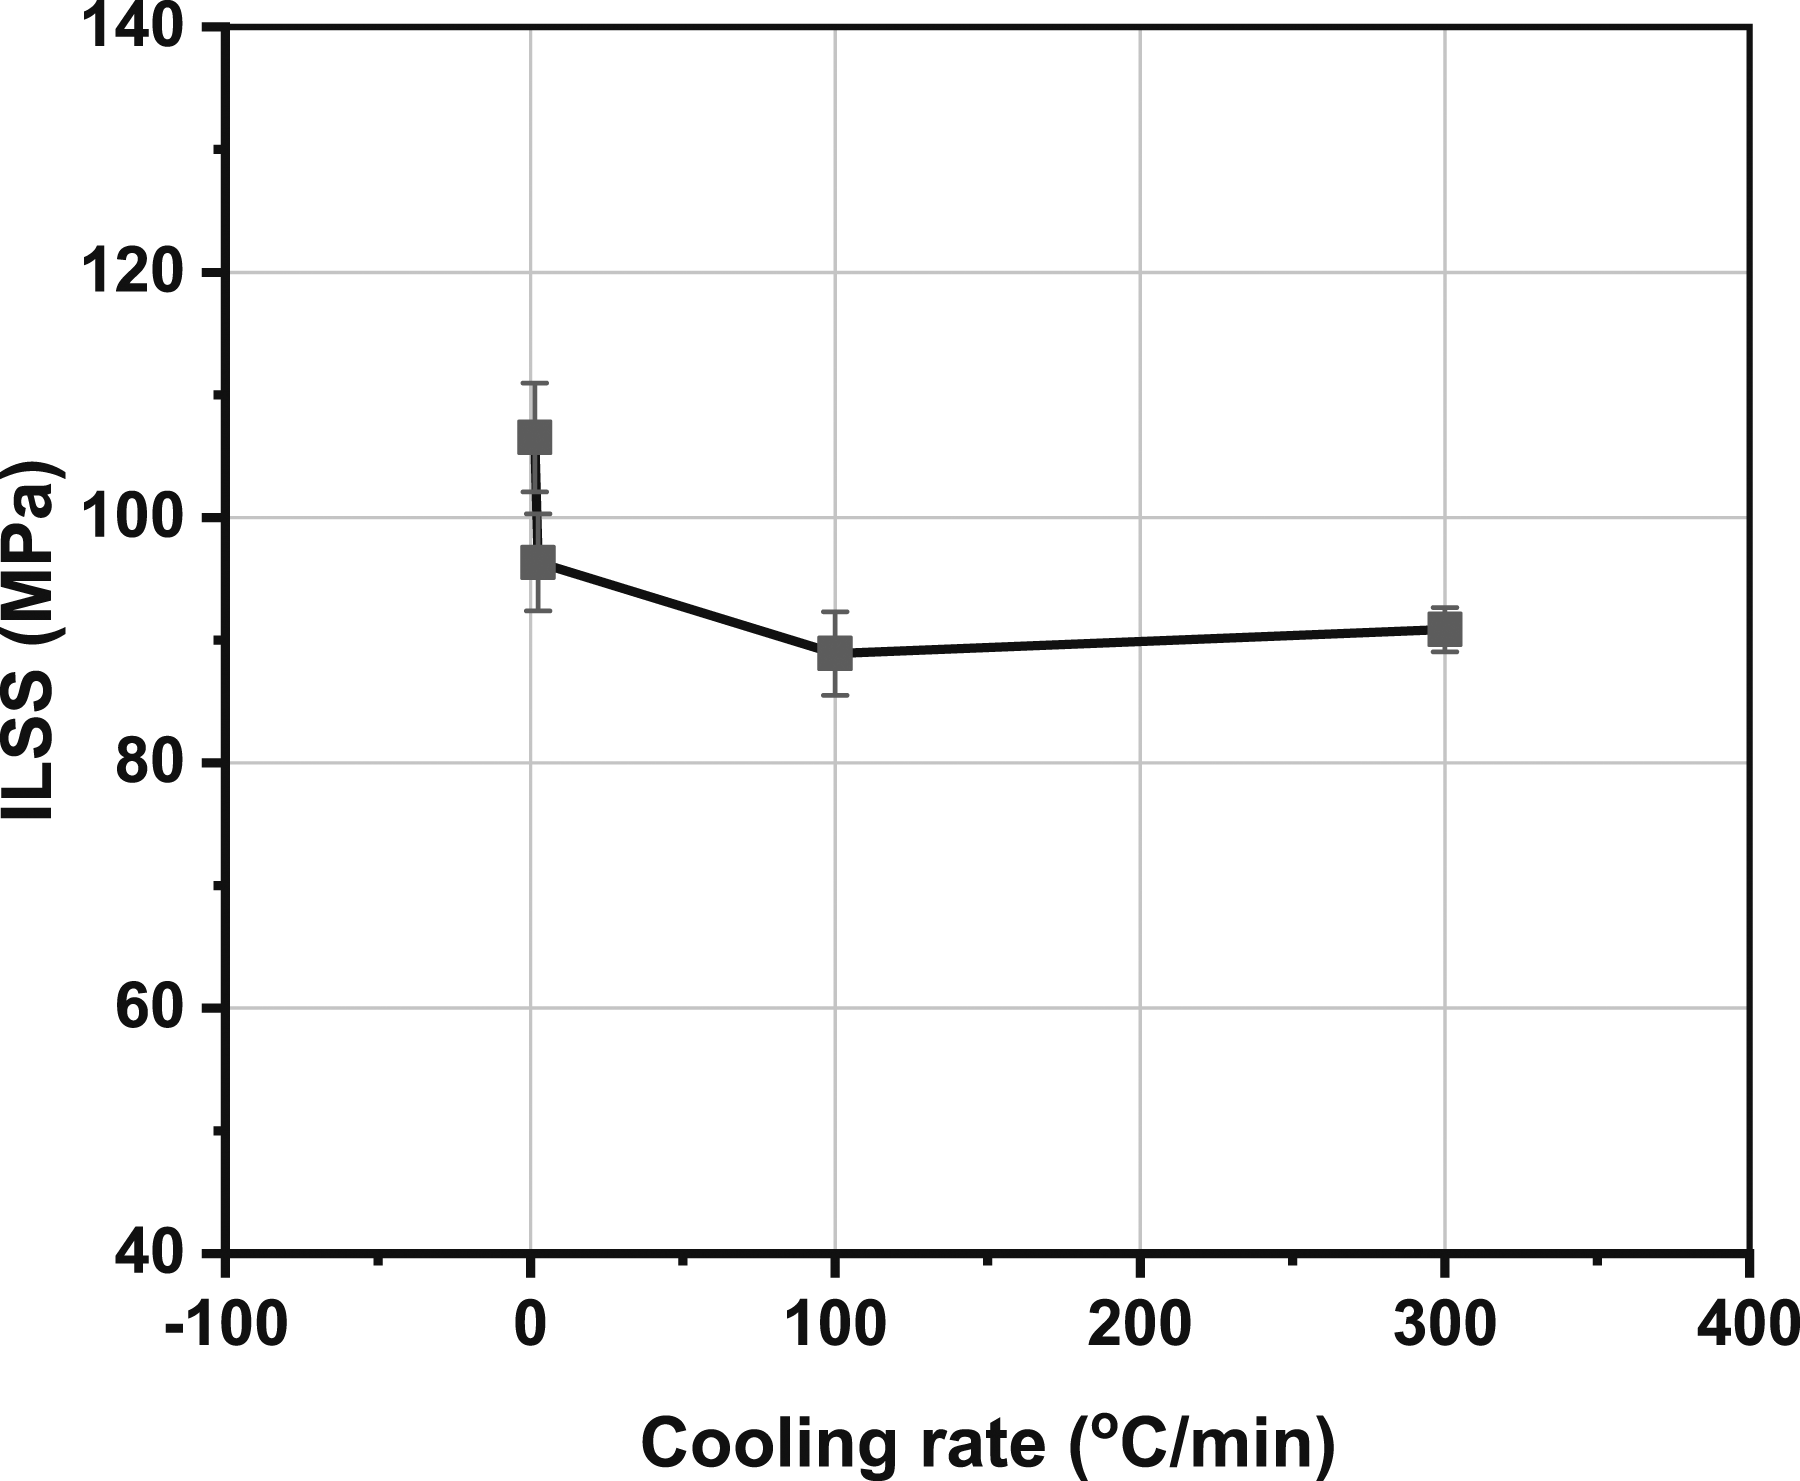
Failure analysis was carried out using a high-definition camera and optical microscopy. Figure 13 shows the macroscopic failure of CF/PEEK for different cooling conditions. For most of the specimens in all cooling conditions, the interlaminar shear failure was initiated from the edge. However, interlaminar shear failure mode, either in tension or compression, occurred primarily for slowly cooled specimens (OWP, 1.5°C/min) (Figure 13(a)) without visible delamination. The ONP (2.5°C/min) and AC (100°C/min) samples exhibited delamination at multiple locations due to interlaminar shear (Figure 13(b) and (c)). The quickly cooled (300°C/min) specimens failed under inelastic deformation (Figure 13(d)). This behaviour aligns with the increased ductility associated with higher cooling rates. Macroscopic failure of CF/PEEK composites: (a) OWP-1.5°C/min, (b) ONP-2.5°C/min, (c) AC-100°C/min, (d) WC-∼300°C/min.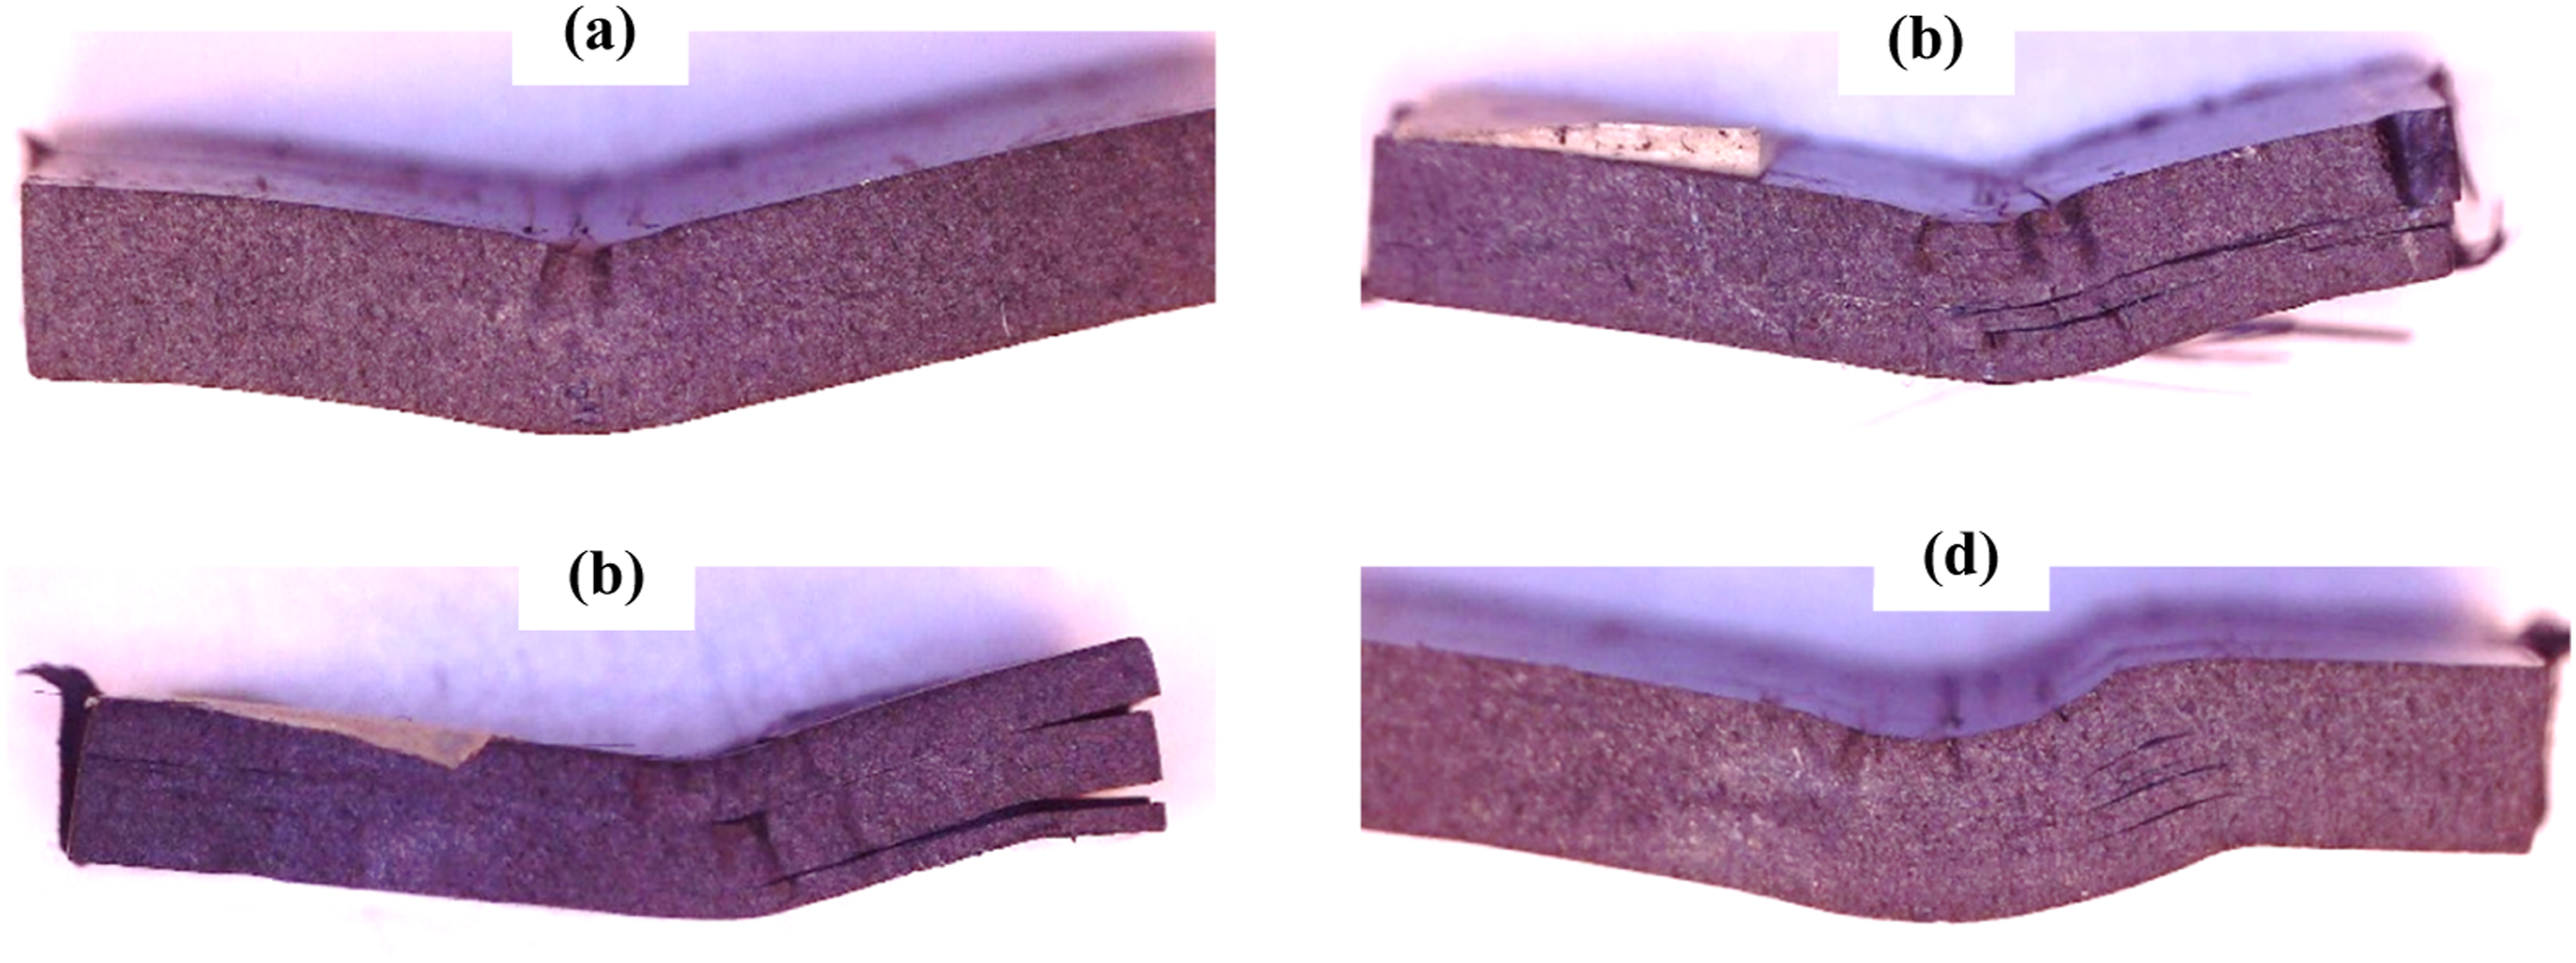
Figure 14 shows the optical micrographs of interlaminar shear failure for CF/PEEK samples. Except for OWP (1.5°C/min) samples, significant delamination was evident due to poor bonding. OWP CF/PEEK samples (Figure 14(a)) failed to fibre failure with cracks at multiple locations. In the middle of the specimen, where the load was applied, fibre buckling and shear fracture perpendicular to the fibre direction were observed. These failure modes might be due to the compression and transverse shear loading. When the cooling rate increased, i.e., for AC (100°C/min) and WC (300°C/min) samples (Figure 14(c)-(d)), micro kinking with delamination was observed. This was due to relatively larger voids, which acted as the stress concentration site for the delamination and multiple cracks. Optical micrographs of interlaminar shear failure in CF/PEEK composites: (a) OWP-1.5°C/min, (b) ONP-2.5°C/min, (c) AC-100°C/min, (d) WC-∼300°C/min.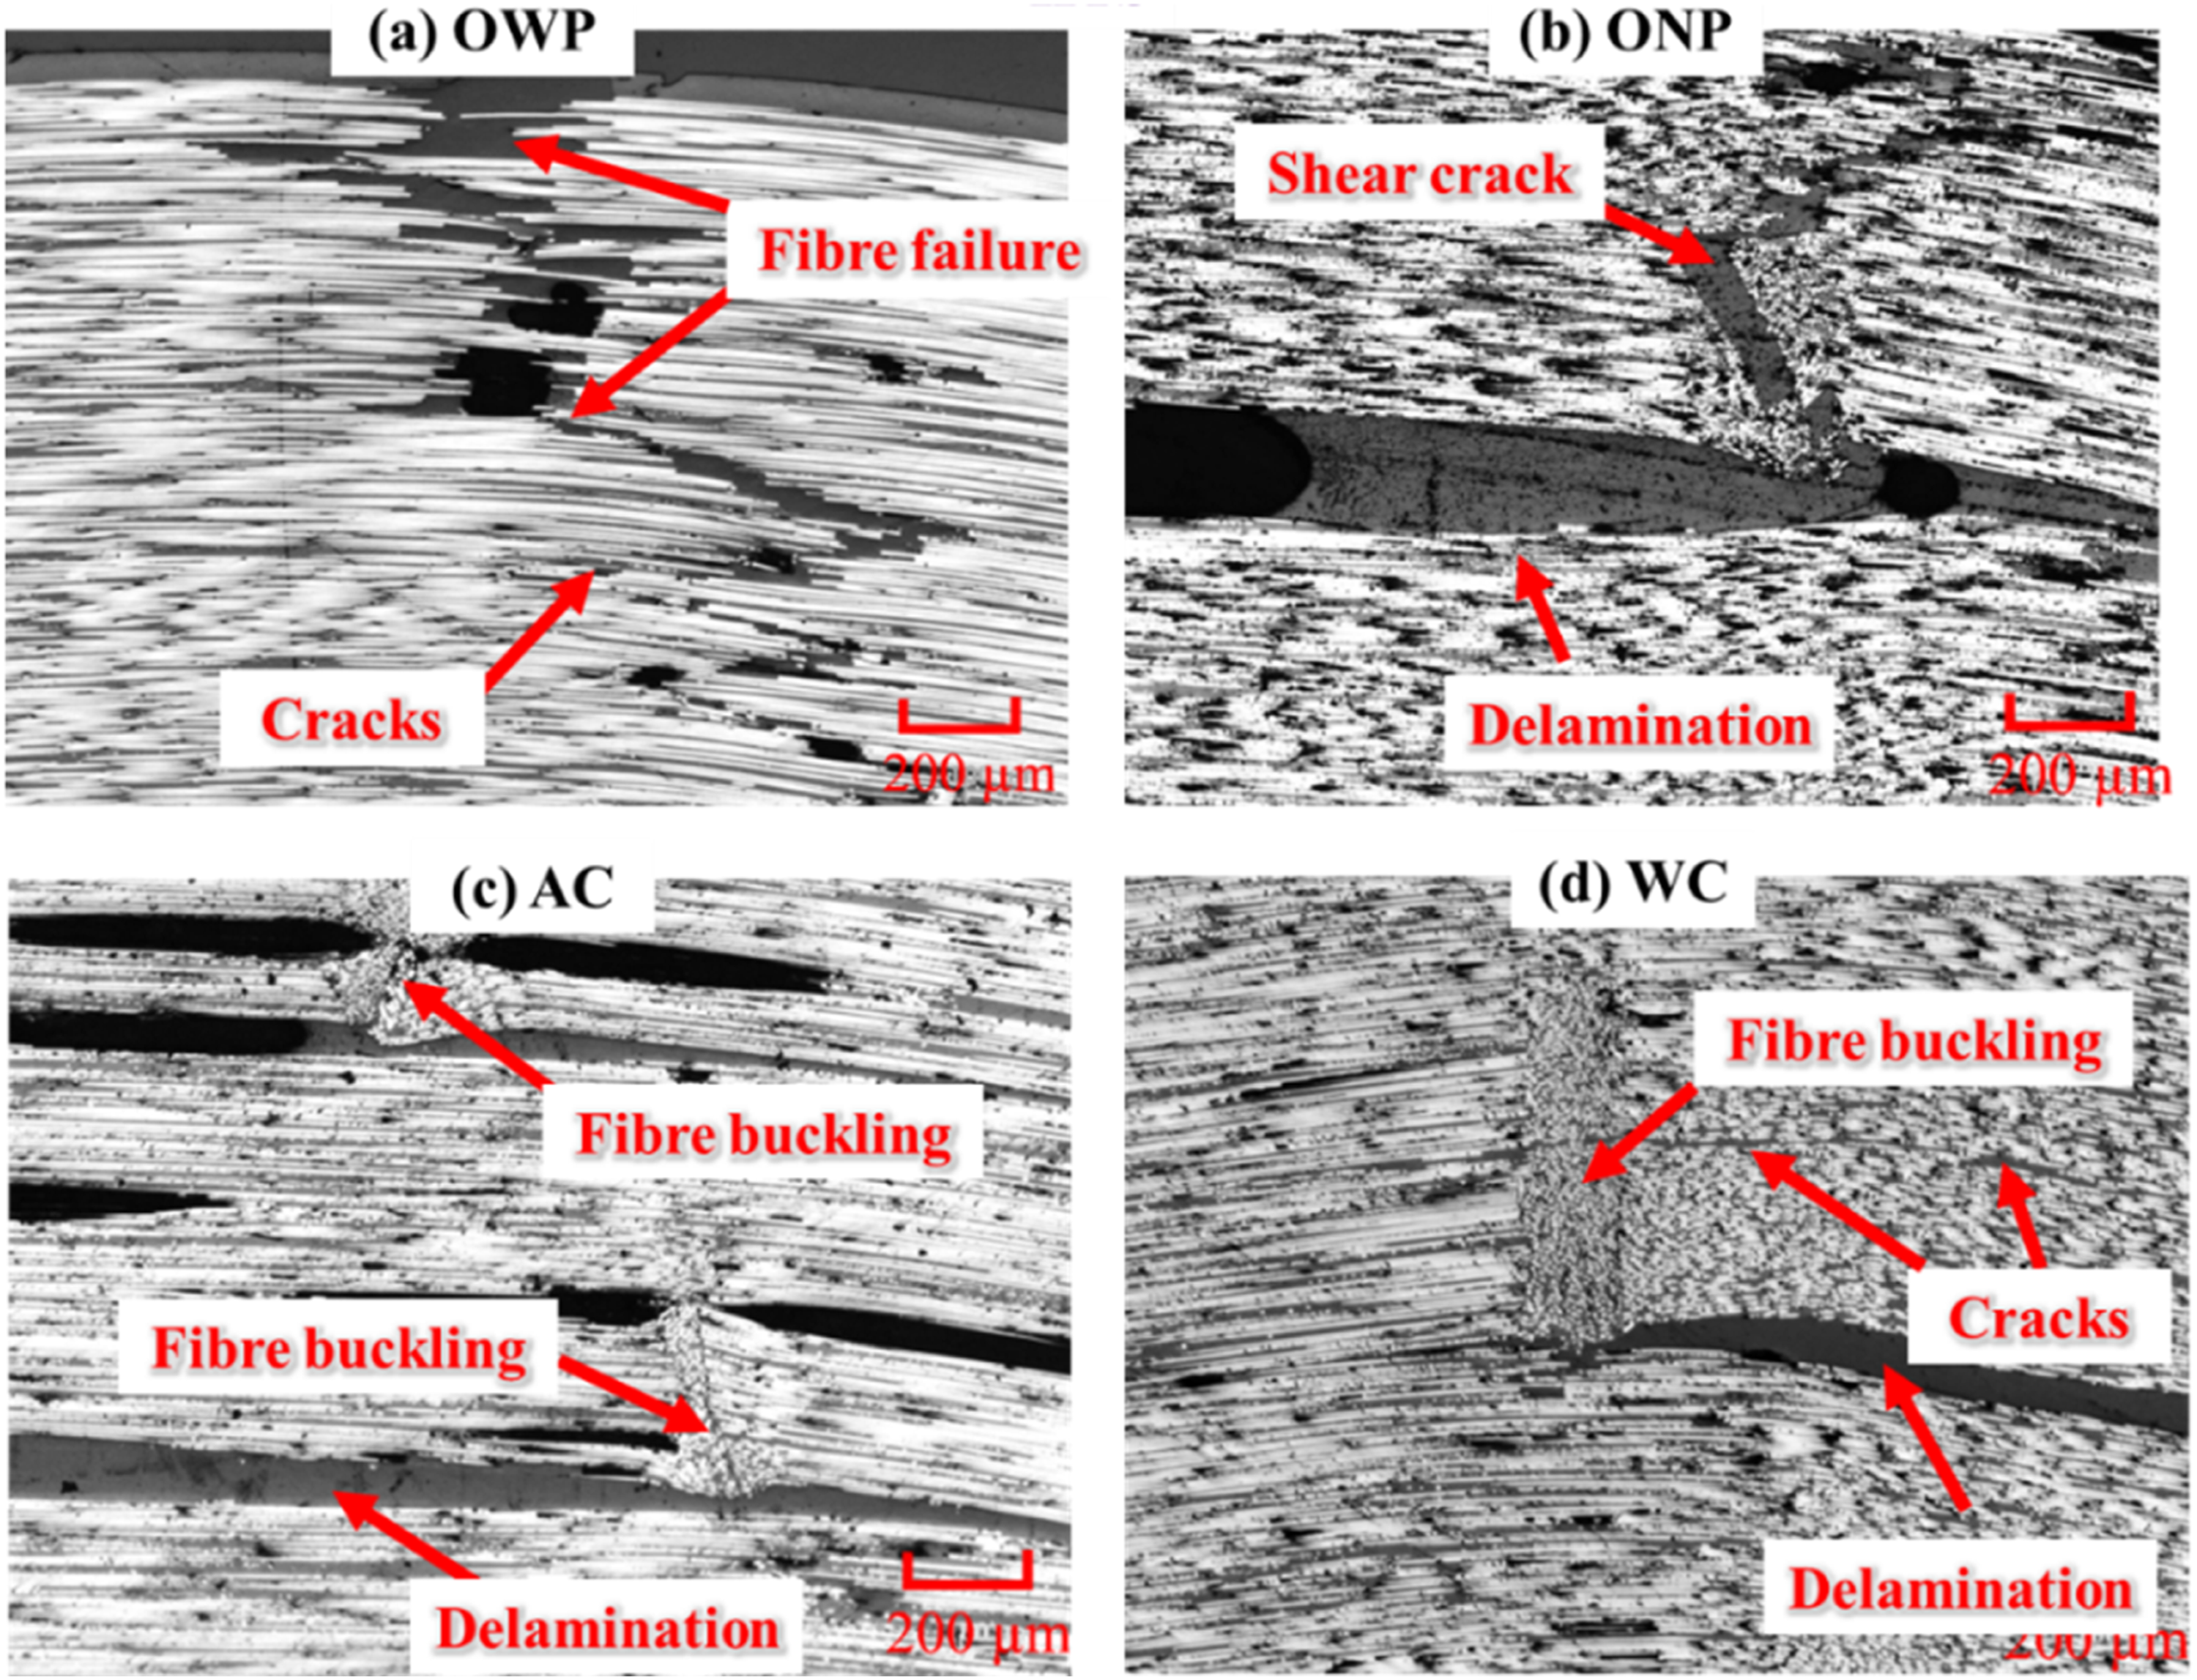
Compressive properties
Typical load-displacement response of CF/PEEK composites under different cooling conditions is shown in Figure 15. However, failure load and response differed based on the cooling conditions. In both the composites, slow cooled samples (OWP, 1.5°C/min and ONP, 2.5°C/min) exhibited highest failure load than the AC (100°C/min) and WC (∼300°C/min) samples. Compressive load-displacement response of CF/PEEK composites.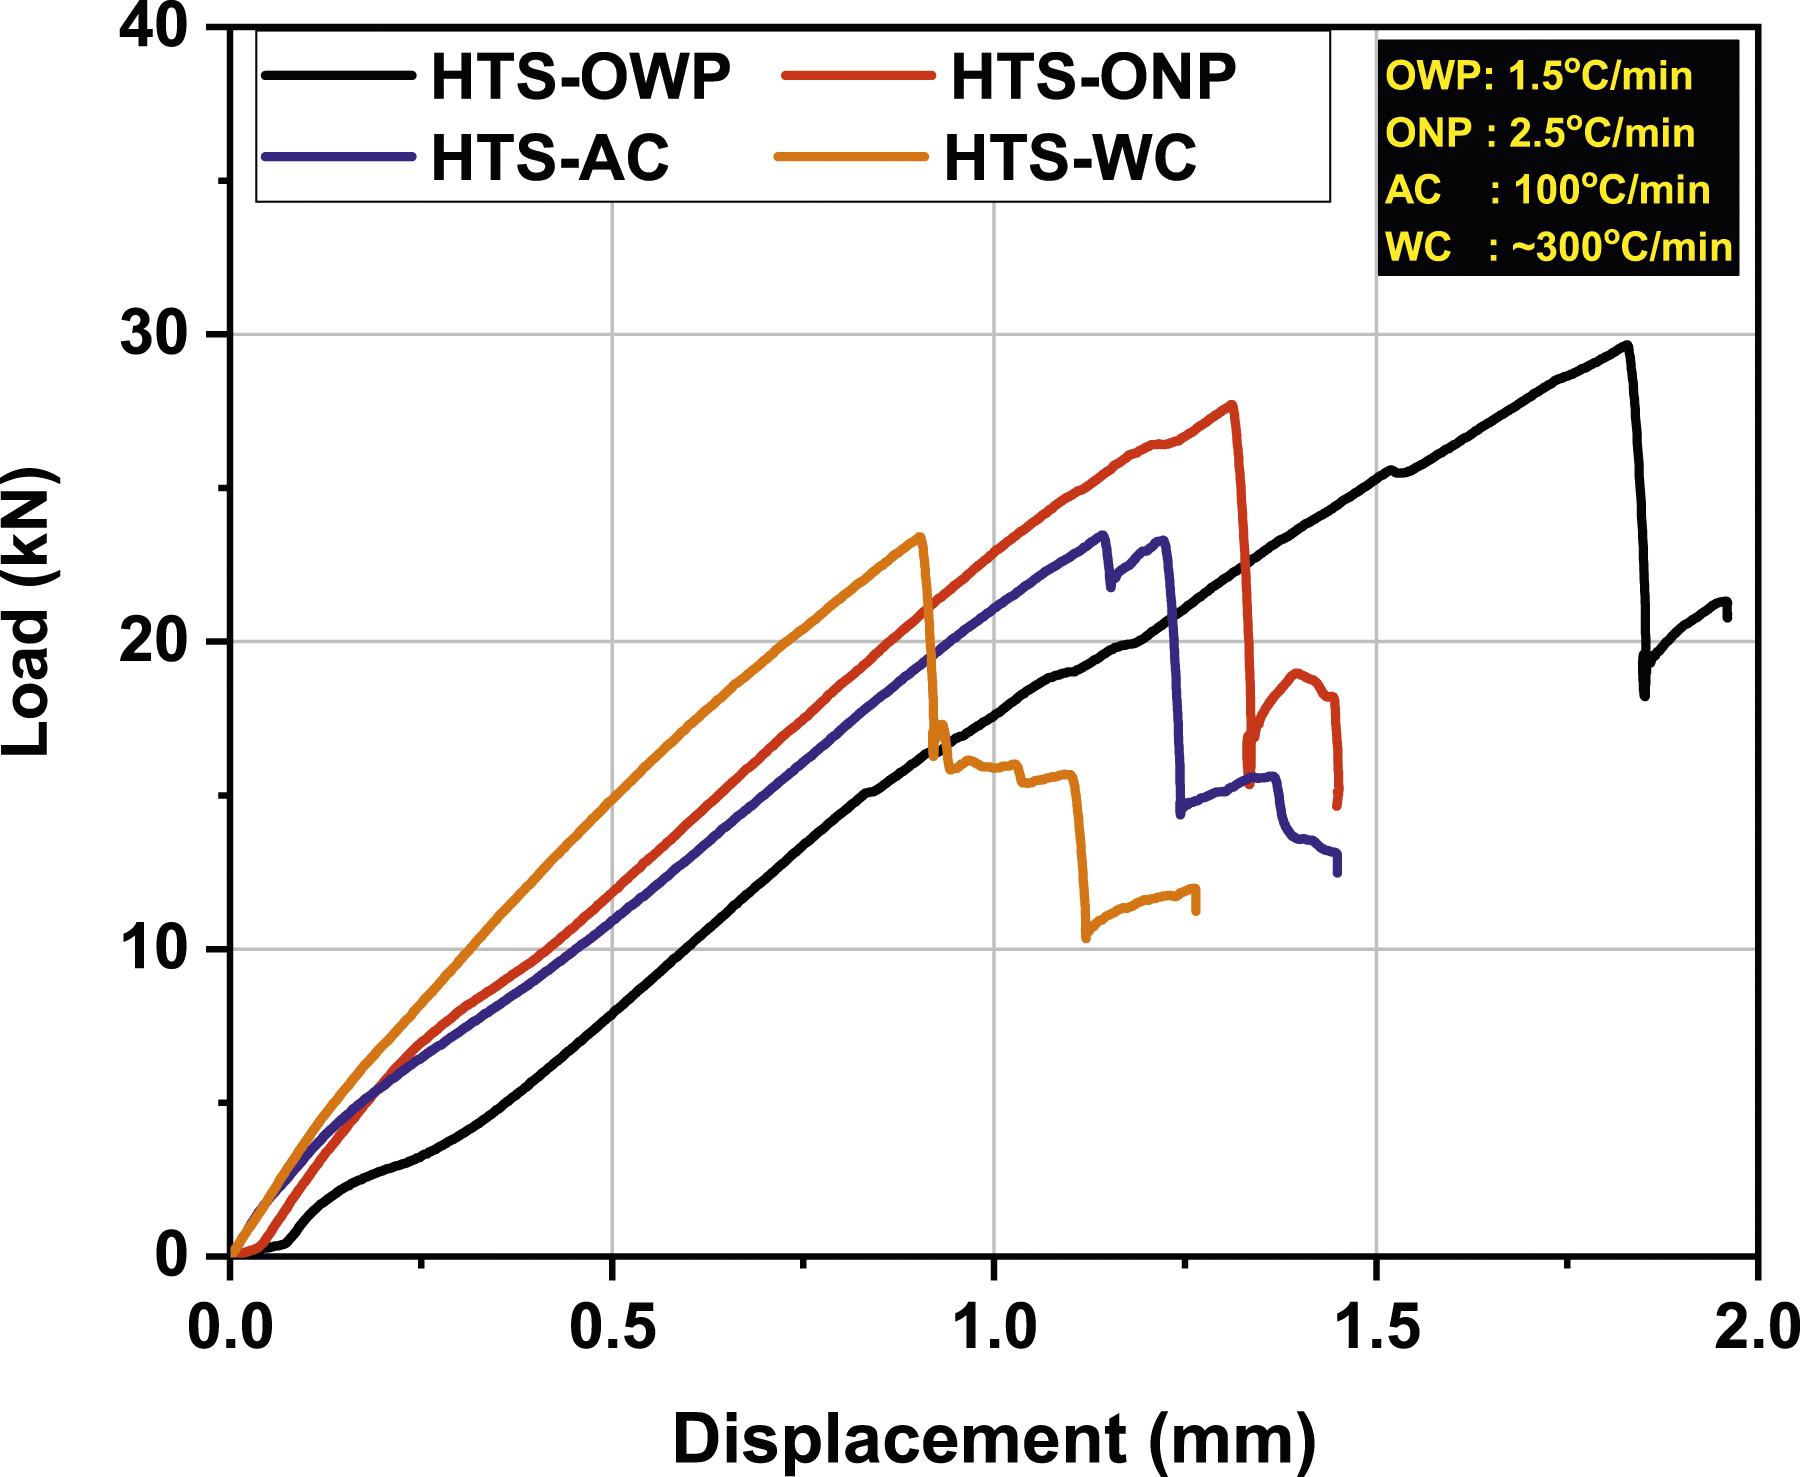
The influence of cooling rate on the compressive strength of CF/PEEK composites is shown in Figure 16. Overall, the compressive strength was decreased by 6-21% with an increase in the cooling rate. No studies in the open literature reported the influence of cooling rate on the compressive strength of CF/PEEK. A significant drop was observed between the cooling in the hot press with pressure (OWP, 1.5°C/min) and without (ONP, 2.5°C/min). This could be explained by the impact of pressure, leading to fewer void formation, so less stress concentrations. However, as the cooling rate increased, the decrease in compressive strength was also witnessed, but the decrement was not significant. The parameters, such as the increased void content and lowered crystallinity, are responsible for the continuously reduced compressive strength. Therefore, a low void content is preferred to maintain a high compressive strength. Table 6 shows the CS of CF/PEEK composites. Variation of compressive strength with cooling rate. Compressive strength of the CF/PEEK composites under CLC test.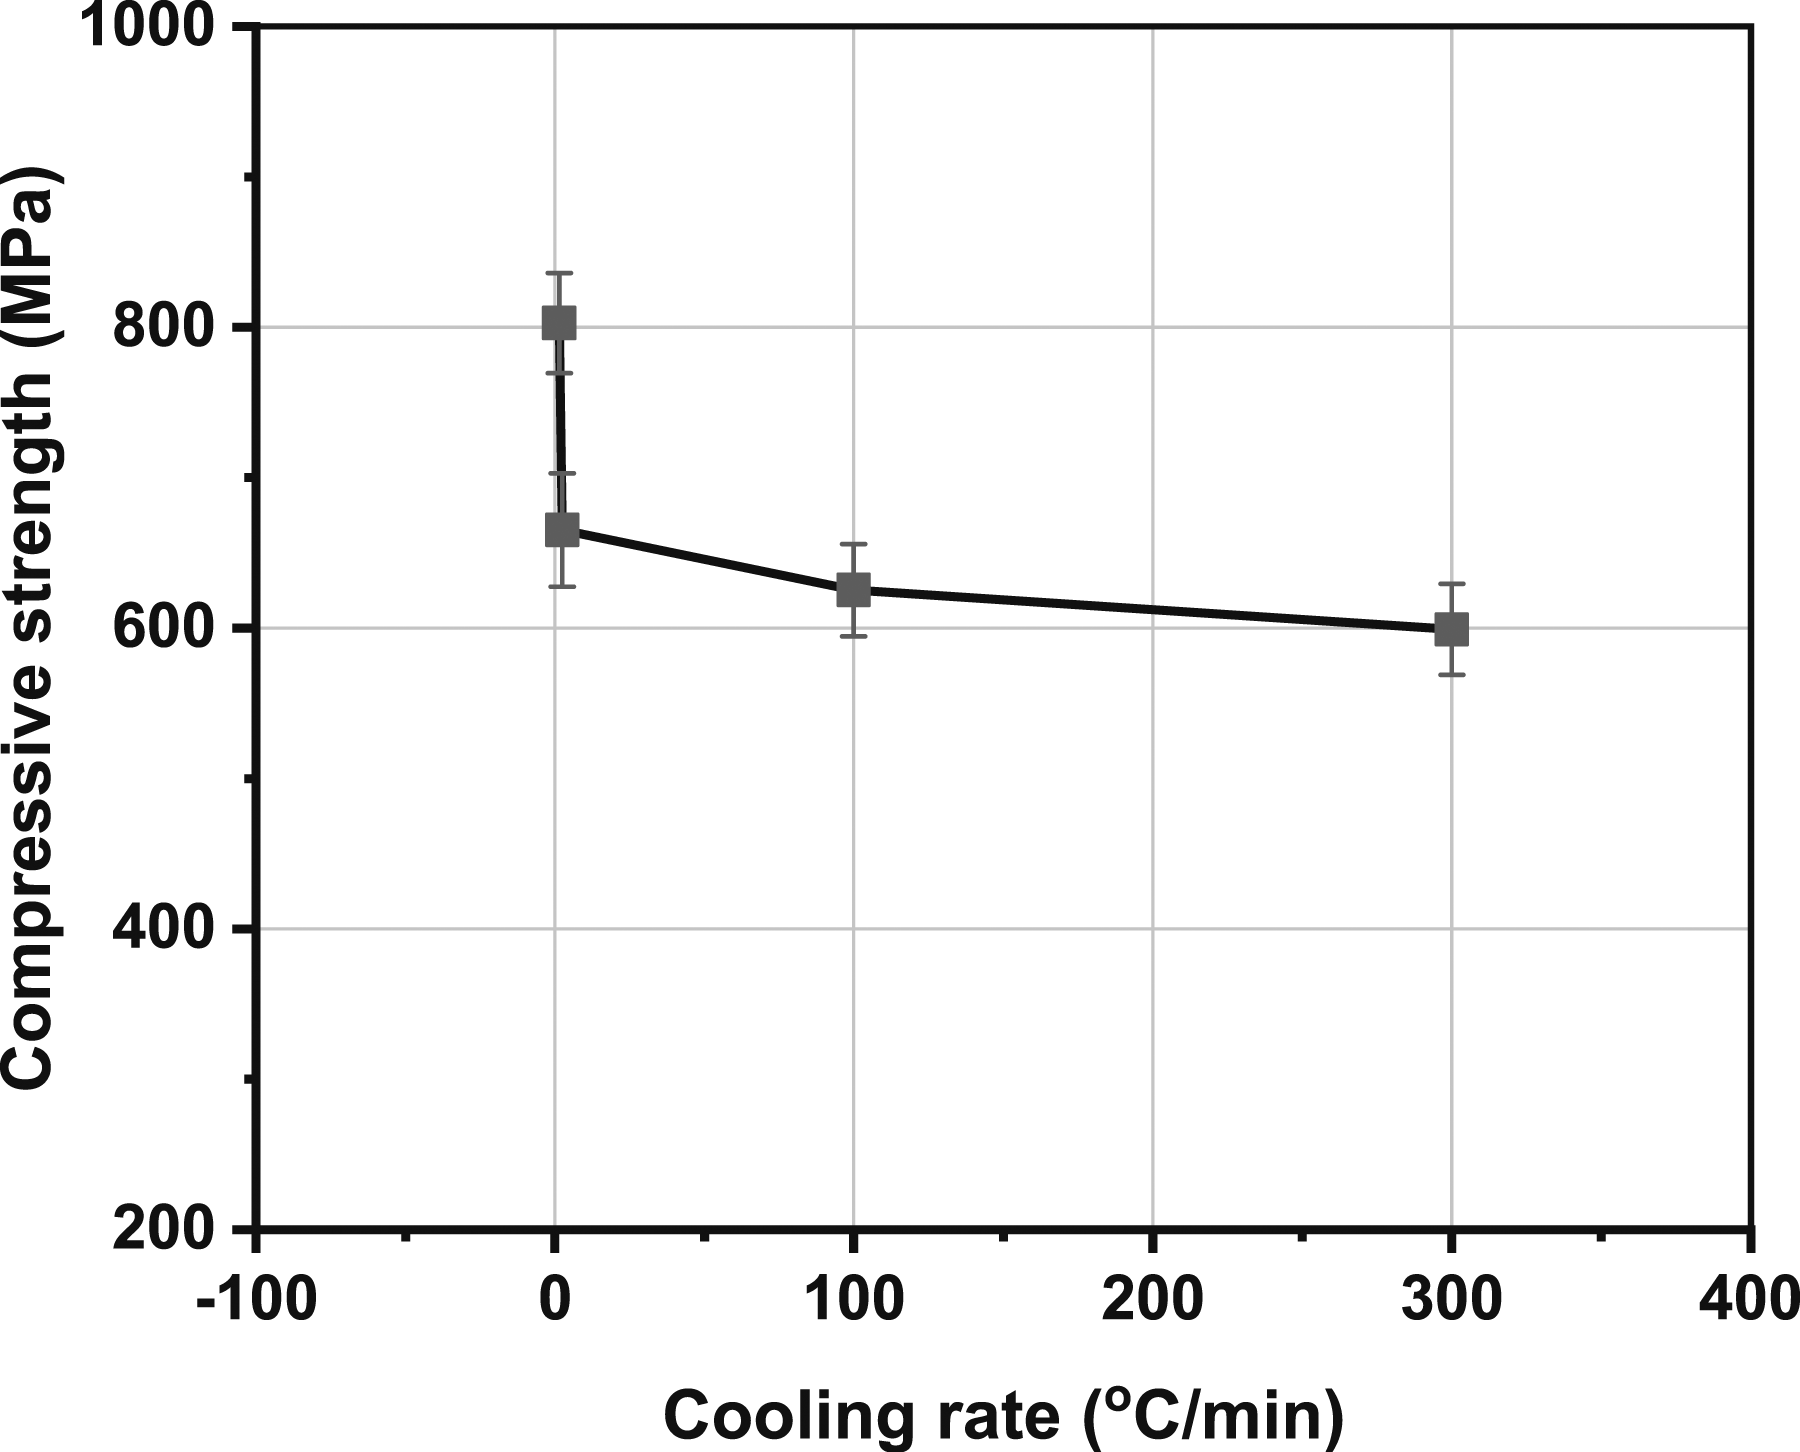
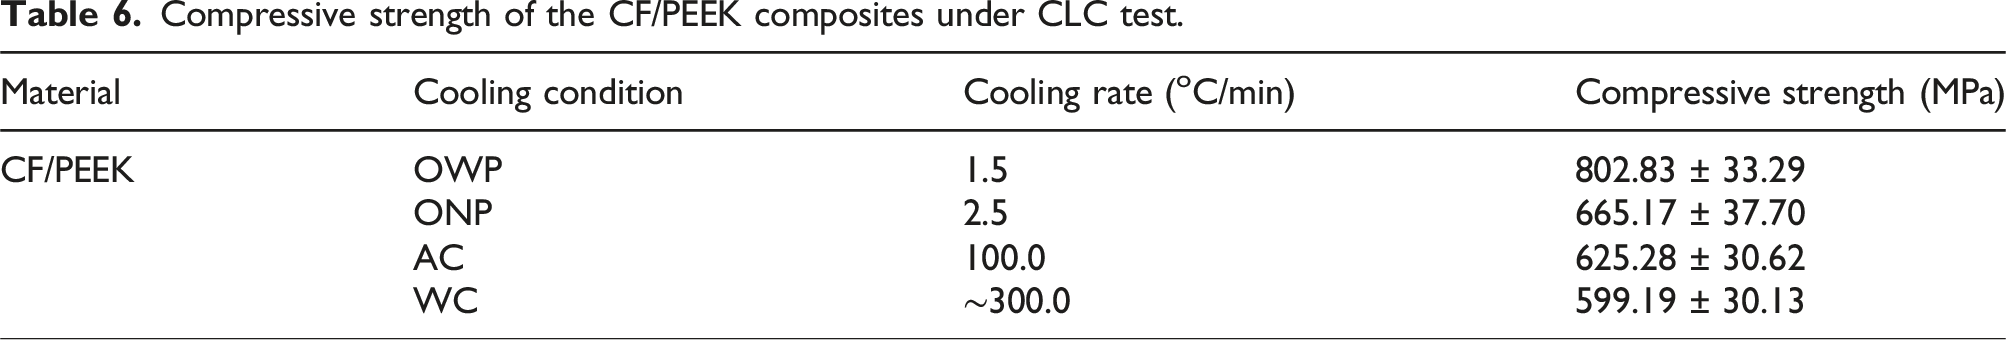
Figure 17 shows the macroscopic compressive failure of CF/PEEK samples across the width. It was deduced from the fracture morphologies that fibre buckling and micro kinking with transverse matrix cracks were the dominant failure modes. In particular, the mechanism that elicited the failure process was micro kinking followed by fibre buckling at the gauge length. This was inferred from the bending of fibres towards the centre of the sample. Contrary to the ILSS specimens, no brittle to ductile fracture transition occurred as the cooling rate increased. It may be due to fibre dominating the material's response in the longitudinal direction, so the matrix has a lesser impact on compressive strength. Also, no change was observed in the fracture's characteristics, either in the cooling rate evolution or the material used. At slow cooling rates (Figure 17(b) and (c)), transverses matrix cracks were dominant with less significant fibre buckling. With the increase in the cooling rate, the failure increased to fibre buckling and in-plane shear (Figure 17(d) and (e)). Macroscopic compressive failure of CF/PEEK composites: (a) Untested sample, (b) OWP-1.5°C/min, (c) ONP-2.5°C/min, (d) AC-100°C/min, (e) WC-∼300°C/min.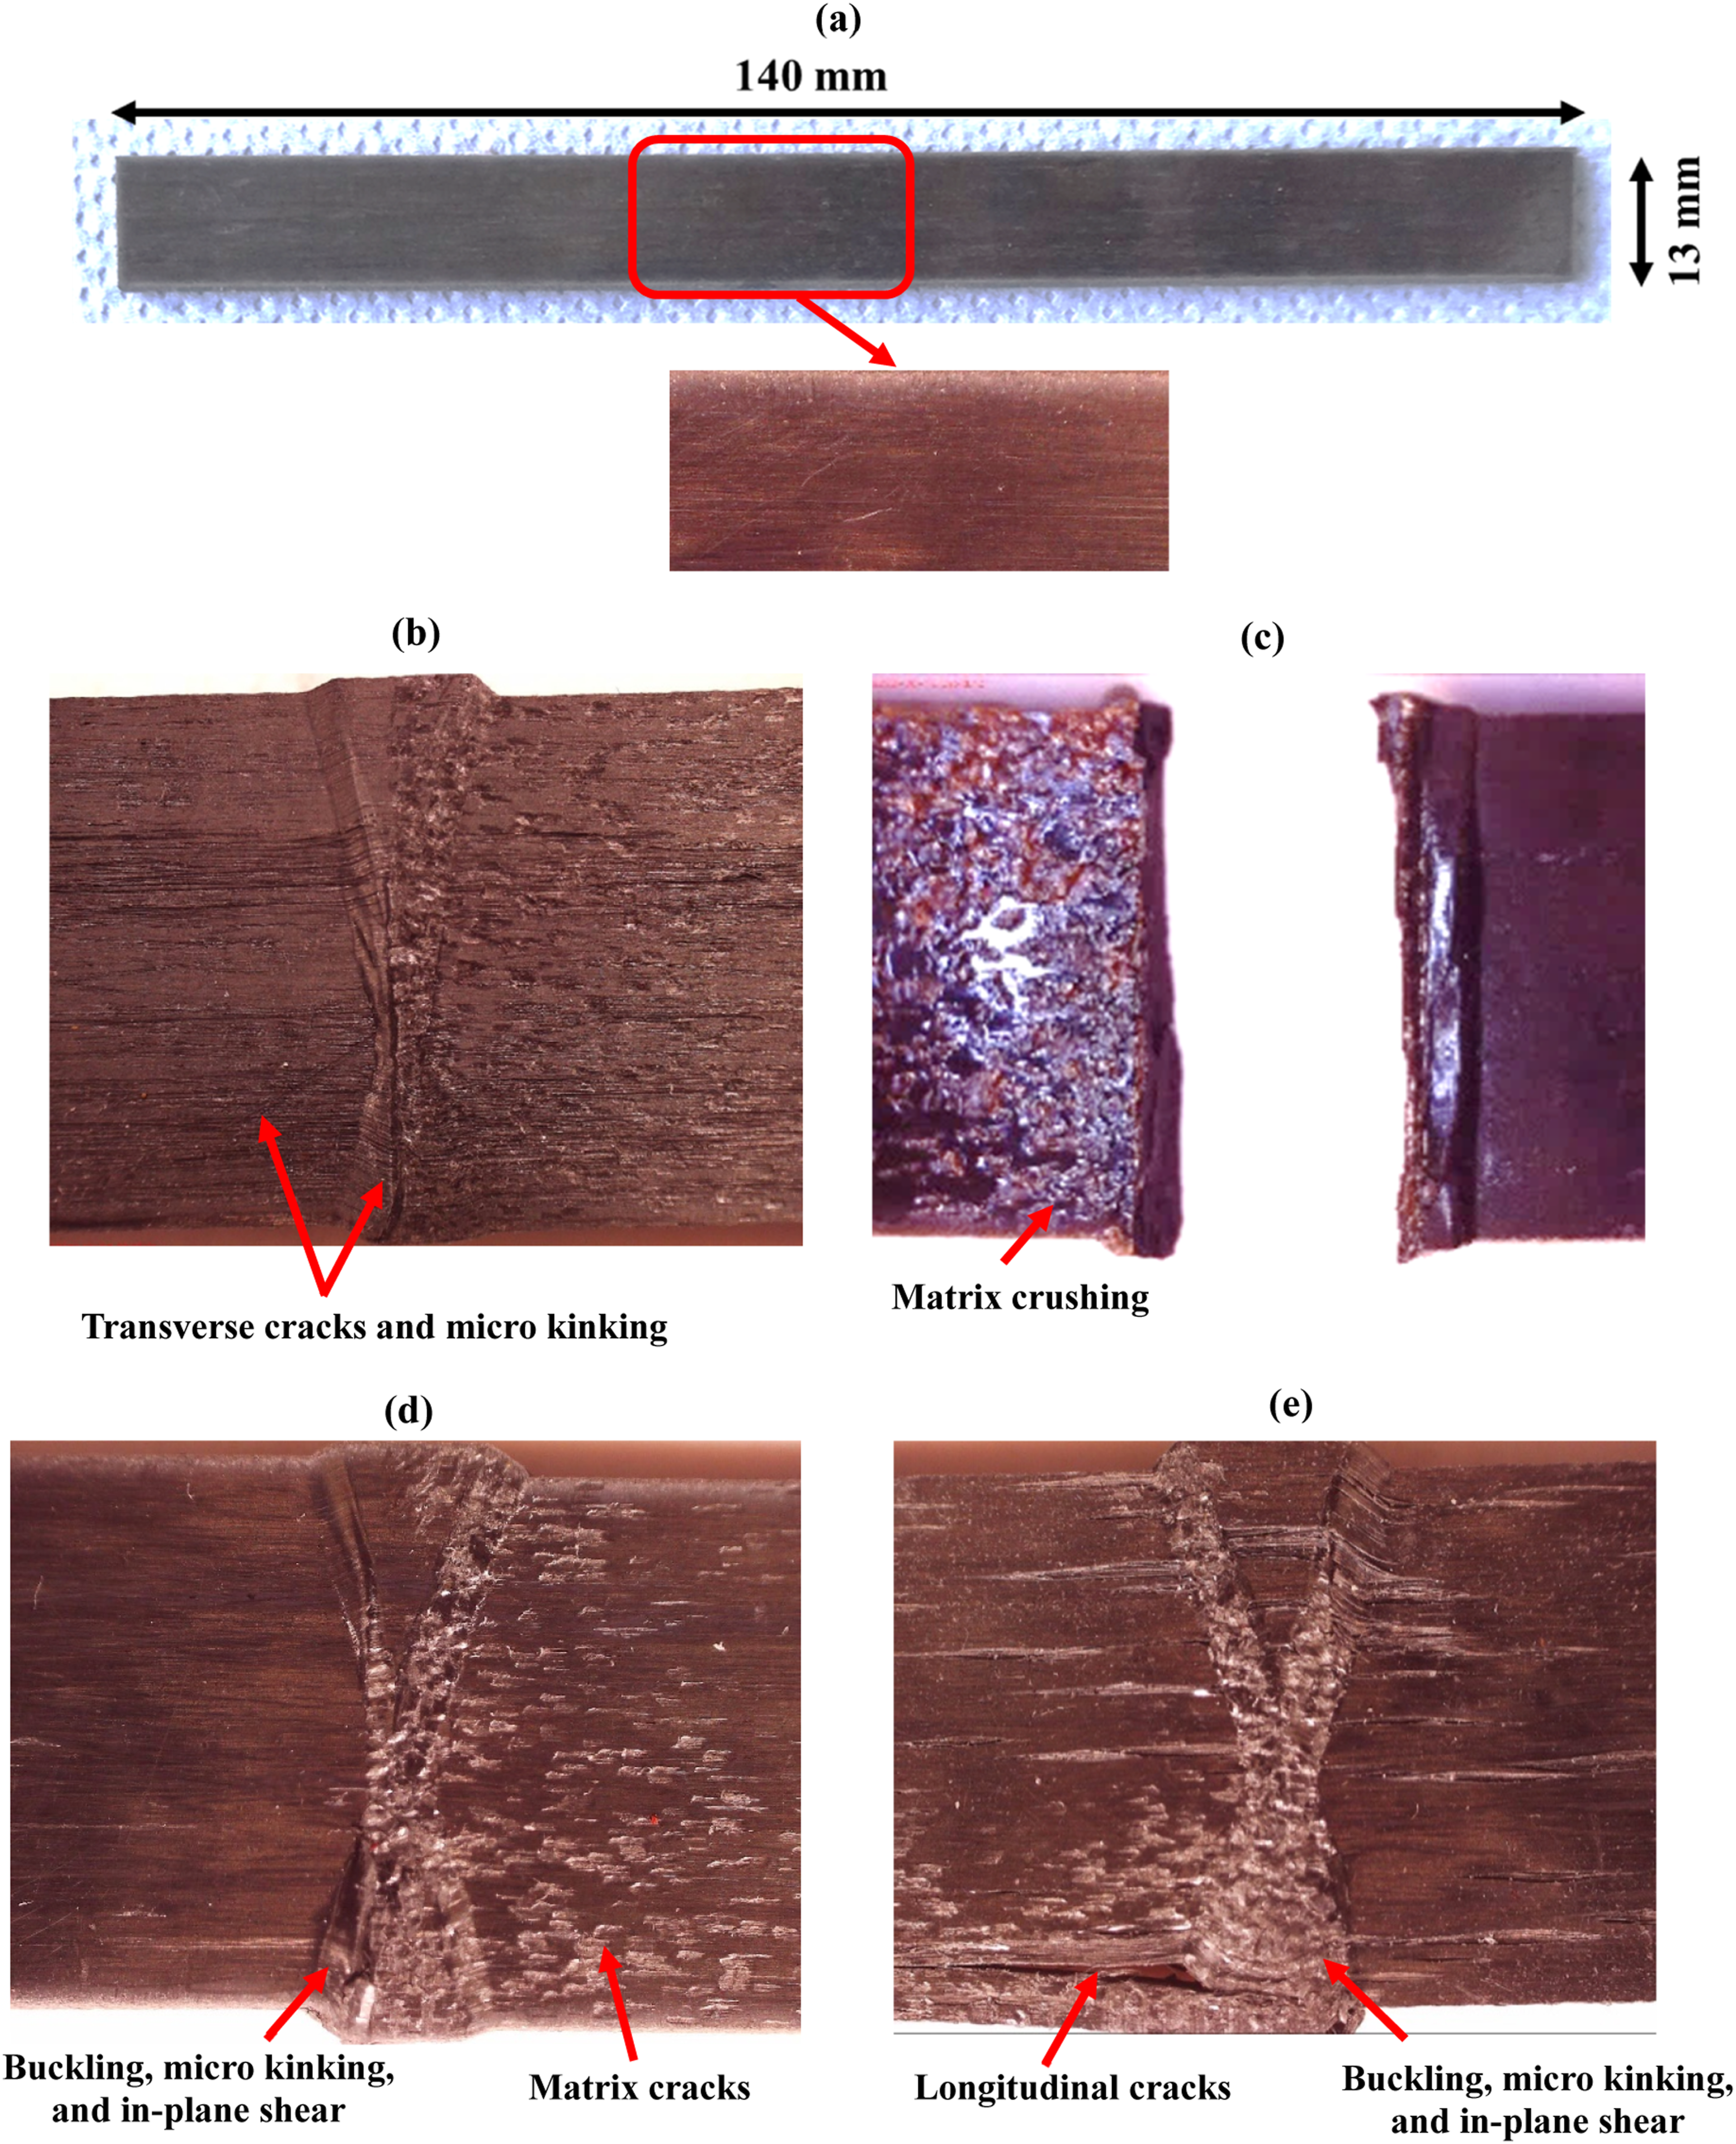
Optical micrographs of compressive failure were captured across the thickness of the sample and are shown in Figure 18. Evidence of kink bands, delamination, and shear cracks can be noticed, which aligns with typical compression failure modes. The increase of fibre buckling and cracks with cooling rate supports the observations made through macroscopic views. At higher cooling rates, transverse and longitudinal matrix cracking propagation across the plies was evident. Wider cracks and delamination in the case of high cooling samples (AC and WC) were due to the higher void content, which triggered the crack initiation. From the above observations and discussions, it is evident that compressive strength is closely related to defect content, such as void content, and the bonding at the fibre/matrix interface. This relationship is particularly notable in the sudden decrease in compressive strength observed when the cooling rate increased from 1.5°C/min (OWP) to 2.5°C/min (ONP), leading to delamination, as depicted in Figure 18(b). Therefore, to enhance the compressive properties of the laminate, it is imperative to keep the void content below 1.18% to maintain crack resistance against delamination. This study underscores the importance of compaction pressure during cooling to reduce void content. Optical micrographs of compressive failure in CF/PEEK composites: (a) OWP-1.5°C/min, (b) ONP-2.5°C/min, (c) AC-100°C/min, (d) WC-∼300°C/min.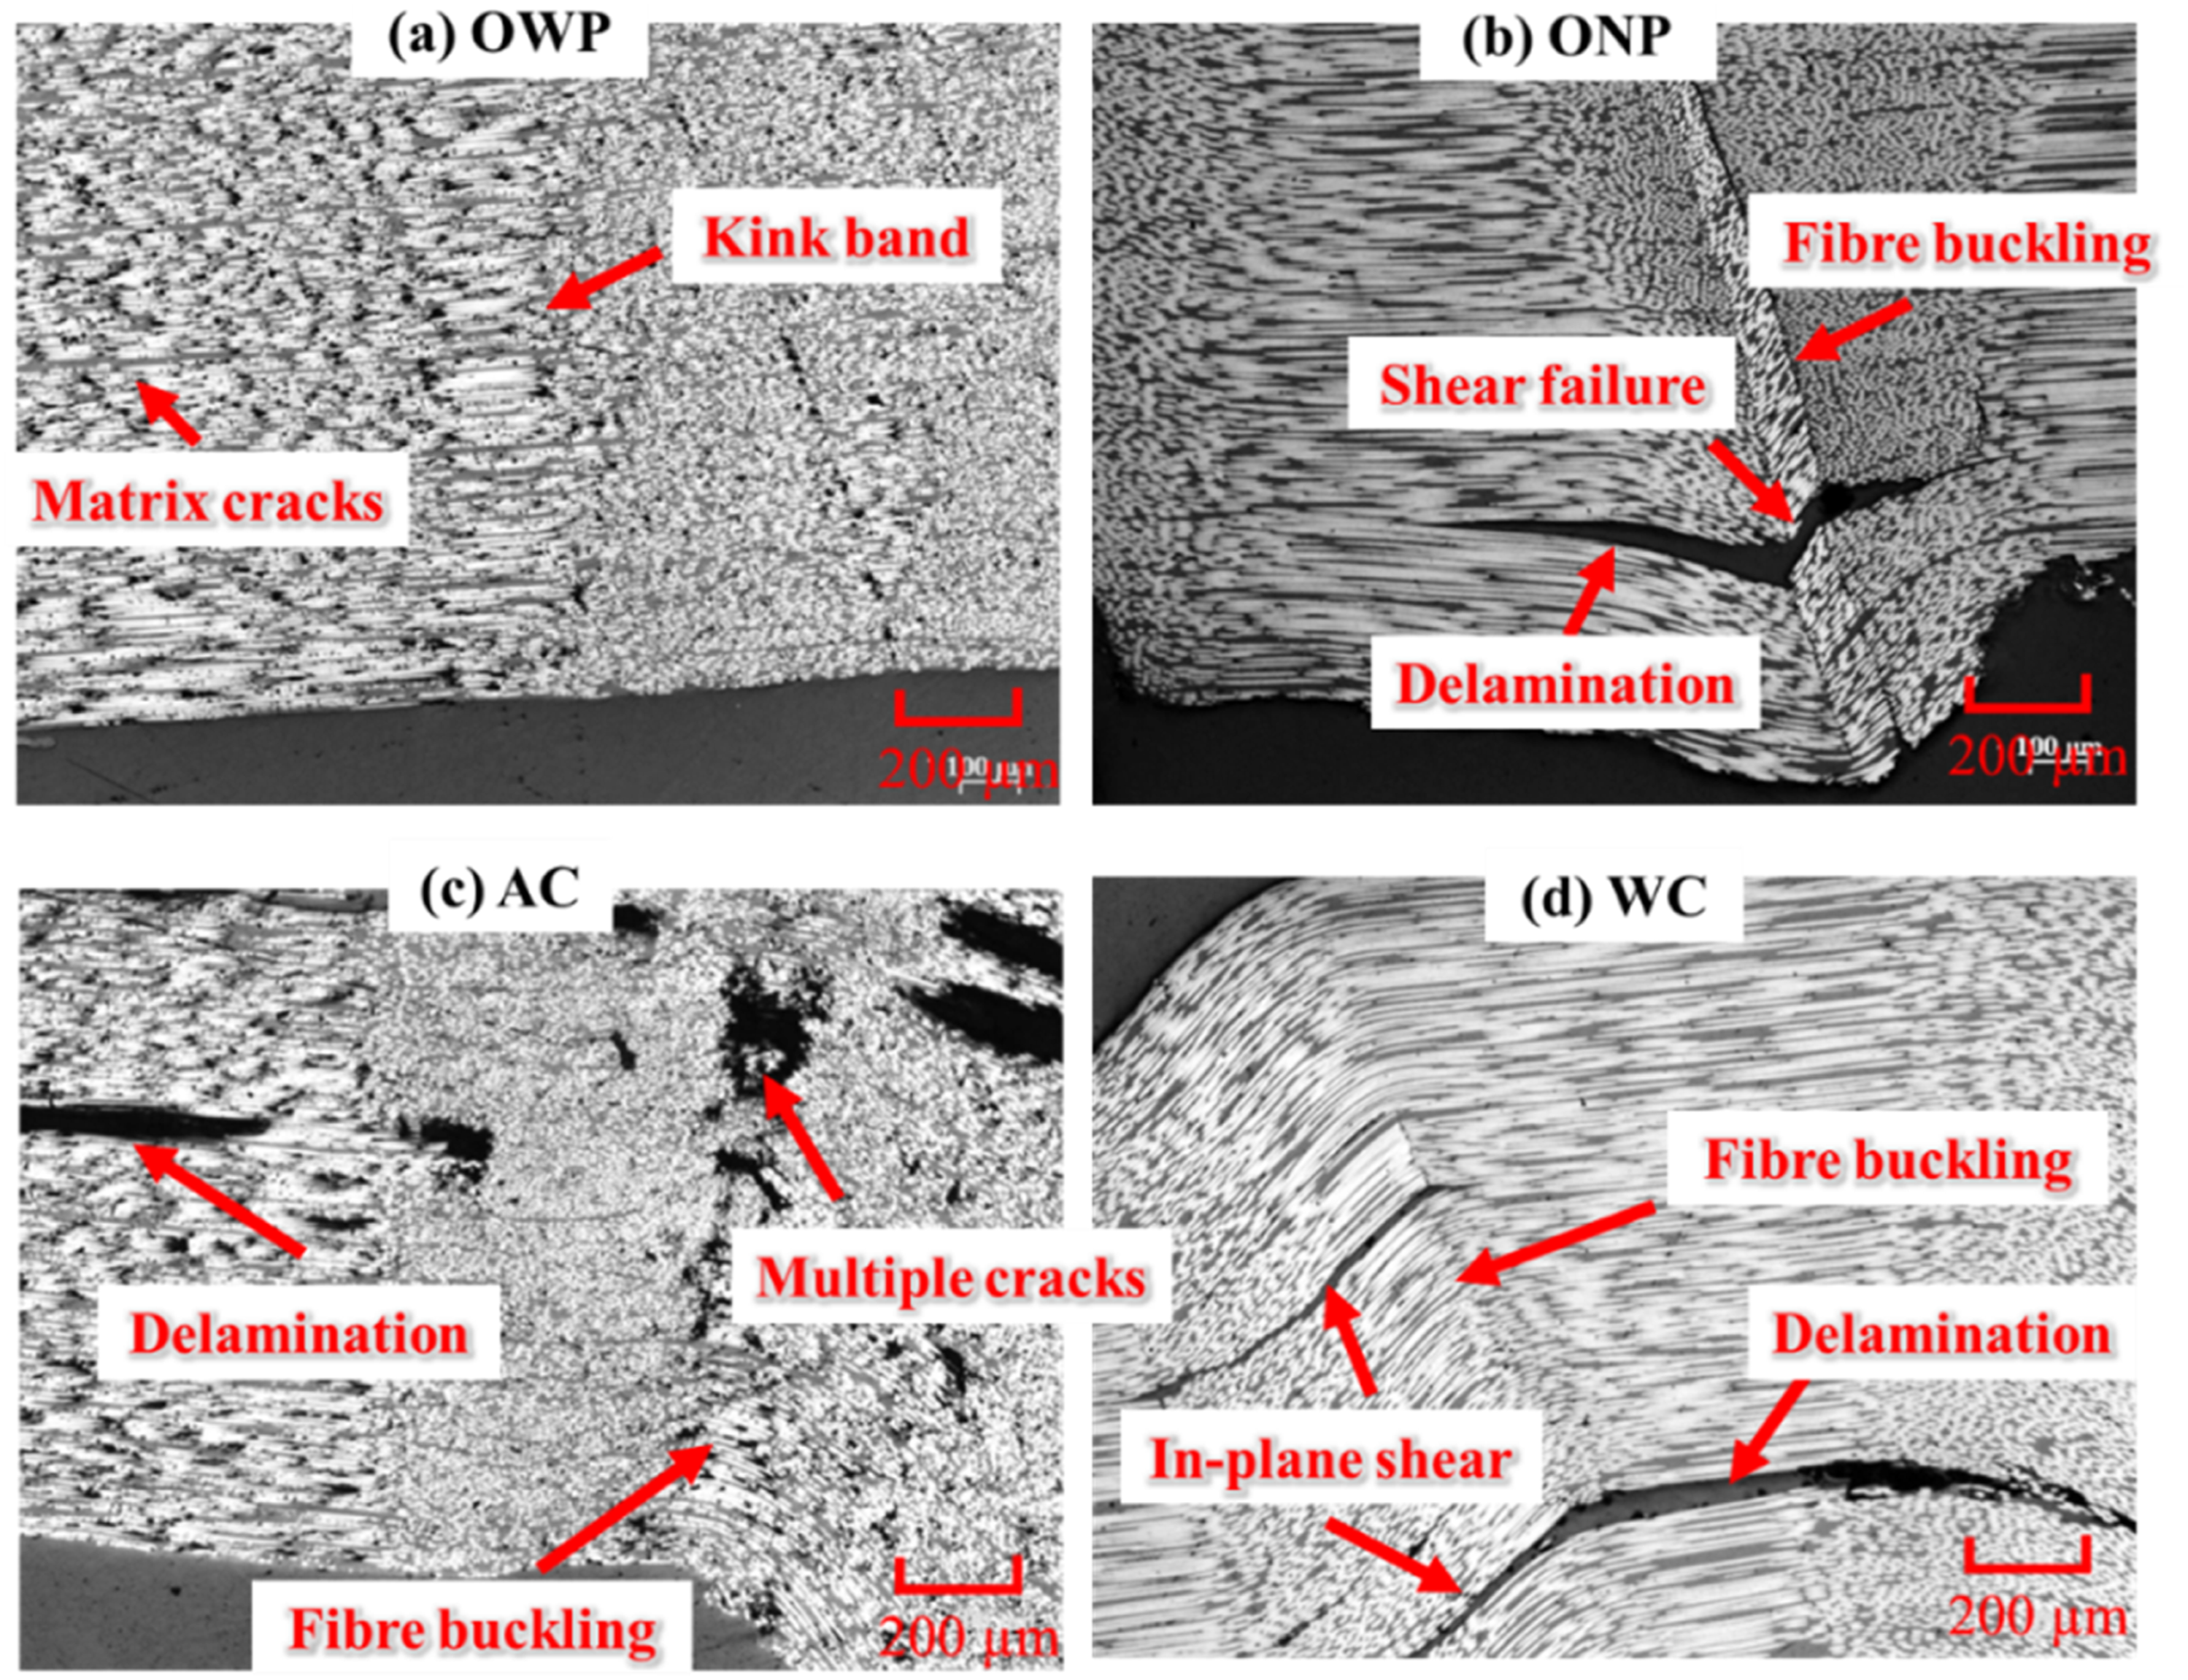
Conclusions
This study was carried out to bridge this gap on the impact of cooling rate on the crystallinity, morphology, ILSS and compressive properties of CF/PEEK prepreg composites. Four cooling conditions were employed to get different cooling rates. DSC assessed the crystallinity level, and the crystalline morphology was observed using the FIB etching technique. Based on the present study, the following conclusions were drawn: • Slow cooling under pressure decreases the void formation and improves the crystallinity, which in turn contributes to improved stiffness and bond strength. • For the cooling without pressure, there was also a significant correlation between the crystallinity and cooling rate. The level of crystallinity decreased with an increase in the cooling rate, as deduced from DSC and morphologies. A slow cooling rate led to better mobility of chains to form large spherulites, especially at the region where two fibres were closely packed, while fast cooling rates induced the crystallites and the remnant amorphous phase. • ILSS had a strong dependence on the cooling rate. With the increase in cooling rate from 1.5°C/min (OWP) to 2.5°C/min (ONP) and 100°C/min (AC), the ILSS was reduced by 10% and 17% respectively. The interlaminar shear to initiate delamination in the slow-cooled samples was higher than in the fast-cooled samples. This was attributed to a higher crystallinity, significantly suppressed void content and stronger adhesion between fibre and matrix, leading to a less pronounced interlaminar failure. • The compressive strength increased with the decrease in the cooling rate due to improvements in the fibre/matrix interface, the increase of the degree of crystallinity, and reduced void content, where the delamination was significantly suppressed.
Therefore, the present work demonstrated that ILSS and compressive properties of CF/PEEK composites can be optimised by adequately controlling processing conditions, precisely, the cooling rate and pressure. A pressure is always preferred during cooling to maintain the low void content. This might be useful for improving fast processing methods for CF/PEEK composites, such as LATP, where additional sources for pressure could be applied to reduce further the void generated apart from that by the compaction roller. Also, the bond strength of composites largely depends on the crystalline morphology of the matrix, the fibre-matrix interface and voids, which should be well-considered when modifying the process parameters.
Footnotes
Acknowledgments
The authors would like to thank Bernal Institute, University of Limerick, Limerick, Ireland, for allowing them to use the Hitachi-SU70 for SEM, XRD Empyrean and Netzsch Polyma 214 for crystallinity, and Gatan MET-ETCH (Model 691) for Ion Etching.
Declaration of conflicting interests
The author(s) declared no potential conflicts of interest with respect to the research, authorship, and/or publication of this article.
Funding
The author(s) received no financial support for the research, authorship, and/or publication of this article.
Data availability statement
Data sharing not applicable to this article as no datasets were generated or analyzed during the current study.