
Abstract
This study presents an investigation into mechanical and thermal properties, as well as the microstructure of Automated Fiber Placement-manufactured laminates using a novel carbon fiber-reinforced low-melt polyaryl ether ketone polymer material. The material’s lower melting temperature and lower melt viscosity as compared to established high-temperature thermoplastic materials as PEEK, promises favourable characteristics for the Automated Fiber Placement process. This work aims at in-situ consolidation and the influence of a heated tooling and a post process tempering step, which both turned out to be promising in previous investigations. Laminates were manufactured using a cold tooling, a heated tooling configuration, a cold tooling with a subsequent tempering process step and a hot-pressed reference laminate. Differential Scanning Calorimetry showed that crystallinity values more than doubled for the heated tooling and post process tempering configurations, compared to the cold tooling, reaching 24% and 30%, respectively. Mechanical strength values showed an increase in interlaminar shear strength and compression strength but did not increase to the same extent as was expected from the increase in crystallinity. With Scanning Electron Microscopy differences in the microscopic structure of the polymer matrix could be detected. While the post process tempering step leads to a mostly lamellar crystalline structure, the heated tooling configuration and the post process hot pressing induce a predominance of crystalline spherulites, which might positively affect the mechanical performance. Computed Tomography scans revealed a high amount of porosity in the in-situ-manufactured samples and unprocessed tape material, which likely mitigated the positive effect of increased crystallinity.
Keywords
Introduction
Fiber-reinforced polymers have become increasingly important in the aircraft industry in recent years. Due to their high directional specific strength they are a promising facilitator for a new generation of light and strong aircraft structures. Within the family of carbon fiber-reinforced polymer (CFRP) materials, those featuring a thermoset matrix are already successfully deployed in serial production,1,2 with newly-developed thermoplastic-matrix materials also beginning to enter the market. The advantage of these new thermoplastic materials is, among others, their ability to be repeatedly heated and therefore bonded to similar structures. This feature thus opens up a range of new manufacturing possibilities from ultrasonic or resistance welding through to out-of-autoclave manufacturing of parts using in-situ Automated Fiber Placement (AFP).
The production of thermoplastic composite components using laser-assisted AFP has been the topic of extensive investigation for more than a decade,3,4 with older versions of the technology, specifically hot-gas AFP reaching back more than two decades. 5 Throughout these investigations, PEEK has been the predominant matrix material under consideration,3–5 with less frequent but equally thorough studies of PEKK and PPS, not to mention PA. Across all studies the overarching goal has remained largely the same: to produce high-quality parts which take full advantage of the fiber and polymer properties of the composite material.
Recently, a novel high-temperature thermoplastic material, low-melt polyaryl ether ketone (LM-PAEK) was added to the existing market of high-performance and commercially available thermoplastic materials for engineering structures. The material’s inherently lower melting temperature and melt viscosity, compared to PEEK, 6 aims to achieve enhanced intimate contact and faster bonding during processing. 7 These are particularly attractive properties for high-speed AFP manufacturing, where faster deposition rates can be used to increase the rate of production. Recently layup speeds of up to 100 m/min using prepreg CF/LM-PAEK material were reported, with a subsequent hot press consolidation process used to realise the final part. 8 Other similar studies include those of Lian et al., an extensive material characterisation of laminates manufactured from Toray´s Cetex® TC1225 (CF/LM PAEK) by hot pressing. 9 However, as highlighted by Arquier et al., 10 most of the research on CF/LM-PAEK still focuses on prepreg lay-up with post consolidation, with fewer studies looking to perform similarly extensive characterisations on parts produced using single-step or “in-situ” AFP manufacturing. That is not to say there are none, with studies by Heathman et al. and Seneviratne et al. investigating the impact of in-situ manufacturing parameters on the interlaminar shear strength (ILSS) by means of short beam shear (SBS) tests.11,12 These studies yielded values of 60 MPa and 41 MPa, respectively, using CF/LM-PAEK prepregs from different manufacturers and with different fiber volume contents: Suprem 55% in Heathman et al. and Toray Cetex® 60% in Seneviratne et al. While ILSS is undoubtedly a critical mechanical property for assessing the performance of composite laminates, it is not alone able to capture all relevant properties, such as those in tensile and compressive loading. This therefore forms the key focus of this study: to comprehensively assess the mechanical performance of laminates produced from CF/LM-PAEK using in-situ AFP with respect to a broad range of mechanical properties including shear, tension, and compression.
While in-situ AFP manufacturing is able to avoid the additional investment and operational costs of a second thermoforming process (pressing or autoclave), it also means that the final part quality is entirely dependent on the success of the AFP layup, a complex process depending on multiple processing parameters. Already in 1997 Pitchumani et al. showed the influences of varying torch temperature (hot gas) and line speed in a numerical process simulator for CF/PEEK and the importance of defining a right processing window with optimum processing parameters. 5 Khan et al. also investigated the influences of gas volume flow, processing velocity, tool temperature and consolidation force for the tape placement process of CF/PEEK. 13 More recently, Heathman et al. found that lower speeds, higher processing temperatures and larger compaction forces enhance interlaminar bonding for CF/LM-PAEK specifically. 11 At the German Aerospace Center´s (DLR) Institute of Structures and Design, initial studies into CF/LM-PAEK14,15 were conducted on AFP bonding samples to determine optimal processing parameters by means of a Design of Experiment (DoE) approach, wich was already used in a former study on CF/PPS by Dreher et al. 16 Within this study, tooling temperature was shown to be of particular interest, supporting similar observations from other works.12,17,18 This is due to the relatively long-term exposure to the tooling surface when considering the time scale of other processing parameters such as the nip-point temperature. The impact of tooling temperature was therefore selected as the primary parameter of interest for this study.
The work presented here details a comprehensive characterisation of the mechanical performance of CF/LM-PAEK laminates produced using in-situ AFP. Eight different laminates were investigated within this work, exploring and quantifying the effect of tooling temperature during the in-situ process as well as post-manufacturing tempering without bagging or vacuum steps. A hot pressed laminate was used to depict properties for a good laminate quality and to specify the performance gap which still needs to be closed. The quality of the raw tape material was examined. These results combined with the laminate´s results provide detailed insight into the potential of CF/LM-PAEK for future structural applications.
Materials and methods
AFP manufacturing facility
The AFP facility used for laminate production within this investigation deposits and consolidates thermoplastic prepreg material using a Multi Tape Laying Head (MTLH). The end effector, a development of the company Advanced Fibre Placement Technology (AFPT GmbH, Dörth), is attached to a six degree-of-freedom robotic arm. The MTLH can process up to three 0.5 in unidirectional prepreg tapes. Laminates were manufactured on a two-degree-of-freedom heatable tooling (Figure 1). A 6 kW diode laser (λ = 980 - 1020 nm) type LDF 6000-100 from Laserline GmbH was used as a heat source. The square focus of a homogenizing optic was adjusted to the width of three parallel placed 0.5 in tapes. Laminate production in DLR’s thermoplastic Automated Fiber Placement (AFP) facility in Stuttgart, Germany.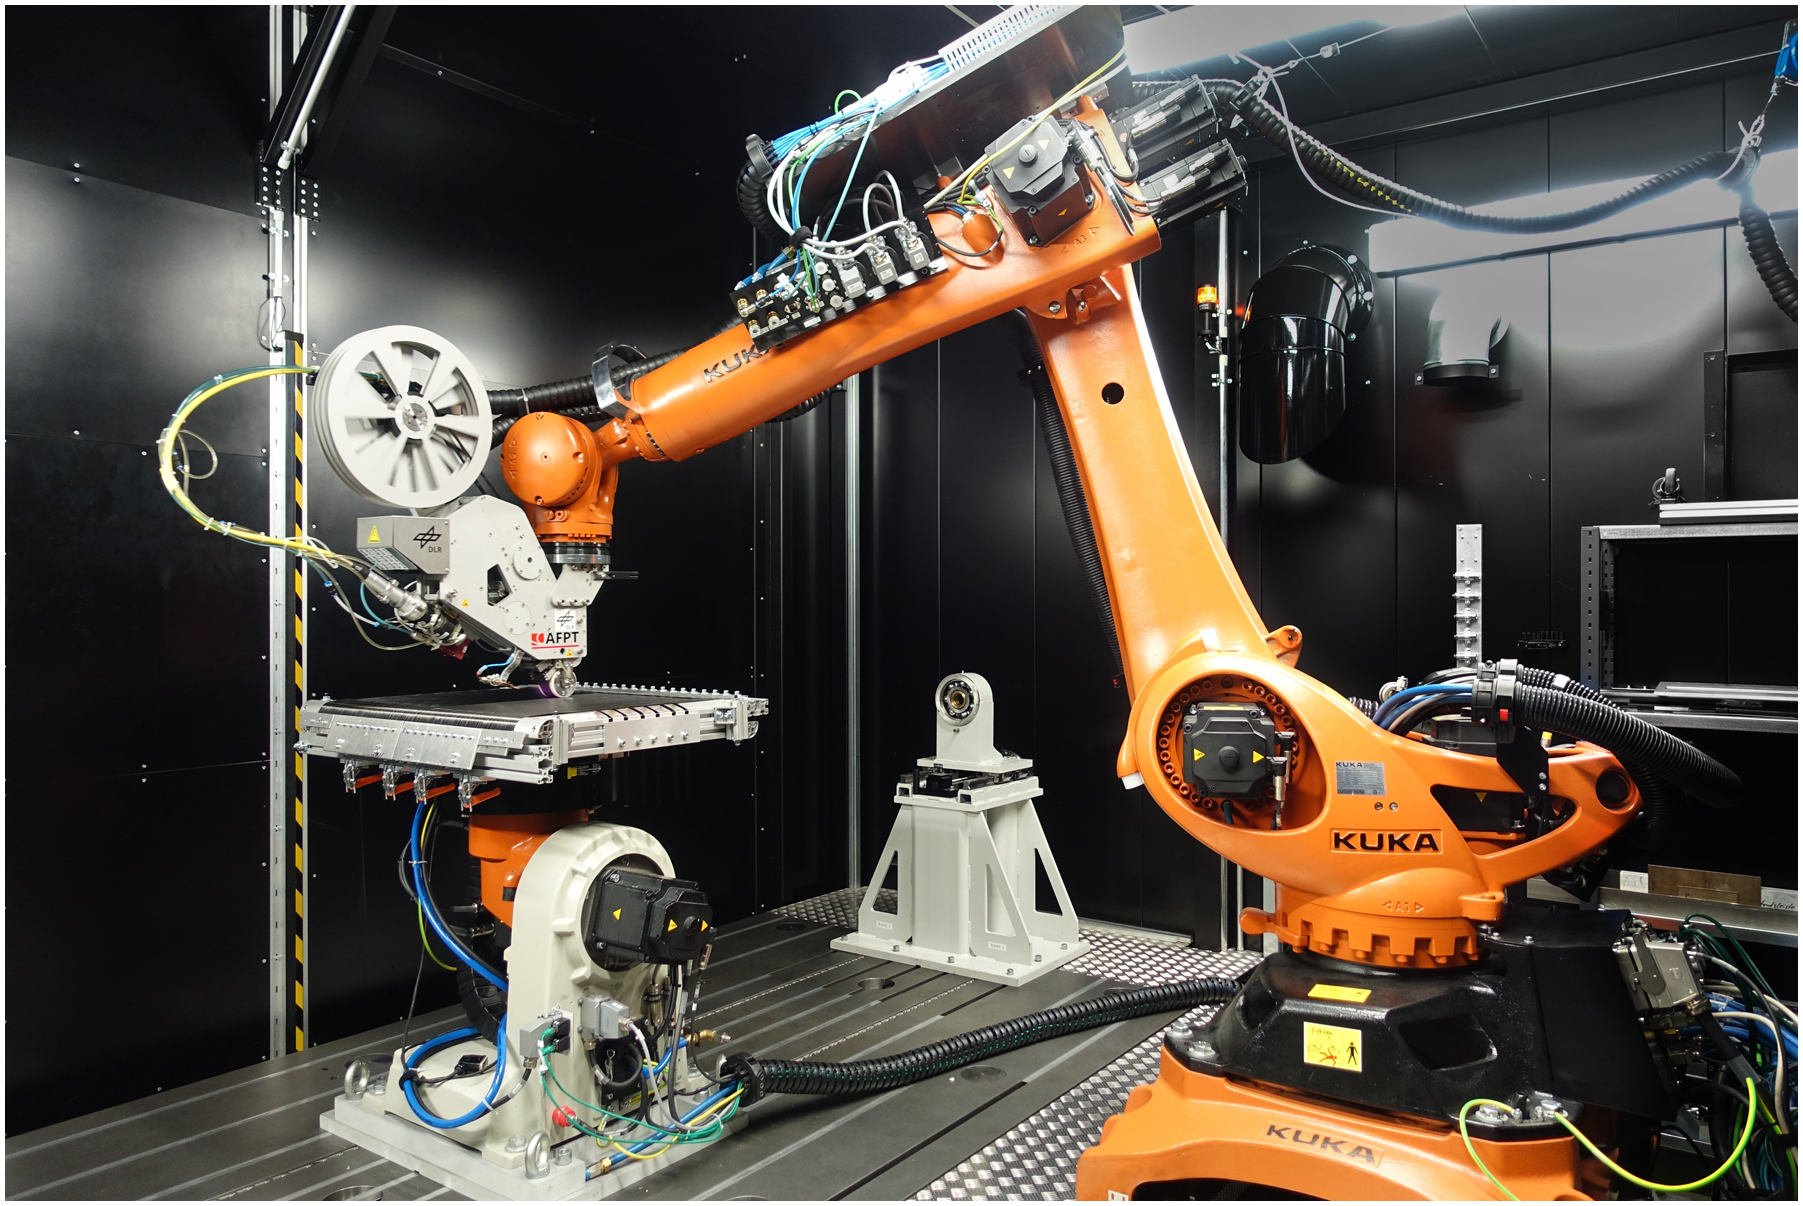
Fiber-reinforced thermoplastic material
Process parameters
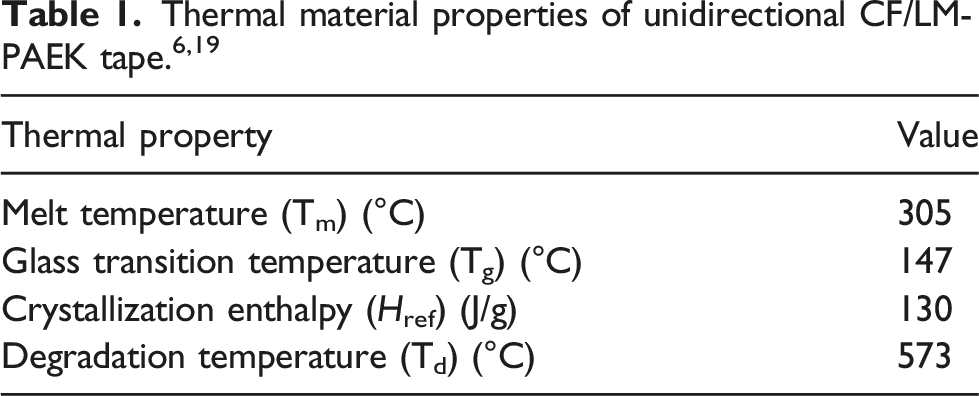
The influence of processing parameters on the tape laying process has been the subject of many studies.3–5,11,13,16,17 As for all thermoplastic composite materials, the four most important parameters for the in-situ consolidation process are the nip-point temperature, tooling temperature, consolidation roller pressure and layup speed. For the purpose of the work presented here, the optimal processing parameters were selected to be those which yielded the highest mechanical shear strength in the interlaminar region and were selected from recent in-house studies on the same material.14,15 The parameters used within this study can be formulated as follows: [Tnp, Ttool, proll, vlayup] = [470°C, 200°C, 6 bar, 7.5 m/min]. The nip-point temperature Tnp is actively regulated during tape laying using a thermal camera and an emissivity coefficient ε = 1. The same camera also measures the incoming tape and substrate temperatures. This temperature is significantly higher than the polymer melting temperature but was observed to yield superior ply bonding strength in the aforementioned studies. Furthermore, it remains well below the polymer degradation temperature; 573°C. 6 While certain studies utilise tooling temperatures close to the glass transition temperature to minimise internal stresses in the laminate, in-situ tape laying intends to promote crystallization as well as reduce internal stresses, thus requiring a higher temperature still. It should be noted that the tooling set temperature is used for the purpose of this study. The reason for this is that the true surface temperature of the tooling varies over the total tooling area and transiently with increasing volume of composite material deposited onto the tool. 20 The consolidation pressure of 6 bar is the system pneumatic pressure, which results in 500 N of consolidation force. A water-cooled Shore A 60 silicone roller with 5 mm sheath thickness, 60 mm width and 80 mm diameter was used.
Laminate production
Based on the DoE the best parameters where chosen for laminate production. The heated configuration with a tooling temperature of Ttool = 200°C is hereinafter referred to as heated tooling configuration. For industrial use an unheated tooling is desirable due to cost savings compared to a heated tooling. To examine the performance of an in-situ manufactured laminate produced at room temperature (20°C) a cold tooling configuration was studied. Serving as reference close to a press consolidated laminate, a laminate produced by AFP on a hot tooling was post-consolidated using a hot press in a secondary process step (heated tooling & hot pressed). The tooling temperature prior to press consolidation can be neglected and was chosen for manufacturing reasons. The investigations in Ref.
14
showed a promising increase in shear strength and crystallinity values for a post tempering treatment. Therefore, laminates placed on an unheated tooling were subsequently tempered in an oven (cold tooling & tempered) as a secondary cost-efficient heat treatment compared to an autoclave or hot pressing process. For all four configurations laminates with both a unidirectional (UD) and quasi-isotropic (QI) layup were manufactured. As first plies UD-prepregs were mechanically clamped on top of the tooling. The UD panels were built up with 12 layers, staggered to avoid stacking of potential gaps or overlaps. To gain a balanced and symmetrical QI panel 16 layers with a stacking sequence of [90°/–45°/0°/45°]2s were placed. The standard trimmed laminate size is 428 mm × 648 mm for the QI panels. For the UD layup two panels were sufficient for the number of test specimens and were therefore cut in half for additional heat treatment processes. Figure 2 gives an overview over the eight produced laminates. Overview produced laminates.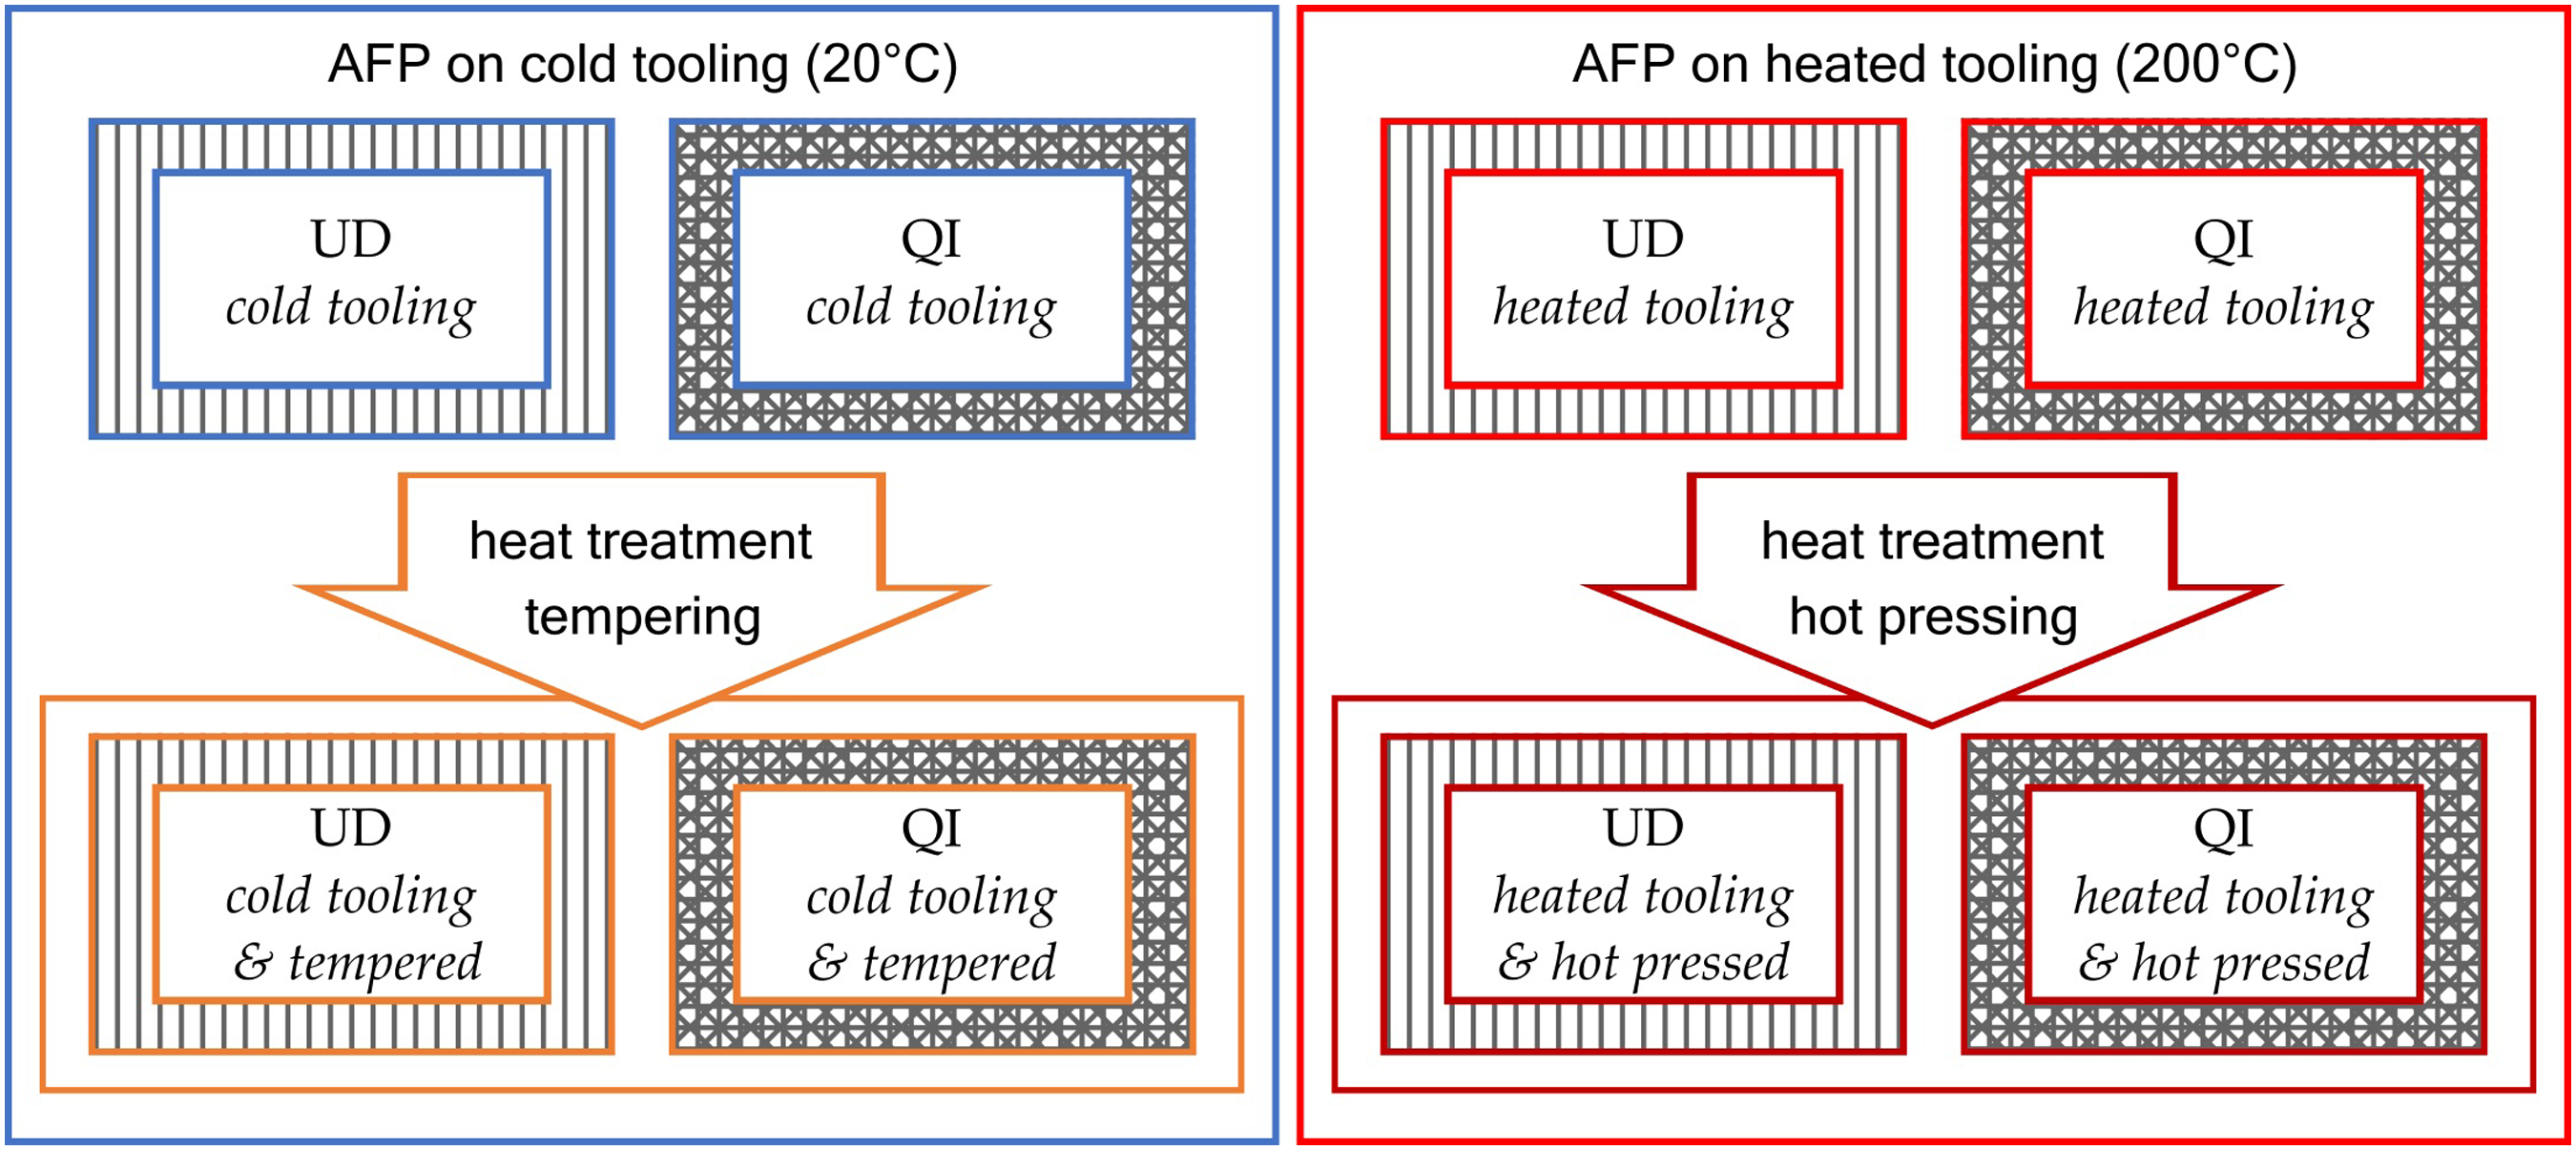
Post-manufacturing heat treatment
Tempering cycle
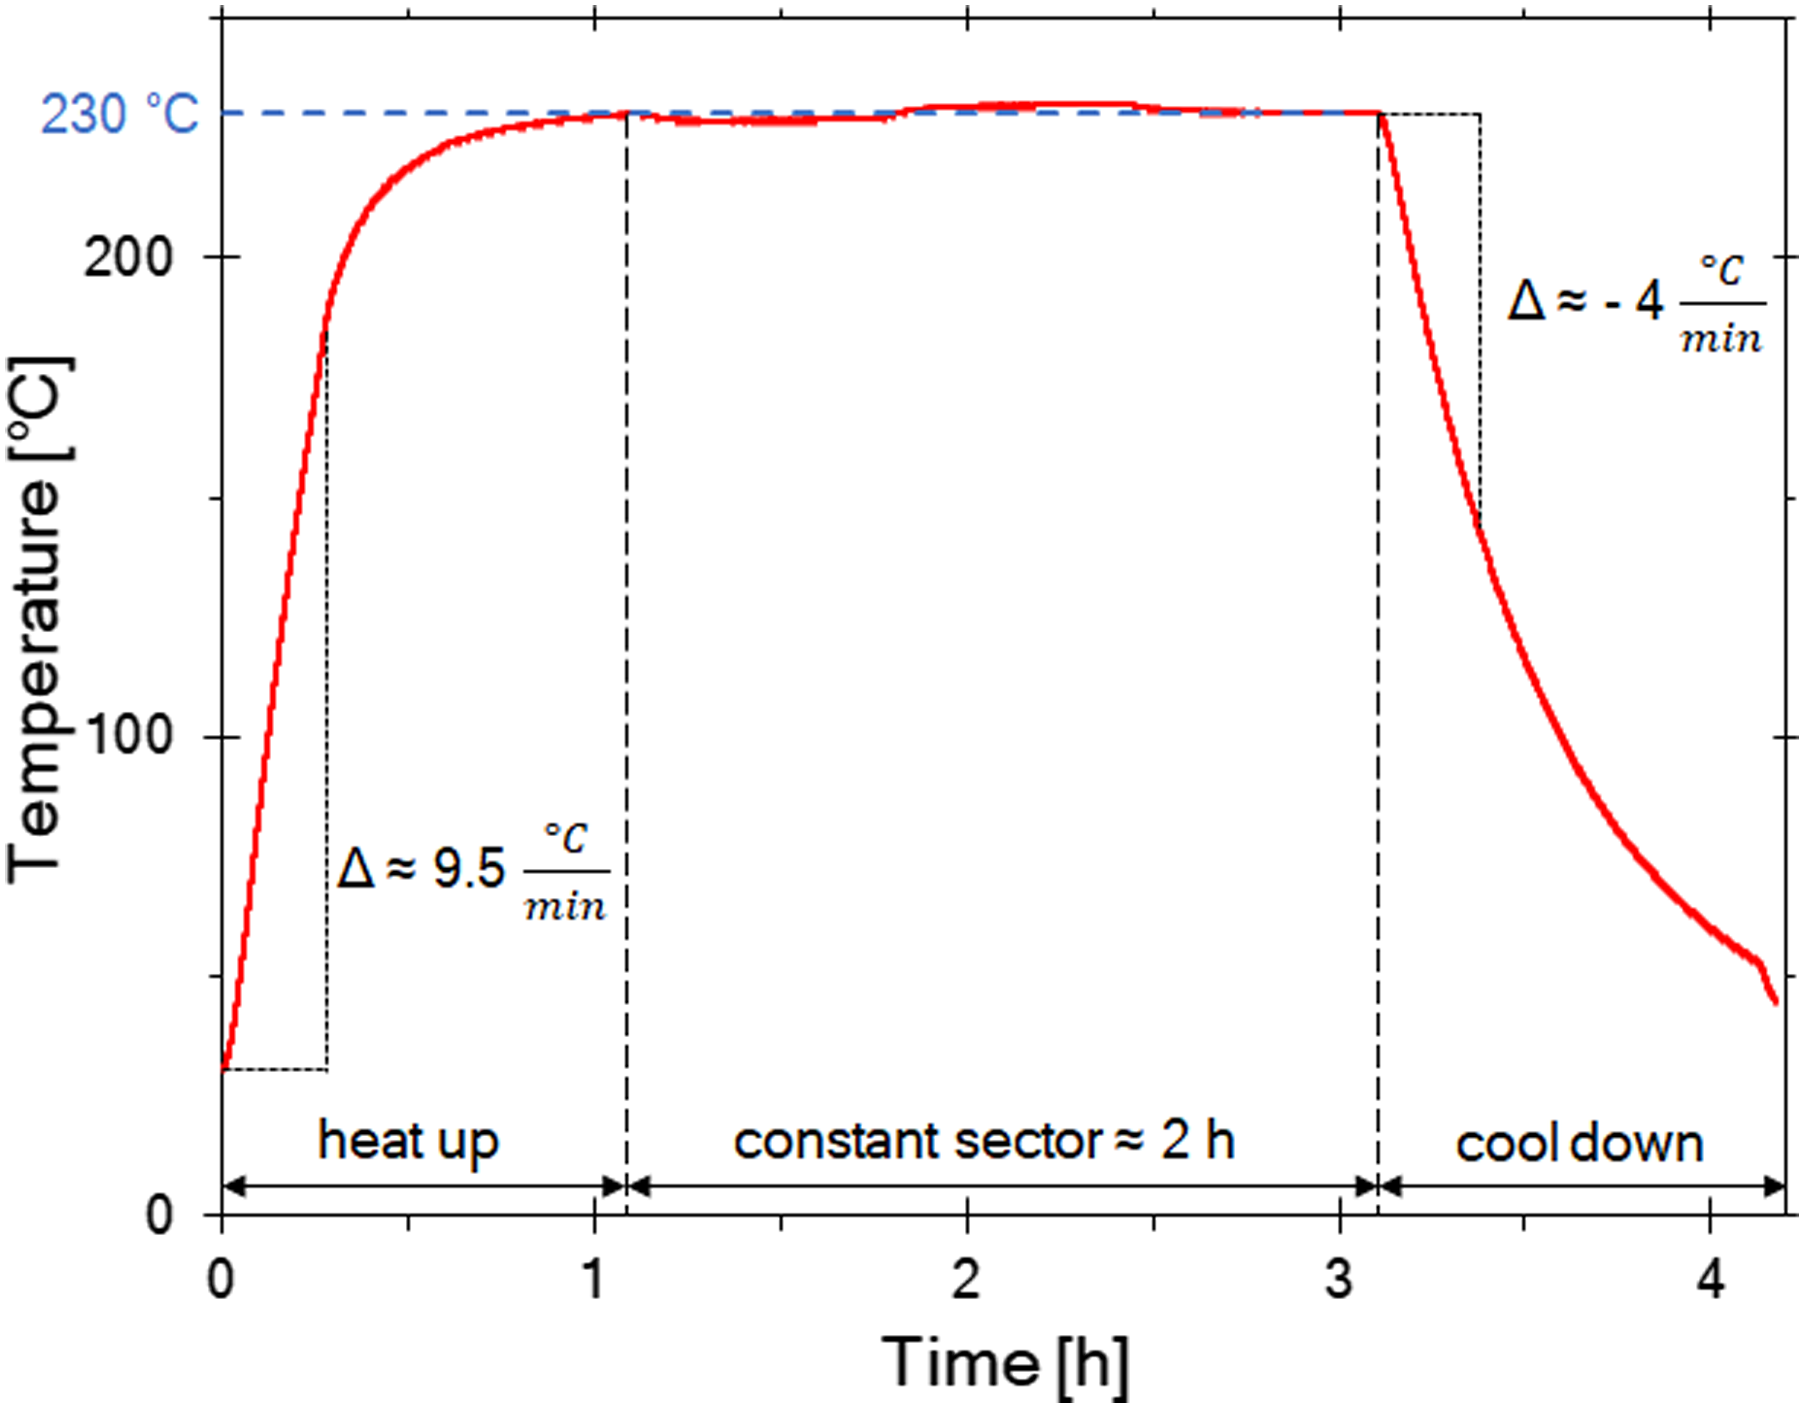
One of the QI laminates and half of the UD laminate, which were produced on a cold tooling, were tempered in an oven at a temperature of 230°C with a dwell time of 2 h. This dwell time was selected to ensure thermal saturation of the 3 mm thick panel and the temperature was selected as the maximum limit of a facility in which tempering of large-scale parts can be performed. As has been shown in previous studies, long-duration tempering of thermoplastic composites at temperatures above the cold crystallization temperature is effective in inducing secondary crystallinity in the matrix.
20
This is supported by the findings of this study as presented in the results chapter. Figure 3 shows the laminate in a Heraeus NTU 100/150 oven. The temperature cycle was recorded using a thermocouple and is displayed in Figure 4. Laminate in oven for tempering process. Tempering in oven: temperature cycle.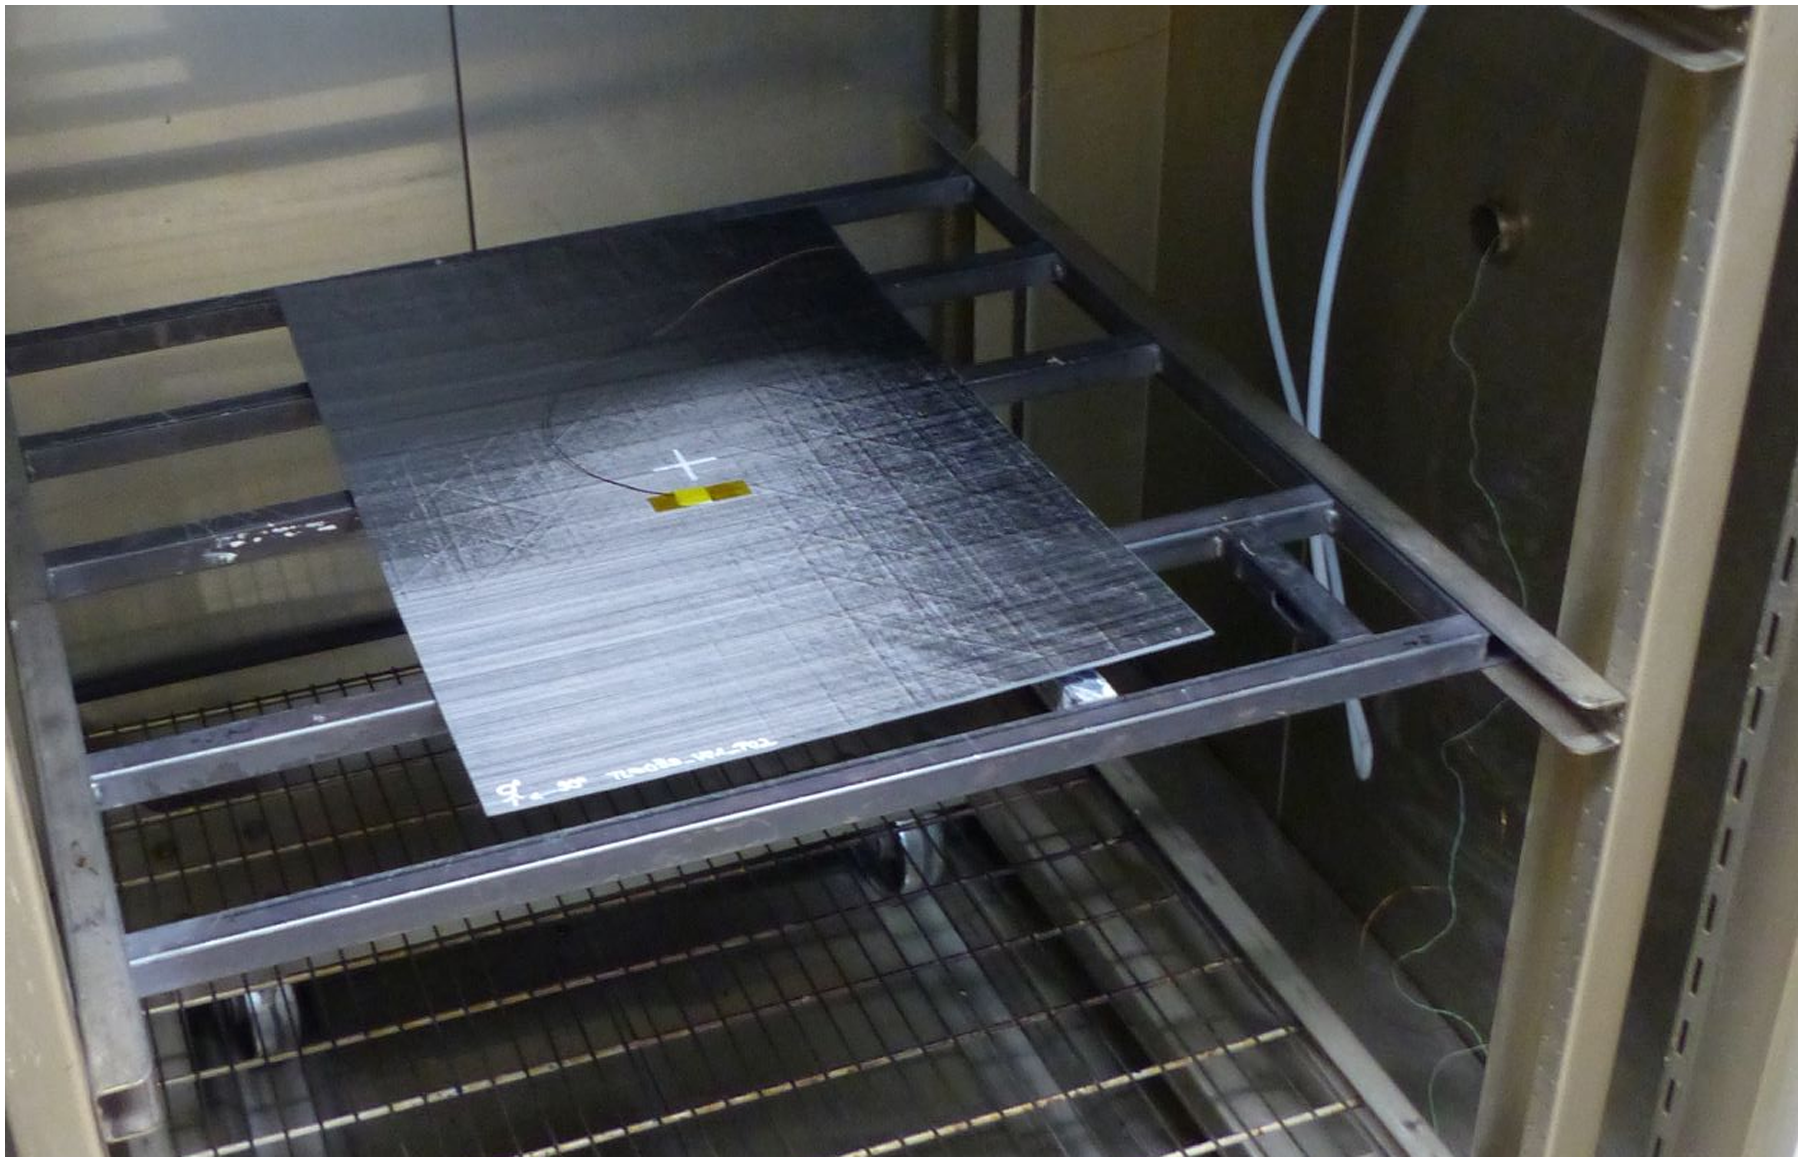
Hot pressing
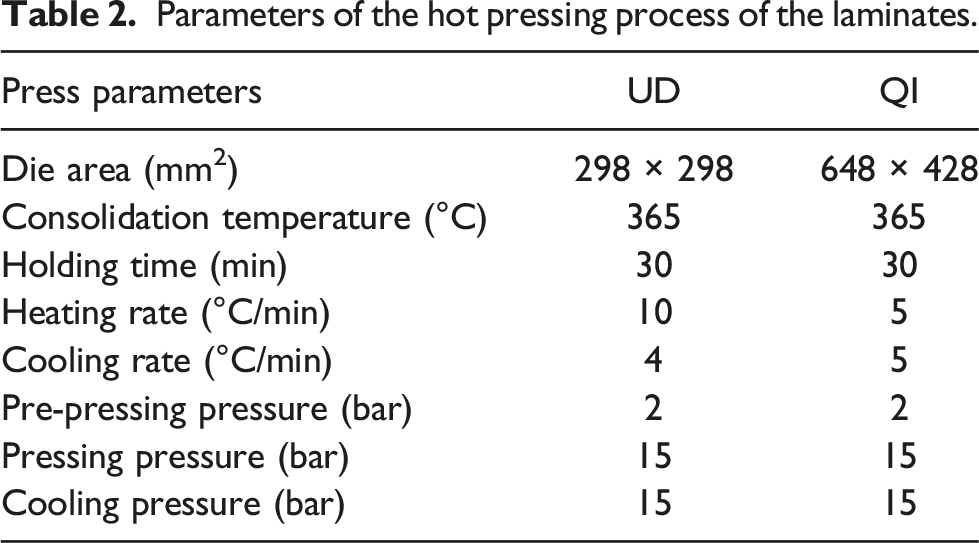
Parameters of the hot pressing process of the laminates.
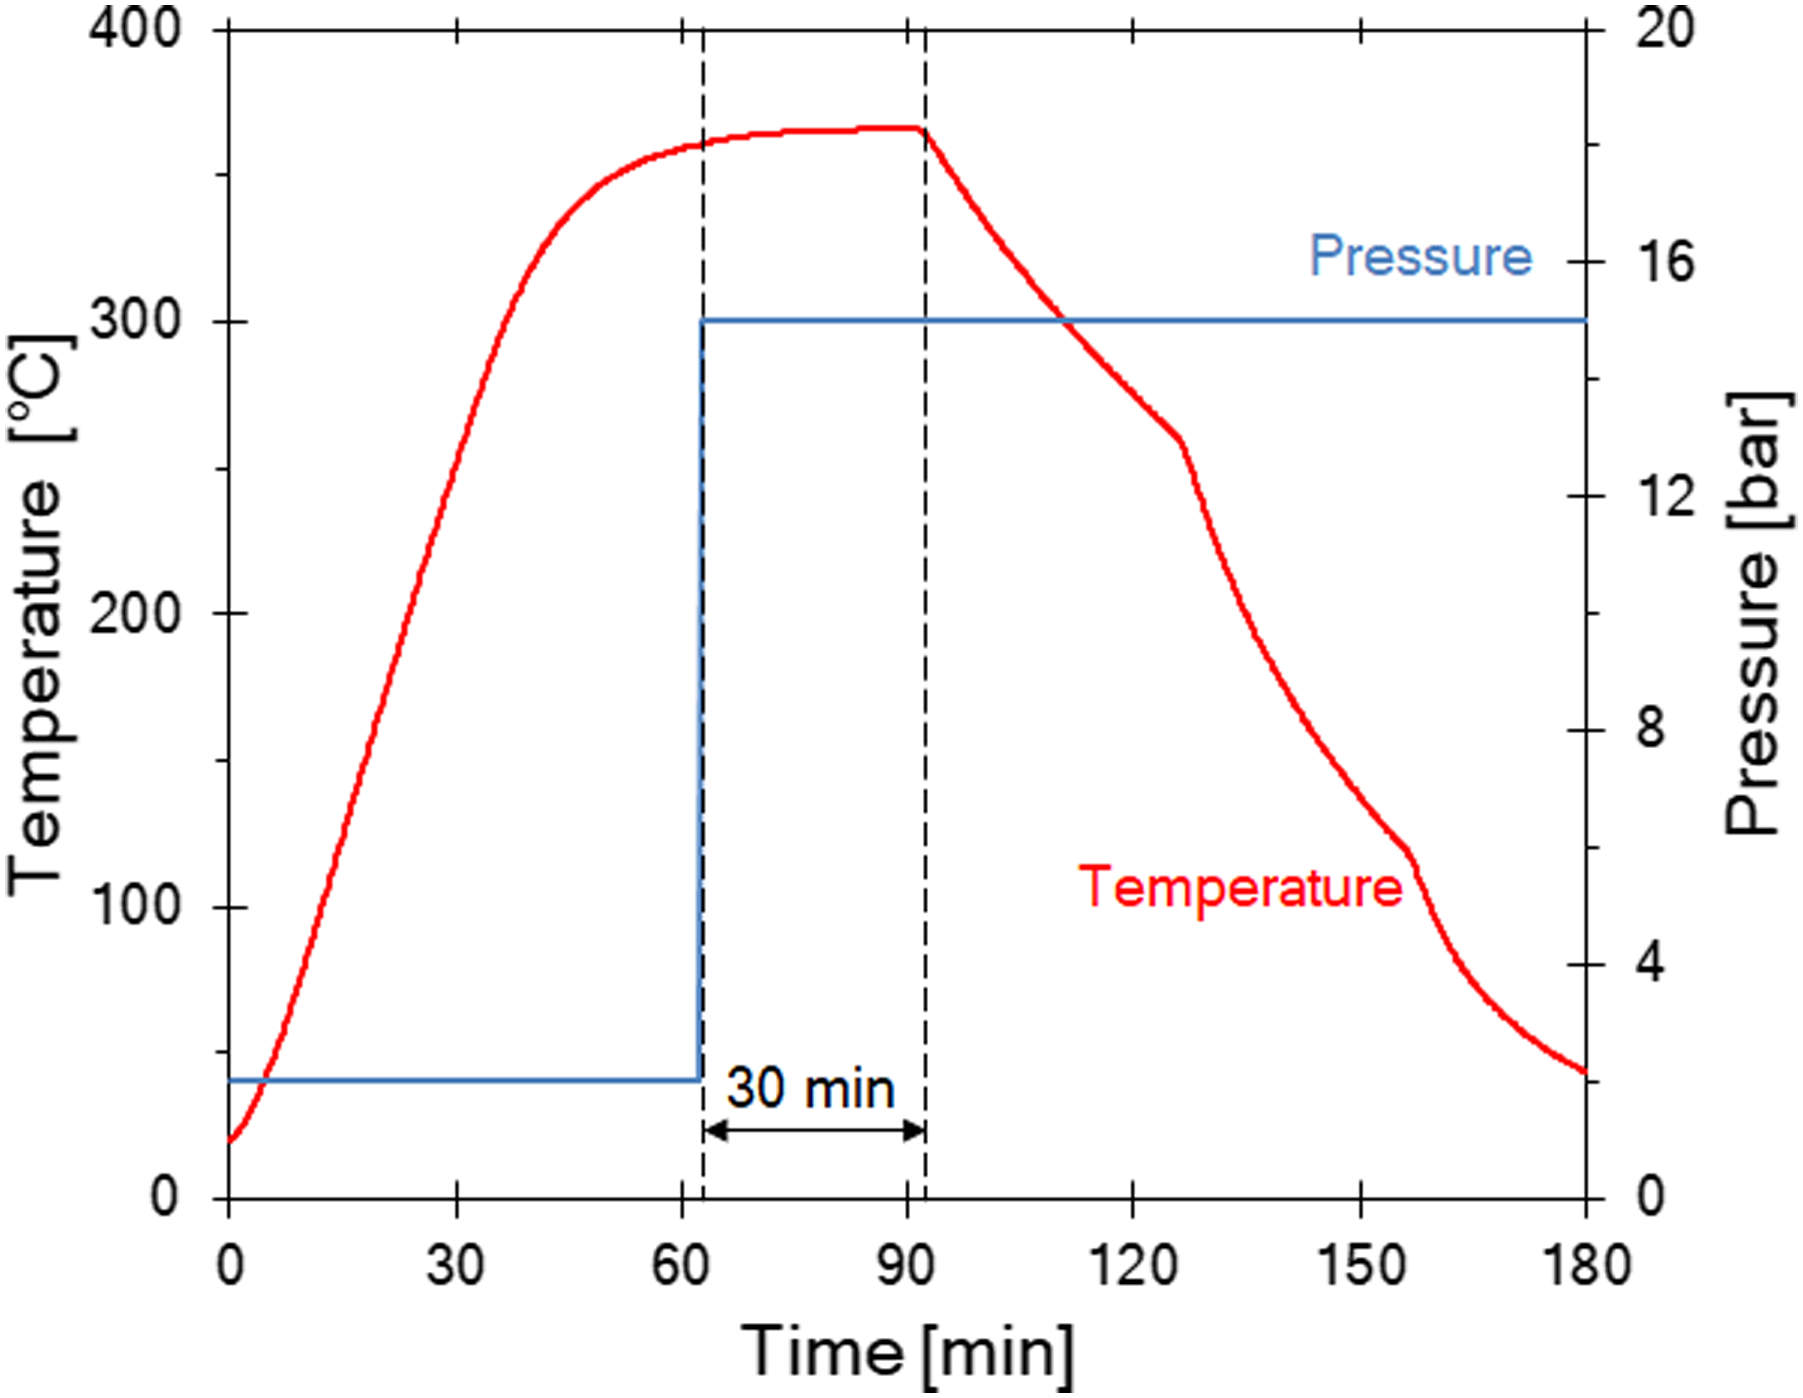
Pressing cycle of the unidirectional laminate.
Characterisation methods
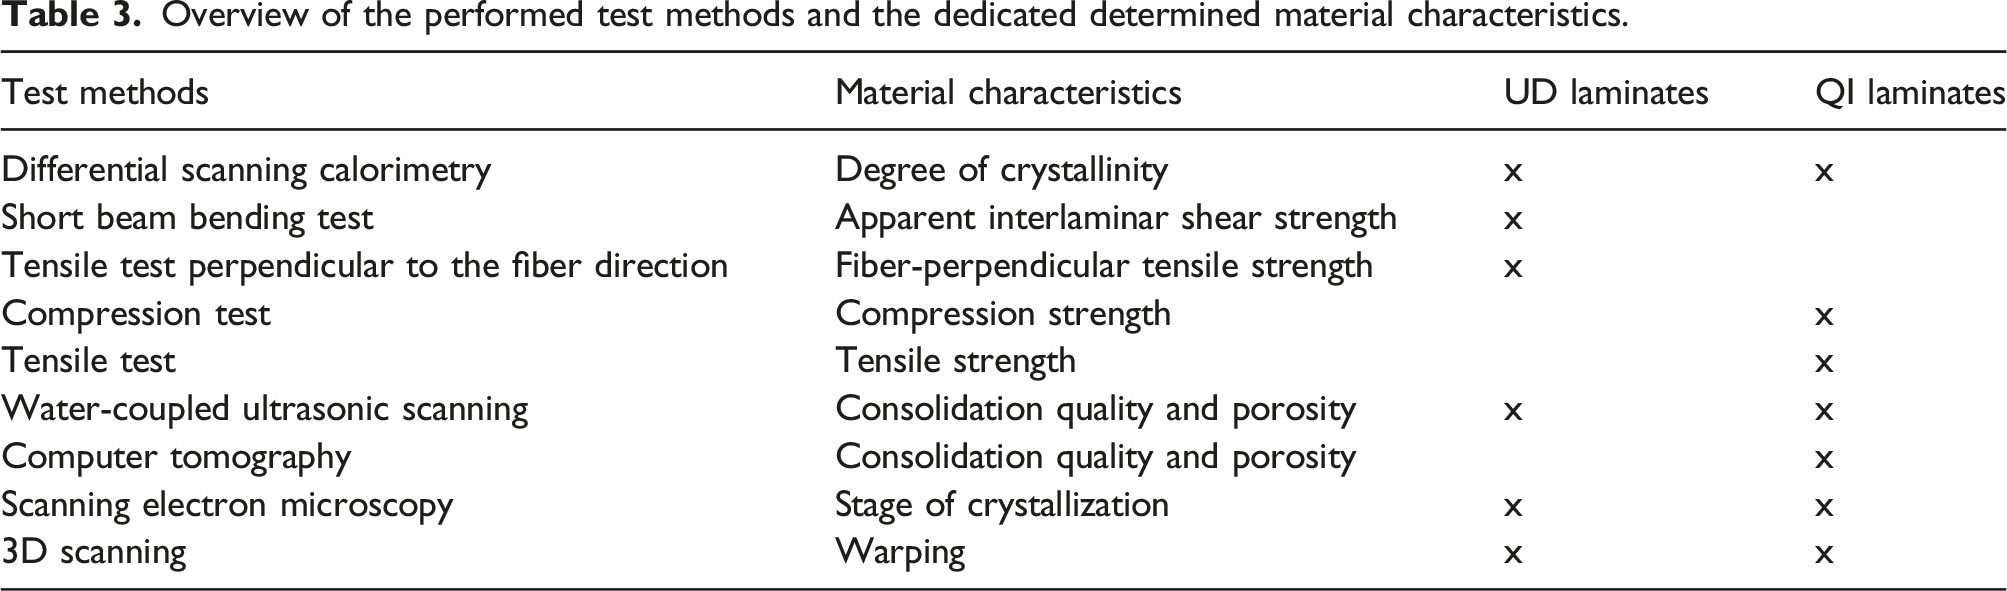
Overview of the performed test methods and the dedicated determined material characteristics.
Differential scanning calorimetry
DSC measurements were carried out with a NETZSCH DSC 214 Polyma device at the DLR in Stuttgart in order to determine the thermal material behaviour and the degree of crystallinity. Test specimens were prepared using water jet cut and hand sawing. The test specimens were placed into aluminium crucibles with pierced lids. An empty crucible, serving as reference, underwent the same temperature program together with the respective sample: heat up with a rate of 10°C/min → isothermal holding at 350°C for 3 minutes → cool down to room temperature with a cooling rate of 10°C/min. The DSC heating chamber was purged with Nitrogen as protective gas. The recorded heat flow data was evaluated with the NETZSCH Proteus® Software. An entropy curve is displayed in Figure 6 as an example. Linear baselines were chosen for the area calculations of the heat flow differences between sample and reference (∆Hm and ∆Hc). For comparability, the limits of 170°C–215°C for the cold crystallization and 225°C–330°C for the melting crystallization, respectively, were applied approximately to all evaluations within this study. Differential scanning calorimetry measurement of an AFP produced sample on cold tooling (20°C).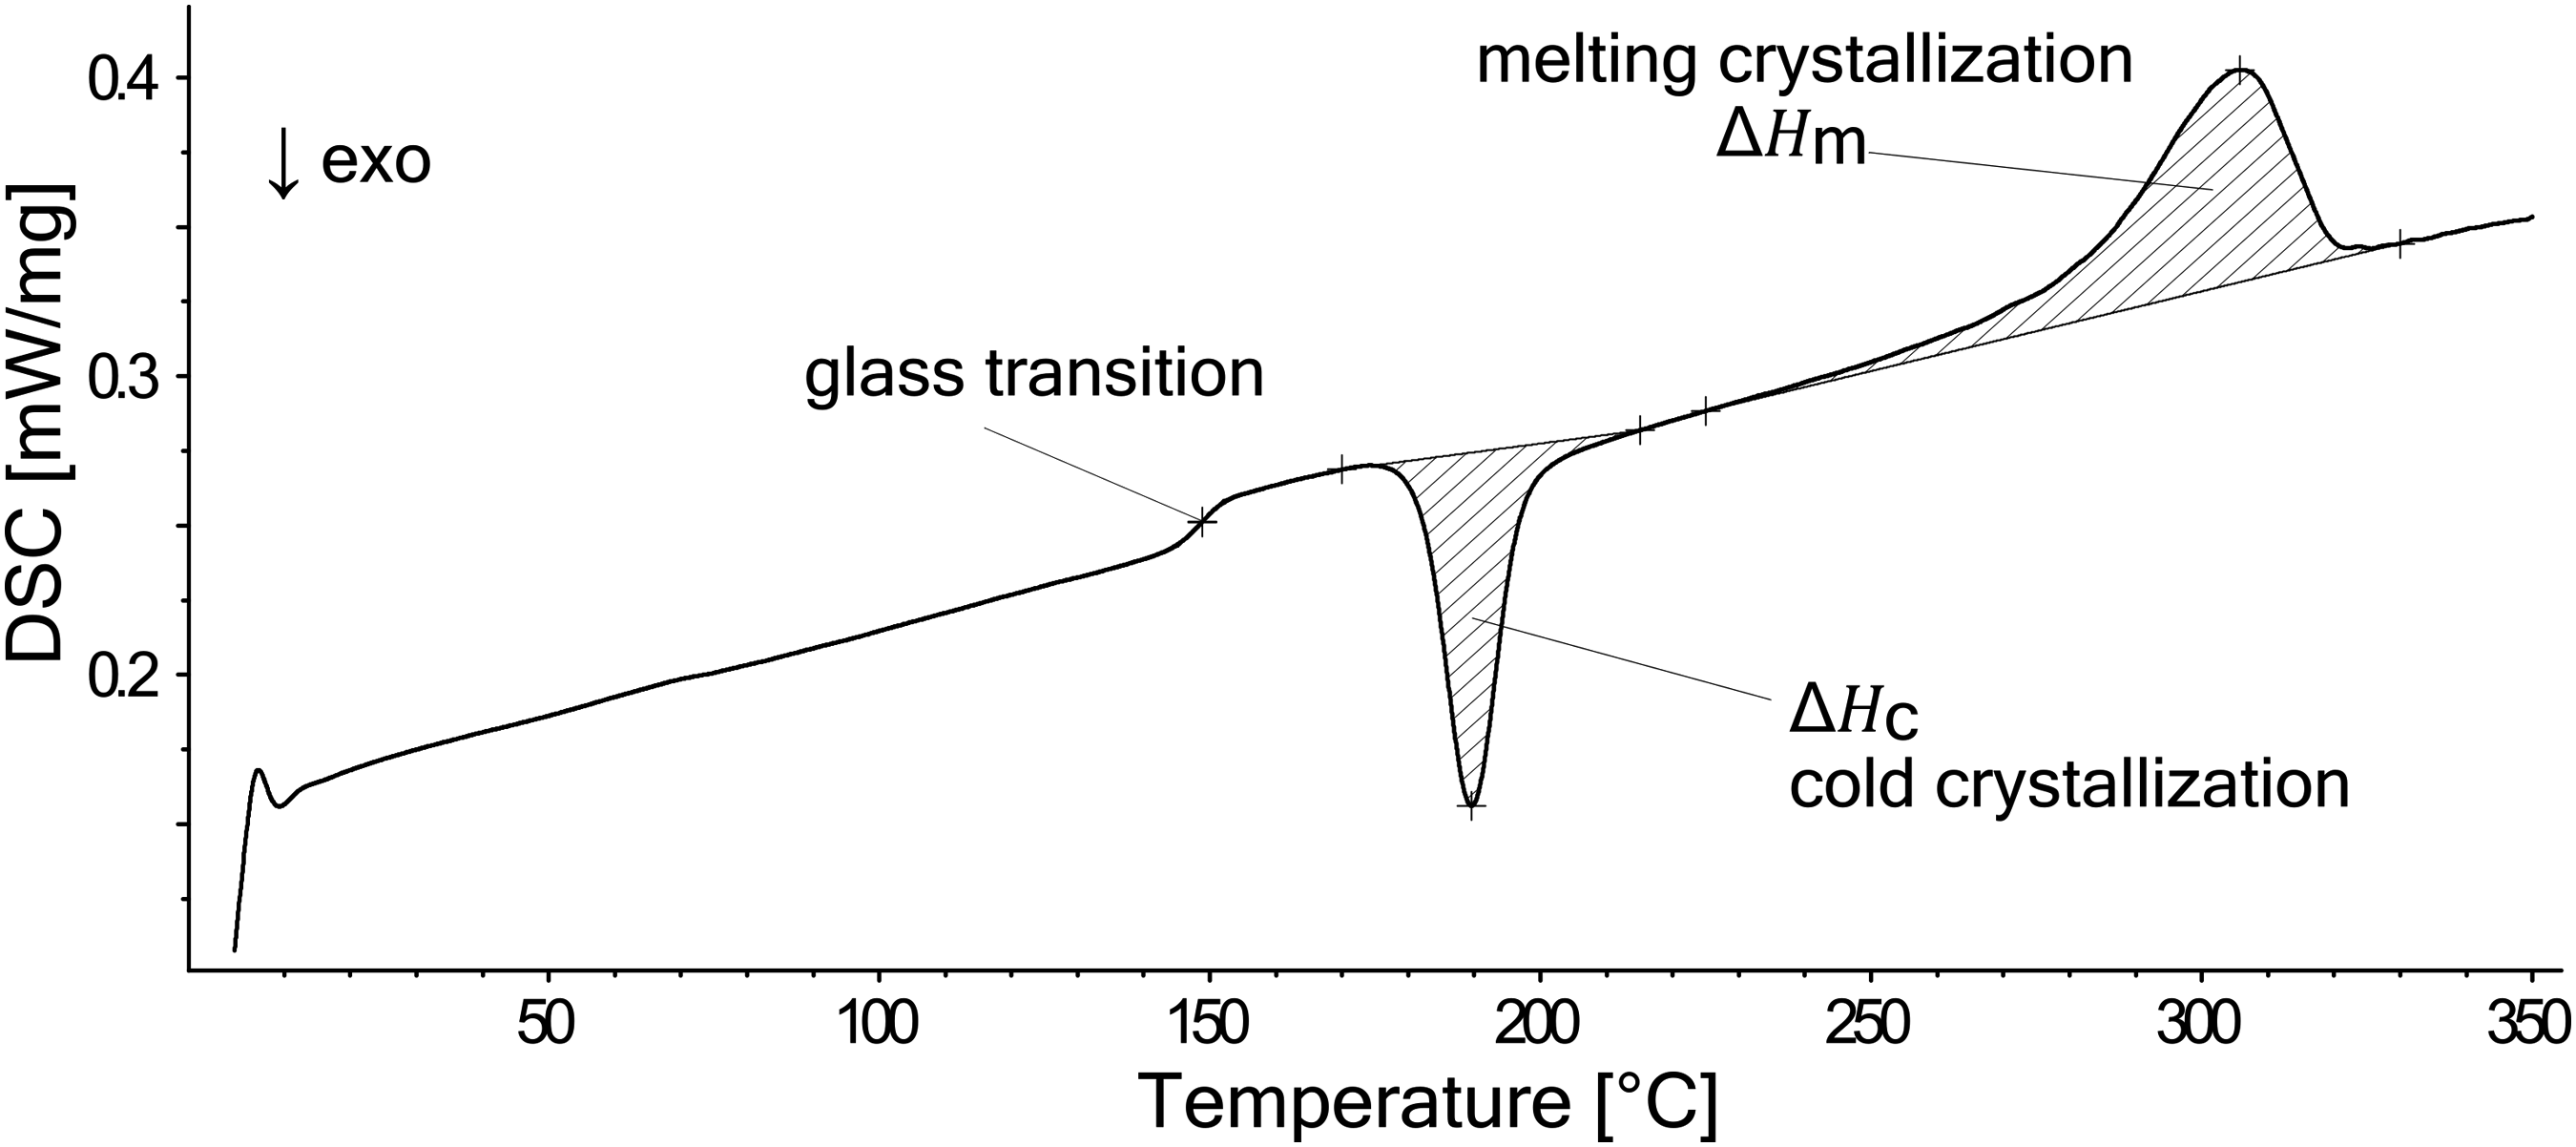
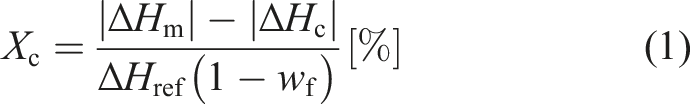
Considering the fiber mass fraction of wf = 66 % and a crystallization enthalpy of Href = 130 J/g for the CF/LM-PAEK tape material the degree of crystallinity Xc can be calculated using equation (1).
21
Mechanical tests
Specimens preparation for mechanical testing
Specimens were subsequently cut from the manufactured laminates and depending on the respective standard fit with 1.5 mm glass fiber-reinforced epoxy end tabs. The surface was prepared via plasma activation for the end tab application. The final specimens for mechanical testing were obtained by sawing.
Short beam bending test
The short beam bending test method following EN 2563 European test standard
22
was used to determine the apparent interlaminar shear strength (ILSS). According to the test standard, the apparent interlaminar shear strength is defined as the maximum shear stress, occurring at the moment of failure at half thickness of the specimen. Test specimens of 20 mm length and 10 mm width were cut from the laminates. The specimens were tested using an ILSS test fixture and a ZwickRoell 100 kN material testing machine and were tested until failure at a rate of 1 mm/min. The apparent interlaminar shear strength τ is calculated as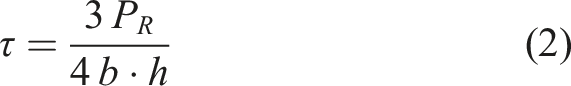
Due to the ductility of the thermoplastic matrix the ILSS specimens failed in a non-standard ductile failure mode, showing plastic deformation. The above mentioned ILSS standard, mostly used for thermoset matrices, states this failure mode as invalid. Therefore, in this investigation the evaluation of the ILSS test results follows the ASTM-D5379 standard.
23
The defined force of failure ILSS testing – Determination of the force 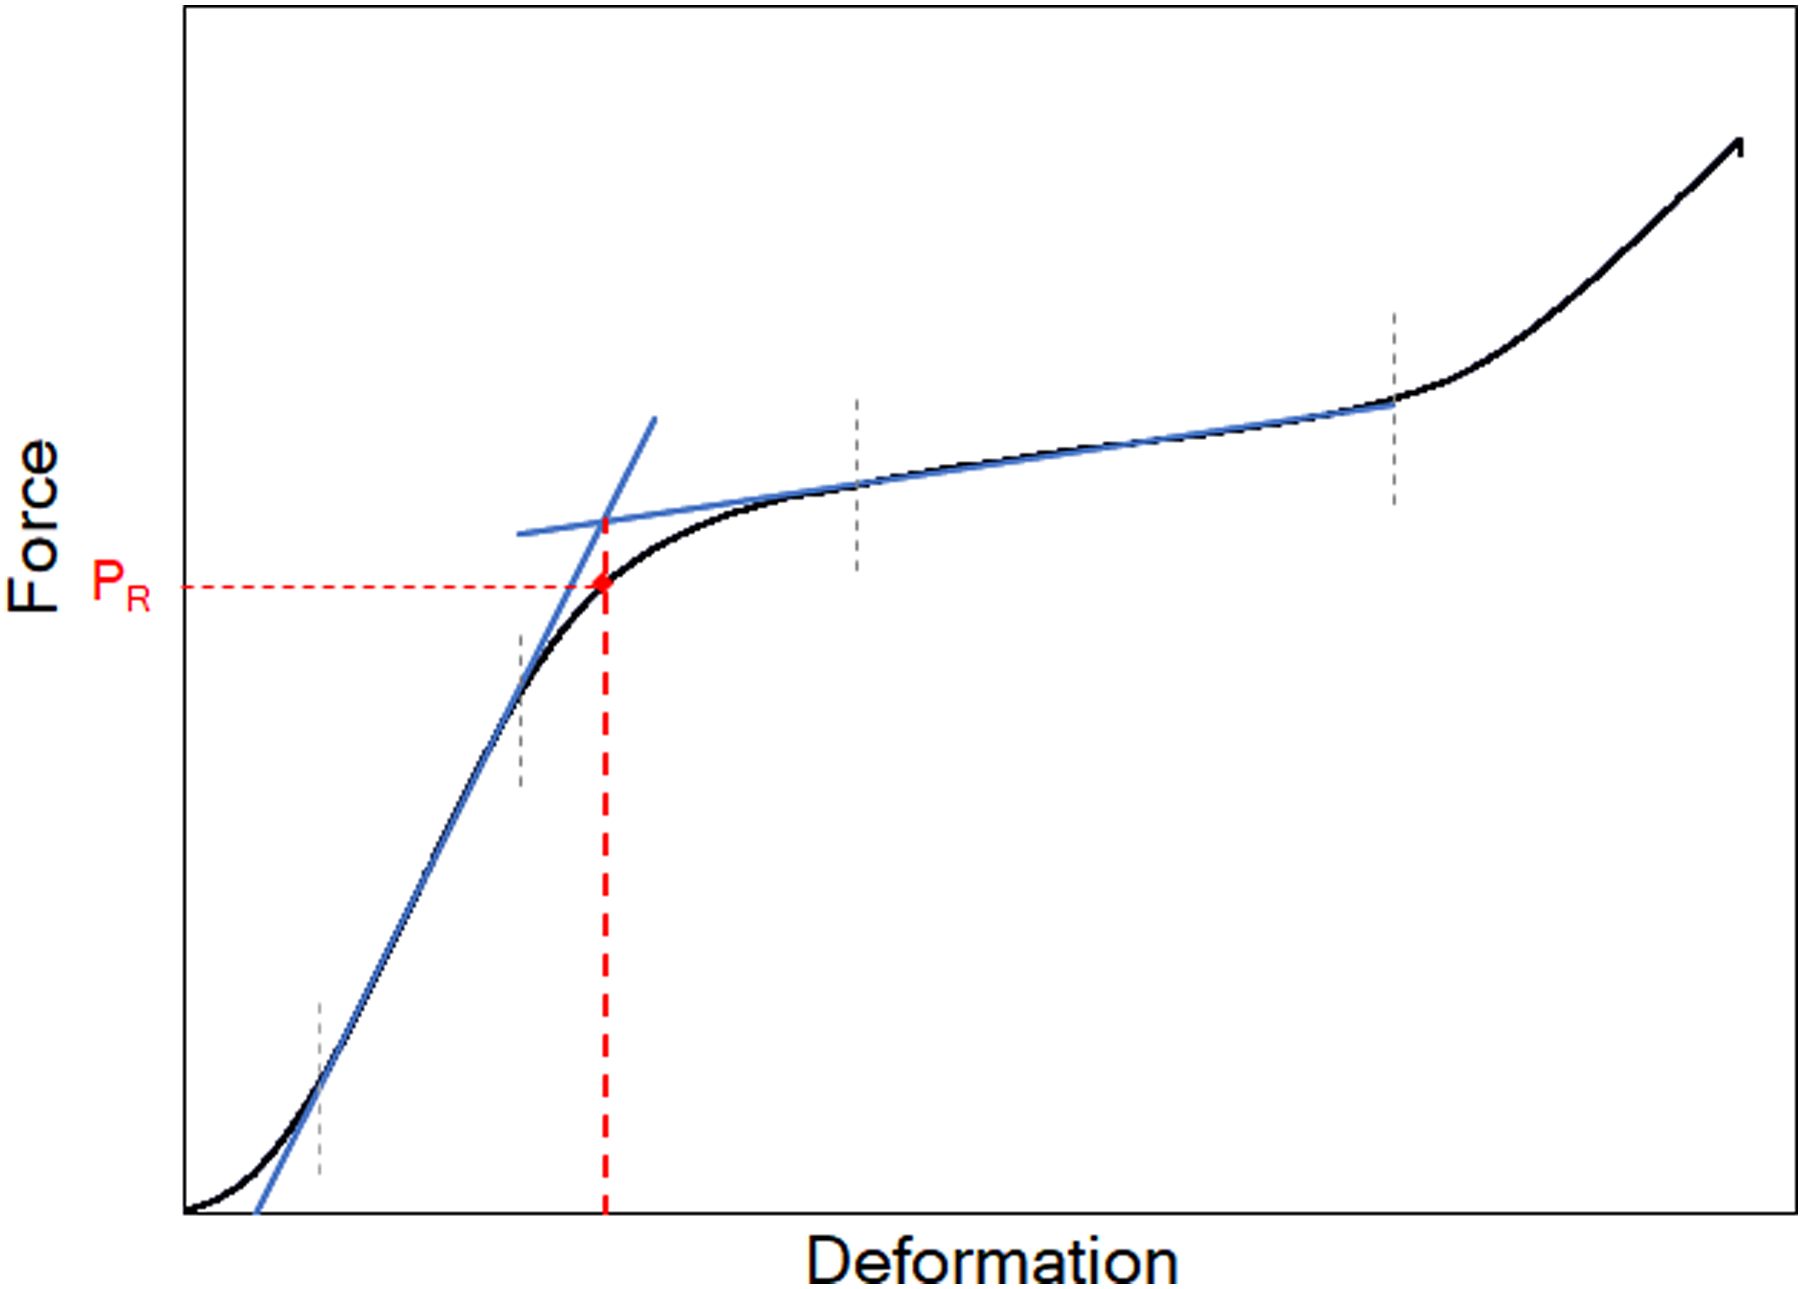
Tensile test perpendicular to the fiber direction
The fiber-perpendicular tensile strength was examined using the DIN EN 2597 standard.
24
Specimens of 250 mm length and 25 mm width were cut from the UD laminates and fit with 60 mm end tabs. The samples were clamped in a ZwickRoell 500 kN machine and tensile tests were conducted until failure at a rate of 0.5 mm/min. The ultimate tensile strength 
Compression test
Compression strength was determined using the AITM 1-0008 A2 standard.
25
As specified in the standard as type A2, the specimens were cut to a width of 22 mm, a length of 172 mm and fit with 75 mm tabs. The tests were carried out at COTESA GmbH in Mittweida, Germany. An anti-buckling device was used and the test rate was set to 0.5 mm/min. The ultimate compression strength 
Tensile test
The tensile strength was determined according to the AITM 1-0007 A2 standard.
26
As specified in the standard as type A2, the specimens were cut to a length of 250 mm, a width of 22 mm and fit with 50 mm long end tabs. The samples were clamped in a ZwickRoell 500 kN material testing machine and were tested until failure at a rate of 2 mm/min. The ultimate tensile strength 
Water-coupled ultrasonic scanning
The manufactured laminates were scanned using an Olympus OmniScan MX2 device and a 5 MHz Phased Array probe using the pulse-echo method. Water was used for signal transmission from wedge to component. The system was calibrated to receive an amplitude of the echo of 80 % to 100 % from the lower thickness section (0 mm to 1 mm) of the laminate. A-, B- and C-Scans of the laminates were generated.
Computed tomography
X-ray microfocus computed tomography scans (µCT)
The microfocus computed tomography (µCT) scans were conducted using a high resolution µCT-System (nanotom, GE Sensing & Inspection Technologies GmbH, Wunstorf) consisting of a microfocus X-ray tube with a maximum accelerating voltage of 180 kV and a 12-bit flat panel detector (active area 2348 × 2348 pixels at 50 microns per pixel). The µCT scans were performed with the X-ray parameters 80 kV/180 µA at an exposure time of 1000 ms. A voxel size of 2 µm could be achieved. The so acquired 2D X-ray images (2000 projections) were reconstructed with a Filtered Back Projection reconstruction algorithm. The µCT data were visualised and analysed with the commercially available software package VGStudioMax 3.4 (Volume Graphics GmbH, Heidelberg).
µCT data pre-processing
The noise contained in the reconstructed tomographic images makes further processing difficult. Hence, an adequate image enhancing technique must be selected. The non-local mean filter, which is dedicated to minimize the noise while preserving the edges, was used. After noise reduction, it is necessary to classify the volume pixels either in void or solid. This step is called segmentation. There are several global and local segmentation algorithms in the literature. 27 In the present work the Otsu’s threshold method was used 28 for mainly two reasons. First, it is suitable for data sets with bimodal grey value distributions. Second, it is user independent, since it is based on statistical calculations.
Scanning electron microscopy
Objective of the SEM analysis
In this study, the SEM analysis is used to determine the stage of crystallization in the polymer matrix of the CFRP laminates. Crystallization has a significant influence on all physical properties of a polymer. 29 Therefor the influence of the stage of crystallization in the CFRP polymer matrix on the mechanical properties of the laminates needs to be investigated.
It depends mainly on the temperatures present in the production process and can be split up in three stages. When the temperature falls below the melting temperature of the polymer and the cooling process is slow enough, firstly small lamellar crystallites start to form. These small crystallites grow further and become more and more frayed until they form a spherical nucleus, termed spherulite.
30
If the temperature stays close to the melting temperature for a longer time, the spherulites grow further until they finally reach the boundaries of another spherulite or a fiber. With higher cooling rates, the stage of crystallization decreases resulting in smaller spherulites, lamellar crystallites or amorphous areas. Kotzur et al. presented examples of amorphous and crystallized areas as well as spherulites in SEM microsections in Figure 8.
31
Furthermore, the SEM is used to analyse porosity. Examples of amorphous and crystallized areas as well as spherulites in scanning electron microscopy images.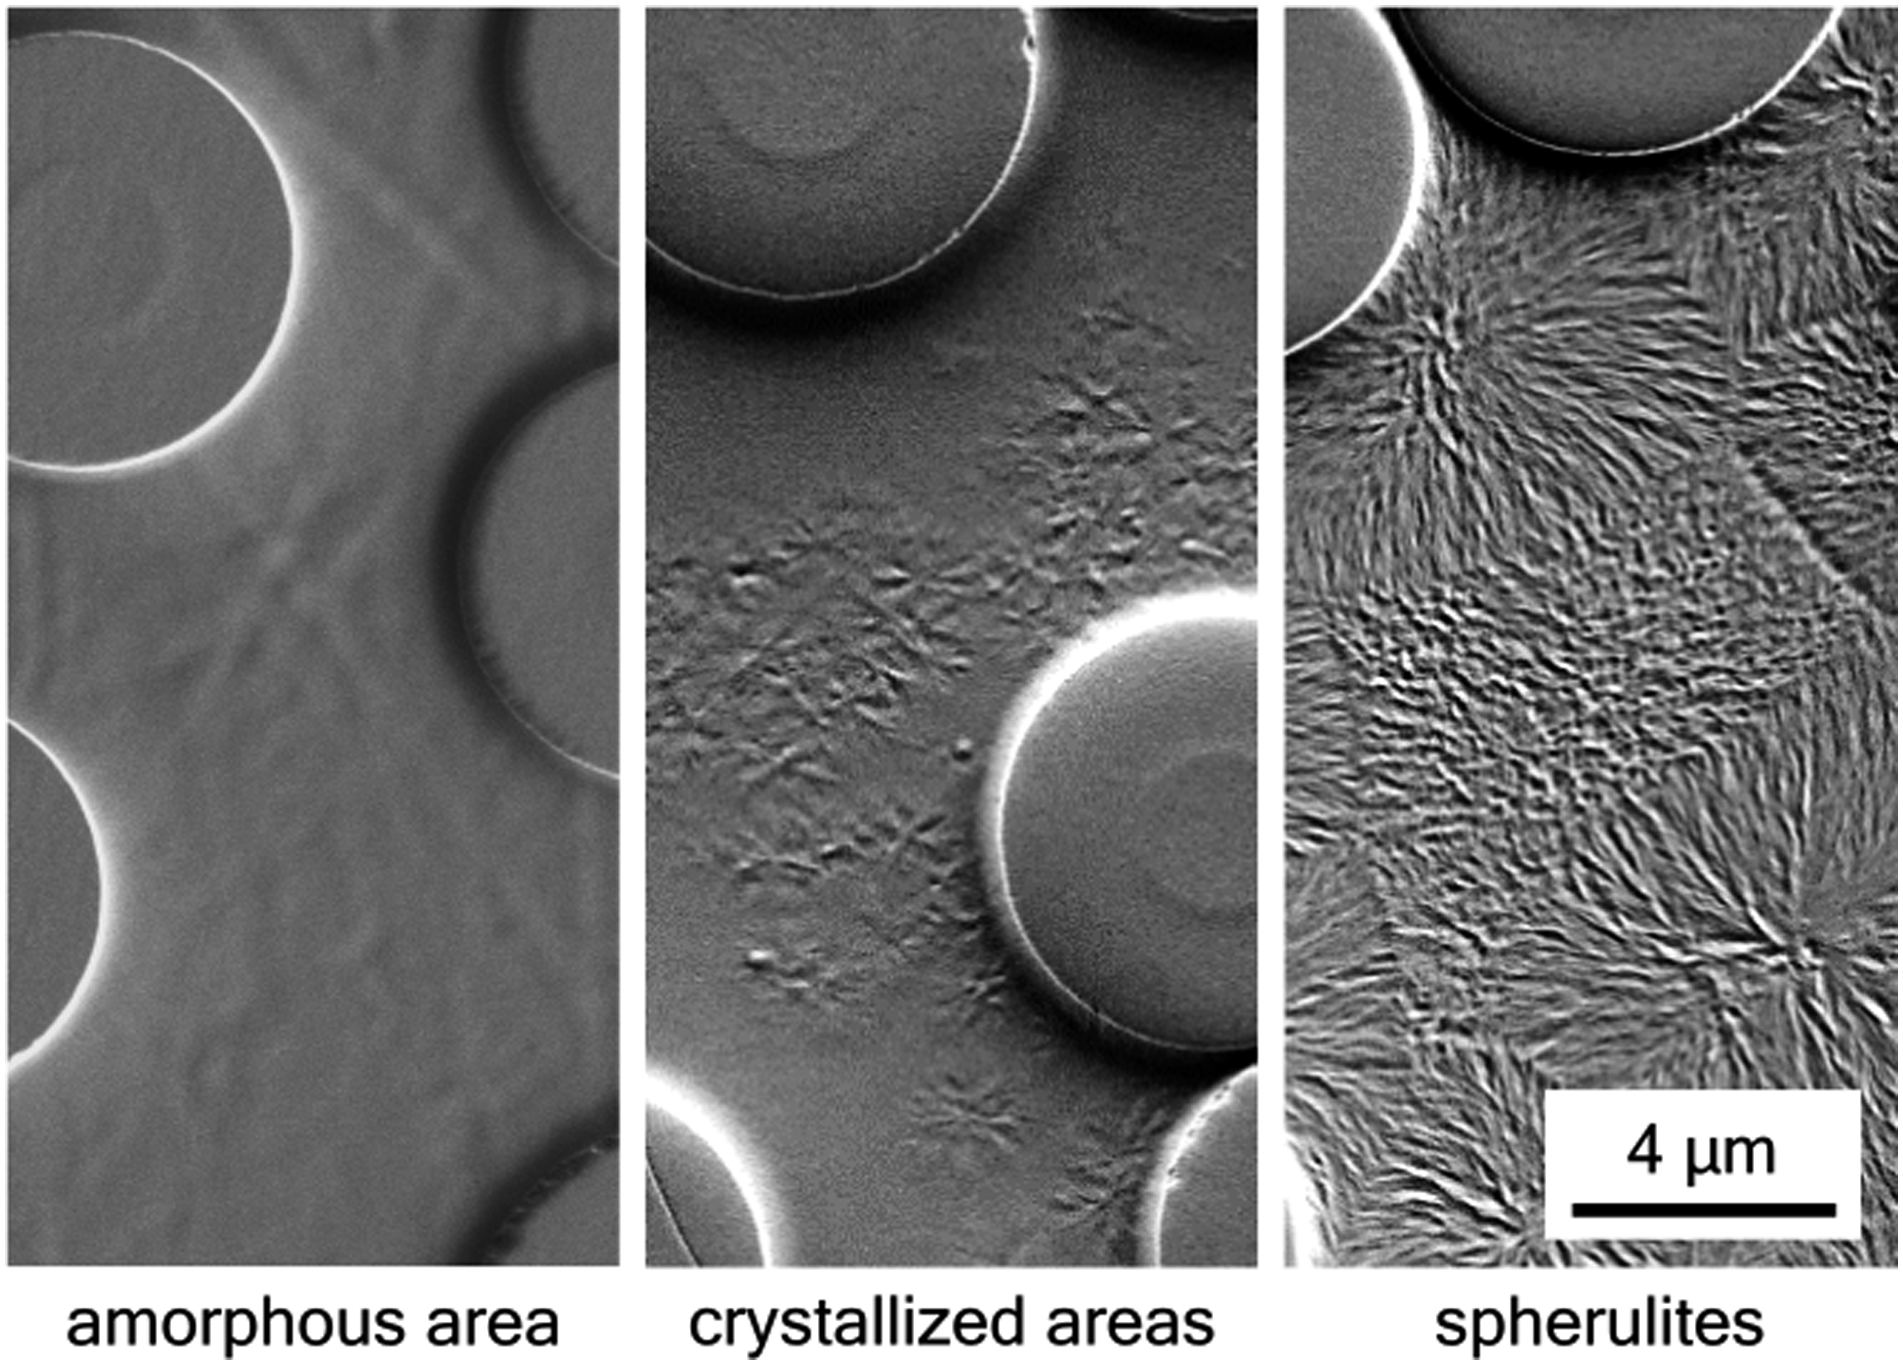
SEM specimen preparation
From all of the differently produced laminates which are summarized in Figure 2, small pieces (20 mm × 10 mm) were cut in order to prepare specimen for electron microscopy analysis. Three samples per laminate were adhesively bonded together with epoxy resin to a sandwich structure, so that the piece of laminate in the middle could be prepared more easily and the top and bottom layer could be identified in the SEM due to the offset of the top sample (Figure 9). Afterwards the sandwich structures were embedded in a thermoplastic polymer for a facilitated specimen preparation. Sandwich specimen of three laminate pieces (left) and embedded specimen for SEM analysis (right).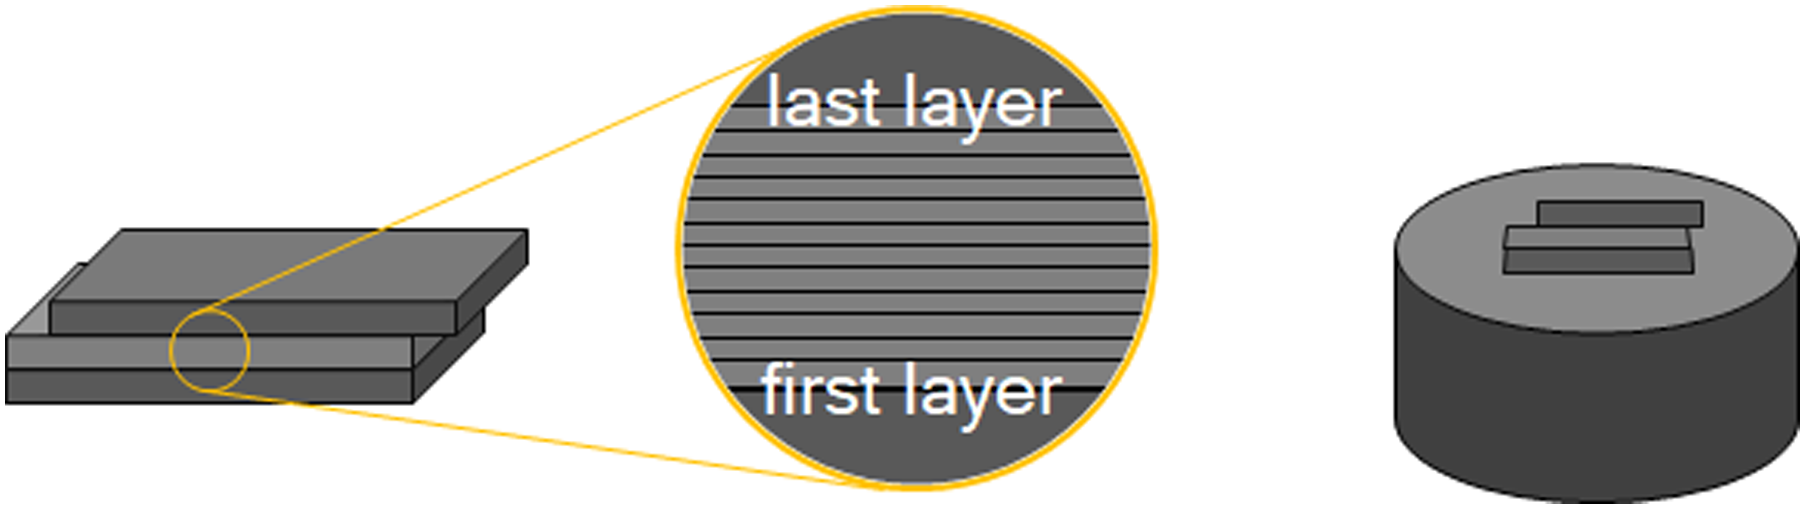
Each specimen was ground with abrasive SiC paper (grain size 58.5 µm – 8.0 µm), polished with diamond suspension (grain size 3 µm – 1 µm) and ion etched several times with a Gatan MET-ETCH (Model 683) device with a beam of 3 keV. To allow the analysis of the non-conductive CFRP specimen with the SEM, finally a platinum layer with a few nanometres thickness was sputtered on the specimen surface.
SEM setup
The different microstructures in the polymer matrix, resulting from the different processing routes of the produced laminates were analysed with an Ultra 55 scanning electron microscope (SEM) from Carl Zeiss Microscopy GmbH in Oberkochen, Germany. All images were taken with the secondary electron (SE-) detector in a working distance of 3.3 mm and an acceleration voltage of the electron beam of one kilovolt.
In every layer and between all layers of the specimen images with magnifications from 1,000x to 20,000x were taken in order to locate the respective layer of the specimen and analyse the microstructural features of the polymer present in this area.
3D scanning
The thermal warpage of the panels was measured using 3D scanning. A GOM Atos 5 non-contact 3D scanning device was used to digitise the panels, while the analysis was carried out with the GOM Inspect 2020 software. The Atos 5 used two stereo cameras oriented at 15° to each other (see Figure 10(a)) to capture images of a projected pattern on the object to calculate the coordinates of each reflected point. These points were used to calculate a mesh of the scanned surface, which was used for further analysis. The cameras could use different lenses to either capture more details or measure a larger volume. For this analysis, medium focal length lenses were used to capture objects with dimensions up to 500 mm in one direction with one scan while maintaining good detail resolution. GOM measurement setup (a) and support points for the laminates reference plane (b).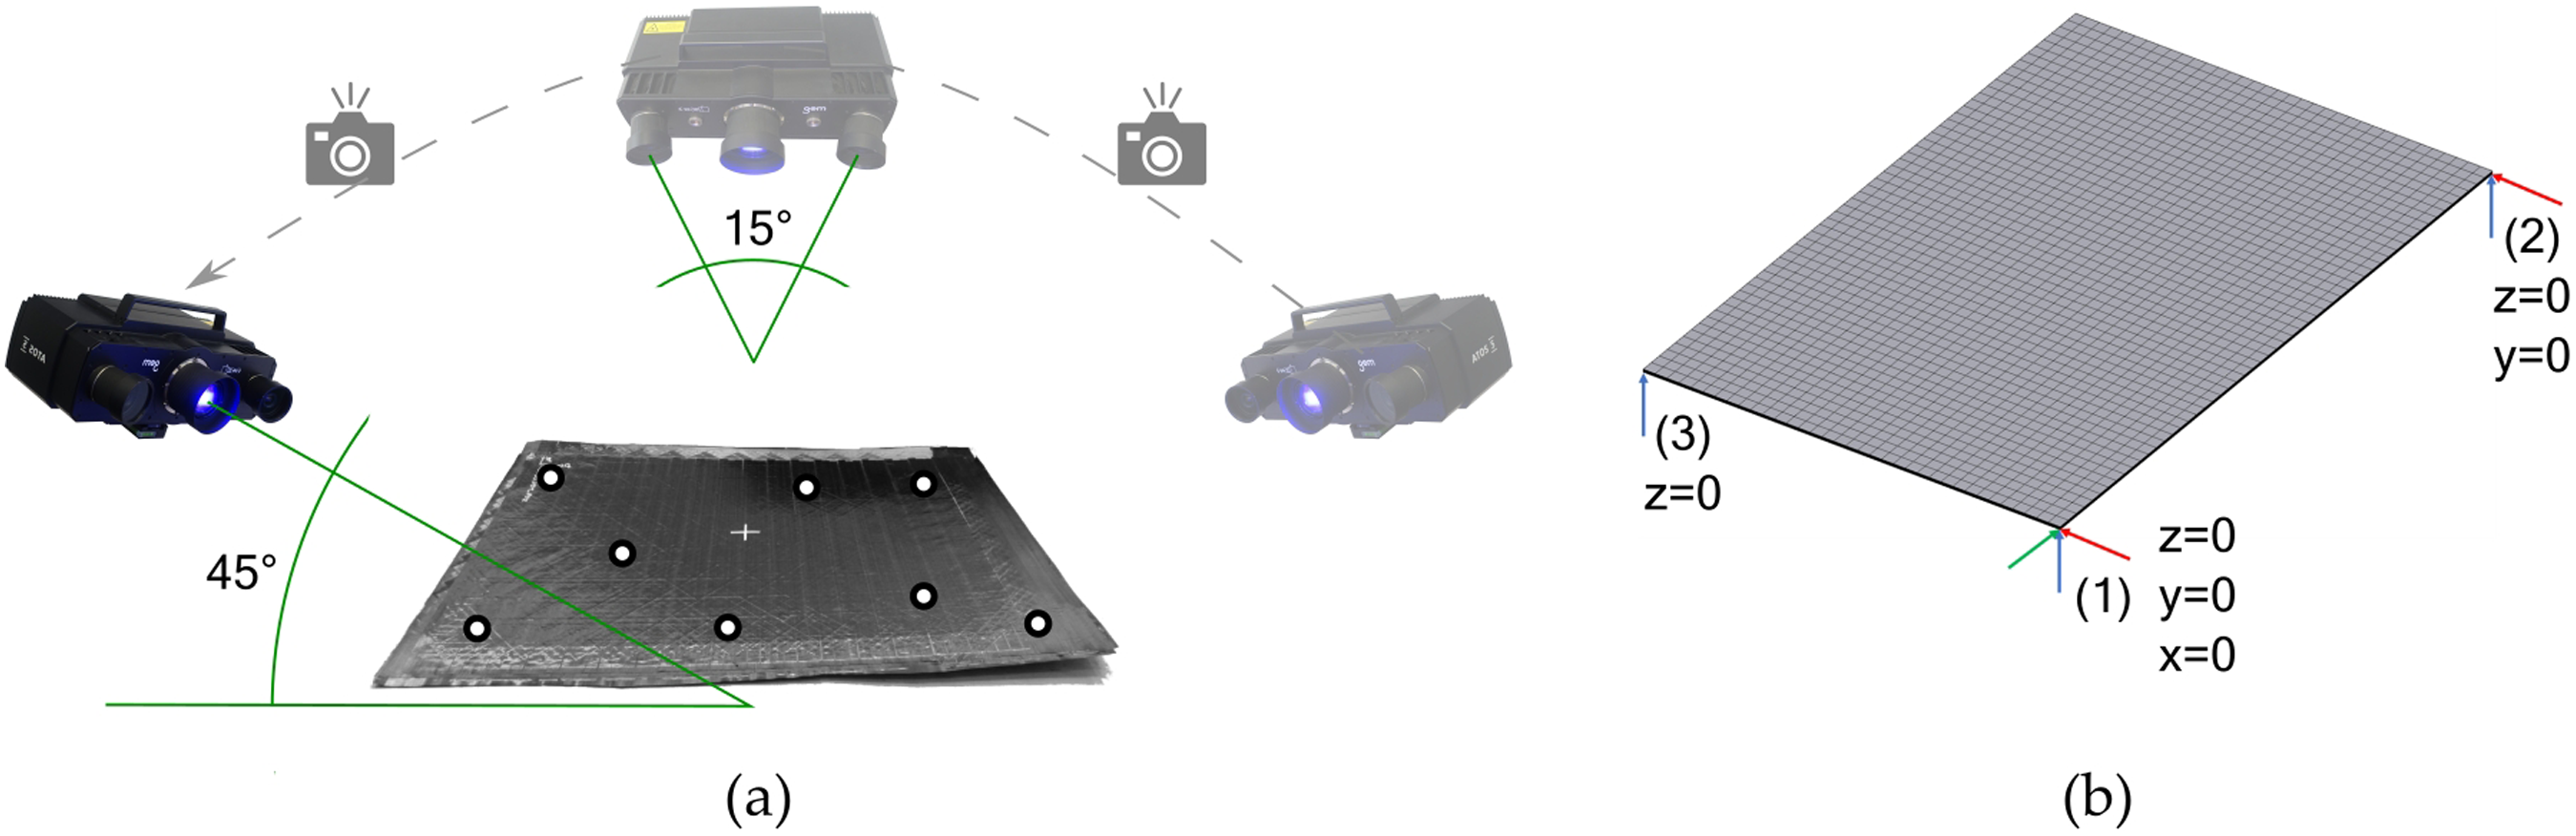
The panels were placed on a flat table with the x-axis of the panel facing away from the scanner. The scanner itself was positioned above and in front of the table to look at a 45° inclined angle onto the panel. After the first image was taken from this direction, the table was rotated by 45° and a new image was taken. This was repeated until the entire surface was covered from all directions.
The measured surface was then compared to a CAD geometry of the ideal (un-warped) panel, which was imported into the software. This geometry was already aligned to the global coordinate system and could be used to align the mesh of the panel. To create a statically defined and repeatable alignment, three points were defined where the mesh and CAD were identical. The first point (1) in Figure 10(b) fixed the panel at that point in x -, y - and z - direction, the second (2) in y - and z - direction and the last (3) only in z - direction. With six dimensions suppressed, the panel had a statically defined position in space. The support points were positioned in three of the corners of the panel and served to create a reference plane, which was the nominal zero against which each point of the measured point cloud was measured. In this way, the distance in one direction – the normal distance – from the reference plane was used to quantify the deformation of the panel. This distance was plotted in a pseudo-colour image, with blue indicating deformation in the negative z - direction and red in the positive z - direction. The colour spectrum of the legend was adjusted so that the scale was the same for the cold tooling panels and the heated tooling panels, respectively.
Results
The test results for all four laminate configurations (cold tooling, cold tooling & tempered, heated tooling and heated tooling & hot pressed) are presented in the following section. Box plots were chosen for data visualization to display the median and standard deviation of the mechanical and crystallinity measurement results. Median values are used for comparison of the different laminate configurations.
The final thicknesses of the cold tooling, cold tooling & tempered and heated tooling laminates were all in the range of 2.13 mm to 2.28 mm for the UD layup and 2.94 mm to 3.06 mm for the QI layup. This indicates an equivalent consolidated ply thickness for the three conditions. Hot pressed laminates for the UD and QI layups were only slightly lower at 2.05 mm and 2.62 mm, respectively. This is to be expected given the bulk heating and long hold time under pressure inherent to the process. It should be noted that this decrease in thickness was accompanied by a proportional increase in the width and breadth of the laminates without a separation of matrix and fibers at the hot pressed laminate edges. It can therefore be assumed that the fiber volume content is equivalent between the four conditions considered within this work.
Crystallinity
The entropy curves of the DSC measurements of UD laminates are displayed exemplarily for all of the laminate configurations in Figure 11. Differential scanning calorimetry measurements of the AFP produced samples of the UD laminates with the configurations cold tooling, cold tooling & tempered, heated tooling and heated tooling & hot pressed (from top to bottom).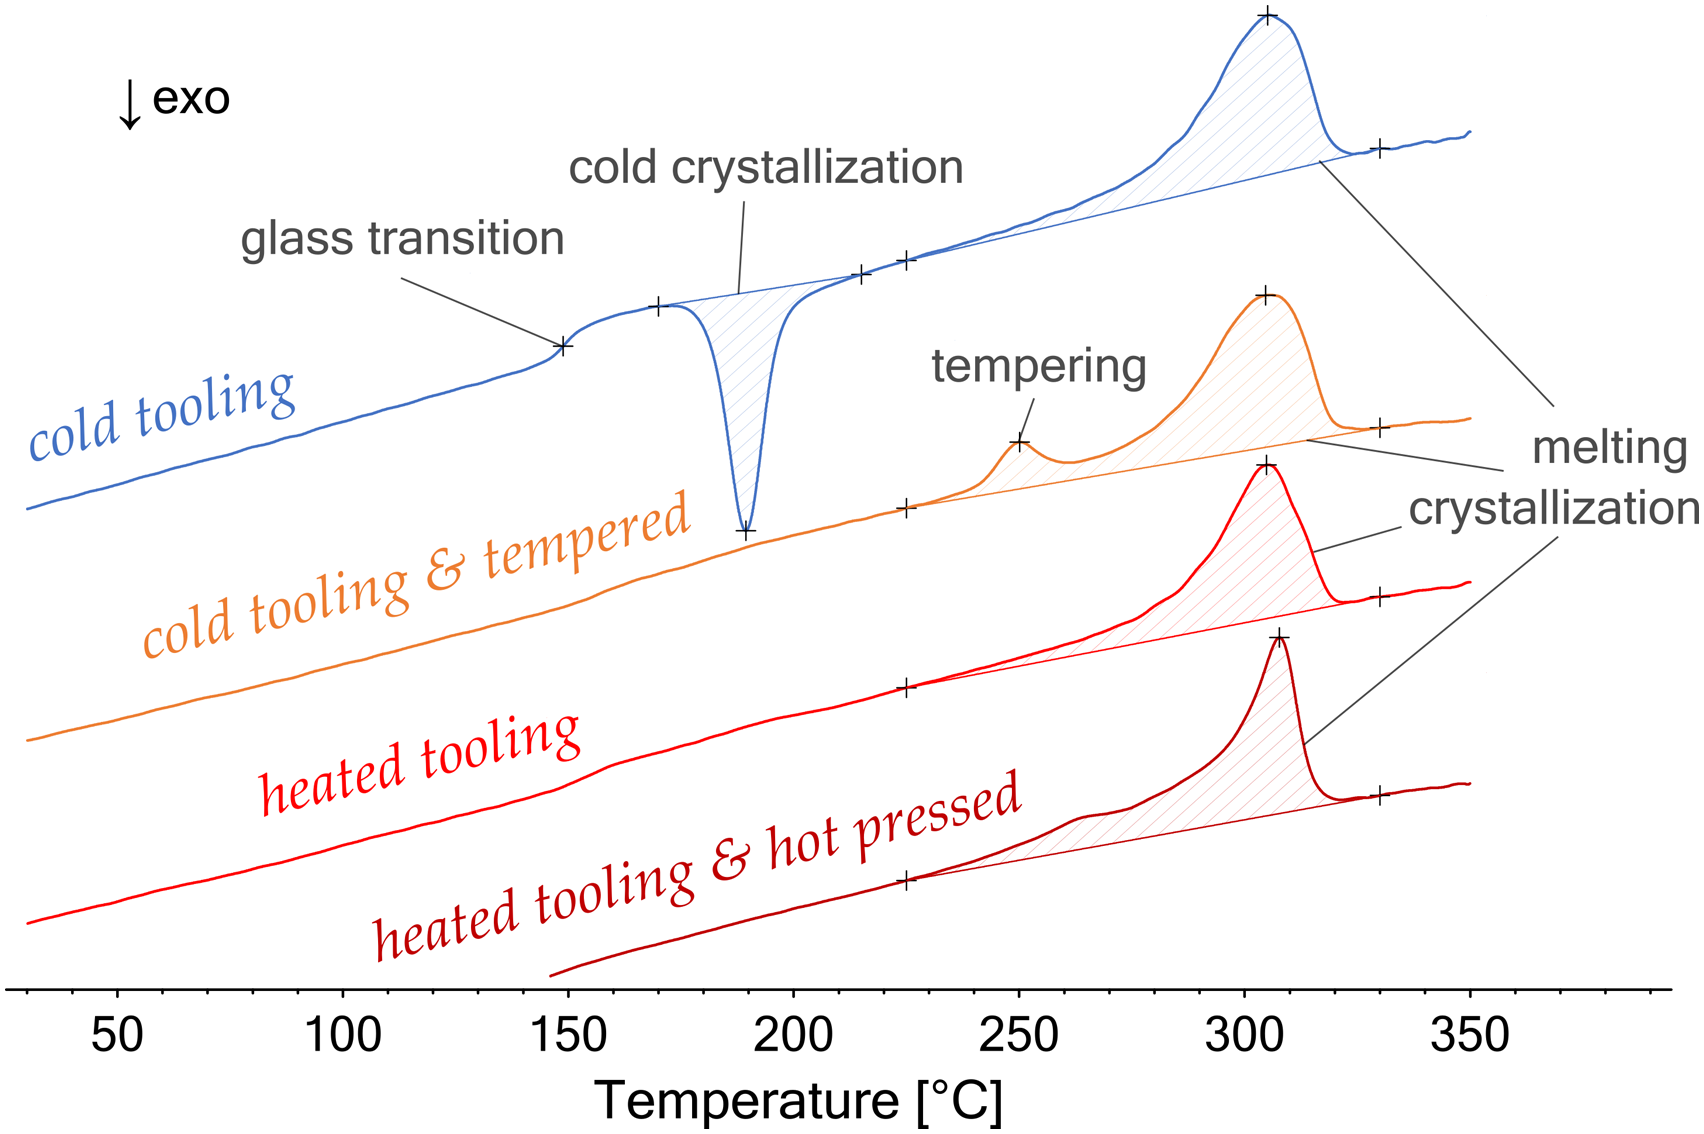
All curves show a distinct endothermal melting peak around the melt temperature of CF/LM-PAEK of 305°C. The glass transition temperature of 147°C is clearly visible as a step in the cold tooling curve. In comparison to all heat-treated laminates the cold crystallization peak occurs only for the cold tooling configuration. This exothermal peak indicates remaining amorphous areas within the polymer matrix after in-situ tape placement and results in a far lower bulk crystallinity of 11 Xc - % for the UD laminate. The degrees of crystallinity, calculated through equation (1) with the areas evaluated from the curves, are plotted in the box plot of Figure 12(a) for the UD laminate. During a heat treatment in an oven after the AFP-process (cold tooling & tempered) the amorphous regions undergo significant secondary crystallization, removing the measured exothermal peak at the crystallization temperature and producing a secondary endothermal peak before the characteristic (polymer-intrinsic) melting peak. This phenomenon has also been observed in similar earlier studies for other thermoplastic composites.
20
This is accompanied by an increase of the degree of crystallinity by 173 % up to 30 Xc - %. The heated tooling curve lacks the exothermal peak compared to the cold tooling curve, yielding an increase of 118 % up to a median degree of crystallinity of 24 Xc - %. Compared to the configuration on heated tooling a subsequent hot pressing process step results in a plateau in front of the melting peak area and slightly increases the degree of crystallinity to 28 Xc - %. The trends for the QI laminate are similar and the degrees of crystallinity are plotted in the box plot of Figure 12(b). Degree of crystallinity as a function of laminate configuration. Specimens extracted from: (a) UD laminates and (b) QI laminates.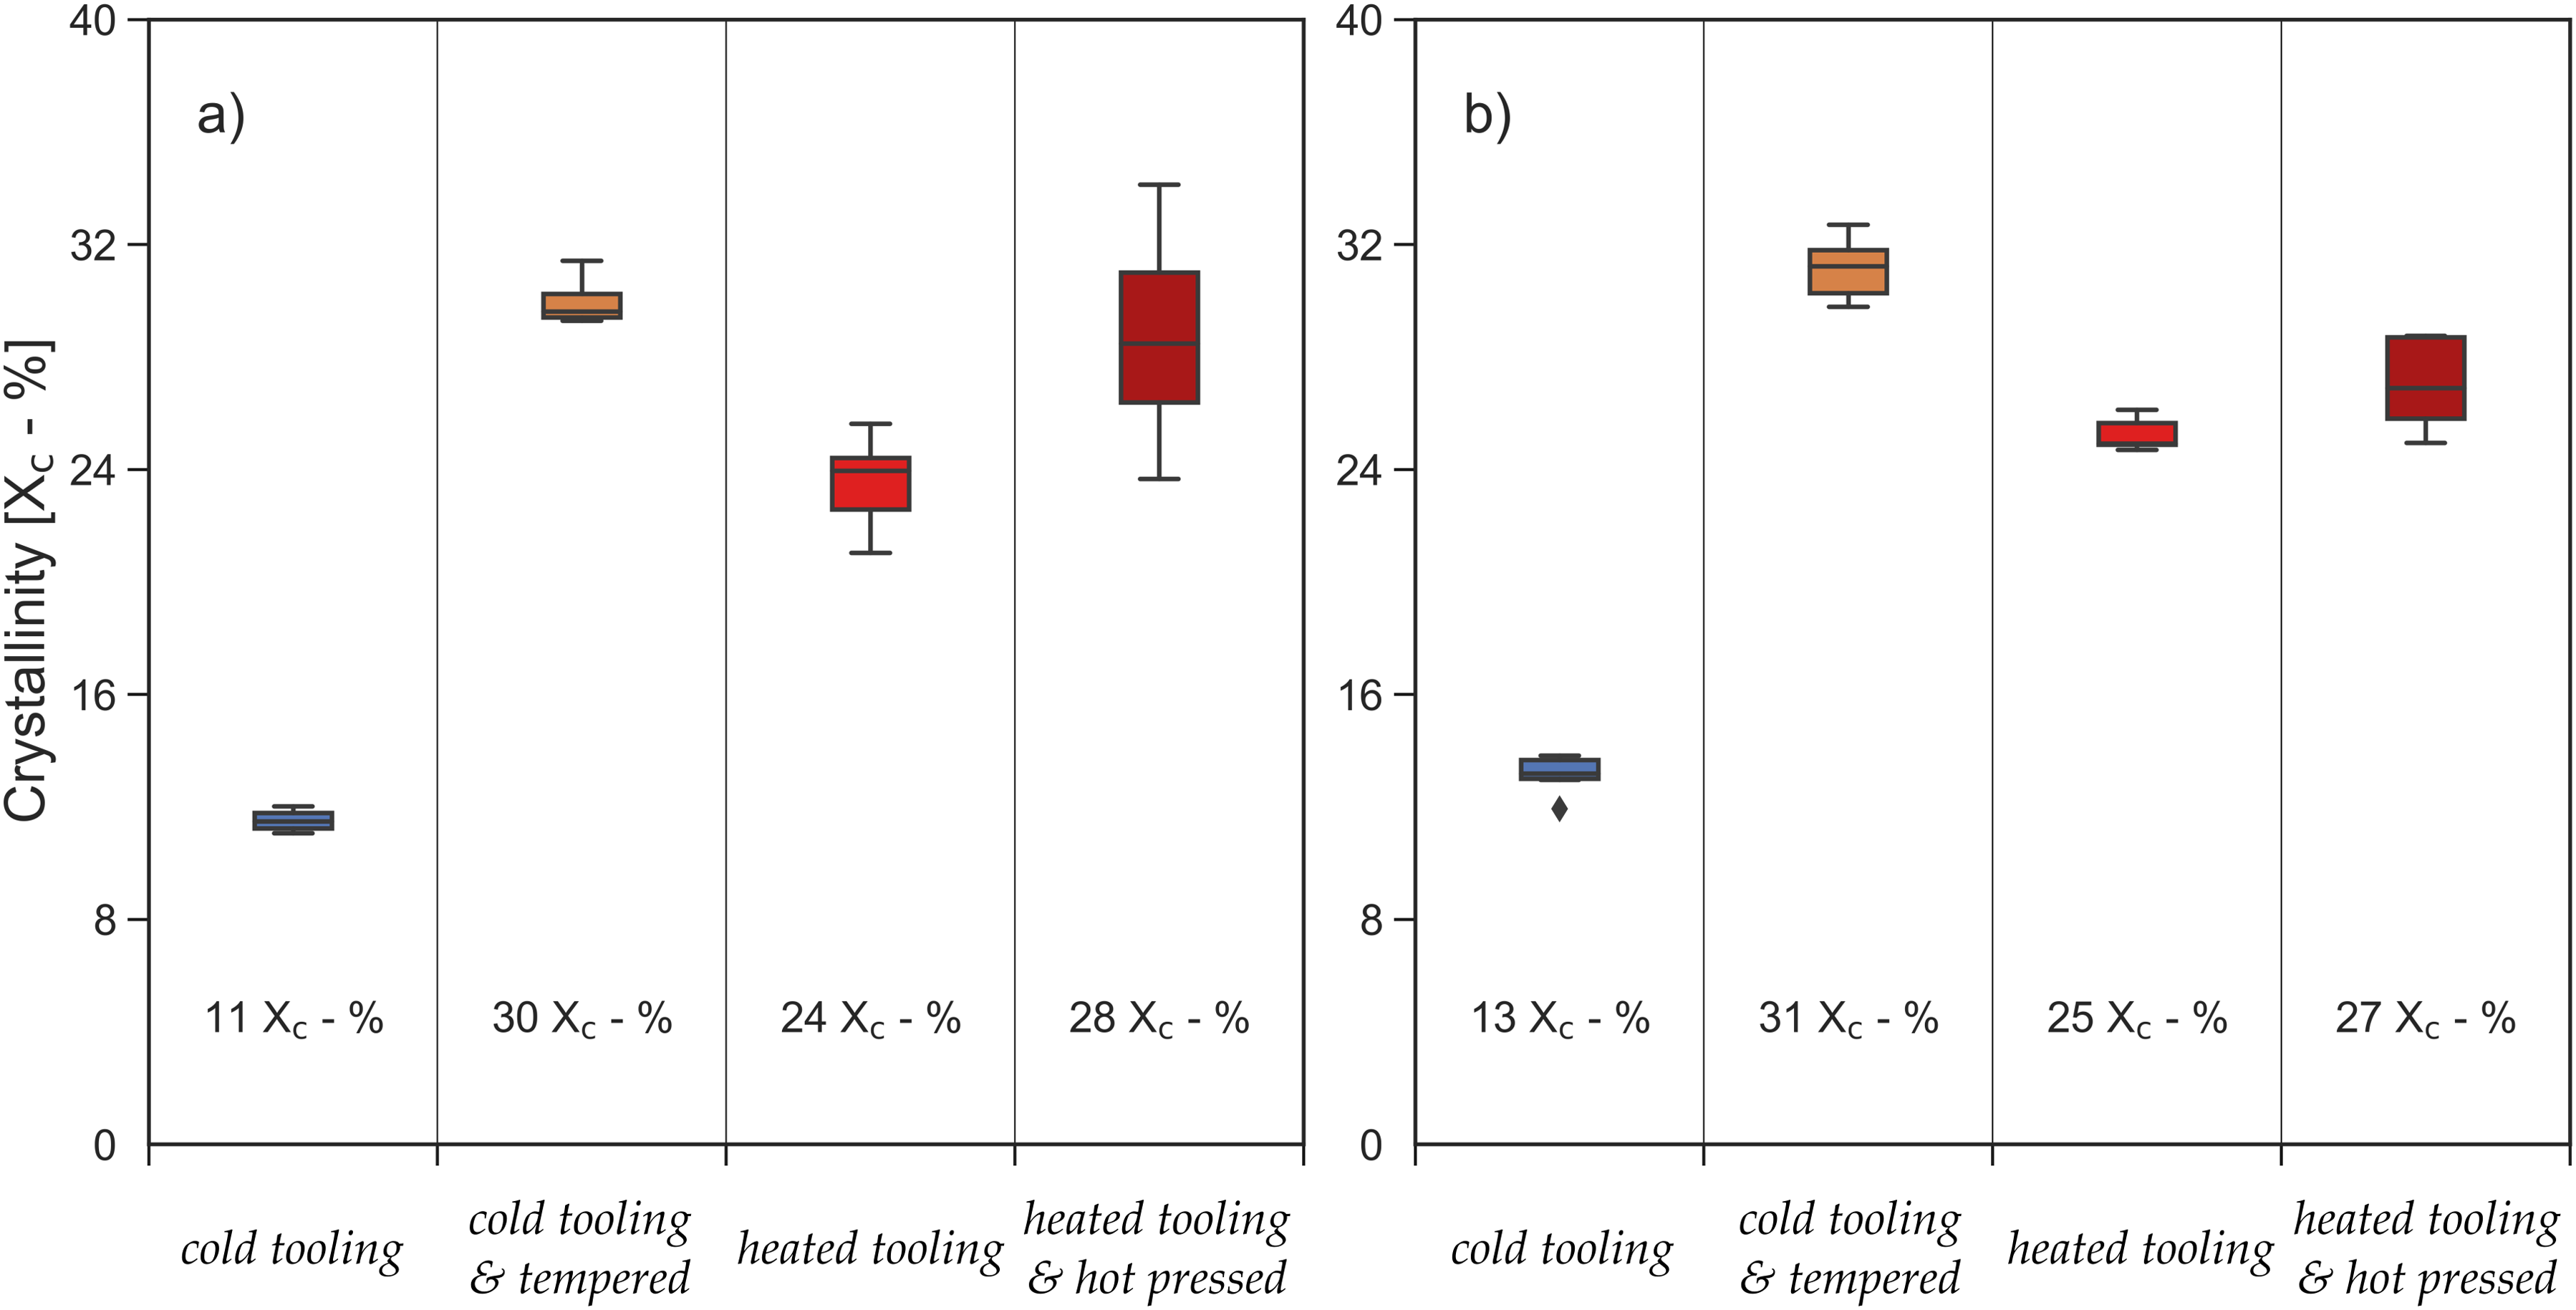
Mechanical test results
All ILSS specimens showed plastic deformation and therefore failed in a non-standard ductile failure mode. Figure 13 displays the force-deformation-curves of the UD laminates and the calculated apparent interlaminar shear strengths are plotted in Figure 14(a). Interlaminar shear strength testing – Force-deformation-curves. Results of the mechanical testing campaign: (a) Short beam bending testing of UD laminates, (b) Fiber-perpendicular tensile testing of UD laminates, (c) Compression testing of QI laminates, (d) Tensile testing of QI laminates.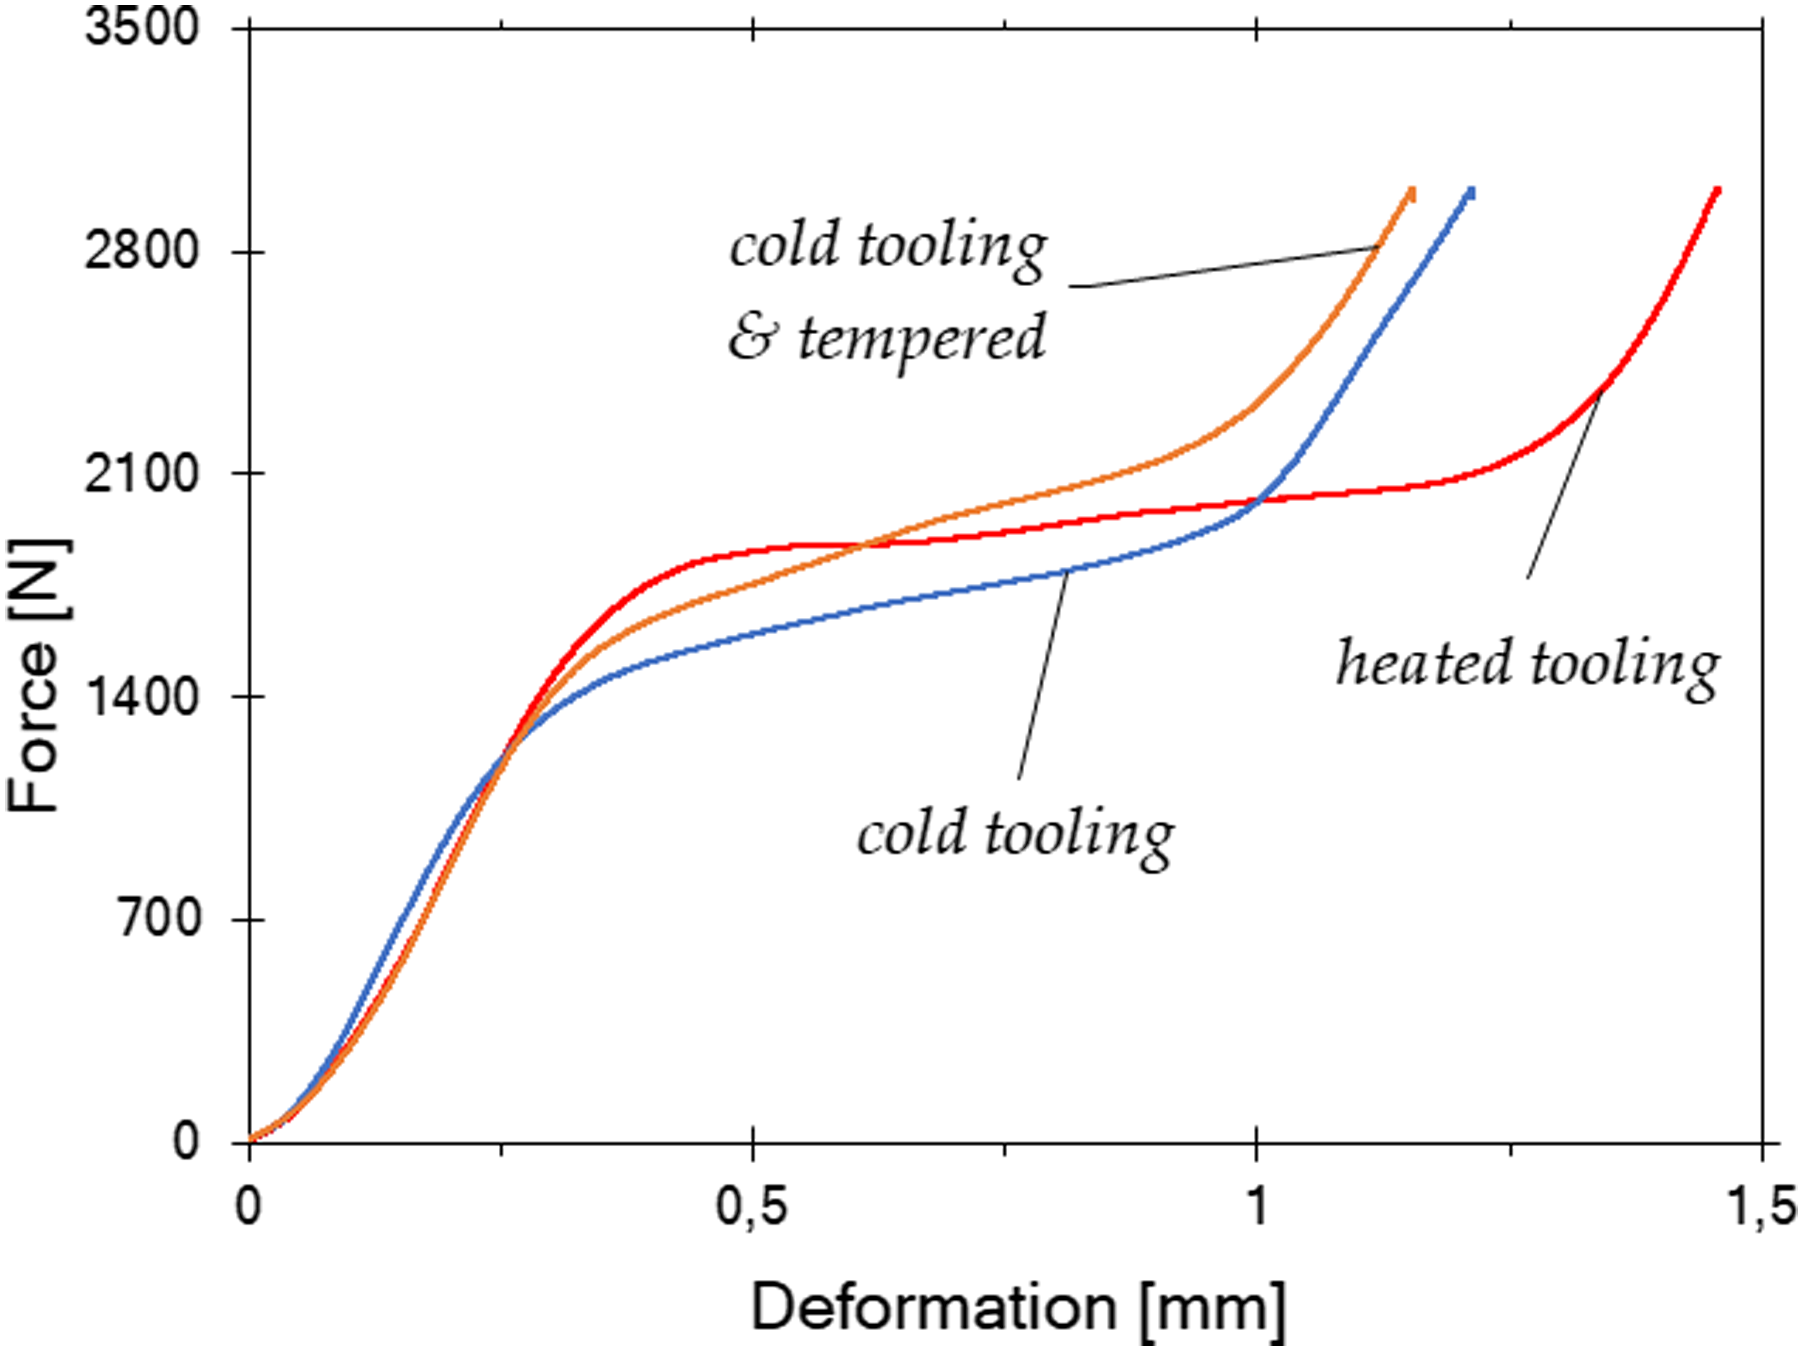
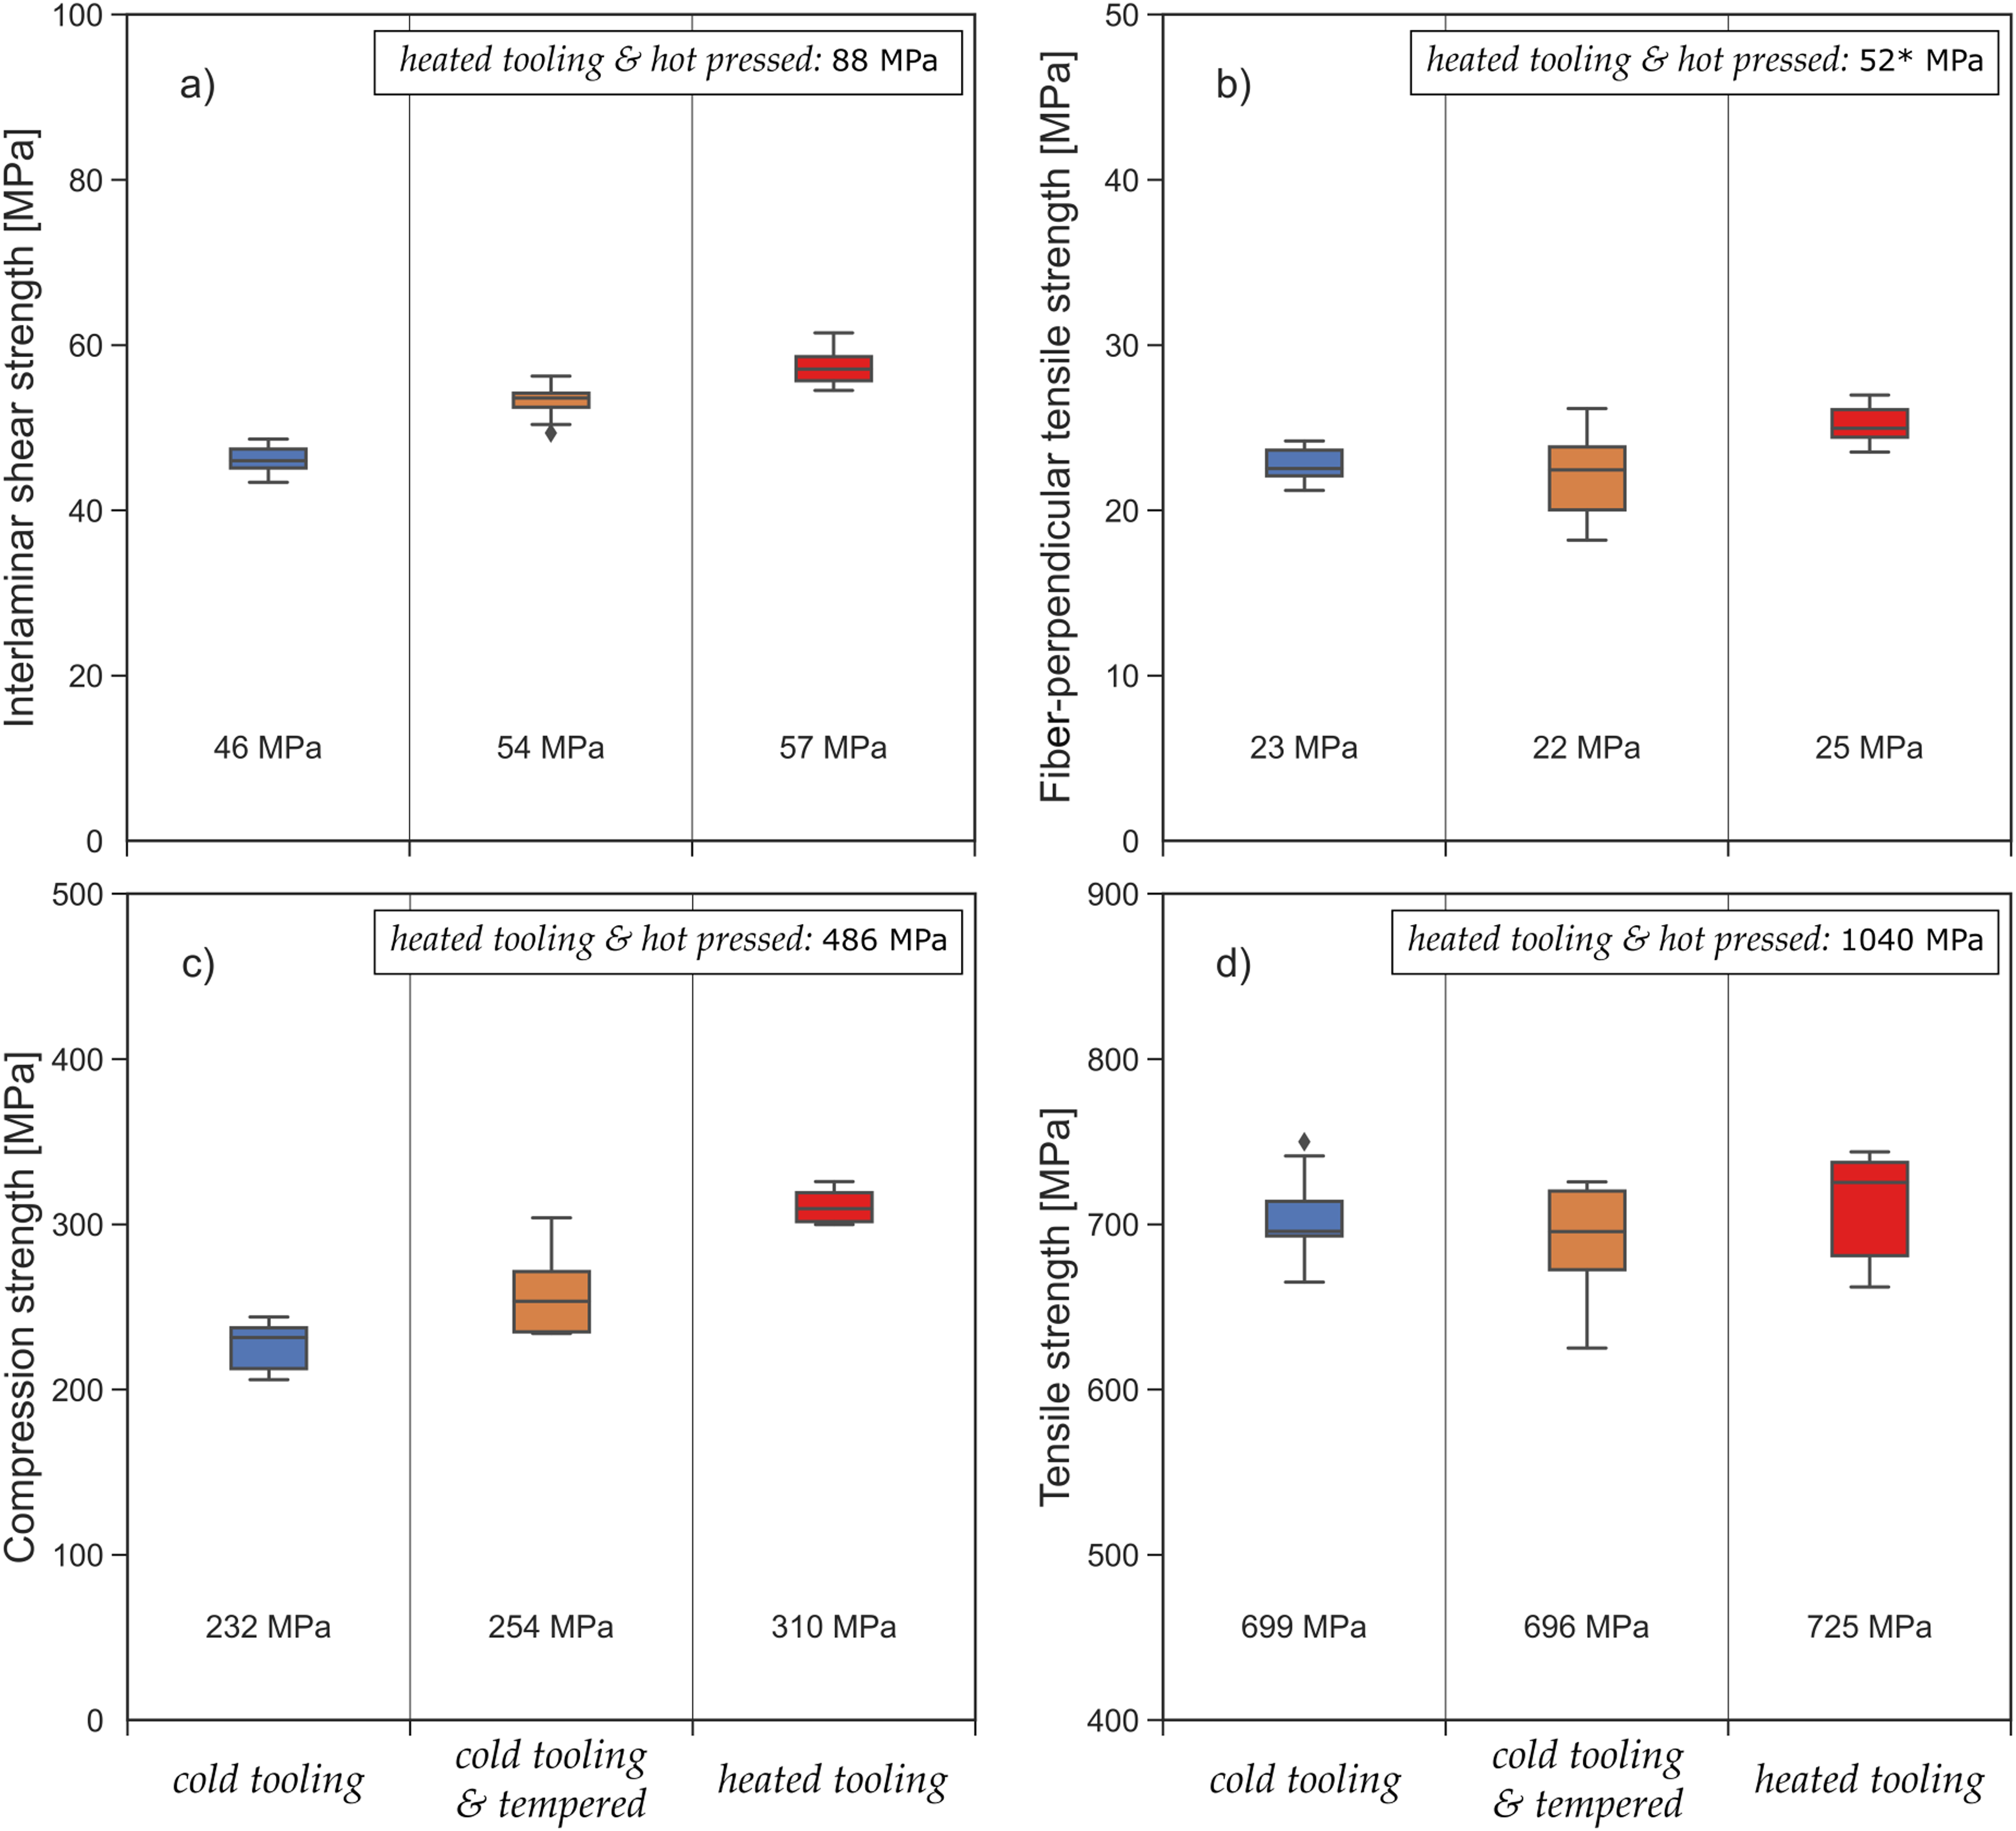
Comparing the four mechanical properties with one another in Figure 14 reveals two distinct behaviors. Firstly, the ILSS (Figure 14(a)) and compression strength (Figure 14(c)) median values showed similar trends – increasing from the lowest value displayed by the cold tooling condition (τ = 46 MPa,
* The results of the tensile test perpendicular to the fiber direction for the hot pressed specimens are invalid because all specimens failed at the beginning of the tabs. For specimens which do not fail at the beginning of the tabs, which is a common weak point due to stress, even higher values are expected.
Laminate quality – porosity
Water-coupled ultrasonic scanning results
Figure 15 shows Water-coupled Ultrasonic Scanning (W-US) results of the manufactured QI laminates. The gate is set to the position of the expected back wall of the laminate. The C-Scan in the upper row thus represents the amplitude of backwall echo over the laminate. No clear backwall can be detected for the AFP laminates without post-consolidation (Figure 15(a)–(c)). The C-Scan of the heated tooling laminate (Figure 15(c)) presents slightly higher backwall signal, however on a very low overall level. The B-Scans in the bottom row show no pronounced delaminations or larger defects, indicating porosity in the laminates. Conversely, the hot pressed laminate exhibits a clear backwall (Figure 15(d)). Water-coupled ultrasound scans of the QI laminates: (a) cold tooling, (b) cold tooling & tempered, (c) heated tooling, (d) heated tooling & hot pressed.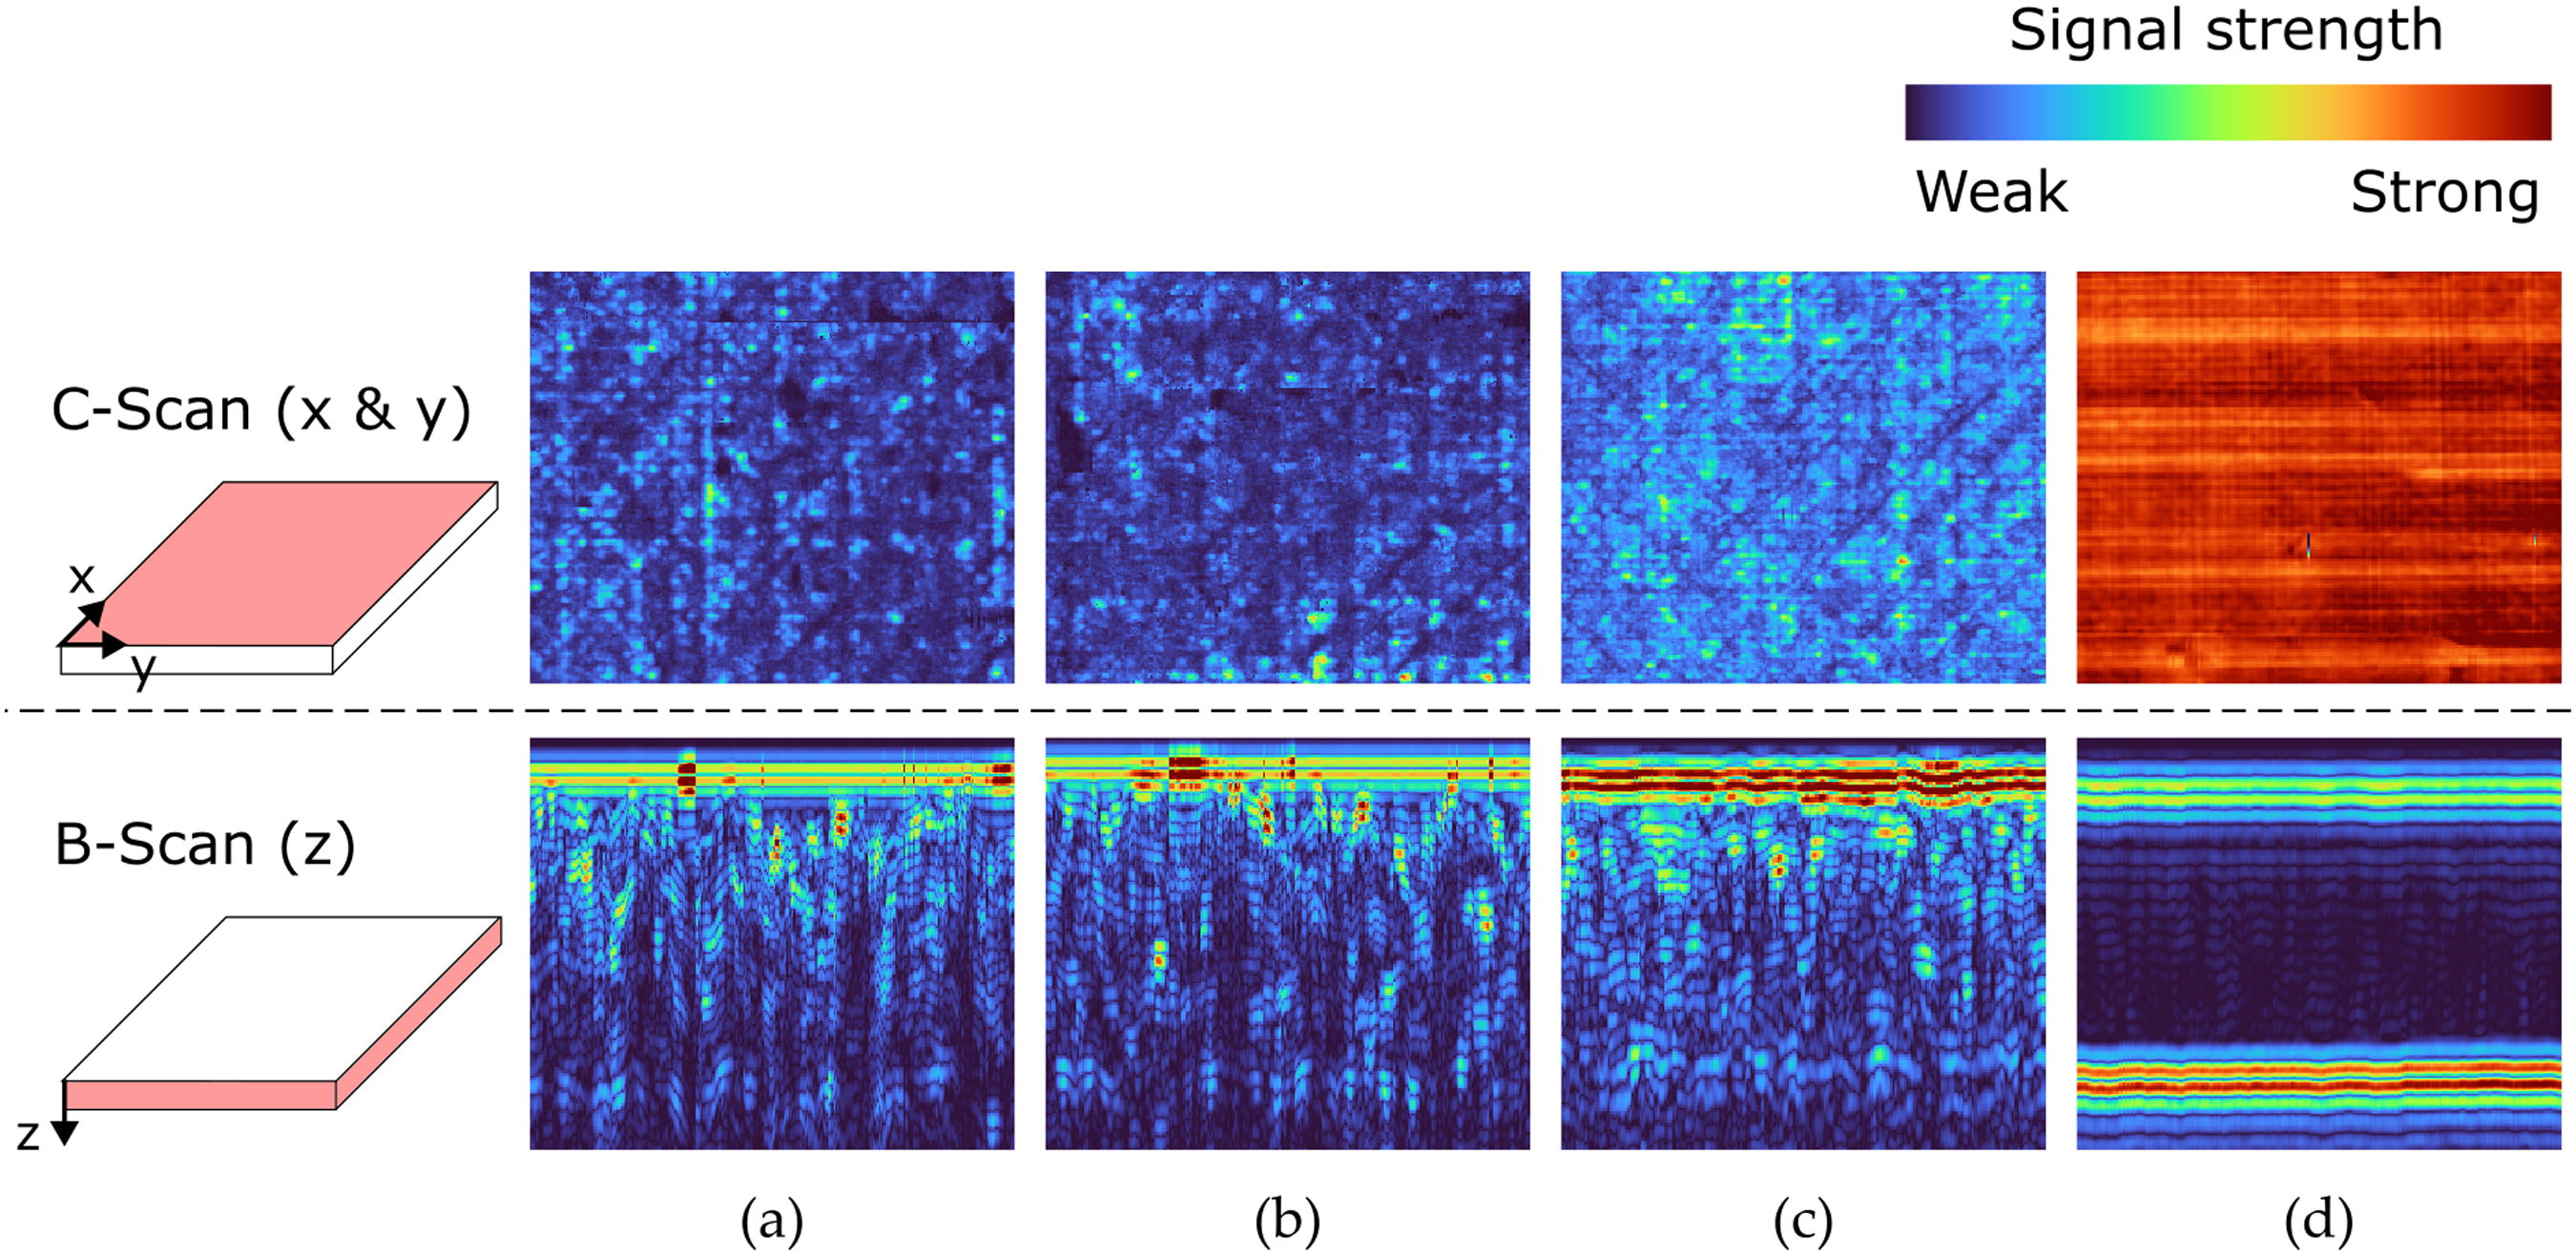
Computed tomography results
Top view (Figure 16 for reference) CT images of the QI laminates cross sections are displayed in Figure 17(a)–(c). The 0° - plies lie parallel to the image plane and the 90° - plies vertical to it. The image in Figure 17(d) show a side view cross section whereby the 90° - plies lie parallel to the image plane, respectively. The orientation of the CT specimen (tool-facing side) was not protocolled. CT-Scan section views. CT images of QI laminates produced with cold tooling (a), cold tooling & tempered (b), heated tooling (c) and heated tooling & hot pressed (d).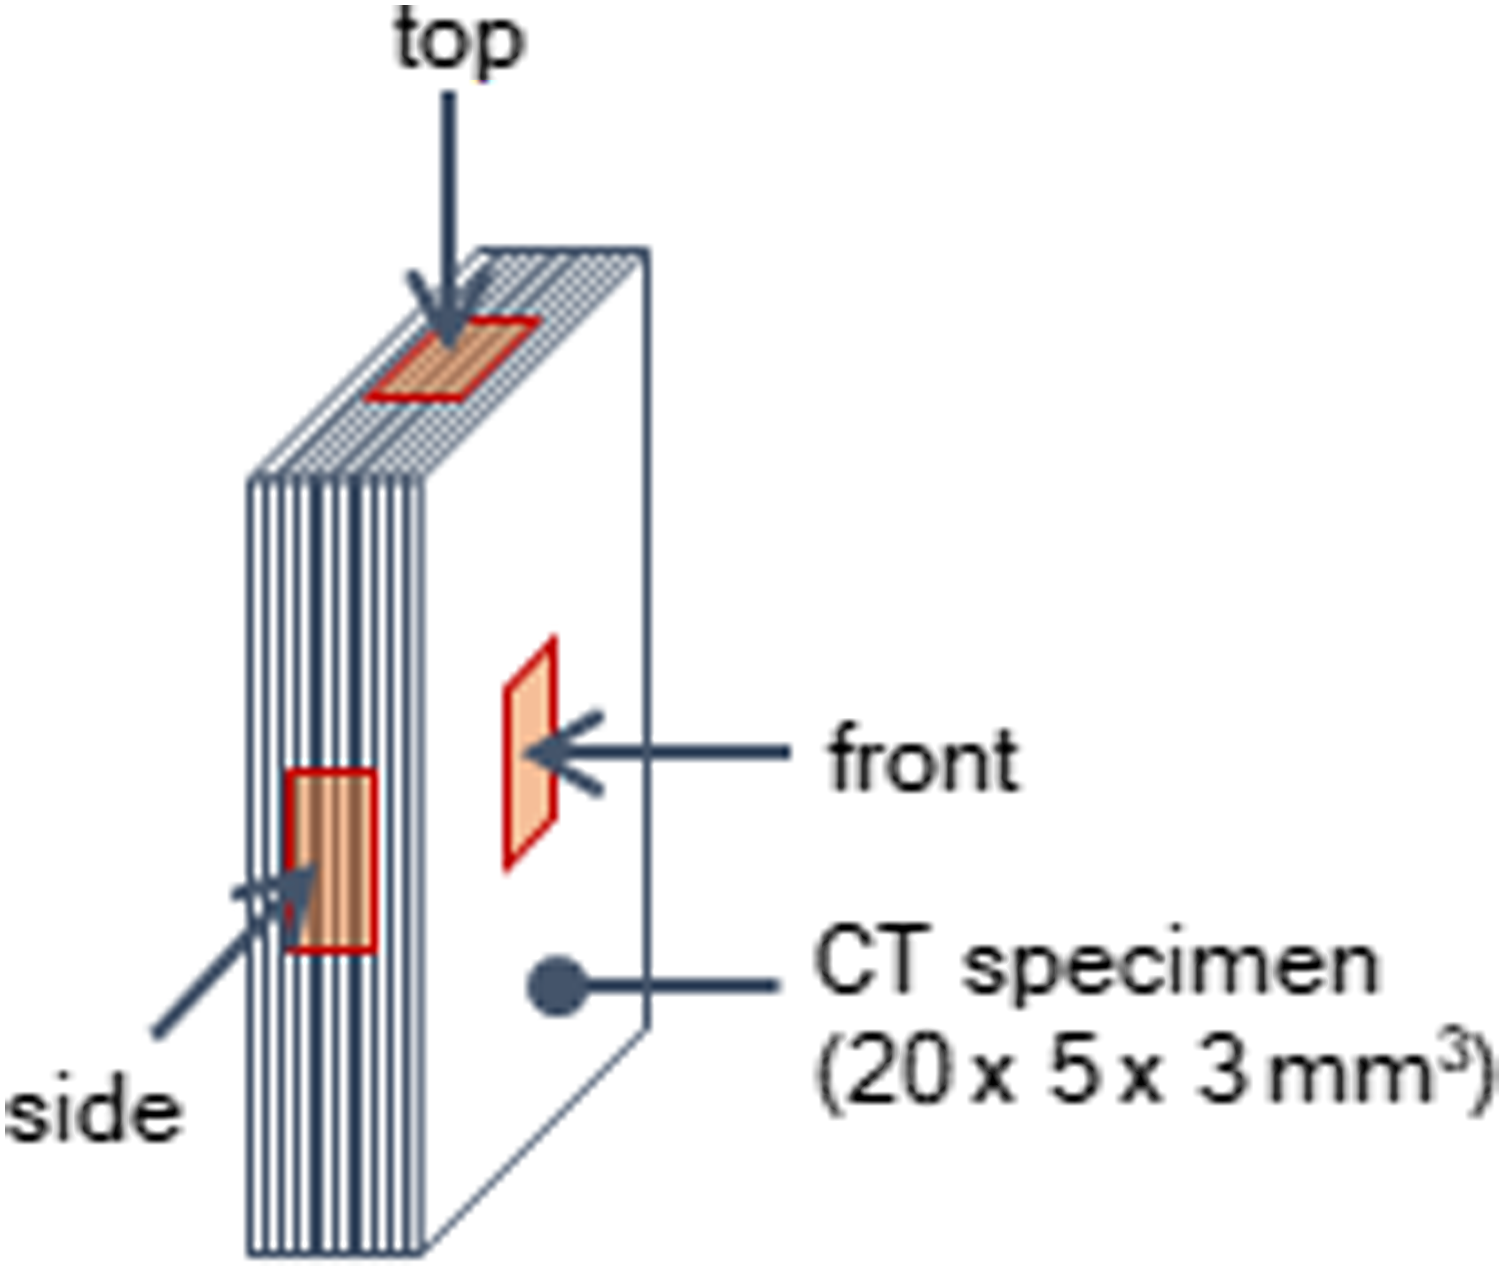
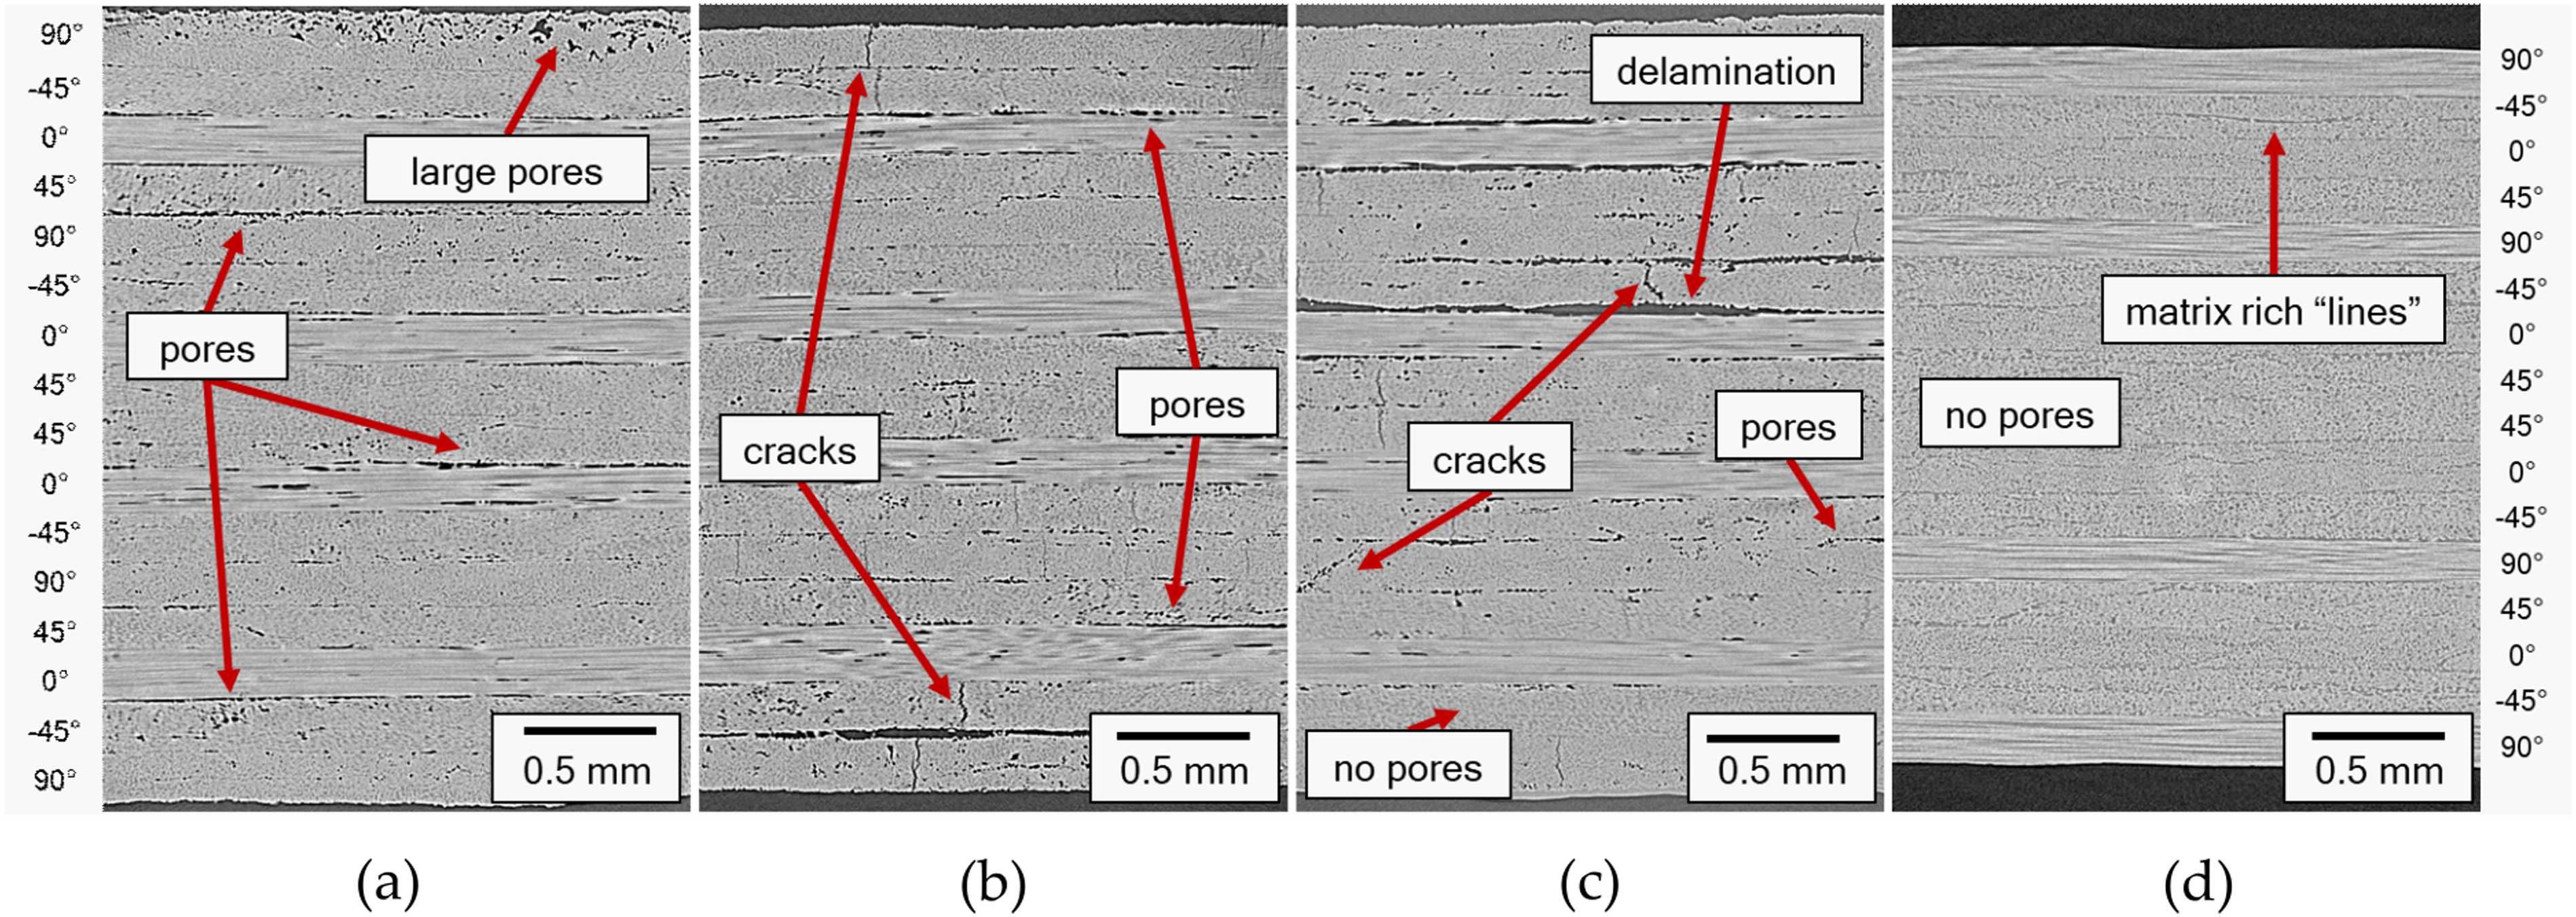
The laminate produced with cold tooling (Figure 17(a)) shows pores at the ply interfaces (interlaminar porosity) as well as within individual plies (intralaminar porosity). Especially in the topmost layer of the image large pores are visible. The additionally tempered laminate is displayed in Figure 17(b) and reveals both inter- and intralaminar porosity which appear slightly larger in size compared to the ones of the cold tooling. Vertical intralaminar cracks are observed in most of the layers. These distinct vertical cracks also appear in the laminate, manufactured with a heated tooling (Figure 17(c)). In the heated tooling laminate, large interlaminar pores and even delamination can be found. After hot pressing all porosity is eliminated (Figure 17(d)). No more cracks can be found in the hot pressed laminate. Additionally, matrix rich “lines”, running mostly in horizontal direction can be noticed within single layers. The thickness of the hot pressed laminate is noticeably reduced by the hot pressing process compared to the solely in-situ AFP produced laminate on heated tooling.
Figure 18 shows front view cross sections of ply interfaces (Figure 18(a) and (b)) and individual plies. The comparison between the heated tooling (Figure 18(a)) and the heated tooling & hot pressed (Figure 18(b)) laminate is evident. While the hot pressed laminate shows a good interply bonding between the two individual plies (45° angle between plies) without any porosity, the heated tooling shows extensive porous regions (black areas). The cross sections in Figure 18(c) and (d) present views inside one individual layer, respectively and are thus investigating intralaminar porosity. The pores, some of tubular shape, which are detectable in the heated tooling (Figure 18(c)) are eliminated through the hot pressing post process (Figure 18(d)). CT images of QI laminates produced with heated tooling (a) and (c) and heated tooling & hot pressed (b) and (d).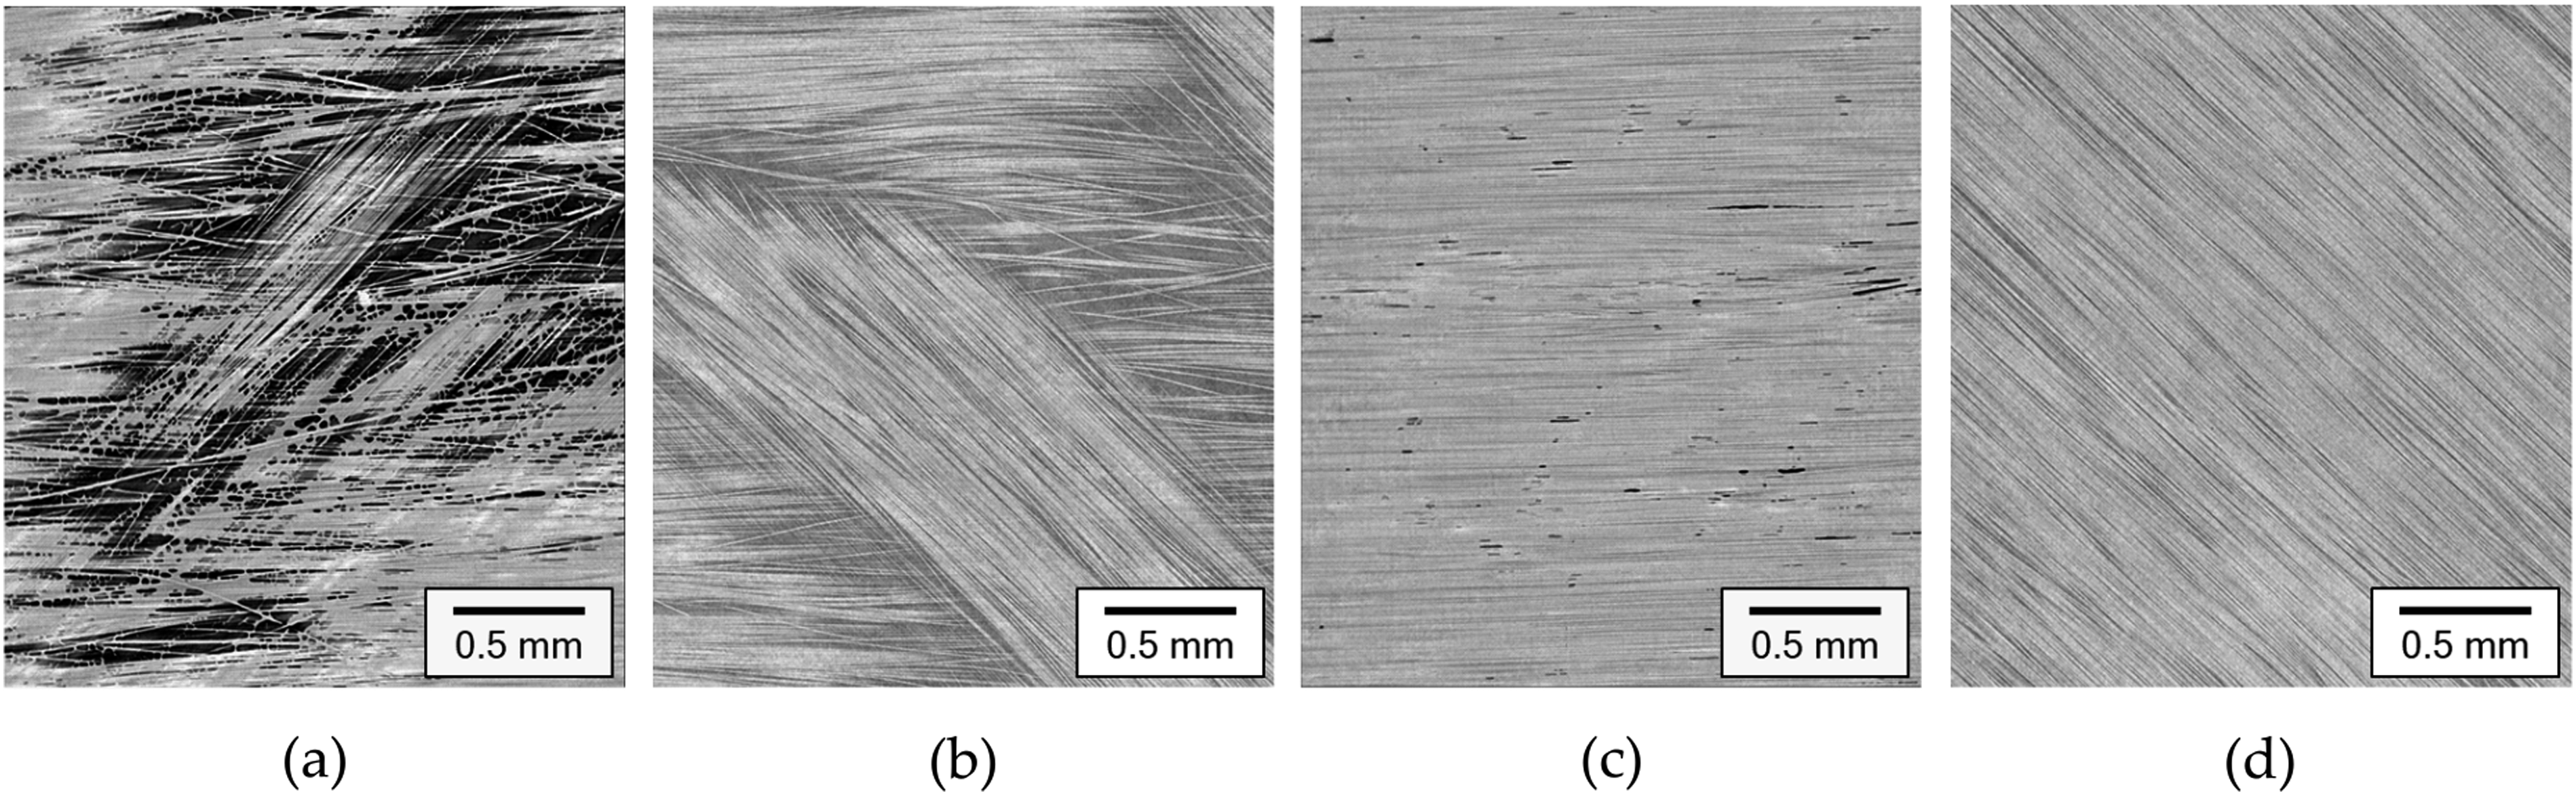
Figure 19 shows the cross section of one single unprocessed, as-delivered tape. Distinct cylindrical and spherical pores can be found in the unprocessed tape material. CT images of as delivered tape material.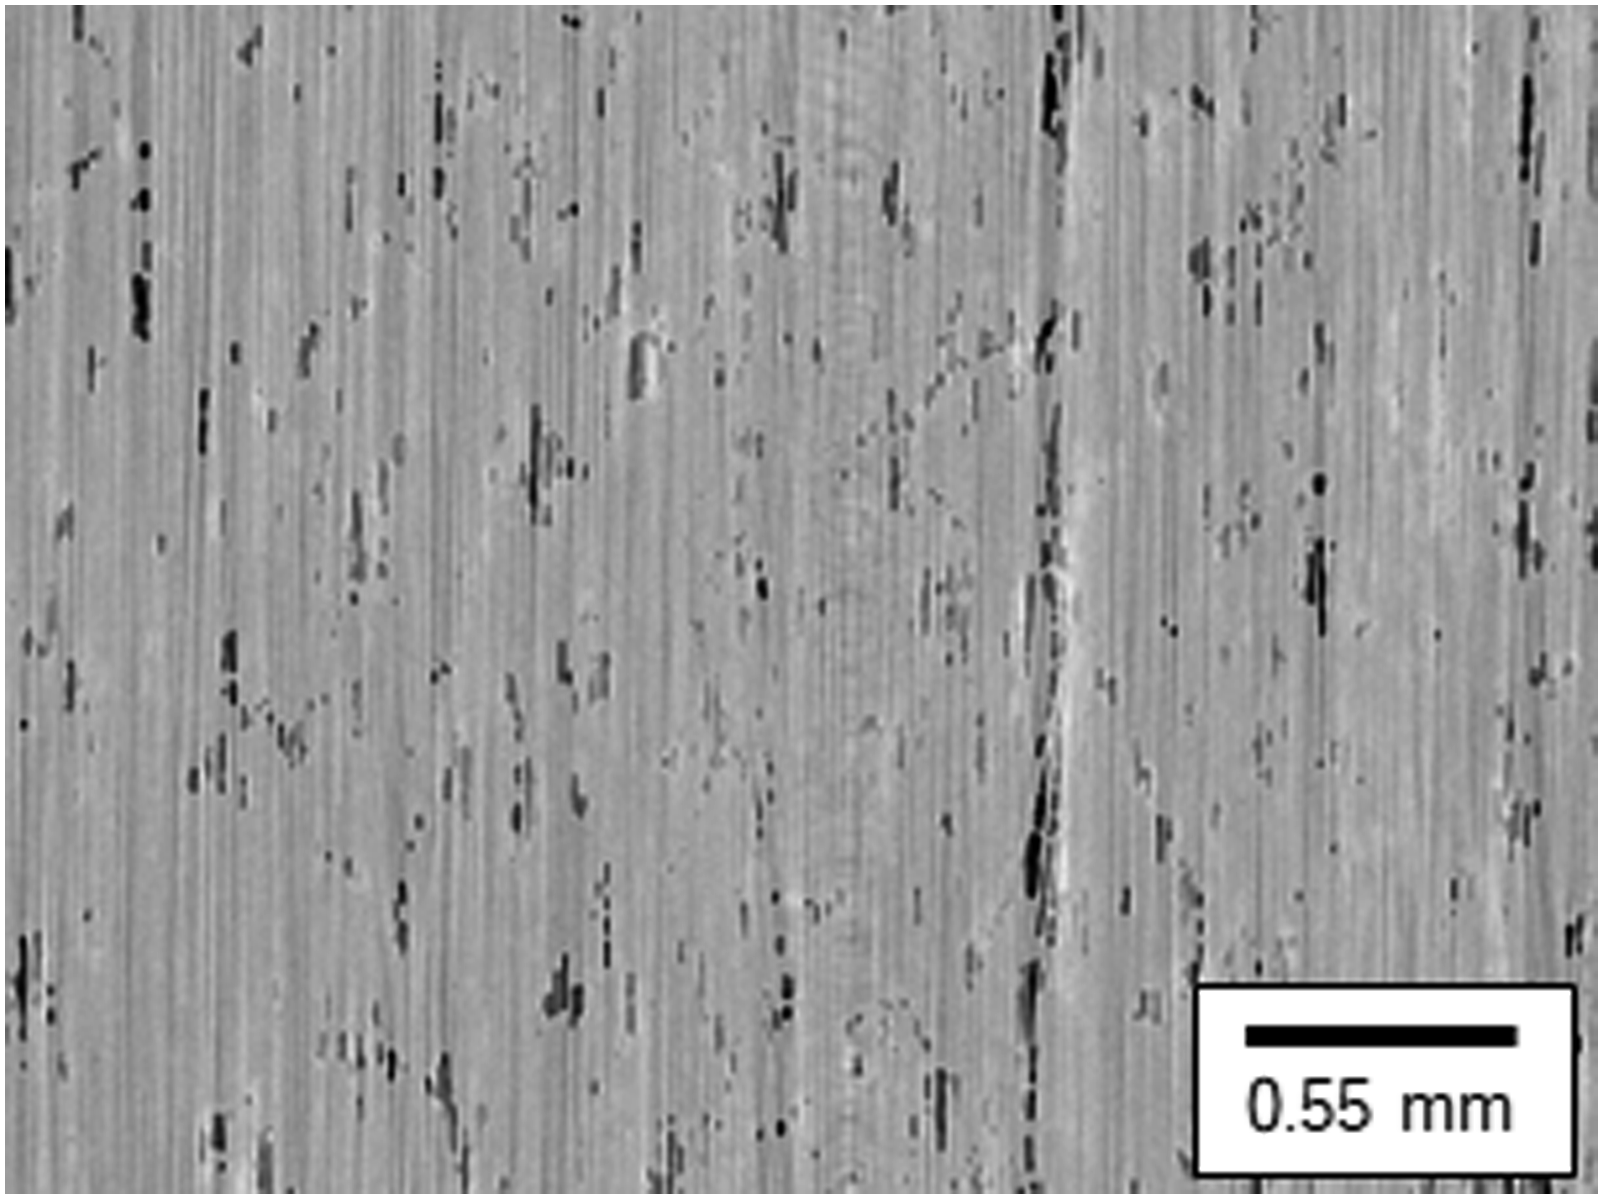
Laminate quality – warping
The 3D scanning results of cold and heated tooling already have been published and analysed in Ref. 34. The warping pattern of the cold tooling panel demonstrated in Figure 20(a) remains similar after tempering (Figure 20(b)) but the magnitude of the deformation increases. Since three corners are supressed in their movement in z-direction, the top left corner can move freely and shows the largest deformation. The maximum measured deviation in normal direction to a reference plane through the three fixed corner points is +20.6 mm/–13.8 mm for the untreated and +31.9 mm/–21.0 mm for the tempered panel.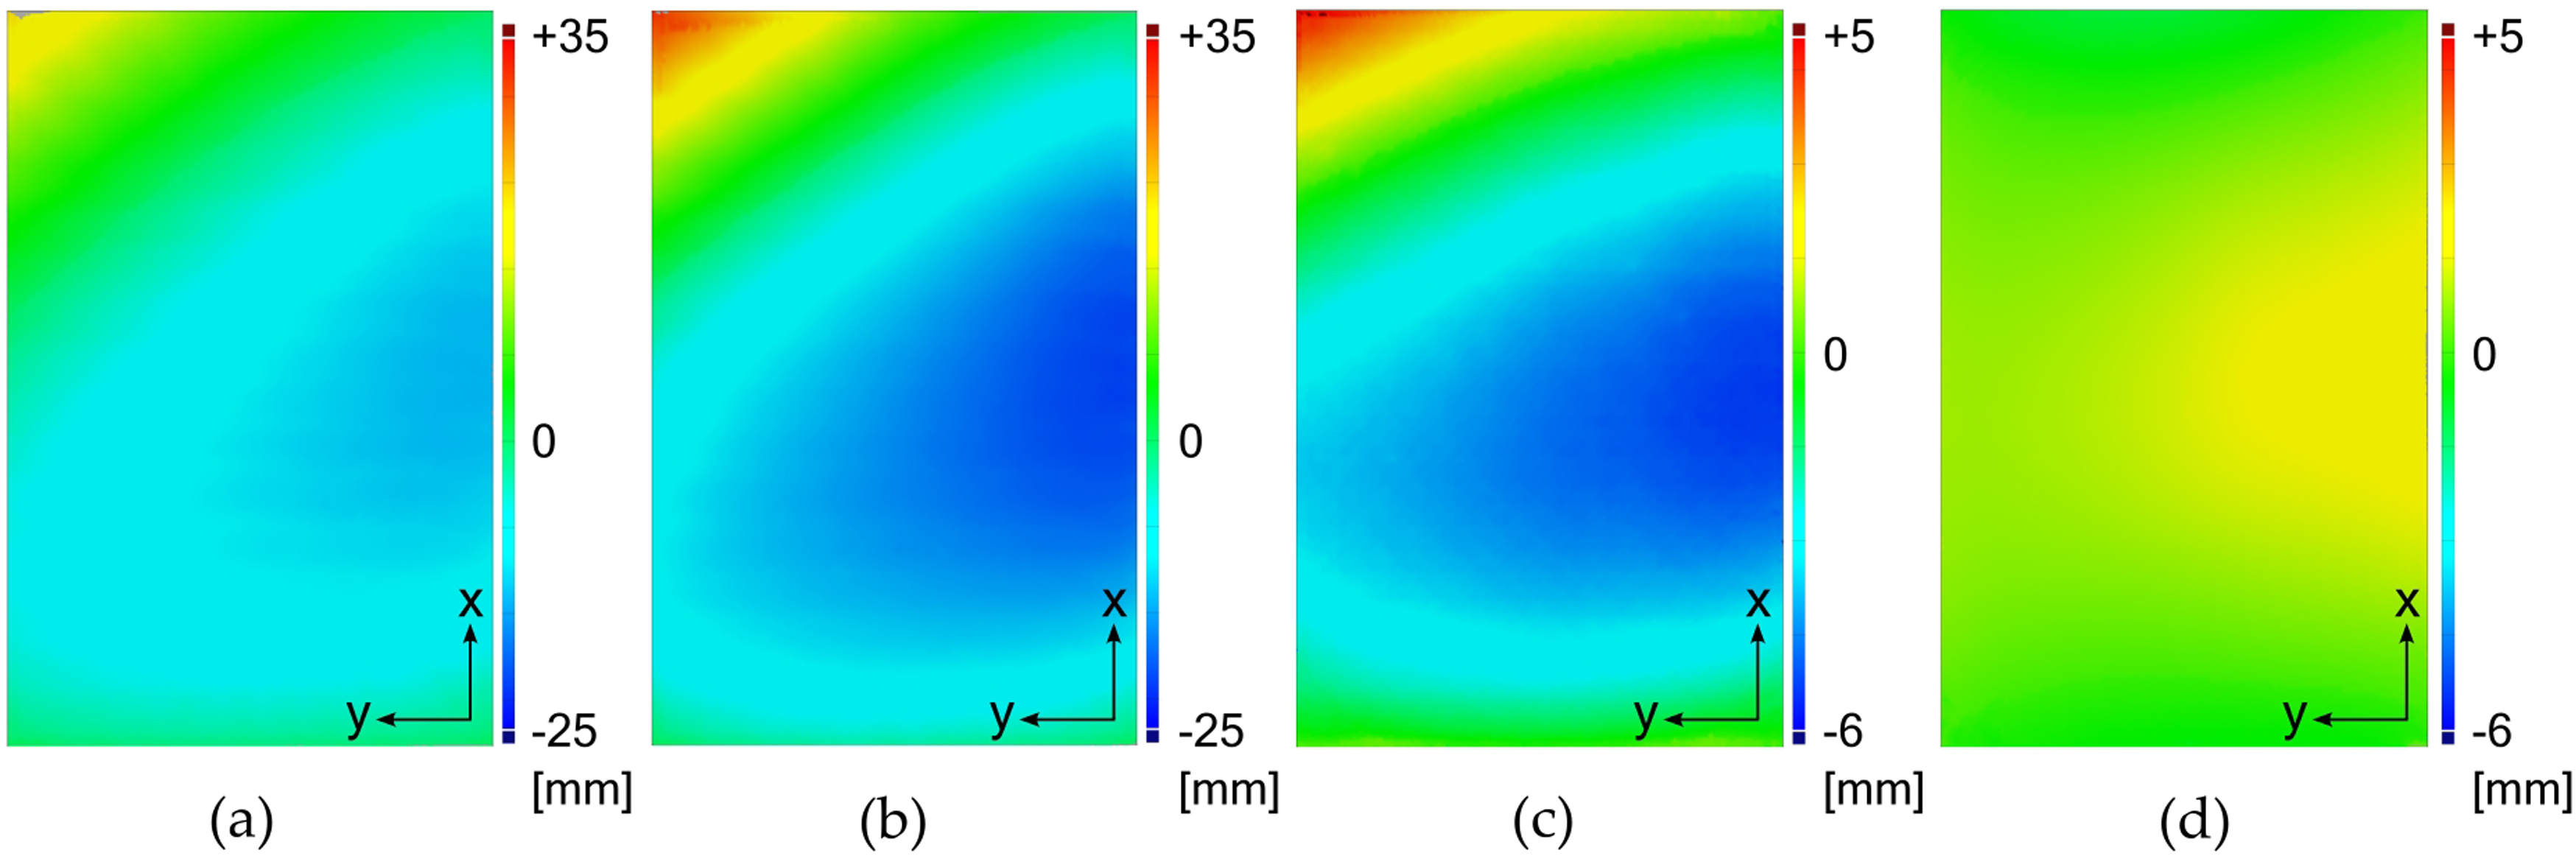
The maximum warping of the heated tooling panel (Figure 20(c)) of +5.1 mm/–5.4 mm is smaller than the maximum warping of the cold tooling panel (Figure 20(a)) of +20.6 mm/–18.8 mm.
The warping of the heated tooling panel is again drastically reduced by hot pressing (Figure 20(d)), resulting in a maximum warping of +1.9 mm. The maximum also shifts from the upper left corner to the middle right edge. The general warping pattern is inverted since the original location of the maximum negative warping now contains the maximum positive warping.
Laminate quality – Microscopic morphology
The SEM analysis performed in this study aims to characterize crystallized and amorphous areas present in the polymer matrix of the produced laminates. Crystallized areas are furthermore separated into areas with lamellar crystallites, small spherulites with a diameter of approximately 2 µm to 5 µm and large spherulites with a diameter of more than 5 µm. The four microscopic features are visualised in Figure 21(a)–(d), respectively. Microscopic features: amorphous next to crystallized areas (a), crystallized area (b), small spherulites (c) and large spherulites (d).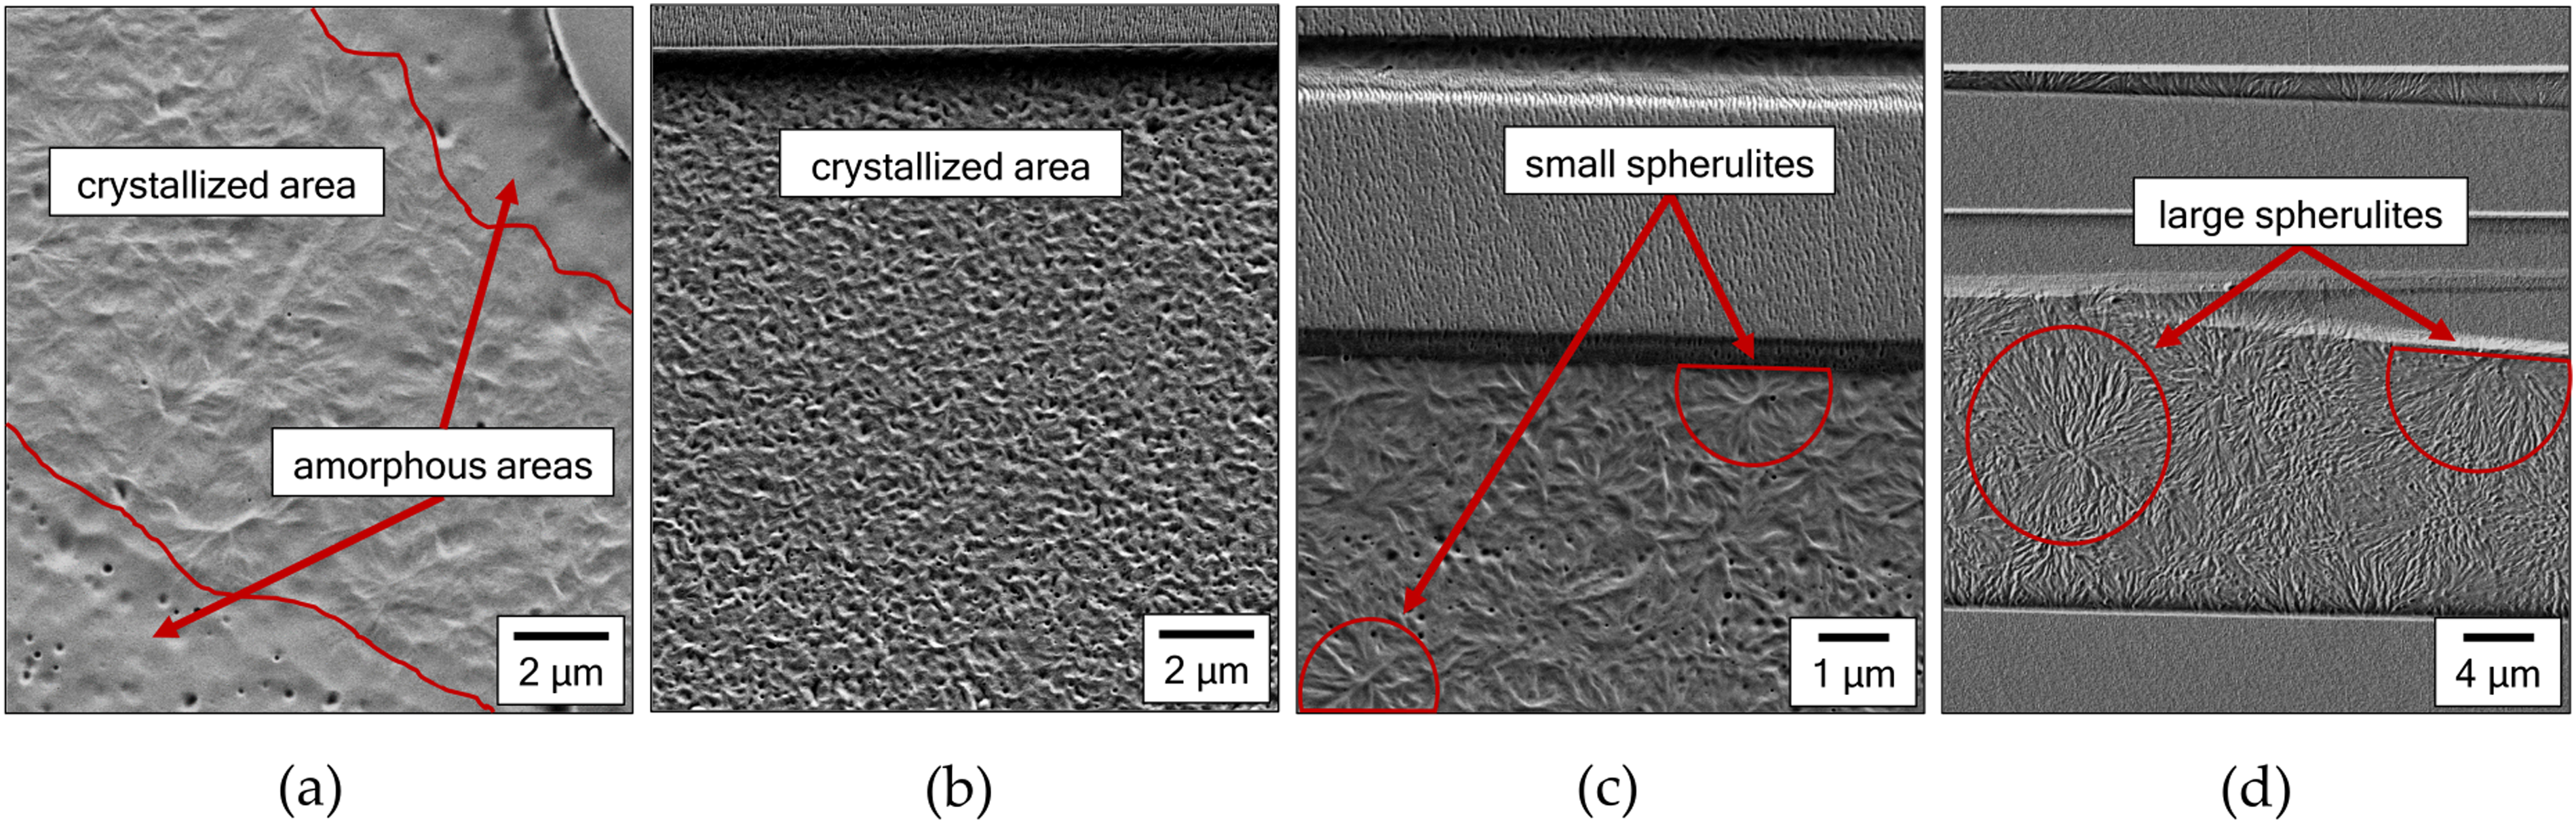
Based on the respective SEM images, the presence of amorphous and crystalline structures as well as spherulites is analysed for every laminate specimen. Each layer and all of the interfaces between two adjacent layers were examined. For each of the thermal treatments of the laminates the appearance of the four microscopic features was documented. The results for the twelve layers of the UD laminates and the sixteen layers of the QI laminates are exemplarily summarized in Figure 22(a) and (b), respectively. Number of layers in which the respective microscopic features appear within the UD laminates (a) and the QI laminates (b).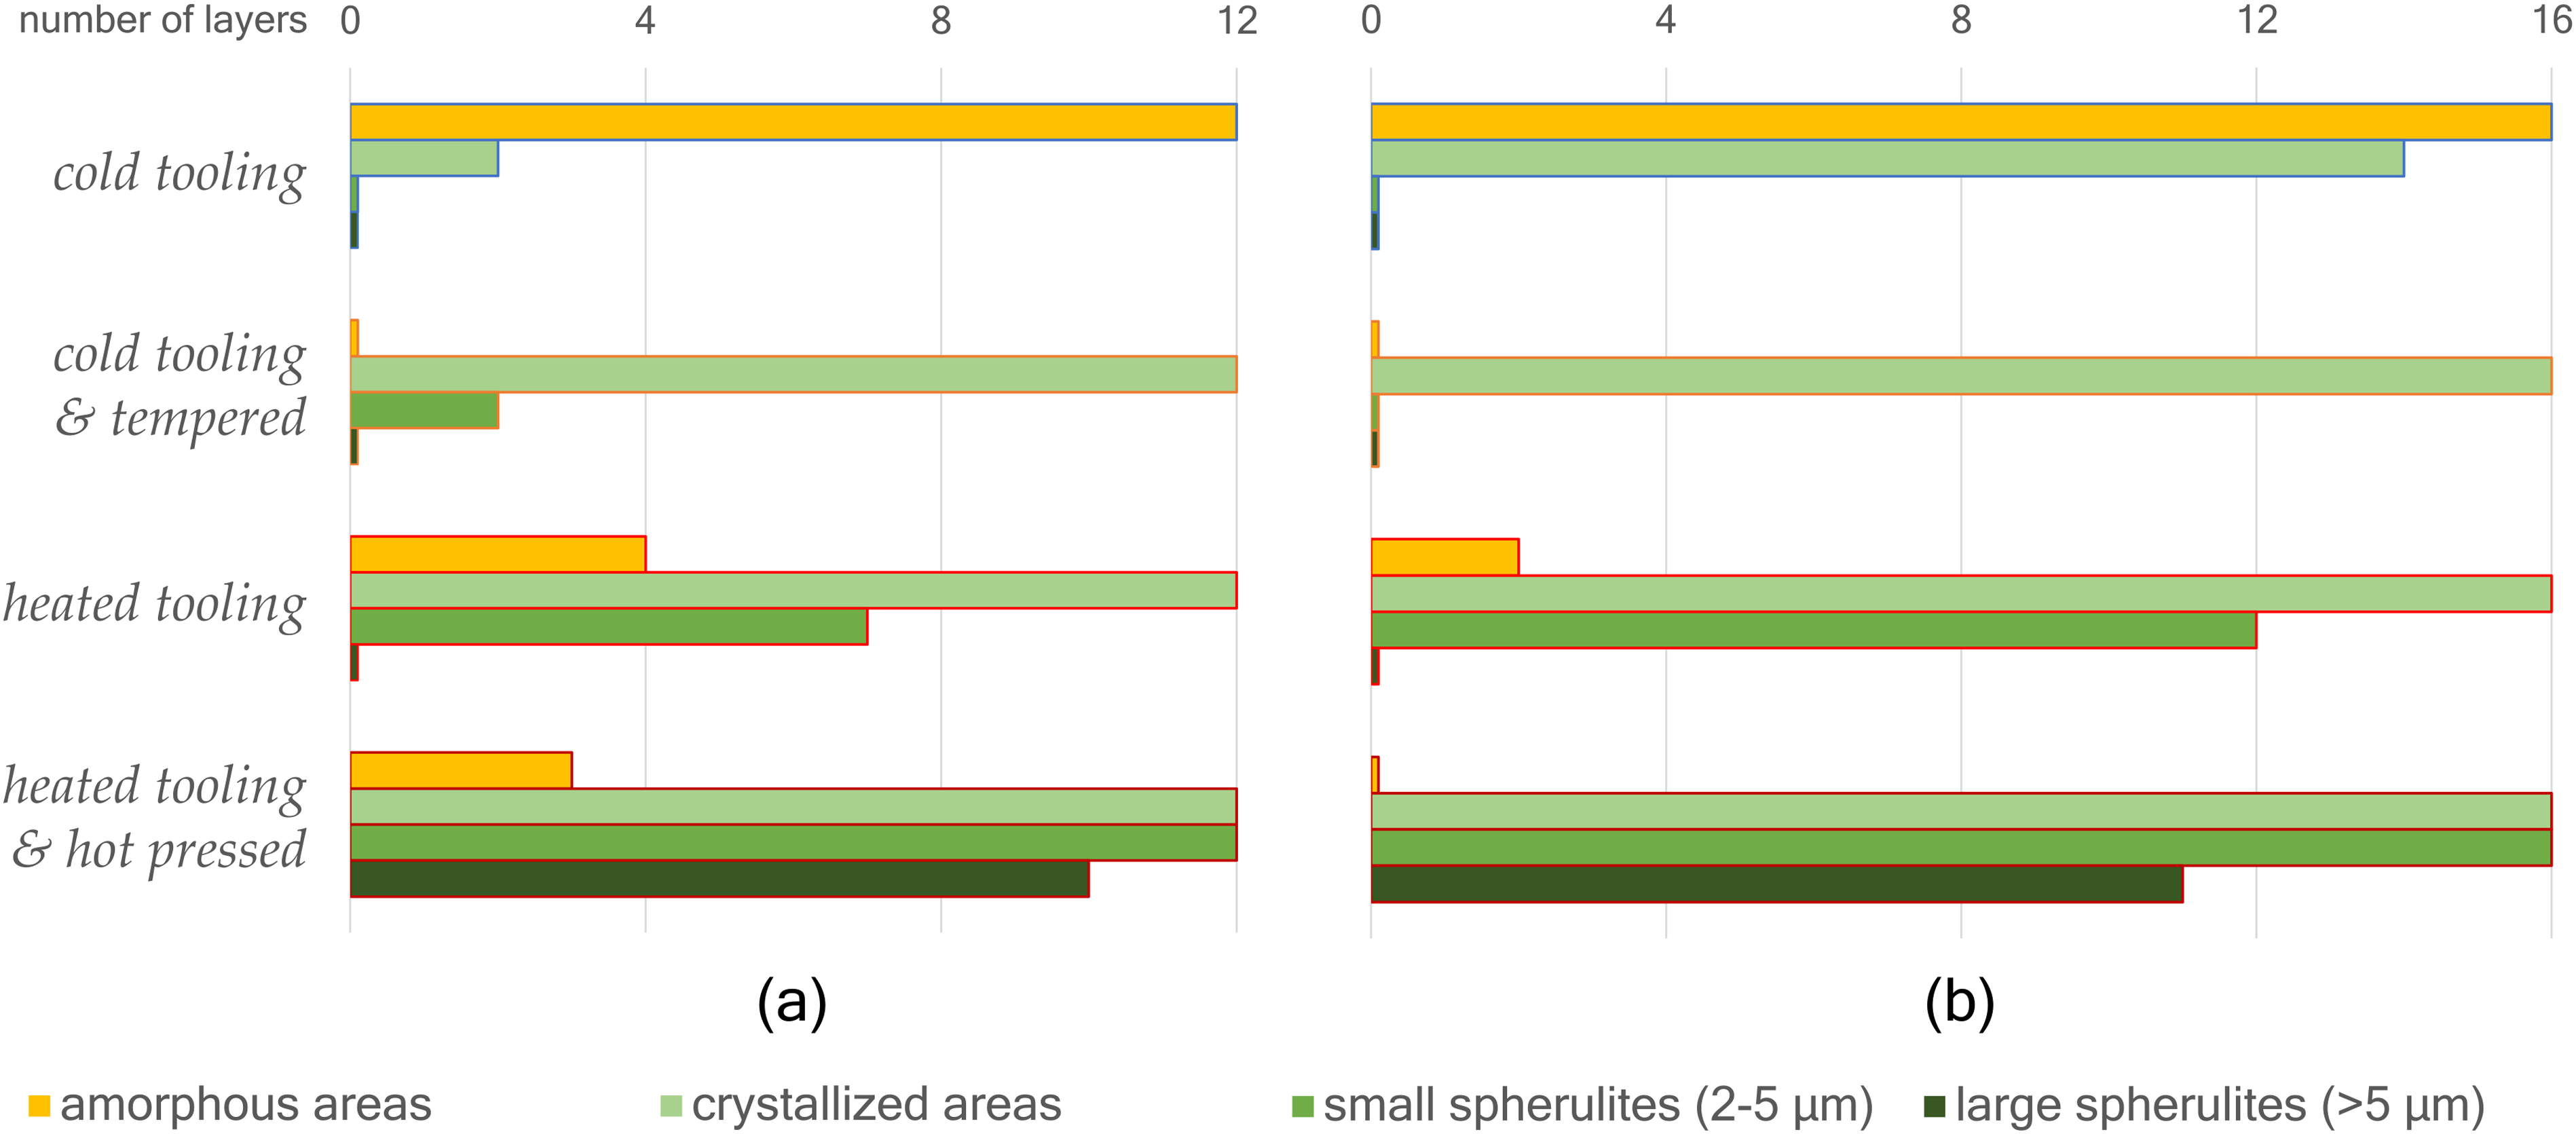
In all of the layers of the UD laminate produced on cold tooling a mainly amorphous polymer matrix is found and only in two of the twelve layers isolated crystallized areas are detected. No large spherulites can be detected in any of the analysed specimens produced on a cold tooling. Nevertheless, several partly crystallized layers and interfaces are found in the specimens with a QI layup and also a few small spherulites are detected in the interface of layer one and two.
When tempered, the polymer microstructure of laminates produced with cold tooling significantly changes in all layers. The UD laminate microstructure is dominated by the crystallized phase and includes a significantly higher portion of small spherulites in comparison to the cold tooling results. In two layers small spherulites are found. In the QI laminate all layers are crystallized as well. Only in some interfaces amorphous areas can still be found.
For the heated tooling configuration amorphous areas are found in four of the twelve layers. Small spherulites are detected in several layers of the UD laminate. In the respective QI laminate small spherulites can be found in twelve out of sixteen layers. The amorphous areas present when using a heated tooling are much smaller compared to the ones of the cold tooling and beginning crystallization is already visible. Crystallized areas occur in and between all layers.
In the hot pressed UD laminate all microscopic features are found: apart from amorphous areas in three of the layers the polymer matrix shows a mainly crystallized structure, containing crystallized areas and small spherulites in all layers. This also applies to the QI laminate. The heated tooling & hot pressed laminates are the only configurations, that contain large spherulites (Figure 21(d)). Large spherulites can be found in ten out of twelve layers (mostly in the outer layers) for the UD laminate and in eleven out of sixteen layers for the QI laminate.
Discussion
The evaluated tests show different results for the laminates depending on their manufacturing conditions. The thermal heat treatments influence the internal laminate properties and the resulting mechanical performance. In order to provide a simple overview of the overall performance of the laminates with respect to their manufacturing conditions, the values presented in Figure 23 and designation between “low” and “very high” performing were determined by partitioning the value range (rmax – rmin) of the relevant property or investigative technique in quarters. Rating matrix of the four laminate configurations regarding the laminate internal properties and the laminate performance (*failed at the beginning of the tabs; **plastic deformation failure mode).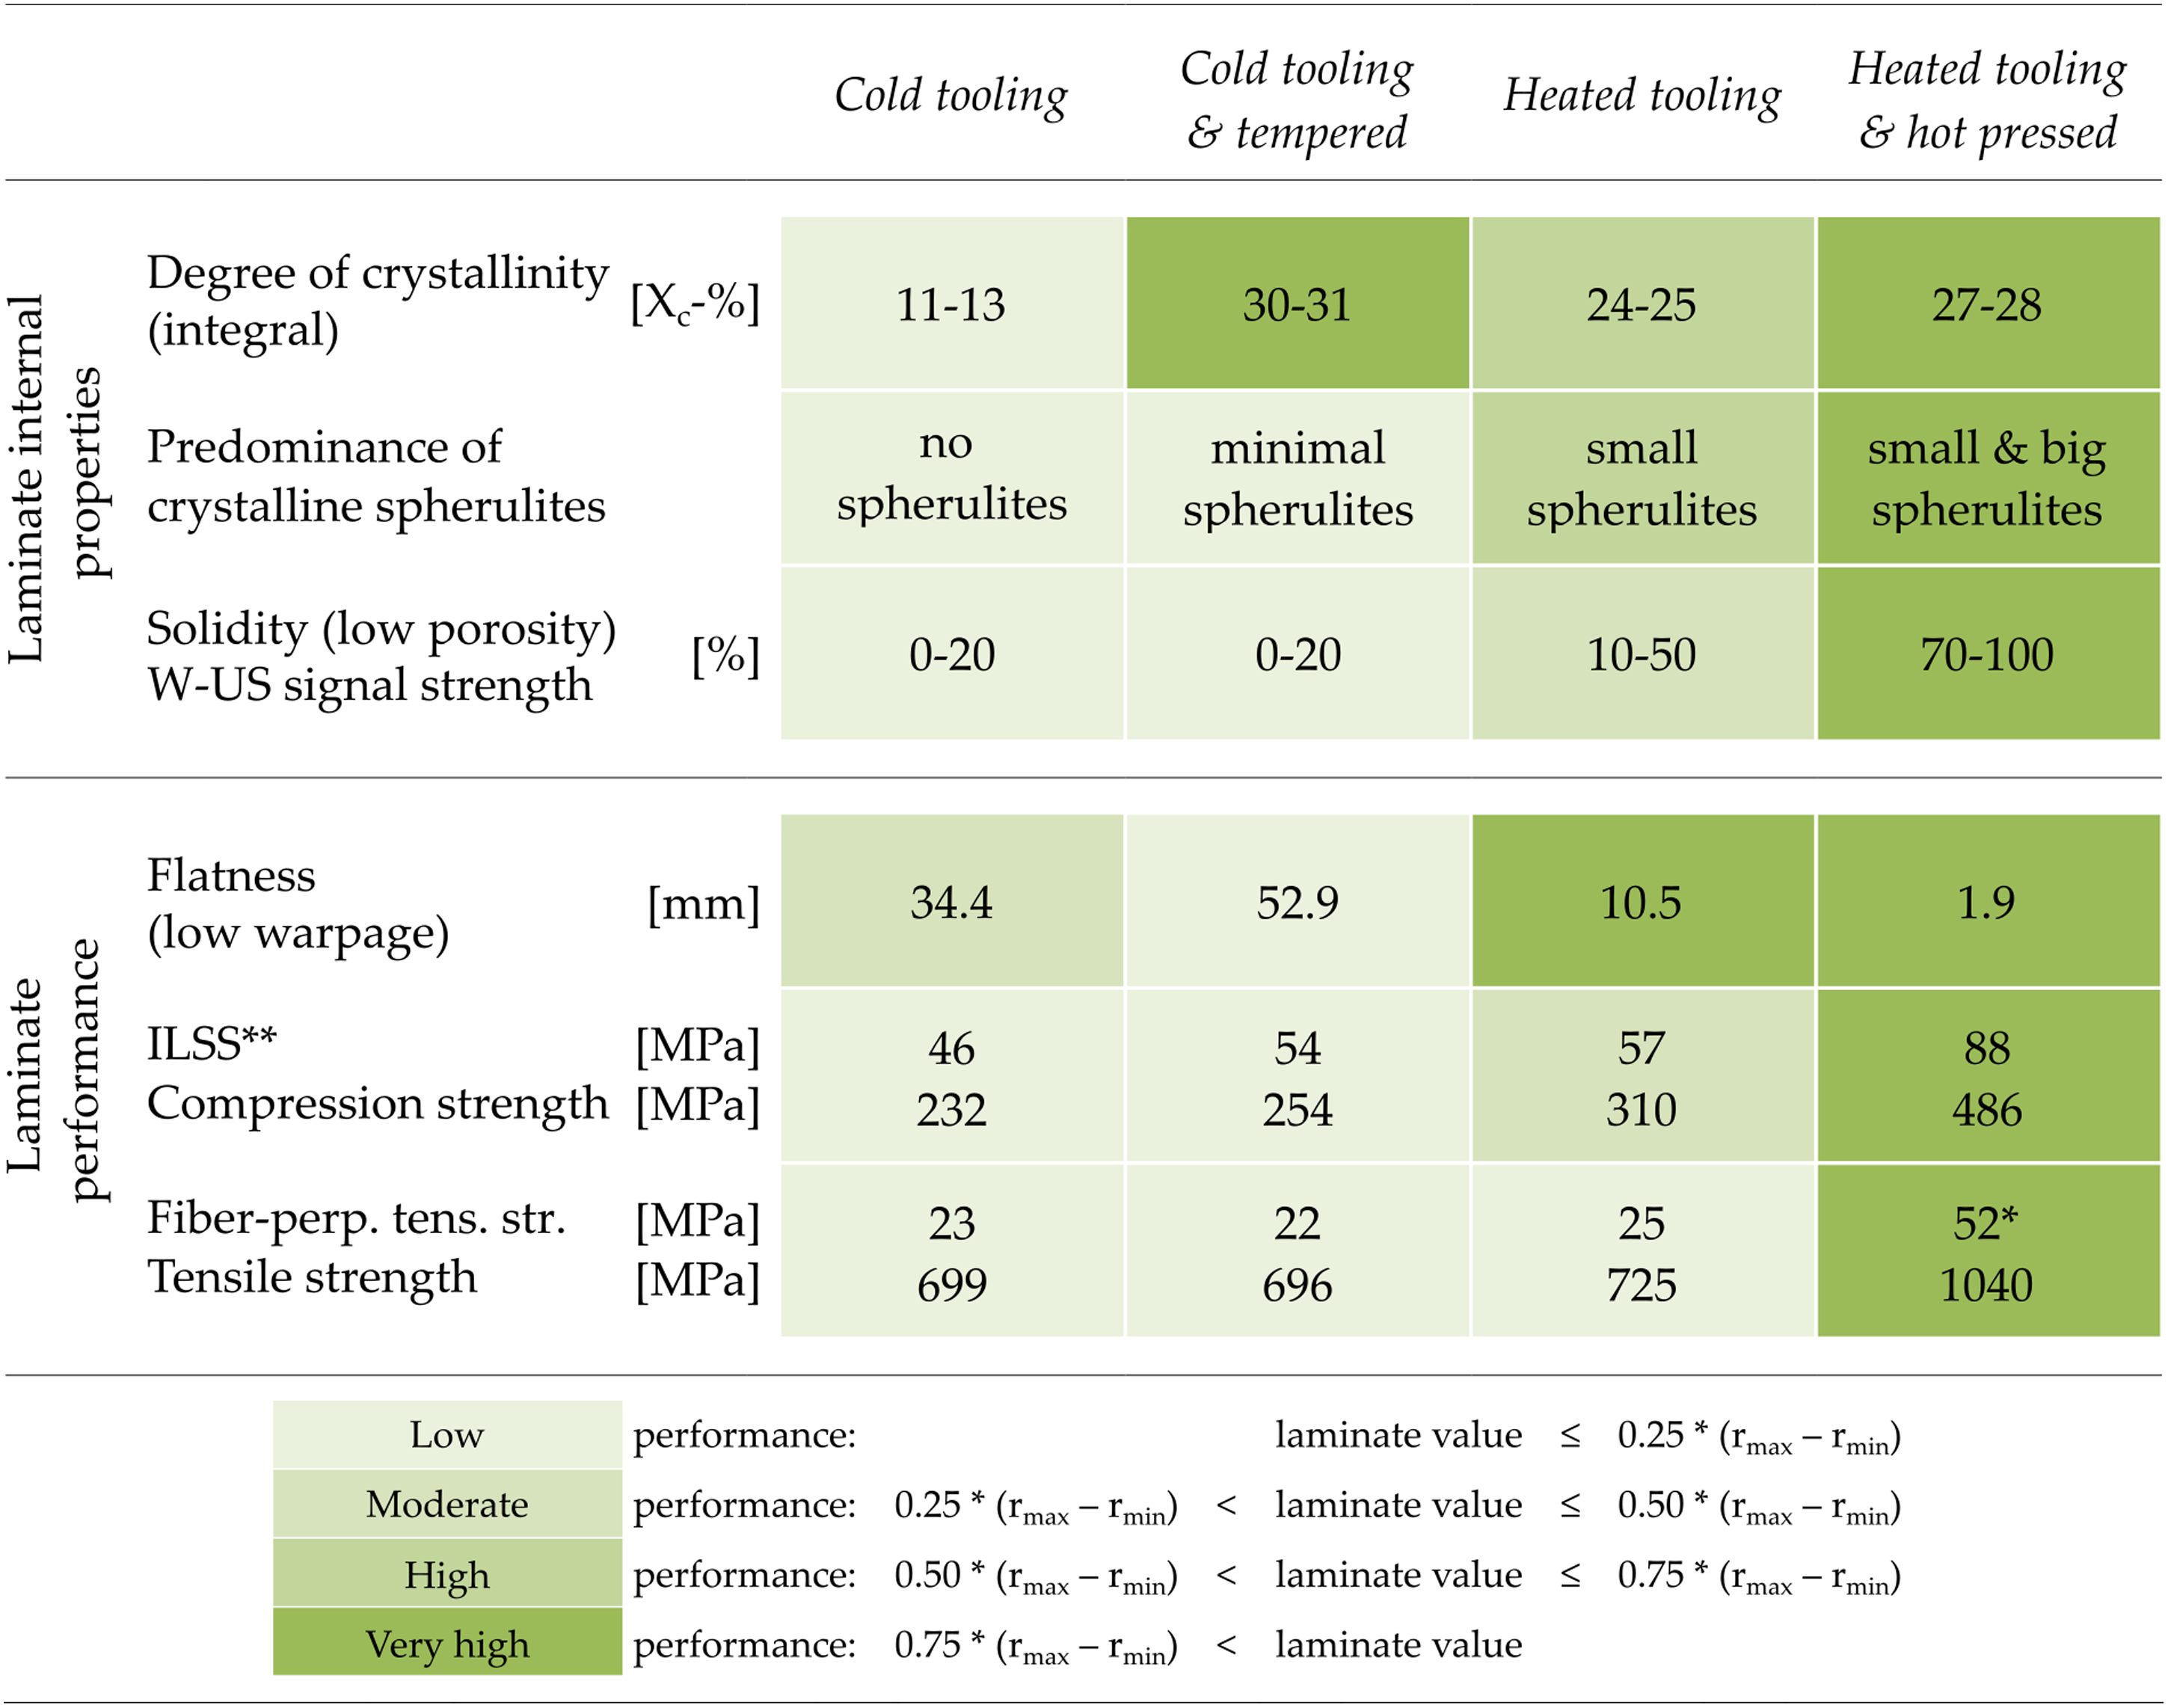
An increase of the tooling temperature from 20°C (cold tooling) to 200°C (hot tooling) resulted in an overall improvement of laminate quality. The DSC results display an increase in the bulk crystallinity, from 11 % to 24 %, by using the heated tooling, and the SEM measurement corroborate an increasingly crystalline microstructure, including small spherulites, in the polymer matrix for the higher tool temperature. Laminates produced with a cold tooling display almost no or very few areas with crystallites in the matrix for the UD and QI layups, respectively. The W-US images show high attenuation for both in-situ AFP-manufactured laminates, whereby the image of the heated tooling laminate indicates somewhat less porosity. The CT scans confirm the presence of pores for both laminates. For the cold tooling configuration, the big pores at the topmost layer are conspicuous and need to be investigated in further CT scans. The large delaminations in the heated tooling laminate show insufficient bonding between the layers, but could not be related to any noticeable problems within the manufacturing process. Measured (fiber-perpendicular) tensile strength values were slightly higher (+8.7 % and +4.2 %) for the heated tooling compared to the cold tooling conditions. The improvement of the mechanical performance through the raise of the tooling temperature is higher for the ILSS (+24 %) and compression strength (+34 %). Also, a clear advantage of the heated tooling layup is found in the peak warpage reduction (–69.5 %) compared to the cold tooling layup.
The DSC measurements showed a substantial increase in crystallinity to the maximum of approximately 30 % following the tempering cycle. Previous findings of the authors showed a close relation between bulk crystallinity and single lap shear strength of the tested CF/LM-PAEK specimens. 14 The mechanical test results in this study however showed only a low strength increase on coupon level through additional tempering. Though the interlaminar shear strength showed a significant increase of 15 %, tensile strength, both in fiber direction and perpendicular to the fiber direction, remained on the same level. Compression strength increased only slightly (+9.5 %). The W-US scans neither show an improvement nor a deterioration through tempering of the cold tooling laminate. Also, the CT scans do not show a significant difference regarding the number of pores. The vertical cracks which appear to the same extent in the tempered and heated tooling laminates are thought to be the result of internal stresses overcoming the fracture toughness of the matrix on a very local scale. As these cracks are very spontaneous and irregular in their occurrence, the definition of a methodology through which to accurately track them is difficult. This development of such a tool will be the subject of future work. Both laminates which were manufactured on a cold tooling present a similar density of large inter- and intralaminar pores and a very similar mechanical strength in all of the conducted mechanical tests. Therefore, a clear correlation between crystallinity and mechanical strength as it was proven for example for CF/PEEK 30 cannot be concluded here. The results of the SEM investigation, as well as the DSC results, indicate a significant increase in crystallinity through the tempering process compared to laminates produced with cold tooling only. A closer look into the microscopic structure of the matrix highlights the high amount of lamellar crystallized areas but no predominance of crystalline spherulites. This leads to the assumption that not only the integral value of the degree of crystallinity is a decisive factor for higher mechanical performance but rather the predominance of crystalline spherulites. The geometry of the panels before the tempering cycle is not perfectly flat, due to the inhomogeneous thermal history introduced by the AFP process. The geometry of the panels was subsequently affected by the volume shrink during the tempering cycle. The volume shrinkage can be traced back to the mechanism of crystallization of the thermoplastic matrix, through which the internal stresses in the laminate are increased due to the non-uniform changes in the matrix density. The warpage of the QI panel thus also increased, raising (+53.8 %) the initial deformation from a reference plane after the tempering cycle.
The hot pressing of the laminates increased the performance in all investigated properties. While for all in-situ AFP-manufactured laminates within this study high porosity resulted in poor W-US scans, a clear back wall signal and no porosity was detected for the hot pressed laminate. Different prepreg tape material processed at the lab using in-situ AFP resulted in good consolidation and W-US results with clear backwall signal. 35 This might indicate that there are more suitable tape materials for the in-situ AFP process than the investigated material. The intralaminar pores in the as delivered tape material visualised in the CT analysis are significant and cannot be mitigated by the in-situ AFP process. The processing of tape placement does not eliminate these intralaminar pores. Moreover, the tape placement process additionally introduces interlaminar porosity in the fusion zone between two plies. This is for all tape placed laminates: cold tooling, cold tooling & tempered and heated tooling. Solely with the additional process step of hot pressing non-porous laminate specimens with no delamination could be produced. The origin of the matrix rich “lines” in the CT images could not be clarified yet. The degree of crystallinity was increased by the additional press consolidation step. Although the DSC results indicate a slightly lower degree of crystallinity for the laminates produced with heated tooling & hot pressed configurations compared to tempered laminates, the mechanical strength of the additionally press consolidated specimen is significantly higher in every investigated mechanical test. This leads to the assumption that not only the final degree of crystallinity is important for a good mechanical performance but particularly the structure of the crystallized areas. Large spherulites are present in the polymer matrix of the hot pressed laminate. These large spherulites are able to form due to a uniform melting of the LM-PAEK matrix and subsequent slow cooling rate compared to very high cooling rates of AFP. In the literature other work has shown crystallinity to be highly influential,14,30 so it is likely this effect cannot be observed unless the bond quality is sufficient. Therefore, either the decreasing density of large pores, the presence of large spherulites, or a combination of both seems to be responsible for the increase in mechanical strength. The significantly reduced warpage (-81.9 %) due to the pressing of the heated tooling panel is expected due to the uniform melting of the polymer matrix during the hot press process and thus the relaxation of residual stresses as the polymer chains move freely in their molten phase. Uniform, slow cooling then ensures homogenous crystallization and minimal deviations from the centric reference plane.
Conclusions and outlook
This work presents an extensive study into mechanical and thermal properties, as well as the microstructure of CF/LM-PAEK laminates manufactured using in-situ AFP. A heated tooling configuration during the AFP-process and the post manufacturing processes tempering and hot pressing were investigated with regard to their impact on the laminate properties compared to the cold tooling reference. Post-manufacturing tempering resulted in the highest crystallinity of approximately 30 % but produced only very small improvements in mechanical strength and led to an increase (+53.8 %) of the AFP-induced warpage. The heated tooling configuration produced the best in-situ AFP strength results improving ILSS by 24 % and compression strength by 34% as compared to the cold tooling configuration. A predominance of crystalline spherulites has a more positive influence on the matrix dominant properties compared to the mere increase of the degree of crystallinity. Therefore, a heated tooling, if feasible, is preferred to a post process tempering cycle. The characteristic values of the in-situ manufactured laminates are, however, lower than the values of the additionally press consolidated laminate, indicating that there is still work to be done to close the gap between press and AFP manufacturing. However, given the time- and cost advantage of in-situ manufacturing and the ability to manufacture larger structures, applications for in-situ AFP are still possible. The gap could be further closed by improving the raw tape material quality which was insufficient regarding the high intralaminar porosity in this study. Also, other prepreg materials with a more resin-rich surface might be better suited for in-situ AFP, reducing the interlaminar porosity and improving the bond quality. An investigation into such materials is presented in Part 2 of this study. One result of the work presented here is that the porosity within the laminate, particularly the distribution between the intralaminar and interlaminar regions, has a significant impact on the overall mechanical performance of the laminate. While a detailed investigation and quantification of laminate porosity was not performed within the scope of this work, it features as a focal point for subsequent works which are also currently under review for publication and are expected to be accessible in the same calendar year as this work. Further investigations, especially regarding the size and distribution of large pores present in the laminates, are necessary in order to separately investigate the influence of pores and stages of crystallization in the thermoplastic polymer matrix on the resulting mechanical strength of CFRP laminates. It was shown that both, tempering and a heated tooling enable a large increase in crystallinity. If the porosity can be minimized, the mechanical strength is expected to increase and the potential of the CF-LM/PAEK material can be exploited.
Footnotes
Acknowledgement
Special thanks go to Isabelle Schmidt and Katrin Steidinger for performing the extensive DSC measurements, mechanical tests and microsection analysis, respectively as part of the project team at the DLR’s Institute of Structures and Design in Stuttgart. We would also like to thank our colleague Raouf Jemmali for his contributions in this research project who executed the CT analysis.
Author contributions
Ines Mössinger: conceptualisation, formal analysis, investigation, data curation, writing - original draft preparation; Lukas Raps: formal analysis, investigation, data curation, writing - review and editing; Daniel Fricke: formal analysis, data curation; Jonathan Freund: formal analysis, writing - review and editing; Miriam Löbbecke: formal analysis; Ashley R. Chadwick: writing - review and editing. All authors have read and agreed to the published version of the manuscript.
Declaration of conflicting interests
The author(s) declared no potential conflicts of interest with respect to the research, authorship, and/or publication of this article.
Funding
The author(s) disclosed receipt of the following financial support for the research, authorship, and/or publication of this article: This project has received funding from the Clean Sky 2 Joint Undertaking (JU) under grant agreement No 945583. The JU receives support from the European Union’s Horizon 2020 research and innovation programme and the Clean Sky 2 JU members other than the Union. This research is part of the project ICASUS (Integrated Cabin Airframe System Fuselage) including the MFFD (Multi-Functional Fuselage Demonstrator) and was financially supported by the European Commission through the Clean Sky 2 Joint Undertaking (JTI-CS2_CPW01-LPA-02-01).
Disclaimer
The results, opinions, conclusions, etc. presented in this work are those of the author(s) only and do not necessarily represent the position of the JU; the JU is not responsible for any use made of the information contained herein.
Data availability statement


|

|