
Abstract
Most of the research to date has focused on tailoring the interphase adhesion by controlling the degree of chemical bonding between fiber and resin. However, recent studies suggest that apart from chemical bonding, mechanical interlocking plays a crucial role to enhance the interphase thickness and hence the interfacial shear strength. In this study, the effect of textured carbon fiber surface on the interphase thickness, and interfacial shear strength has been studied and analyzed. The hot water was used to remove the epoxy-based sizing agent from the carbon fiber (sized CF) surface and thereby to create a textured surface morphology in de-sized one (De-sized CF). To study the distinctions of the interphase between sized and de-sized CF/PP composites, the Derjaguin-Muller-Toporov (DMT) modulus by Peak Force Quantitative Nano-Mechanics (PF-QNM) was applied to determine the interphase thickness and its nanomechanical properties. It was found that no chemical changes occurred after hot water treatment albeit the surface morphology of de-sized carbon fiber became textured. The average interphase thickness in de-sized CF/PP composites was found to be 84.17% higher (212.9 ± 21 nm) as compared to 115.6 ± 21 nm in sized CF/PP composites. This study shows the potential for using mechanical interlocking effects without significantly affecting the chemical bonding, to improve the interphase thickness in fiber reinforced composites.
Keywords
Introduction
In fiber-reinforced polymer composites, a region differentiating the fibers from the bulk polymer is of great significance for better mechanical performance. This region was initially known as interface, however, now it is most often viewed as an interphase region due to its 3D heterogeneous nature.1,2 An interphase is a region which does not have a clear boundary and it possesses neither the properties of fiber nor the resin but somewhat distinctive from both as shown in Figure 1. Therefore, the nanomechanical properties of this region are of great interest for in-depth analysis of the polymer composites. Various physical and chemical properties of the fibers’ surface influence the overall mechanical properties of the composites.3,4 Generally, the fibers are coated with a sizing agent to enhance their chemical interaction with the resin. The potential drawback of the coating the fibers with sizing material to enhance the interfacial properties is that often micrometer sized coatings are required to achieve meaningful improvements, significantly increasing the effective diameter of the fiber. Schematic diagram of the interphase region.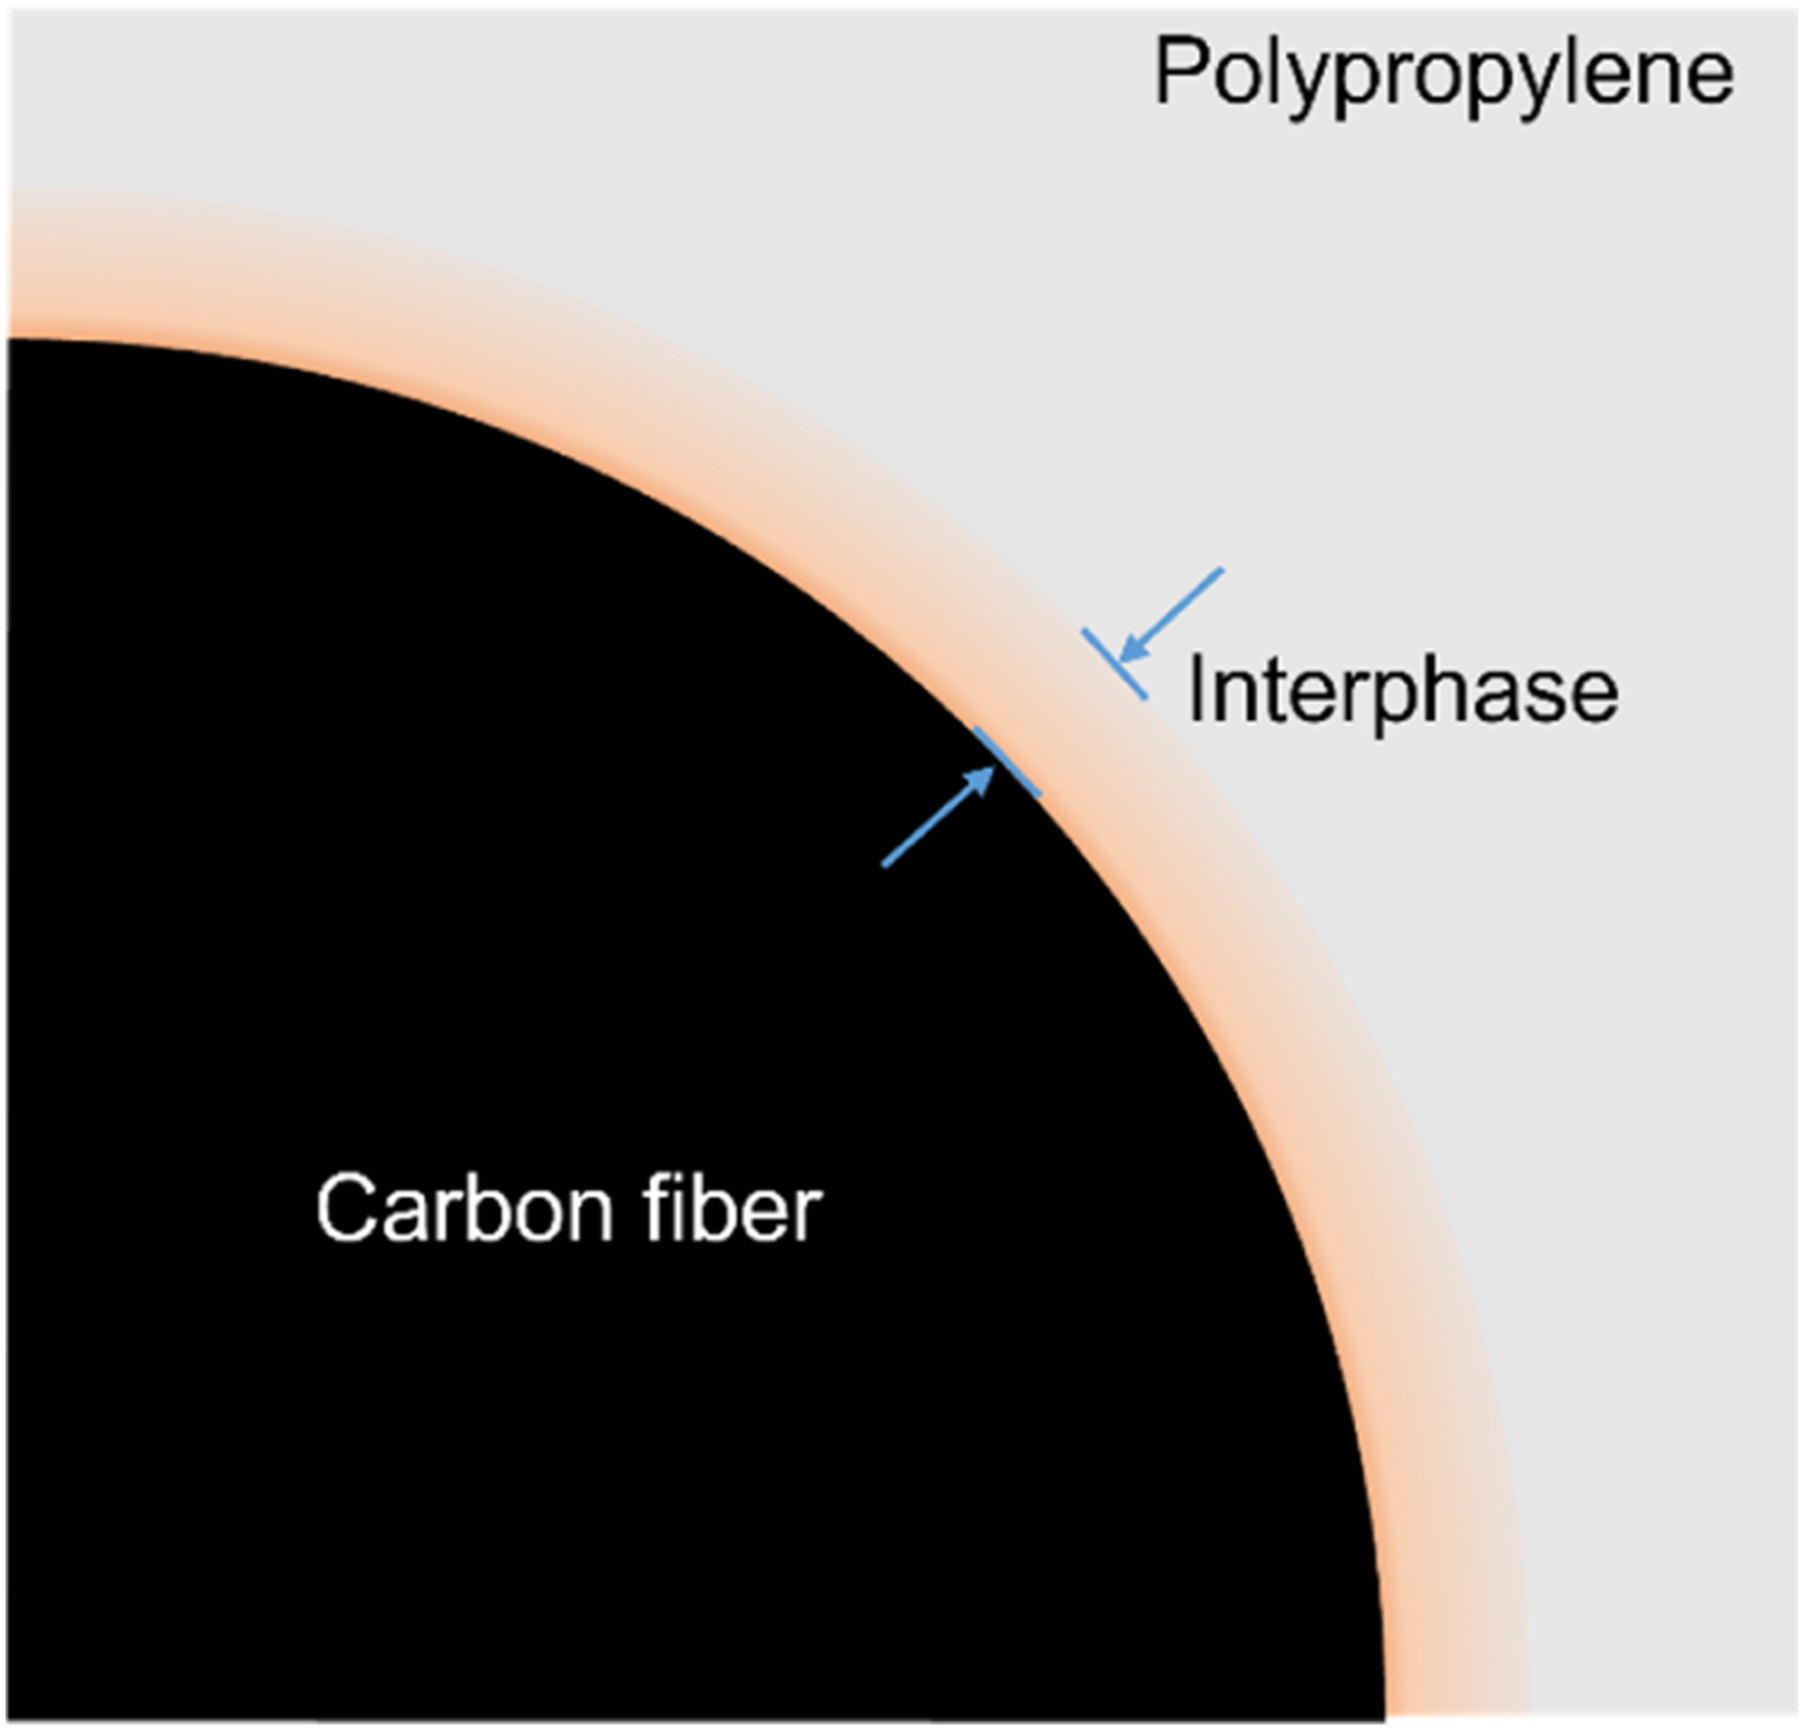
Another strategy for improving mechanical properties is to modify the interphase by improving the mechanical interlock between the filler and the matrix.3,4 The most often used strategies for creating mechanical interlocking in the literature have been discovered to be changing the end-shape of the fiber or altering the fiber surface morphology. Wetherhold et al.5,6 reported that improvement in composite fracture toughness can be achieved (46%) by using short ductile fibers with shaped ends, utilizing the plastic work potential of the fiber volume through the anchoring of the fiber end into the matrix. In civil engineering applications, the surface of steel reinforcing bars (rebar) with varying patterns is utilized to achieve mechanical interlocking with a concrete matrix. This methodology is very effective in providing an order of magnitude increase in pull-out strength of the rebar and a four-fold improvement in energy absorption of cured concrete. 7 Considering the fiber as a rebar, modifying the fiber’s surface morphology is considered a practical means to enhance the mechanical interlocking effect between the fiber and a polymeric matrix.
Several authors have studied the relationship among the interphase thickness, interfacial shear strength, and the overall strength of the composite.8–10 The nanofiller/polymer interfacial layer thickness is significant because it is directly linked to the degree of the interfacial interaction.11,12 For example, X. Gao et. al 4 studied the effects of mechanical interlocking, in addition to chemical bonding on the strength and energy absorption of glass fiber/epoxy interphase, by creating texture on the fiber surface through the phase separation of silane blends. Dynamic mechanical measurements and tensile testing of composites showed that the presence of compatibilizing agents enhanced stress transfer and increased interphase thickness considerably. Adhesion measurements revealed a proportional relationship between interphase thickness and peel strength, indicating the considerable contribution of entanglements to the interfacial adhesion in these composite systems. The examination of failure surfaces showed that failure mode propagates through the textured interphase in a more tortuous path, which resulted in greater degree of energy absorption during fiber–matrix pullout. In fact, a lot of research work is present on the interfacial interaction between the carbon fiber and thermosetting resins. However, only fewer studies are reported in the literature about the interfacial interaction between carbon fiber and thermoplastic resin such as PP due to the poor interface caused by the inert nature of the carbon fiber and thermoplastic resins. Ozan Eratsin et. al. 13 investigated the effect of the initiator concentration of the thermoset resin-initiator mixture on the interphase thickness of co-bonded thermoset-thermoplastic polymers. The study showed that the gelation time decreases as the initiator concentration increases. This decrease leads to a significant reduction in both interphase thickness and diffusivity. For instance, increasing the initiator/resin weight ratio from 1% to 3% reduces the gelation time by 74% and the interphase thickness by 63%. The interphase thickness and its DMT modulus can be determined from the AFM tests data. Although different numerical and experimental approaches have been used to determine the interfacial properties in the FRP composites, the studies on effect of surface morphology on the interphase thickness are still quite limited.14,15
In the present study, the carbon fibers were de-sized by using hot-water treatment methods to study the influence of surface morphology on the nanomechanical properties. Two kinds of carbon fiber reinforced polypropylene composites (CF/PP) were manufactured by using the Direct Fiber Feeding Injection Molding (DFFIM) technology: one with sized carbon fibers (epoxy sizing as received from the company) and another with de-sized carbon fibers. No previous study has investigated the relationship between the interphase thickness and nanomechanical properties in the sized and de-sized CF/PP composites. Herein, the DMT modulus map of the cross-section surface in both, sized and de-sized carbon fiber reinforced polypropylene composites by the PF-QNM was investigated, which provided a new way and distinct information to understand the interphase.
Materials and method
The present study evaluated the interfacial characteristics of injection molded CF/PP composites. The PAN-based carbon fibers were supplied by Zhongfu Shenying (trade name: SYT45S, 12K, diameter; 7 m, epoxy coating) and the polypropylene pellets were supplied by Shanghai SECCO Petrochemical Co., Ltd (melt flow rate; 12 g/10 min, melting temperature; 147°C, nominal strain at tensile fracture; 620%). The carbon fibers were passed through hot water bath (at 0.8 ms−1 speed) to remove the sizing agent (to create a textured surface) from their surface and collected at the other end. This hot water treated carbon fibers were named as “de-sized” carbon fibers. The “sized” carbon fibers represent the carbon fibers with a sizing agent (epoxy) coated on their surface that is, as received from the company. Two different kinds of composites, that is, sized, and de-sized CF/PP composites were prepared by the Direct Fiber Feeding Injection Molding (DFFIM) technology. The carbon fiber content for both sized and de-sized CF/PP composites was fixed at 20% by weight. The manufacturing parameters like molding temperature, barrel speed, and feeding rate were kept constant. Further information about the material properties, and de-sizing process etc. has been reported in detail in pervious study. 16
Sample preparation to determine the interphase properties
The injection molded dumbbell specimens were cut from the middle and the obtained rectangular bars were placed vertically in a box filled with an epoxy resin. The resin was cured, and the molded specimens were taken out from the mold. The molded specimens were cut into rectangular shape as shown in Figure 2(a). These cured specimens had fibers orienting along the upright axis perpendicular to the top and bottom surfaces. The top surface of the samples was polished with 800, 1200 and 1500 grit SiC papers and polished with 0.5 and 0.05 μm alumina oxide suspension on an automatic polish-grinding machine (Struers, Tegramin). The polished specimens were cleaned with distilled water and dried at room temperature for 48 h. Representative surface area of the polished CF/PP specimen (a) and interphase thickness measurement at different points across the fiber region (b).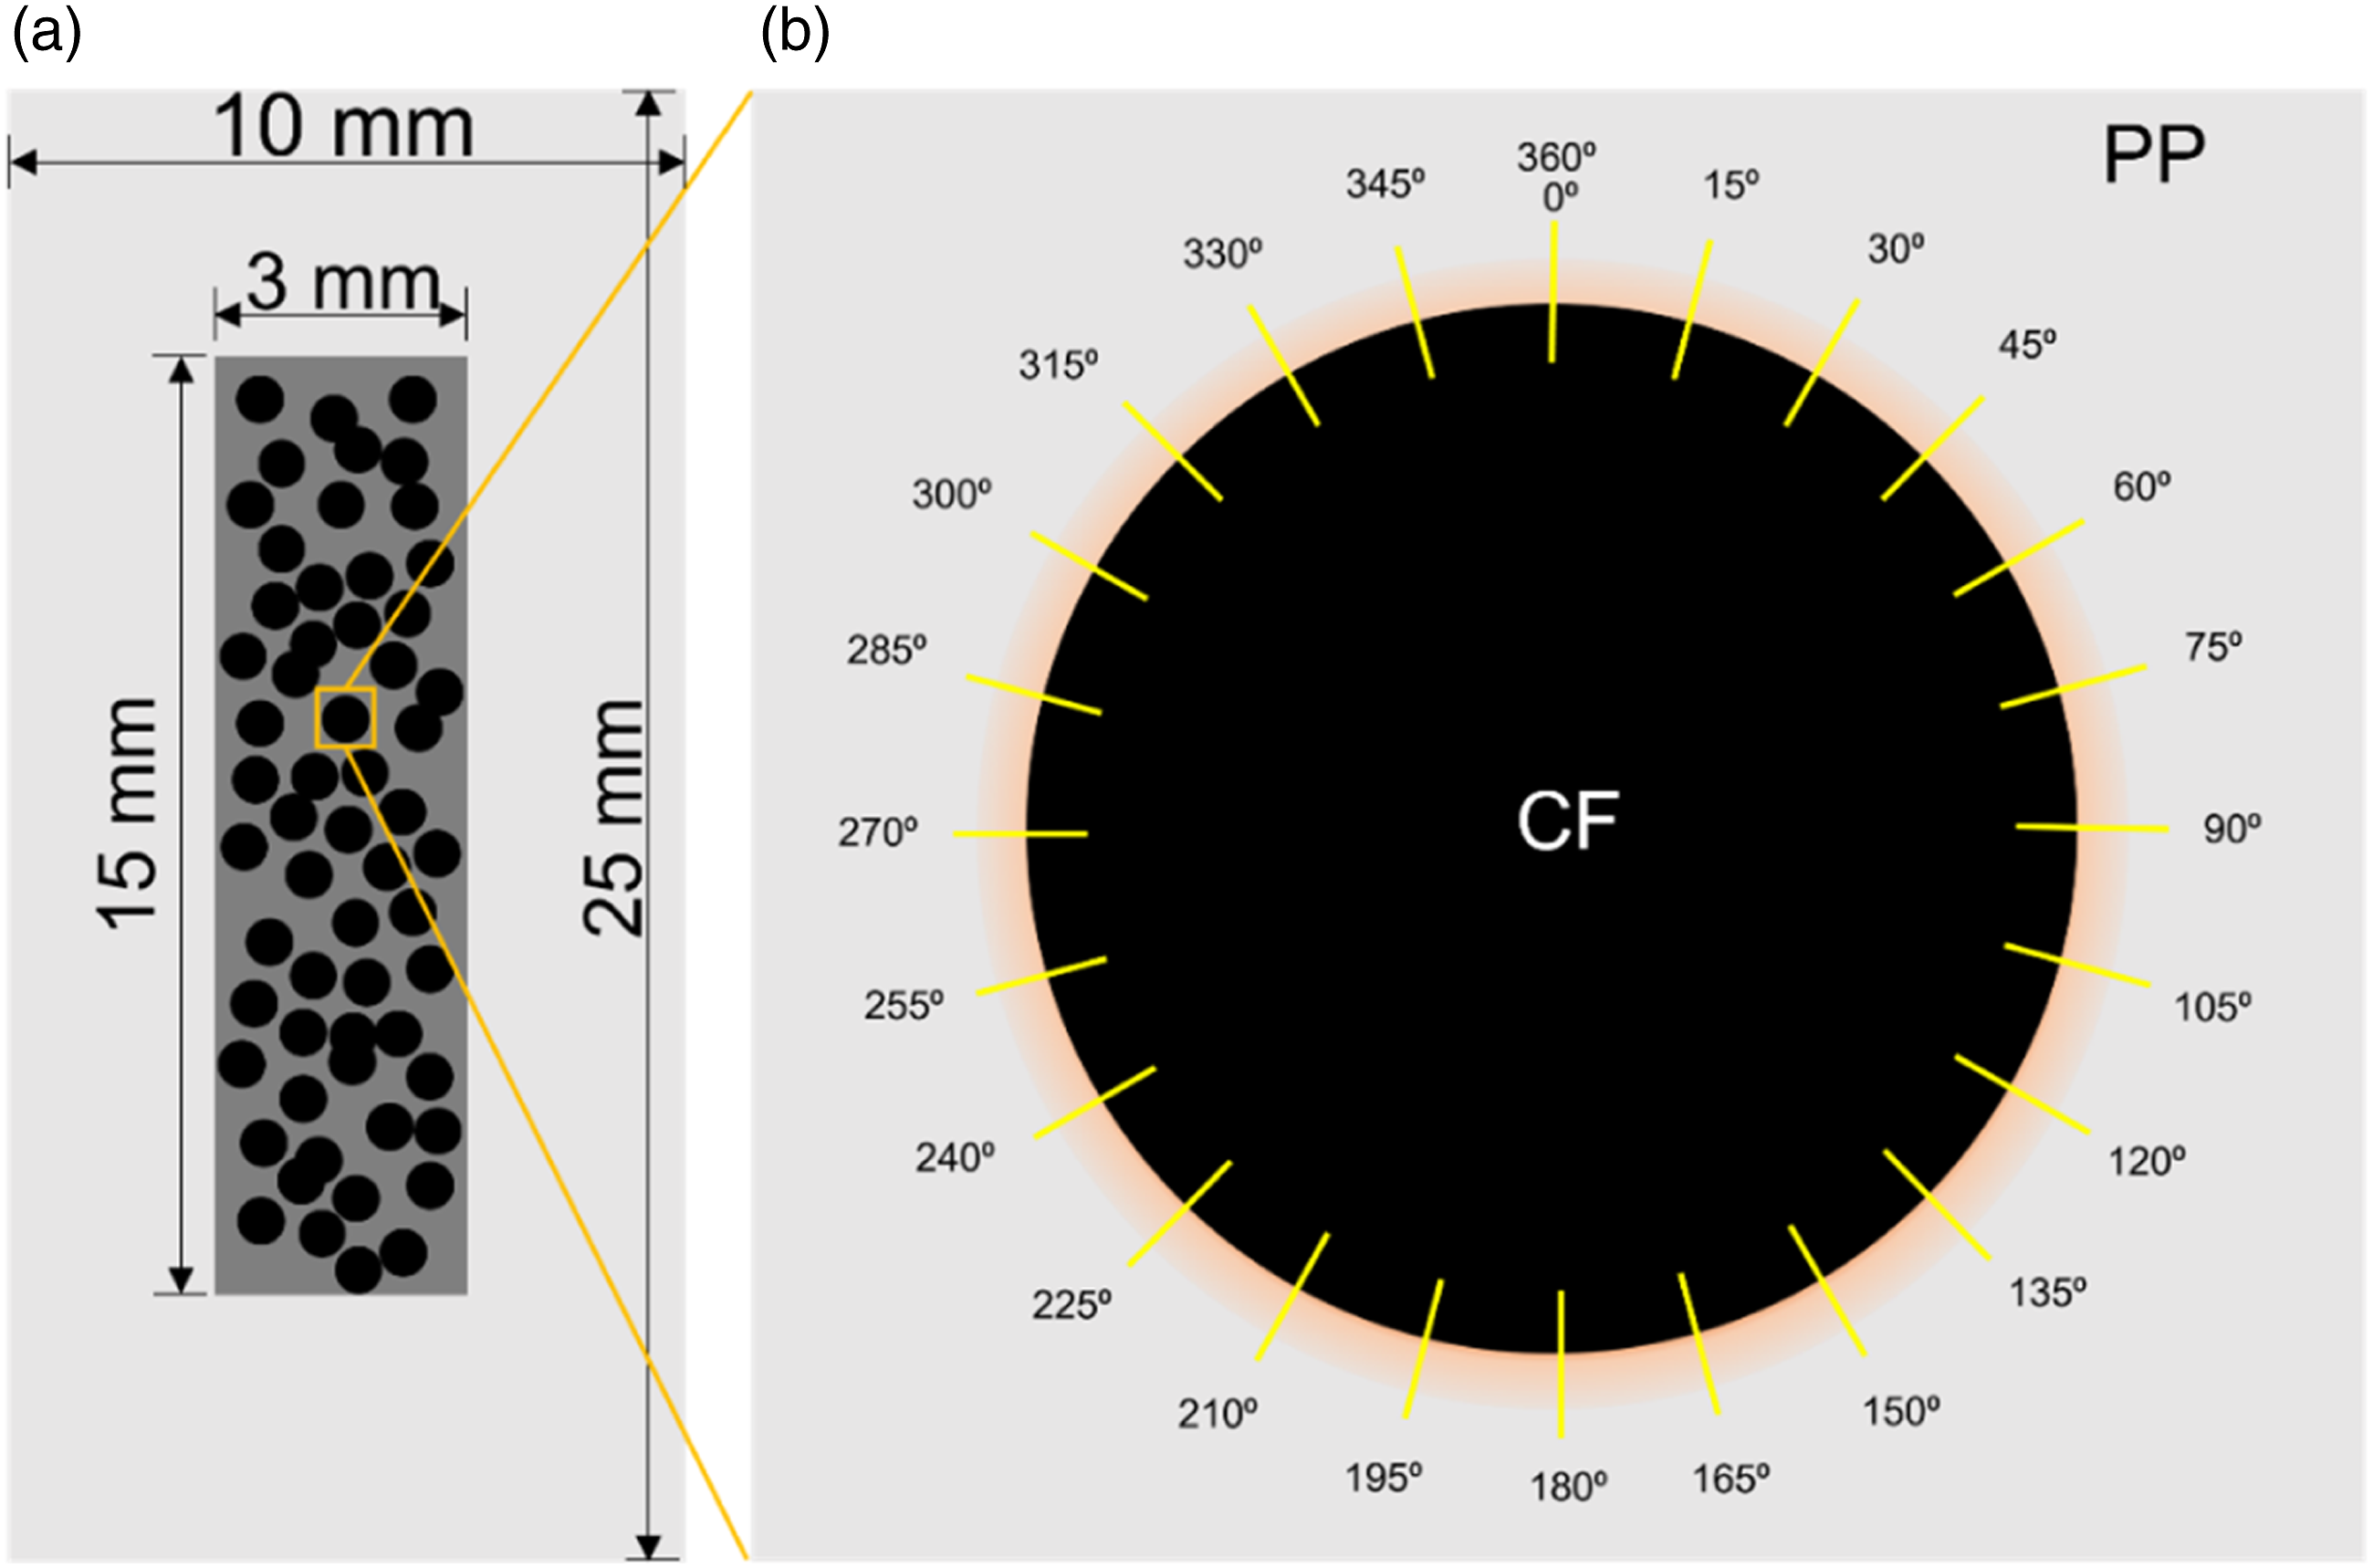
Peak Force Quantitative Nano-mechanics (PF-QNM)
After specimen’s preparation, the interphase thickness and other nanomechanical properties of the sized and de-sized CF/PP composites were studied. The nanomechanical mapping technique was operated in Peak Force Quantitative Nano mechanics (PF-QNM) mode on a Bruker Dimension R IconTM AFM machine. The machine could map the modulus of the cross-section surface by analyzing force-separation curves simultaneously with topographic imaging.
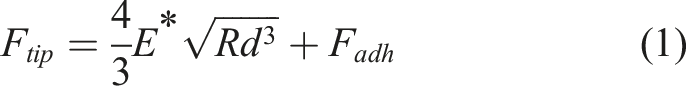
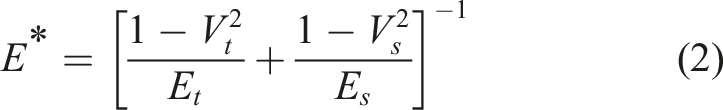
The force applied on the probe is determined by the spring constant and deflection of the cantilever. In approaching mode, the probing tip contacts the specimen surface, and retracted back once the applied force reaches to its maximum that is, peak force. In retraction mode, the probe withdraws with an adhesion effect. The corresponding modulus is calculated by the Derjaguin-Muller-Toporov (DMT) model to fit the retraction curve before the tip is detached from the sample surface suddenly.17,18 The slope of the retraction curve in the contact region is related to the corresponding modulus. The equation of the DMT contact mechanics model is given by equation (1).
The post-scan data was analyzed in NanoScope Analysis v.3 software. To find out the interphase thickness and other nanomechanical properties at various points across the cross-section (360°), multiple lines were drawn at the interphase region, each with 15° interval as shown in Figure 2(b). The interphase thickness data obtained at each angle was recorded and analyzed in detail.
Roughness analysis of the cross-section surface of sized and de-sized CF/PP composites
The topography of a specimen can significantly influence the actual test results at nano level. Therefore, the roughness analysis for sized and de-sized CF/PP composite specimens was carried out by the PF-QNM technique. Both kind of specimens had a Z-range of 40-90 nm, RMS roughness (R
q
) of 2-19 nm and a mean roughness (R
a
) of 2-19 nm, which is an acceptable surface morphology for nanomechanical indentation analysis.19,20 A typical PF-QNM height image of the CF/PP composite specimen is shown in Figure 3(a), which highlights different color contrast with respect to the variation in surface height. The carbon fiber can be seen as black color on the left side of the image and the polypropylene resin can be identified as the dark brown color on the right side of the image. A trace line was drawn from polypropylene resin towards the carbon fiber at an arbitrary point and its representative height diagram is shown in Figure 3(b). A sharp decline in the curve indicates the interphase region which is discussed below in detail. A typical PF-QNM height image of the CF/PP specimen (a) the respective height-position graph of the height image (b).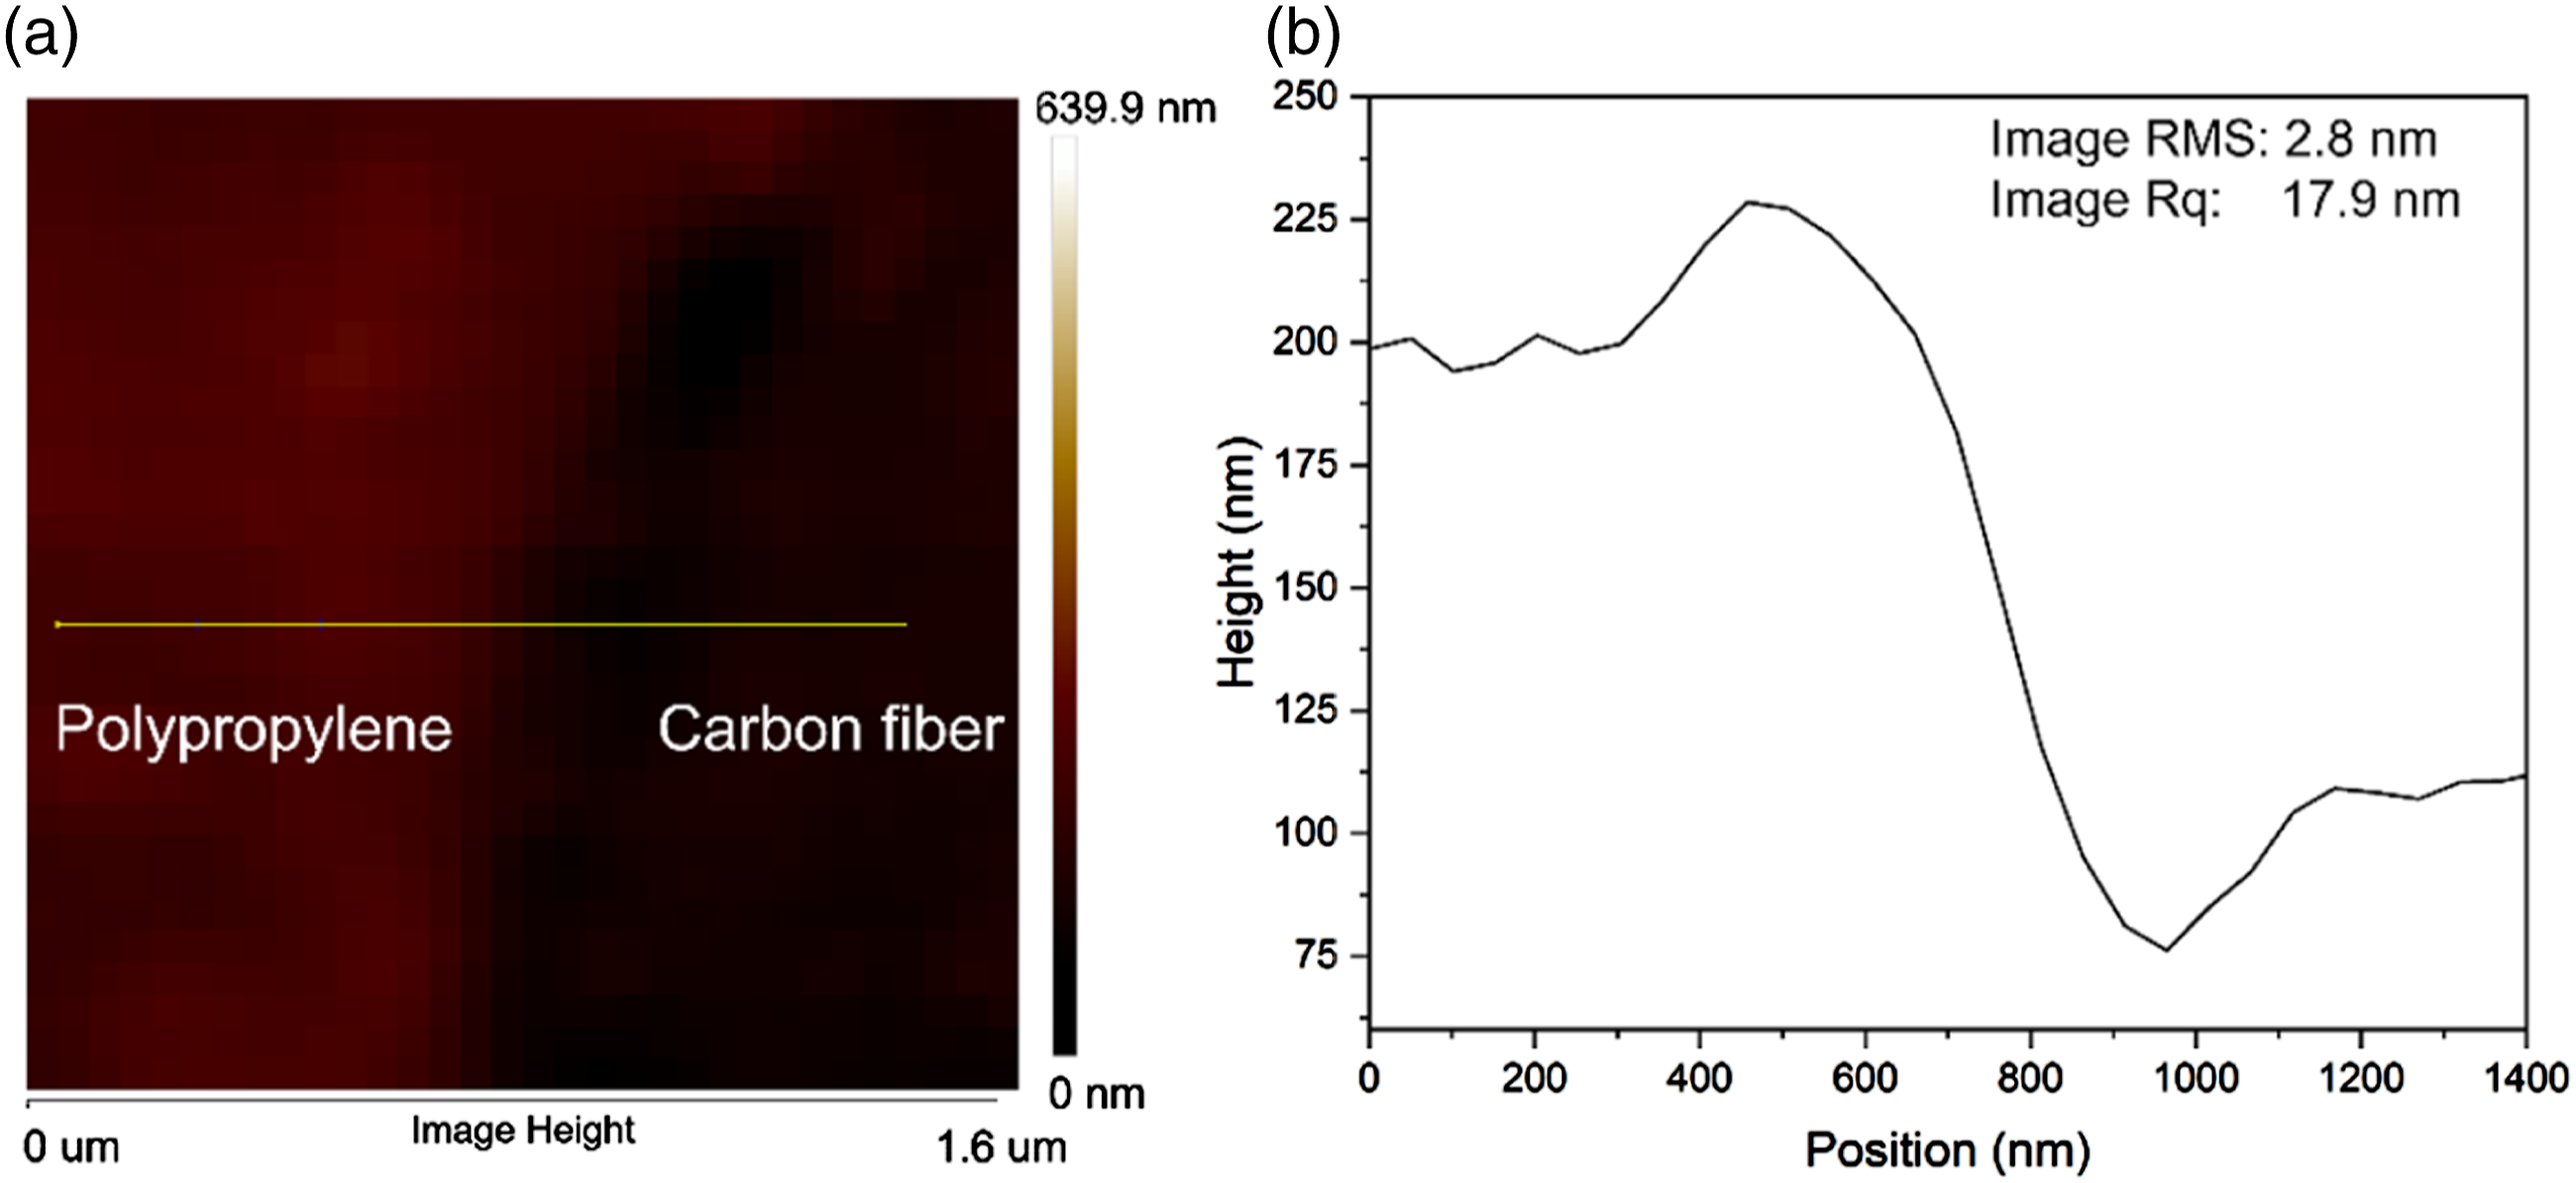
Physiochemical characterization of sized and de-sized carbon fibers
The physical characterization of the sized and de-sized CFs was done from the SEM and AFM images in a previous study. 21 It was observed that the de-sized carbon fibers had a textured surface area which was caused by the partial removal of sizing agent from the carbon fiber surface. The longitudinal groovy patterns were found on de-sized carbon fiber surface which possibly represent the PAN precursors. It can be said that the hot-water treatment did not remove all sizing agent from the carbon fiber surface. Similarly, the chemical characterization of the sized and de-sized CFs was also carried out by performing the FTIR (Nicolet 6700) and XPS (Model: ESCLAB 250Xi) analysis. The FTIR and XPS spectra of sized and de-sized carbon fibers was also performed in a previous study. 21 The sized and de-sized carbon fibers showed adsorption peaks at 1632 cm−1, and 3443 cm−1 which can be attributed to H-O-H and -OH stretching mode, respectively. The adsorption peaks at 2923 cm−1 and 2852 cm−1 were attributed to the C-H stretching modes of -CH3 and – CH2, the bands at 1396 cm−1 and 1102 cm−1 corresponded to the bending and stretching vibrations of – O-, respectively. 22 Both samples showed distinct peaks at 284.5 eV and 532.7 eV, which are attributed to C1s and O1s, while the content of O and C in sized and de-sized carbon fibers are quite similar. Relatively weak peaks of N1s were also found in sized CFs, which might have risen from the residual nitrogen present in the fibers. No other major elements were detected from wide scan spectra on the surface of sized de-sized carbon fibers.
Evaluation of interfacial properties
Basic parameters required to evaluate the interfacial properties
Fiber orientation factor,
The fiber orientation factor is a numeric way to indicate the alignment of fibers across the whole cross section of a composite specimen. To find out the fiber orientation factor, the digital microscopy images were taken from the cross-section of the broken specimens followed by the tensile tests. The fractured tensile test specimens were embedded in epoxy resin for curing. Following the curing process, the specimens were polished using sandpapers of different coarseness, from rough to fine, in order to achieve a smooth surface. Subsequently, digital microscopy (Keyence, Model: VHX-5000) was utilized to examine the polished specimens. To ensure the precision of the results, carbon fibers were traced and marked manually in Adobe Photoshop. The schematic representation of the carbon fibers' different orientation in composite materials is shown in Figure 4(a). The cross-sectional area of the composite has carbon fibers in both circular and elliptical shapes. The circular fibers correspond to a fiber orientation angle of 0° (parallel to the melt flow direction), while the elliptical fibers indicate various angles with respect to the melt flow direction. In this study, all circular fibers were marked as “black dots”, and the major and minor axis of all elliptical fibers were marked in green and blue color in Adobe Photoshop as shown in Figure 4(b). The major and minor axis of all elliptical fibers were determined by using Fiji software. The orientation of carbon fibers across the cross-section of composite material (a) The measurement of the major and minor axis of fibers oriented at different angles other than 0⁰ (b).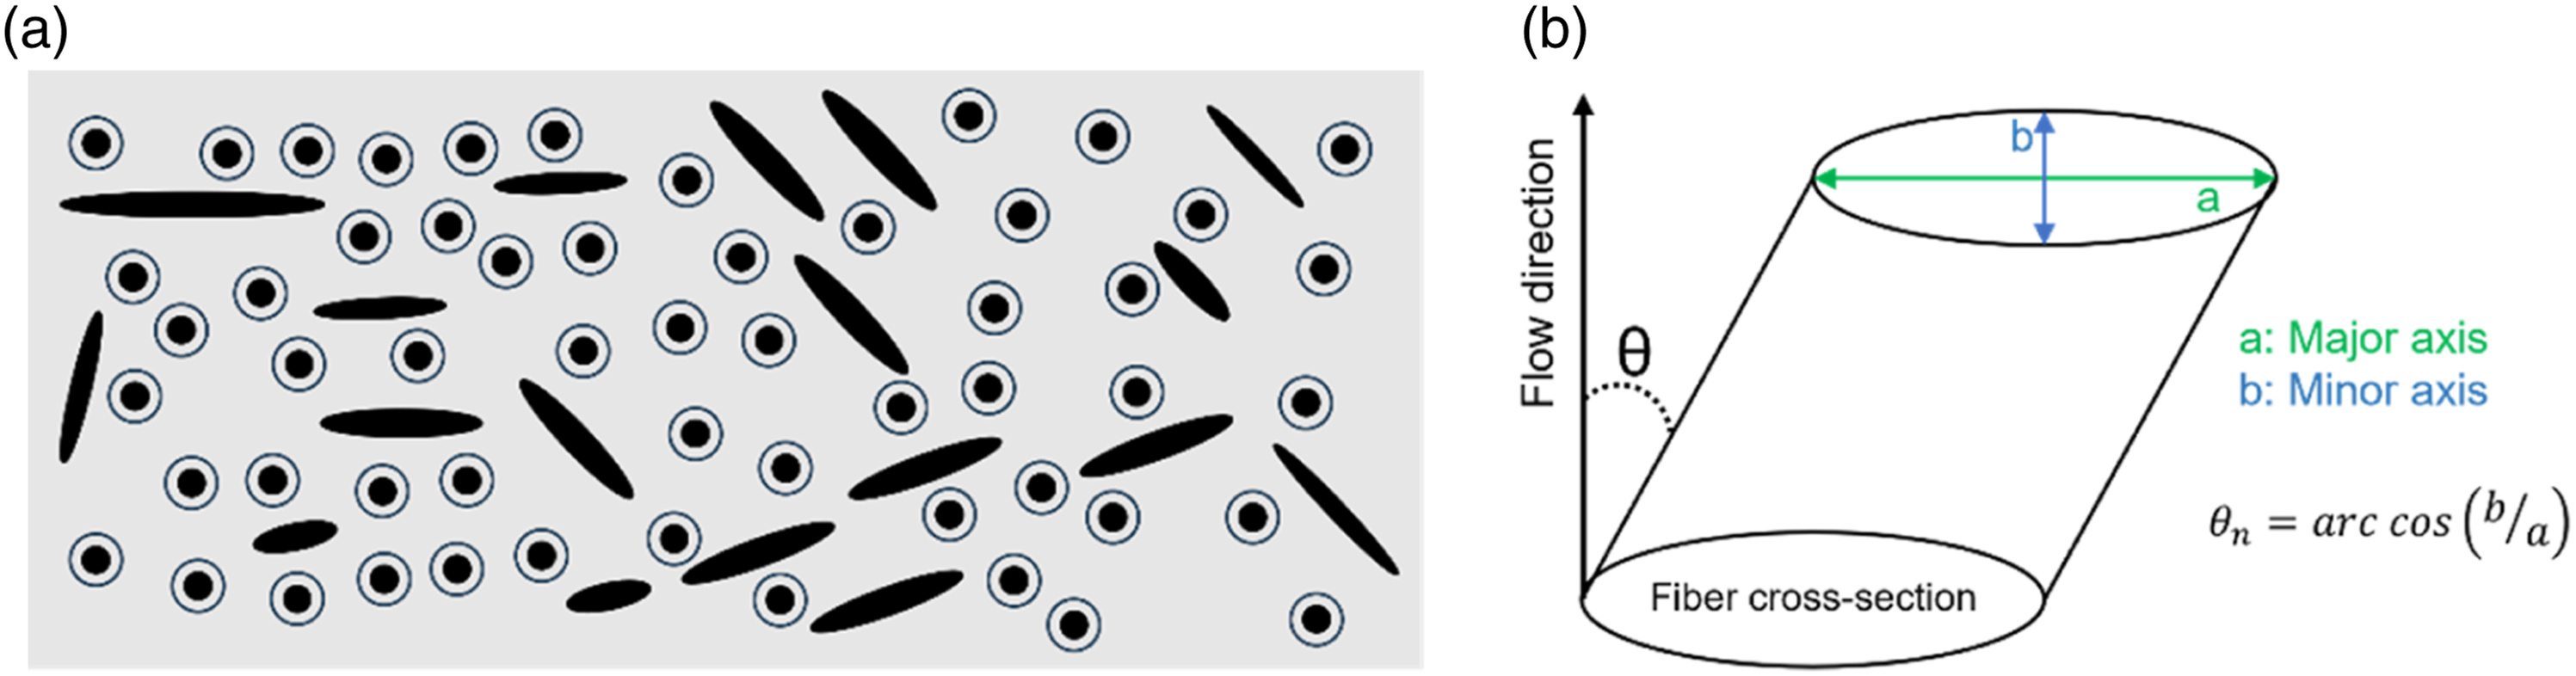
The fiber orientation angle,
The overall fiber orientation factor,

Fiber length,
The sized and de-sized CF/PP broken specimens followed by the tensile tests were cut into 2.5 cm long bars, placed in the crucible cups, and pyrolyzed in a muffle furnace at 380°C for 2 h. Polypropylene resin was burned out, leaving behind carbon fibres. To create a universal representation of the fibers across the entire cross section area, small pieces of carbon fiber were carefully picked up from different skin and core regions using tweezers and cast on to a glass plate. The distilled water was gently sprayed onto them with a medical syringe, so that the agglomerated fibers could be dispersed off. After that, the dispersed carbon fibers were placed in circular plates filled with the distilled water. The glass plates were tightly sealed with a plastic sheet and placed in the water bath of an ultrasonic machine (JAC, Model: KODO 4020) for sonication at 60°C for 2 h to further isolate the fibers from each other. After the sonication process, the plastic sheet was removed, and the glass plates were placed in an oven at 100°C for 2 h to dry out the water. After the water was dried off, the isolated carbon fibres were left at the bottom of the plate. An optical microscope was used to observe these fibers and their photographs were taken. Subsequently, these photos were processed in Fiji software and the length of almost 1200 fibers taken from three different samples (around 400 from each) of each type that is, sized, and de-sized was measured. Their weight-average fiber length, “
Fiber volume fraction
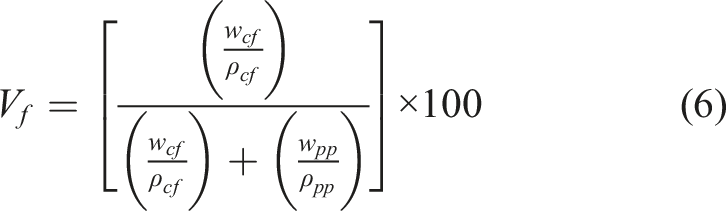
The fiber volume fraction,
Interfacial shear strength,
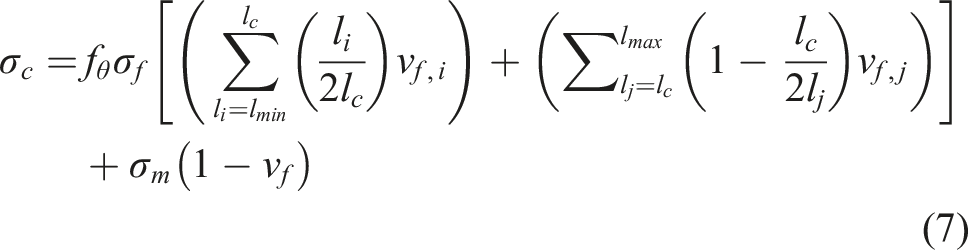
The interfacial shear strength of the sized and de-sized CF/PP composites can be calculated by using the famous Kelly-Tyson theory as shown in equation (7).
21
The critical fiber length, 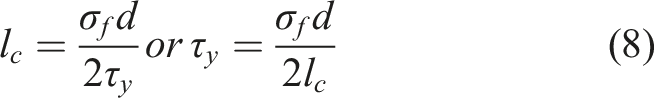
For simplification, the equation (7) can be segmented into different parts as follows.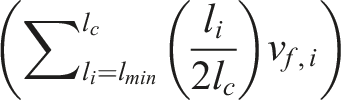
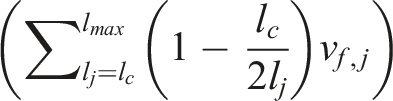
By replacing equation (7) with the above-mentioned notations, it can be rewritten as follows.
From this simplified equation, the interfacial shear strength, Step by step guide to calculate the interfacial shear strength of the sized and de-sized CF/PP composite materials.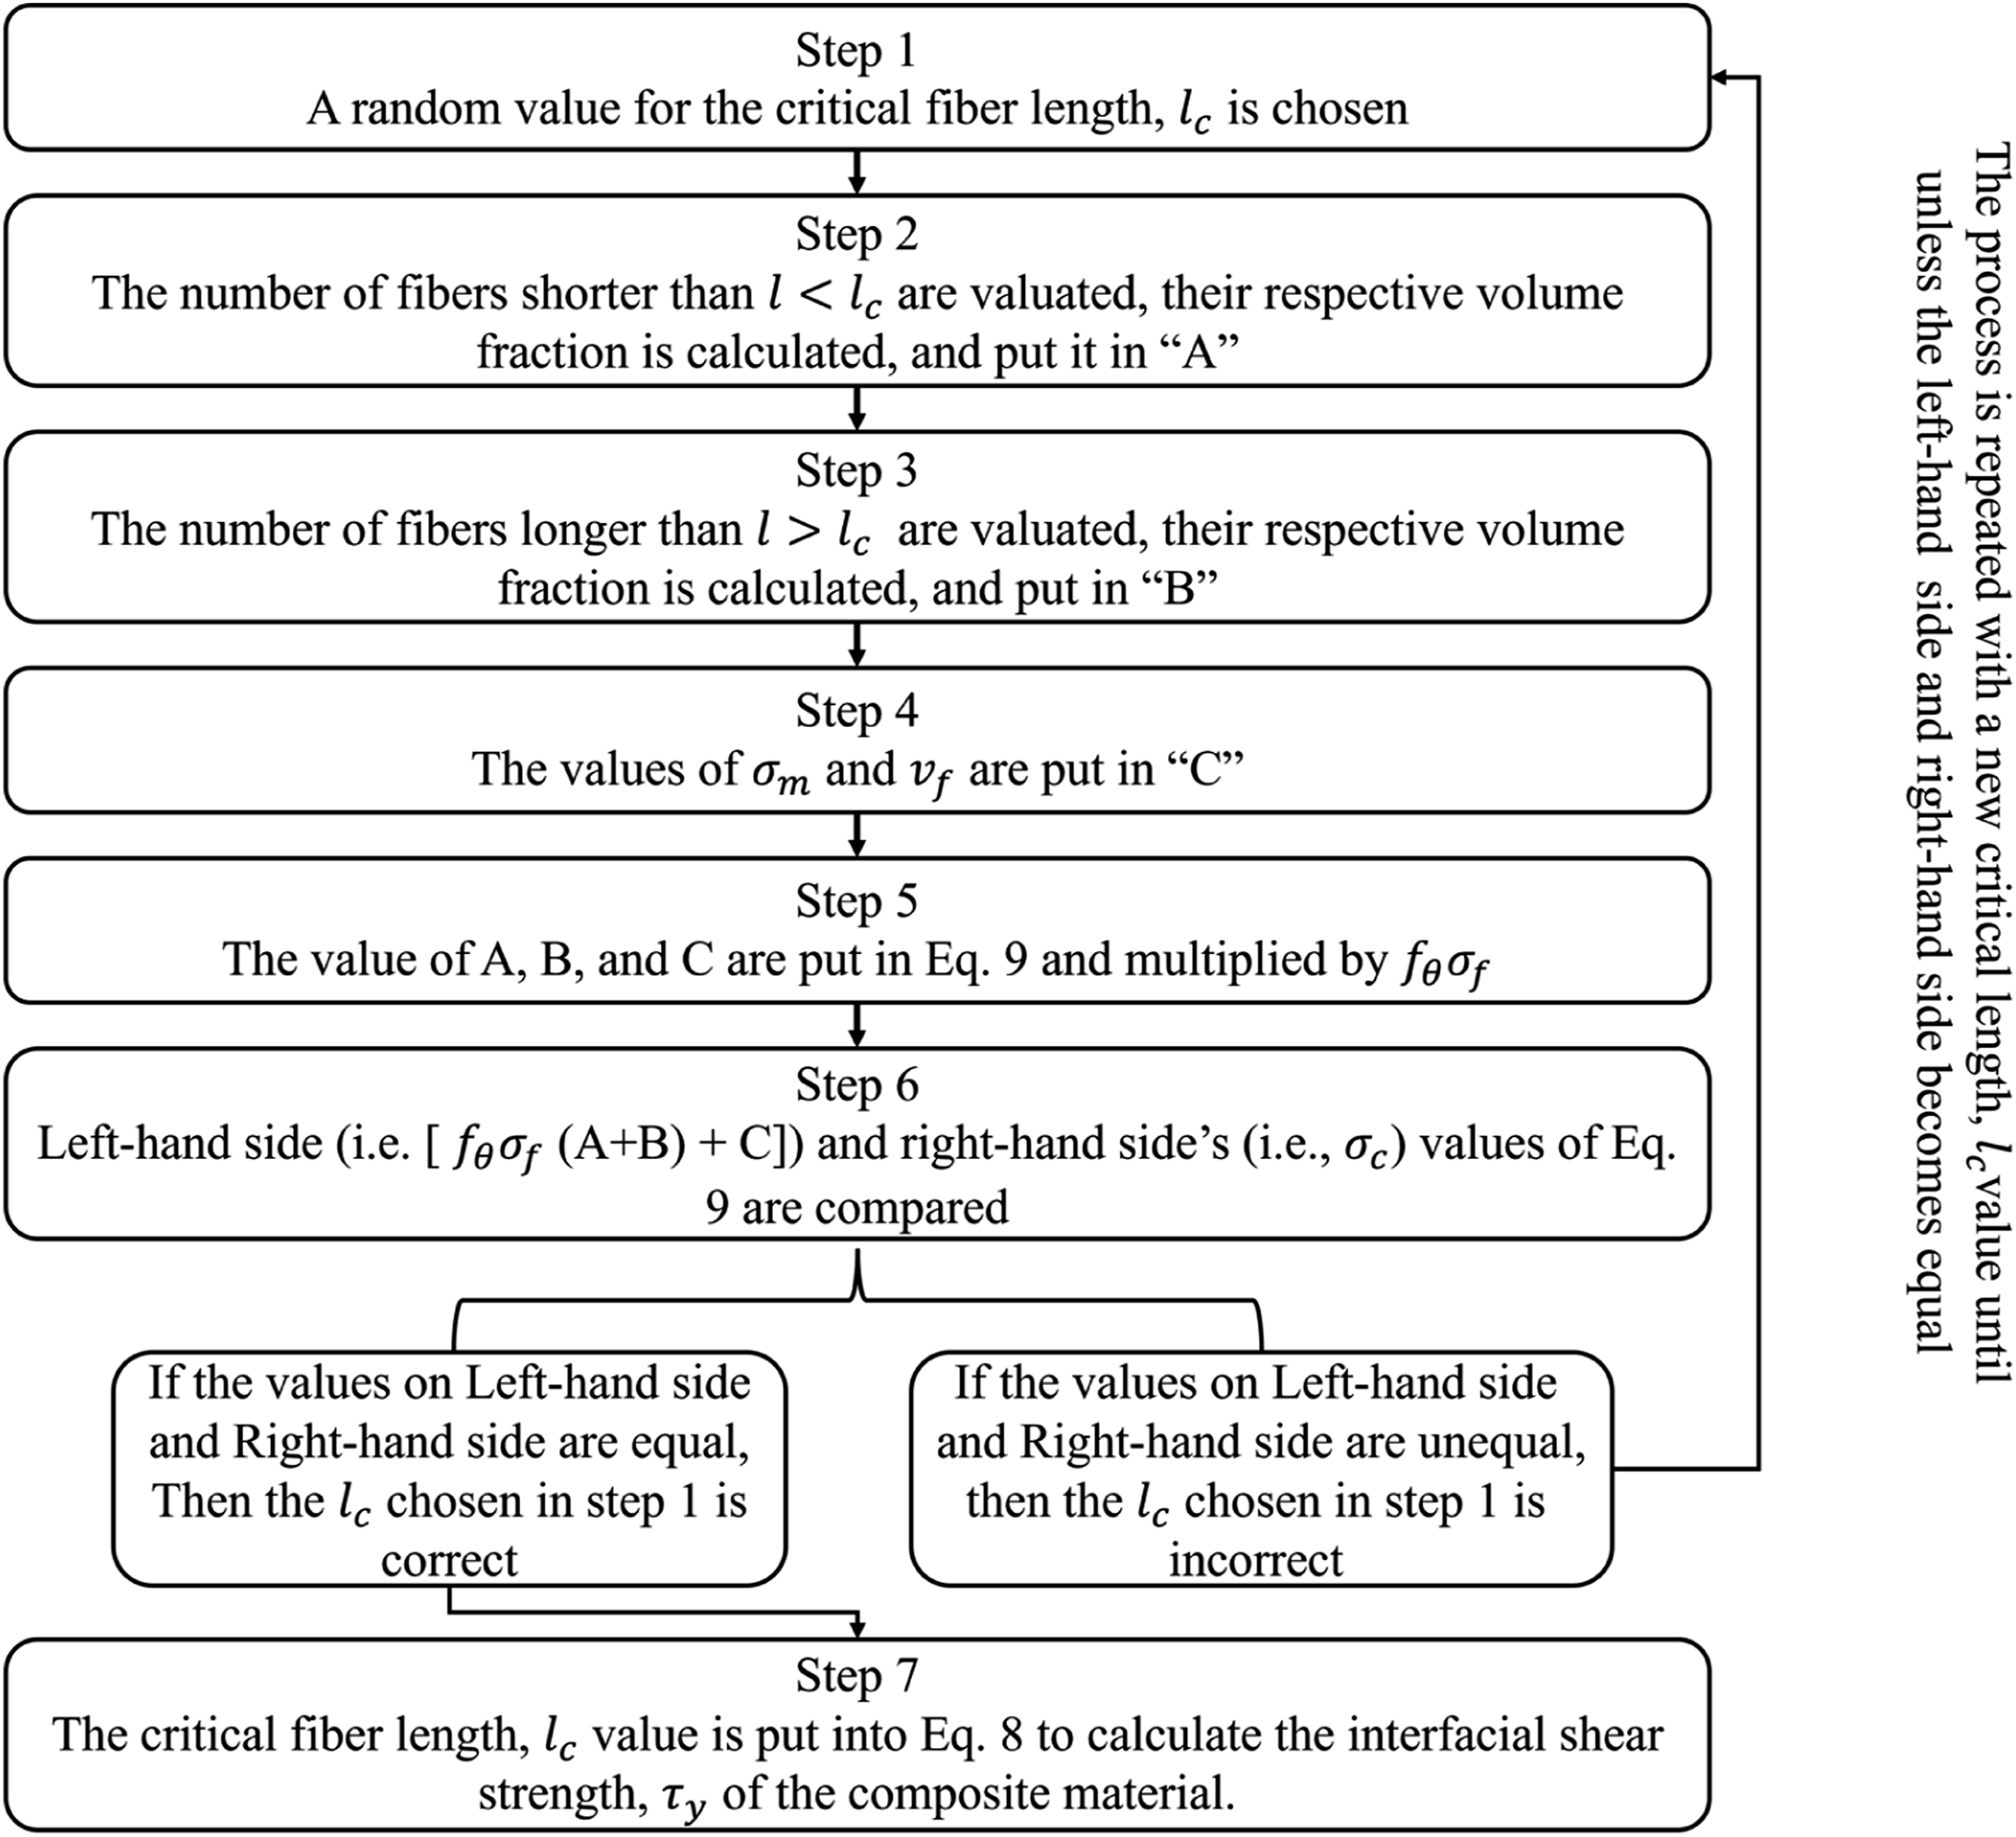
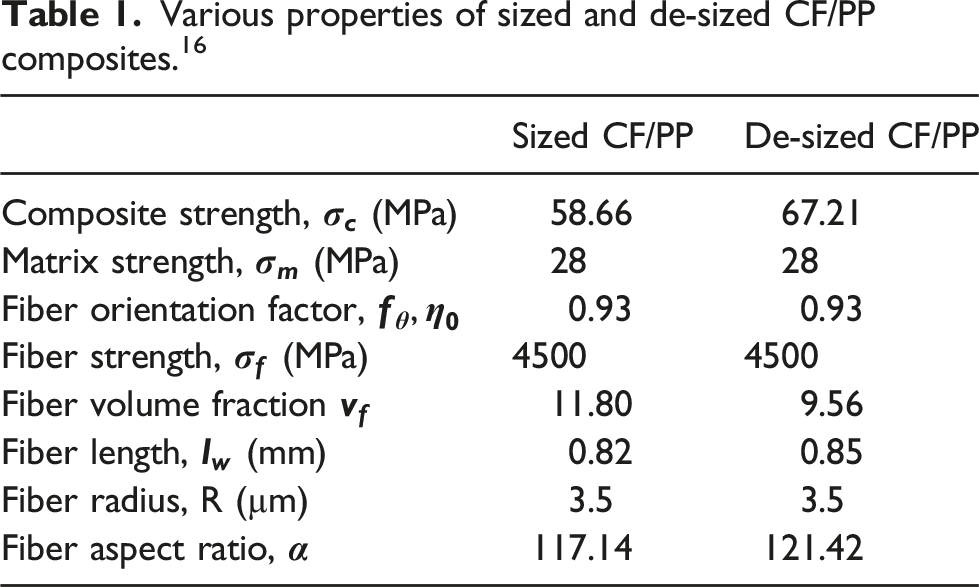
The values of parameters used to evaluate the interfacial shear strength are mentioned in Table 1. 16 The interfacial shear strength of sized and de-sized CF/PP composites was calculated to be 3.57 and 5.62 MPa respectively. 21
Interfacial adhesion factor, β
Pukanszky model can be applied to calculate the interfacial adhesion factor, 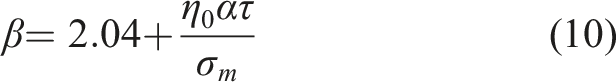
The interfacial adhesion factor,
Results and discussion
Interphase thickness in sized and de-sized CF/PP composites
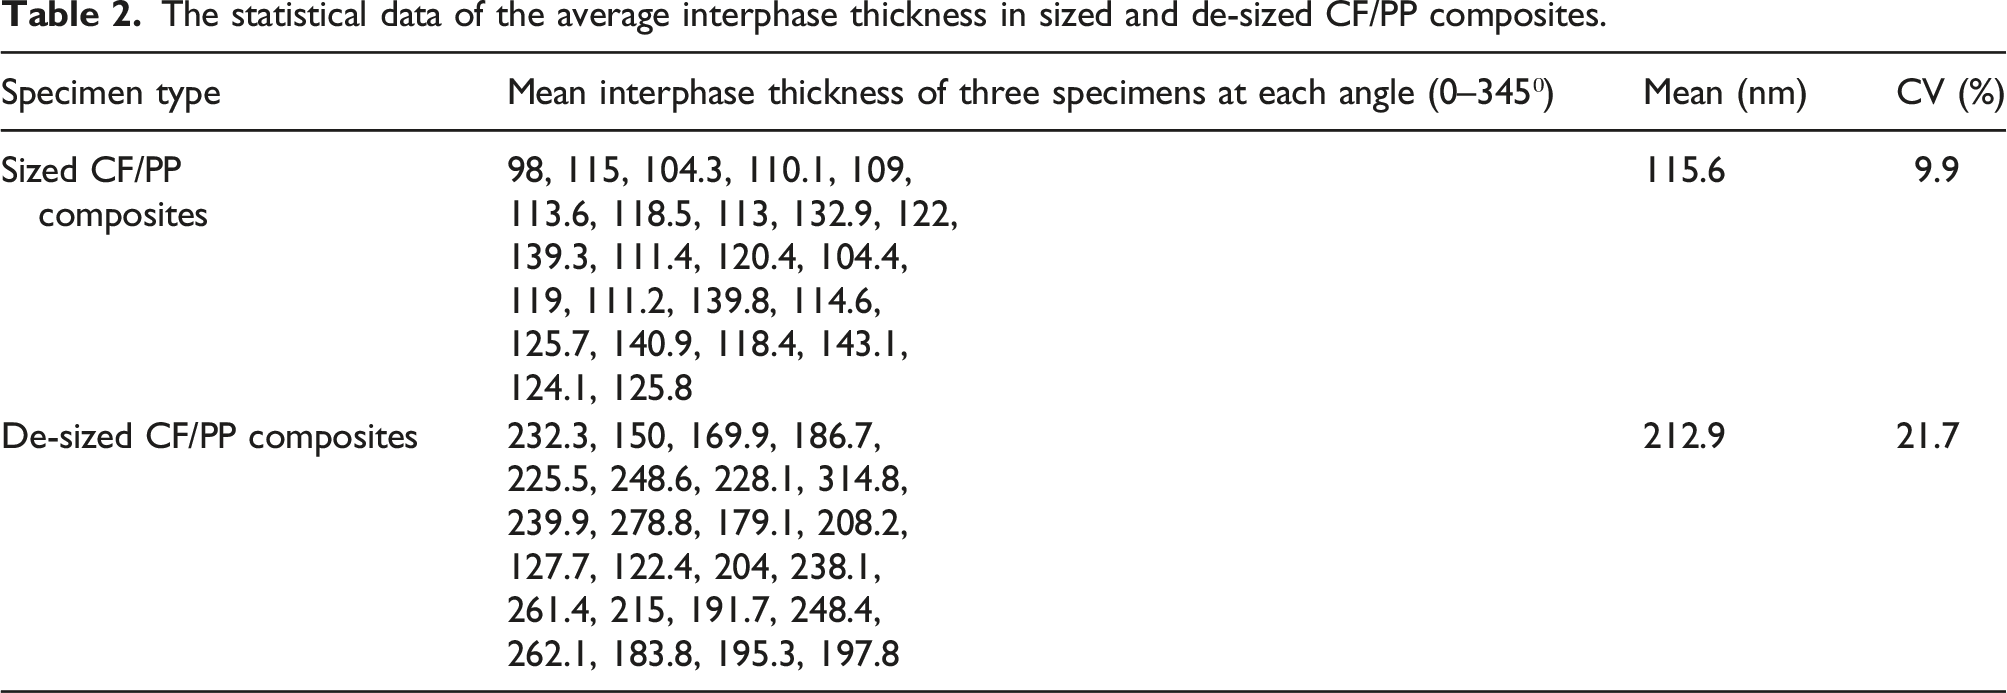
The statistical data of the average interphase thickness in sized and de-sized CF/PP composites.
The DMT modulus images of the sized and de-sized CF/PP composites are shown in Figure 6. In both types of pictures, the area with blue color represents carbon fiber and, the reddish area indicates polypropylene resin. Whereas orange colored area is the transition region between the carbon fiber and polypropylene resin, which is the interphase region. The DMT modulus of the interphase decreased gradually from fiber to the matrix in both sized and de-sized CF/PP composites, and formed a depression between them, mainly due to the low modulus and the softness of the interphase.20,25 The scattered raw data was fitted, and the thickness of the interphase was defined as the region between a region where the fibers’ average DMT modulus decayed 10% of its initial value to 90% [33] The DMT modulus curves of sized (a) and de-sized (b) CF/PP composites.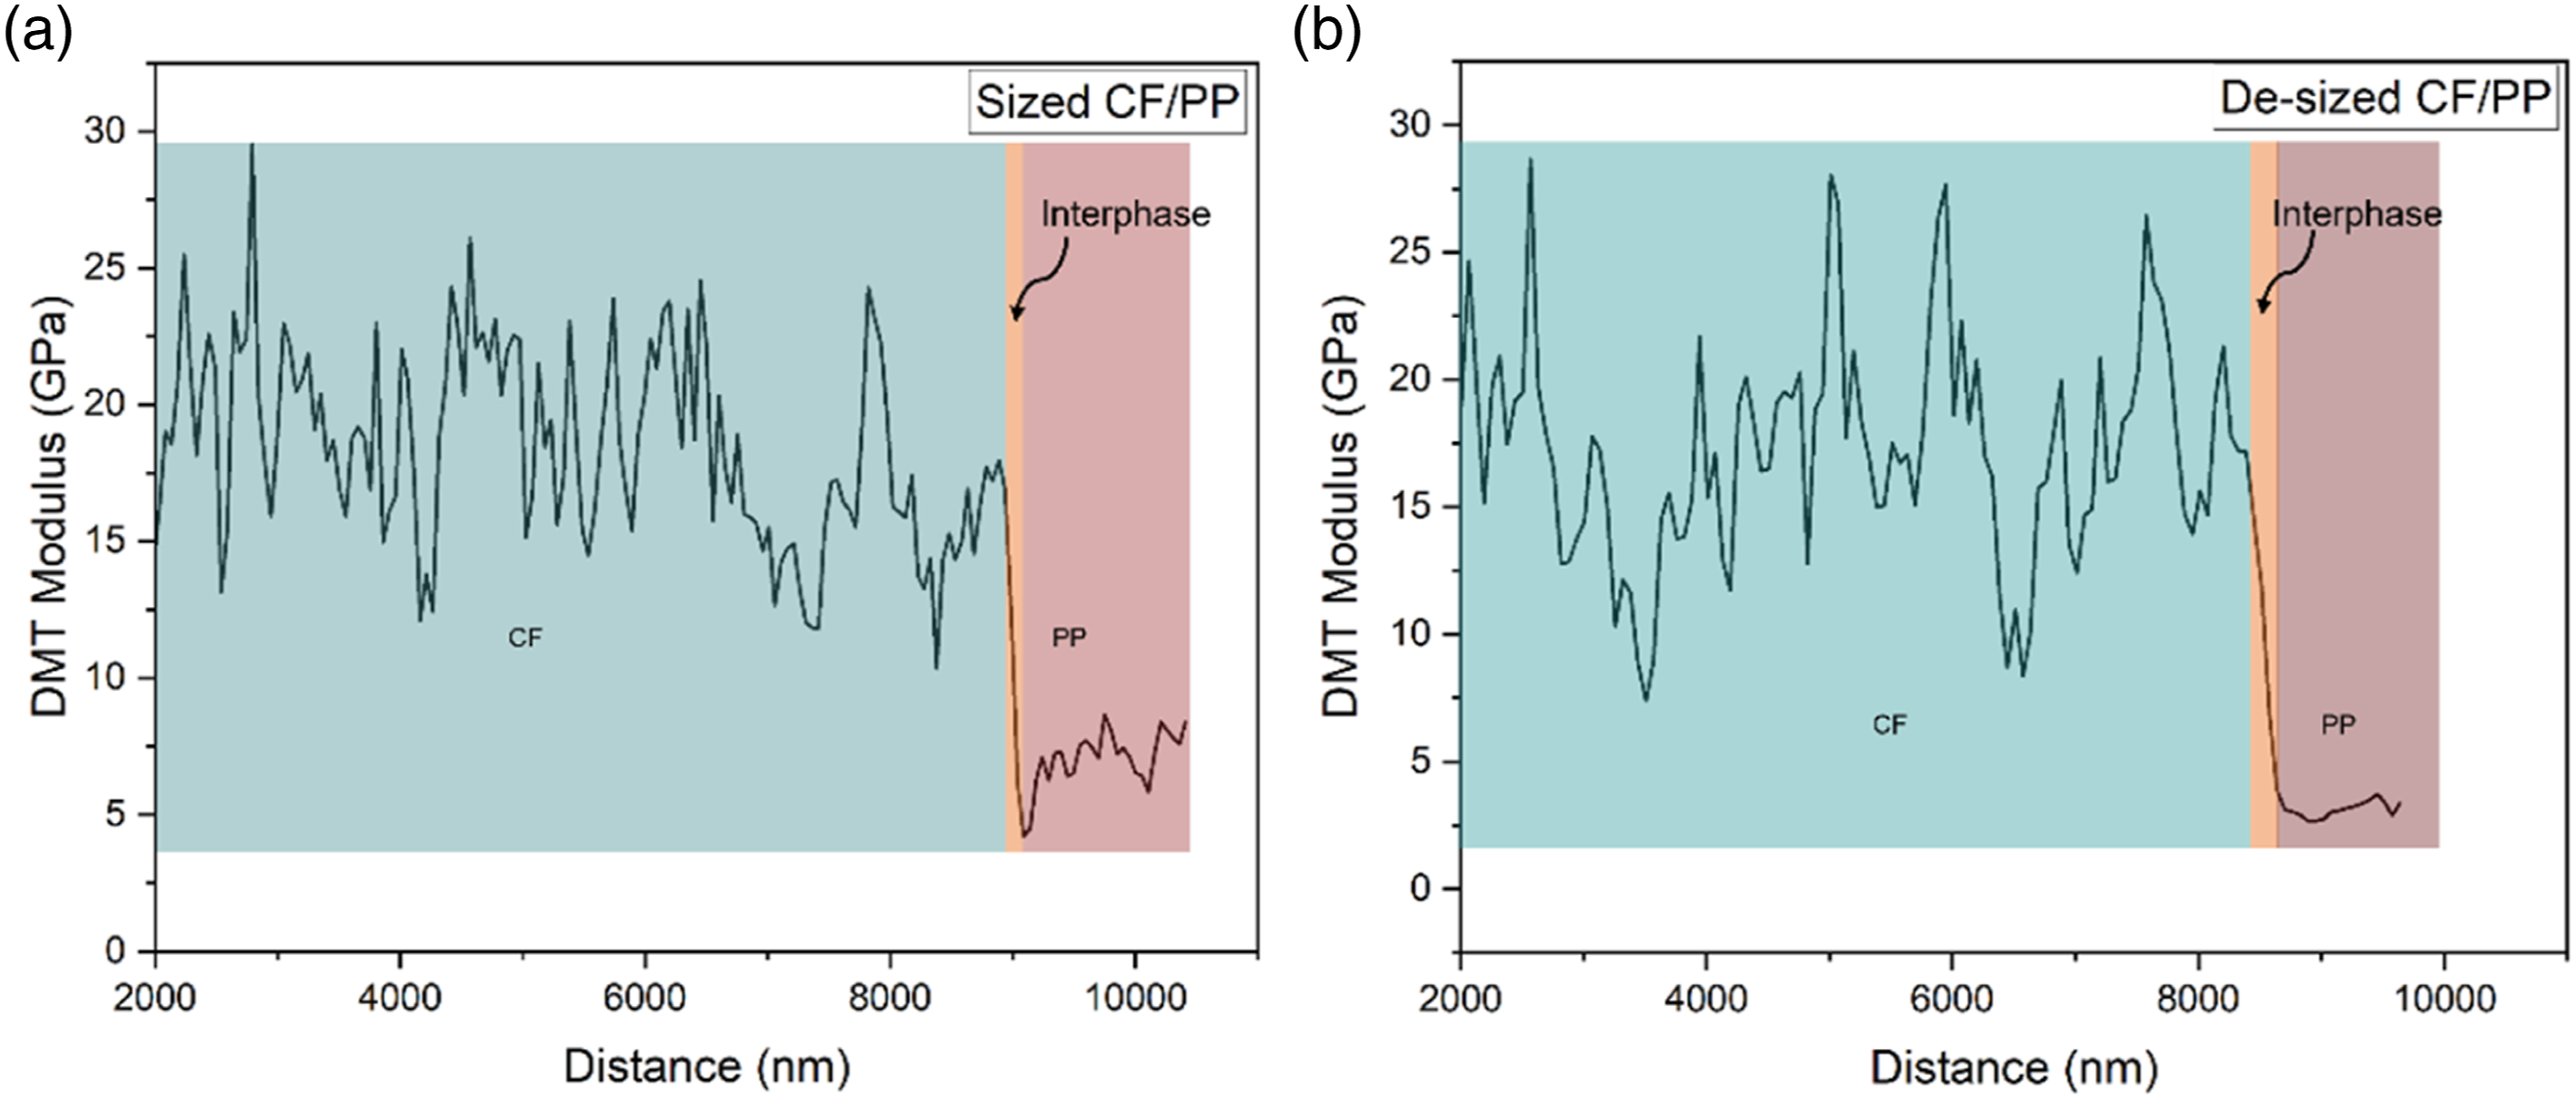
The interphase thickness in de-sized CF/PP composites was found to be 212.9 ± 9.3 nm, whereas it was 115.6 ± 2.4 nm in sized CF/PP composites (Figure 7) which is almost 84.17% thicker than the sized CF/PP composites. Also, the coefficient of variation for interphase thickness is almost higher in de-sized CF/PP composites than the sized CF/PP composites. This justifies that the interphase thickness was non-uniform across the fiber region in de-sized CF/PP composites. The interphase thickness illustration in Sized (a) and de-sized (b) CF/PP composites respectively.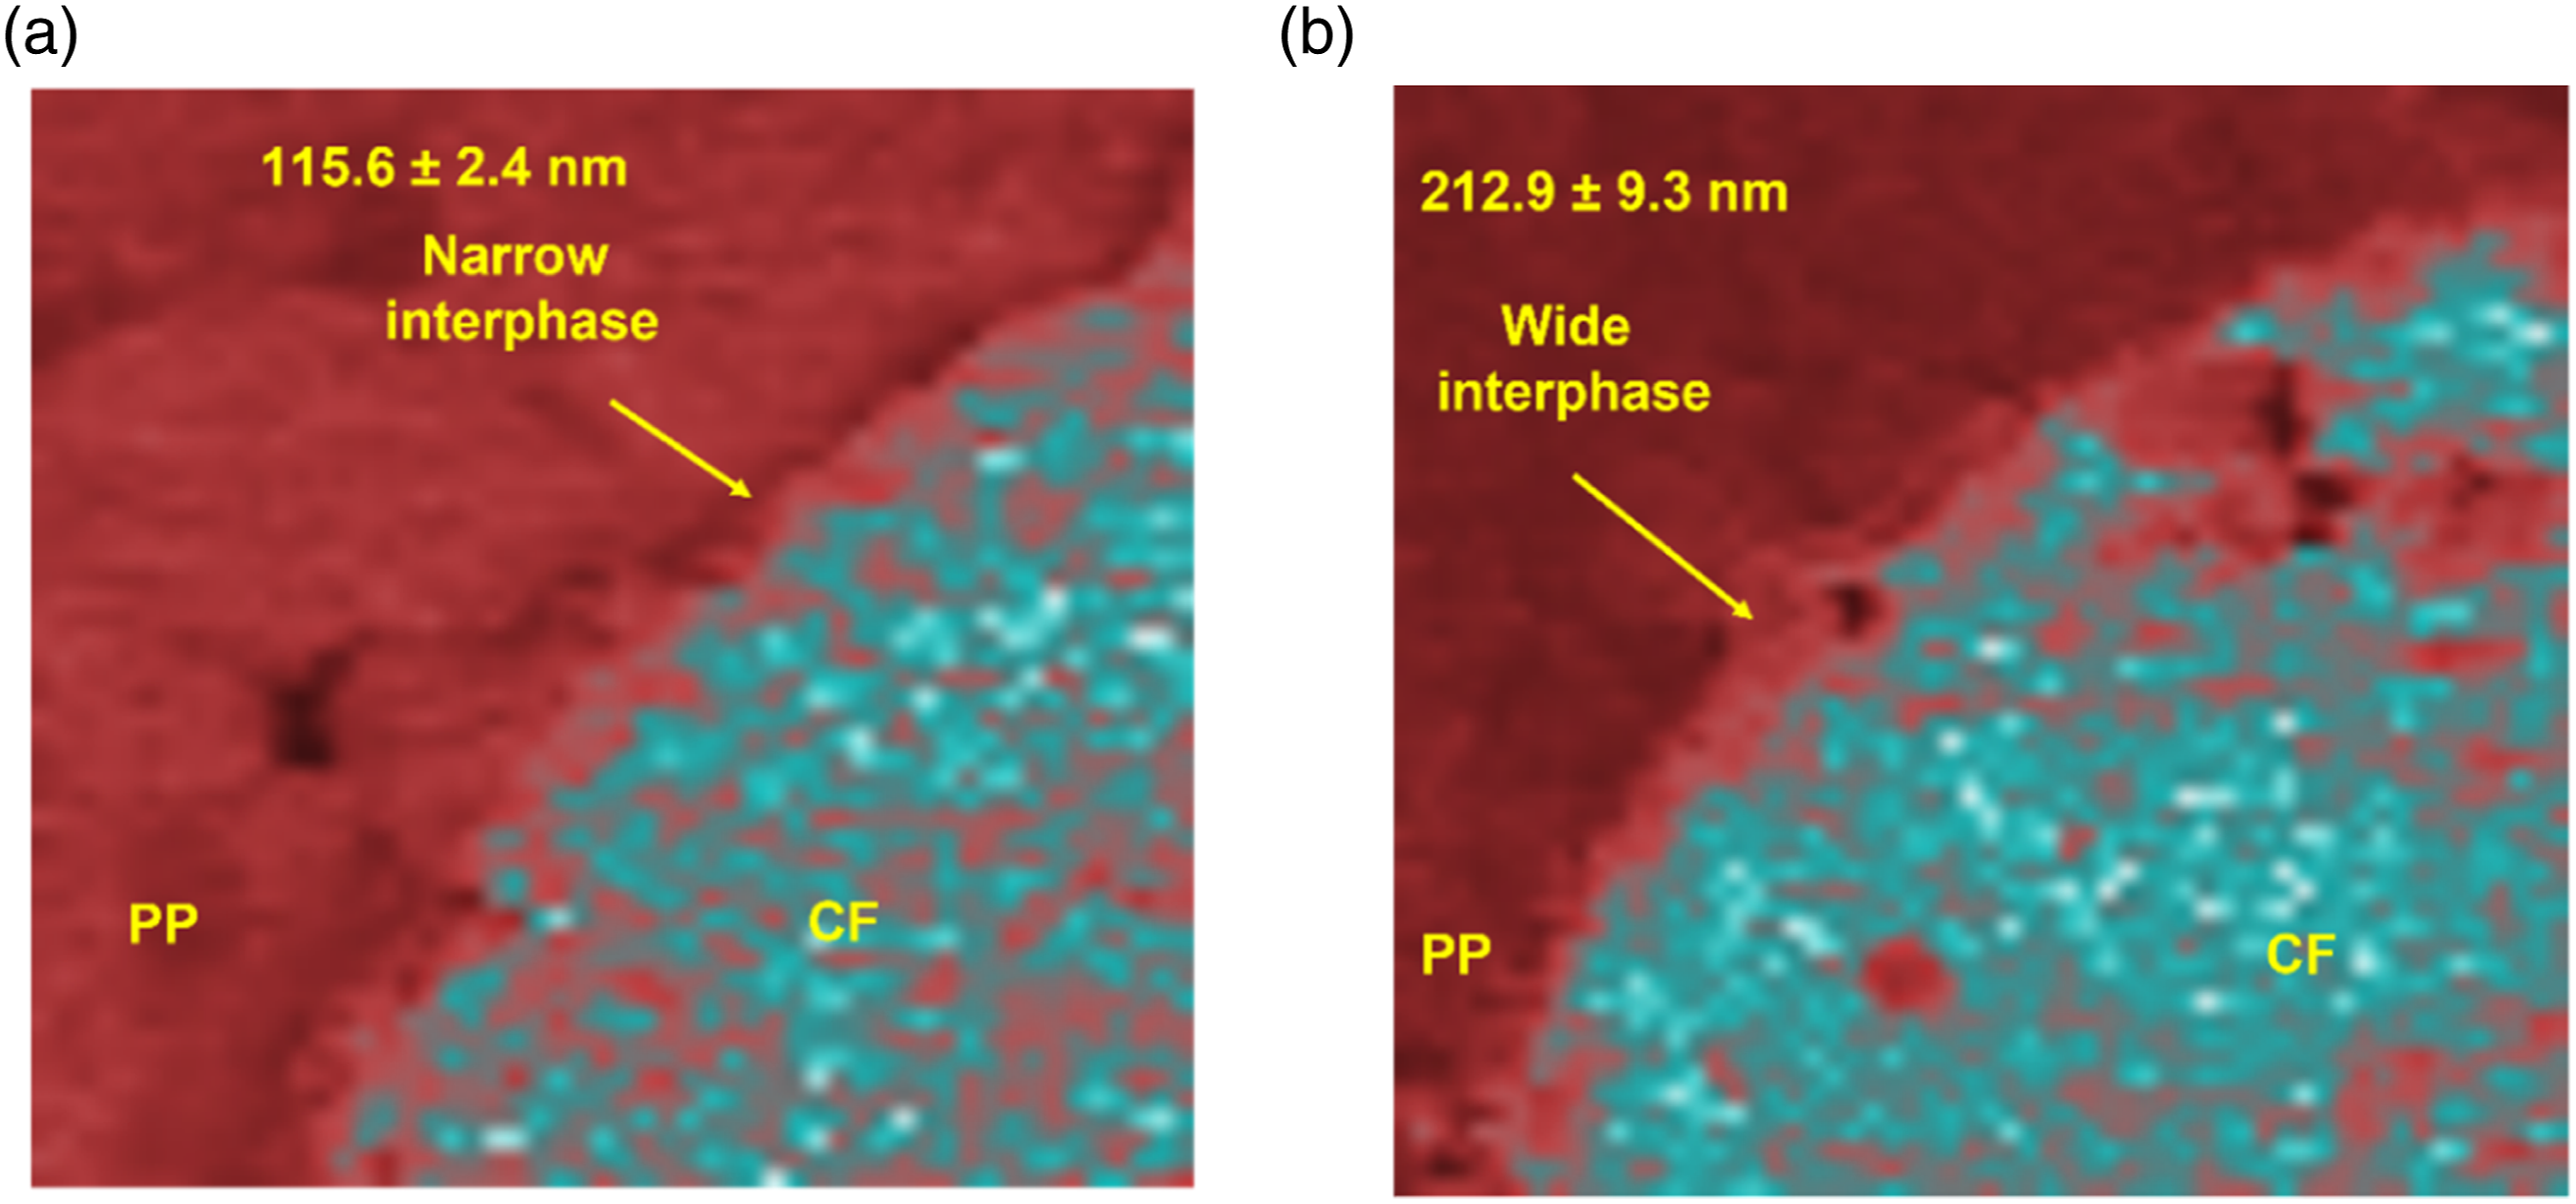
Discussion
The mechanical interaction between the de-sized carbon fibers and polypropylene resin is the most important parameter for enhanced interfacial interaction. A schematic illustration of the interphase thickness distribution in sized and de-sized CF/PP composites is shown in Figure 8. The diameter of interphase in sized CF/PP composites is smaller and nearly circular. This indicates the uniform distribution of the sizing agent present on the sized carbon fiber surface. On the contrary, the diameter of the de-sized CF/PP composites is larger than the sized CF/PP composites. This showed an enhanced interphase between de-sized CFs and the polypropylene resin. In addition, the diameter of de-sized CF/PP composites was irregular that is, larger, or smaller across at different points across the whole cross-section. This means the interphase thickness was different at different points across the fiber cross-section in accordance with the textured surface morphology of de-sized carbon fibers. The interphase distribution in various sized (a) and de-sized (b) CF/PP composite specimens.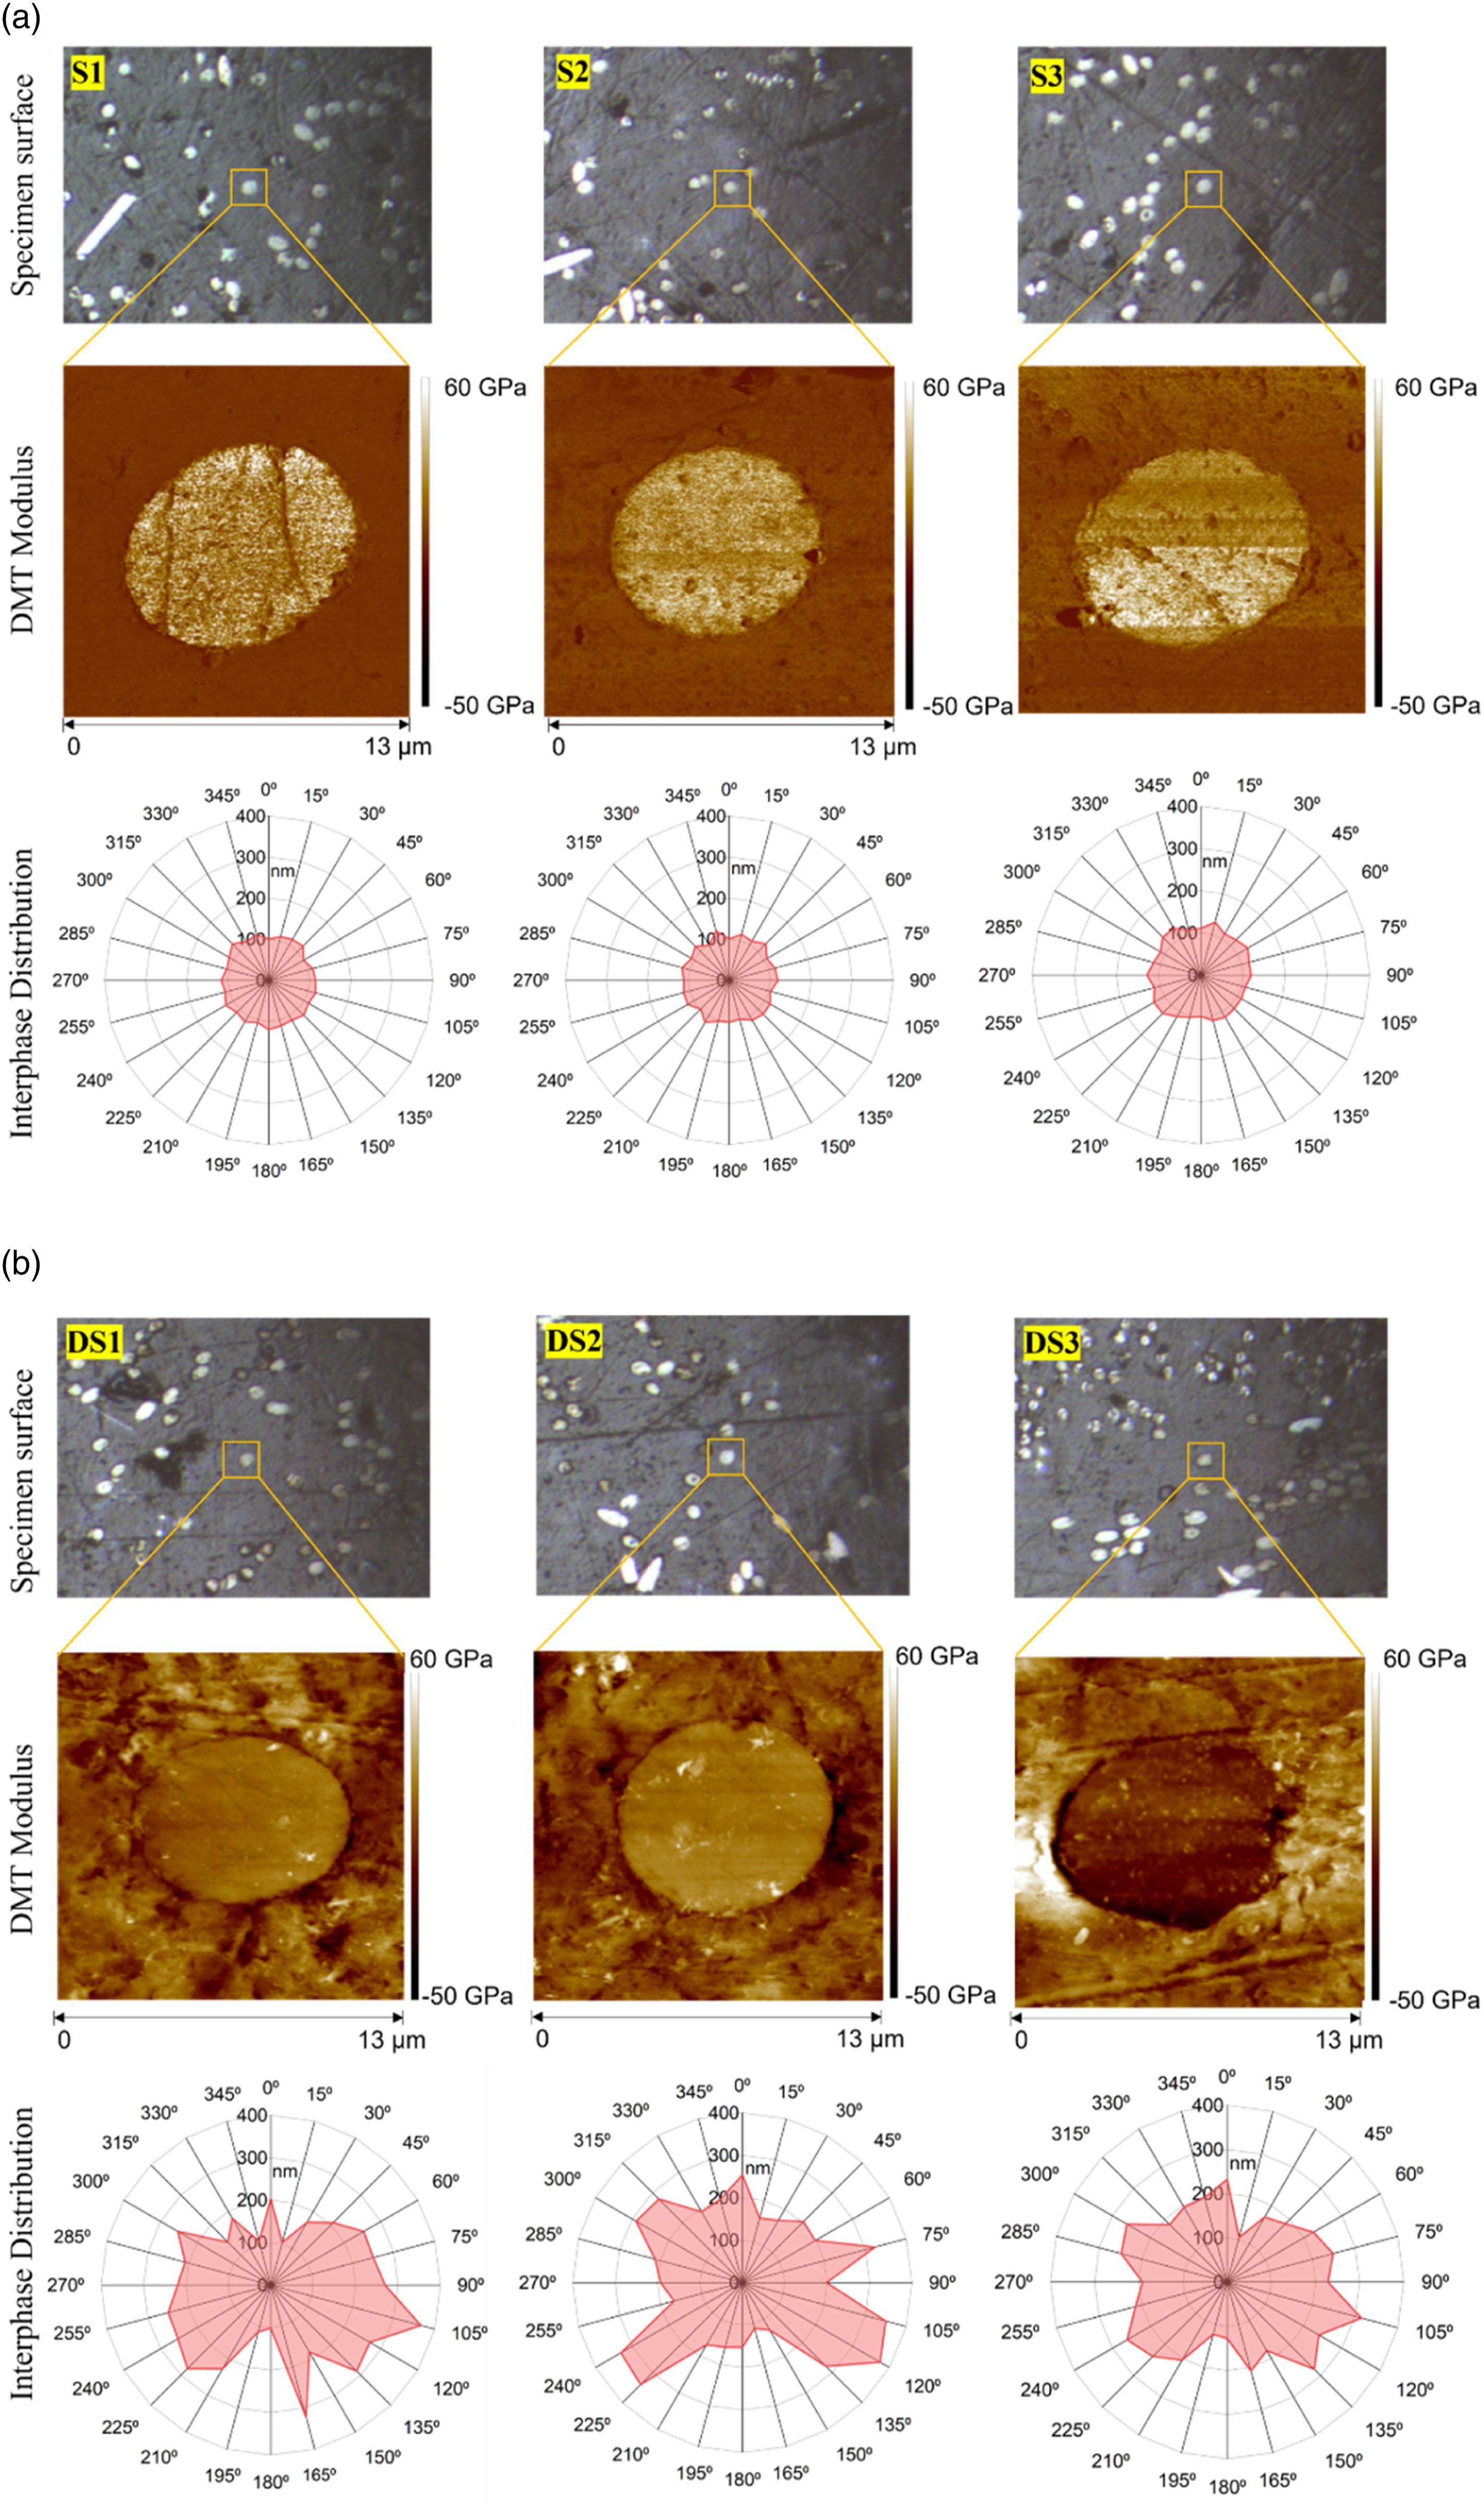
In general, the better chemical reaction at the interface regions leads to a better adhesion between the fiber and matrix resin. 2 However, adhesion can also arise from the mechanical interlock of the textured adherend. The structure of the porous network of the polymer leads to the structural reinforcement of the interface due to proper wetting condition thereby leading to the superior interfacial shear strength.3,4 Enhancing the interphase thickness by improving the interphase thickness with a rough textured surface is easier for processability as compared to altering the properties of the bulk resin. Another benefit of this technique that the morphology of the grown interphase can be controlled by varying the temperature and speed of the carbon fiber de-sizing process. Instead of having the composite materials with uniform interphase thickness, the composites with variable interphase thickness might be very suitable for applications which require phase change materials. A thicker interphase provides the better transition of the modulus from carbon fiber towards the polypropylene resin which enhances the interfacial adhesion and thereby leading to improved interfacial shear strength. On the other hand, an incomplete wetting of polymer leads to thinner interphase and creates voids at the interface region, which sometimes results in lower interfacial shear strength. 26
It is important to document the interfacial failure mechanisms that might occur in the sized and de-sized CF/PP composites. Several possible failure modes in sized and de-sized CF/PP composites are shown in Figure 9. Type A failure mode represents adhesive failure at the interface between the fiber and the interphase. This kind of failure mode usually occurs in fiber-reinforced composites with poor interfacial adhesion properties. This failure location should be sensitive to increases in the degree of chemical bonding between the sizing agent and the fiber surface up to the point where the failure mode transitions. Type B failure mode is cohesive failure within the interphase region. This means that bonding to the fiber and to the matrix is higher in strength than the interphase. This failure mode will be sensitive to improvements in the interphase strength and IFSS could be increased by texturing. Type C mode represents cohesive failure in the resin matrix. This failure mode implies that bonding to the fiber and strength of the interphase are higher than the yield strength of the bulk resin and should be insensitive to further sizing improvements. Schematic diagram of the possible failure modes that can occur across the interfacial region.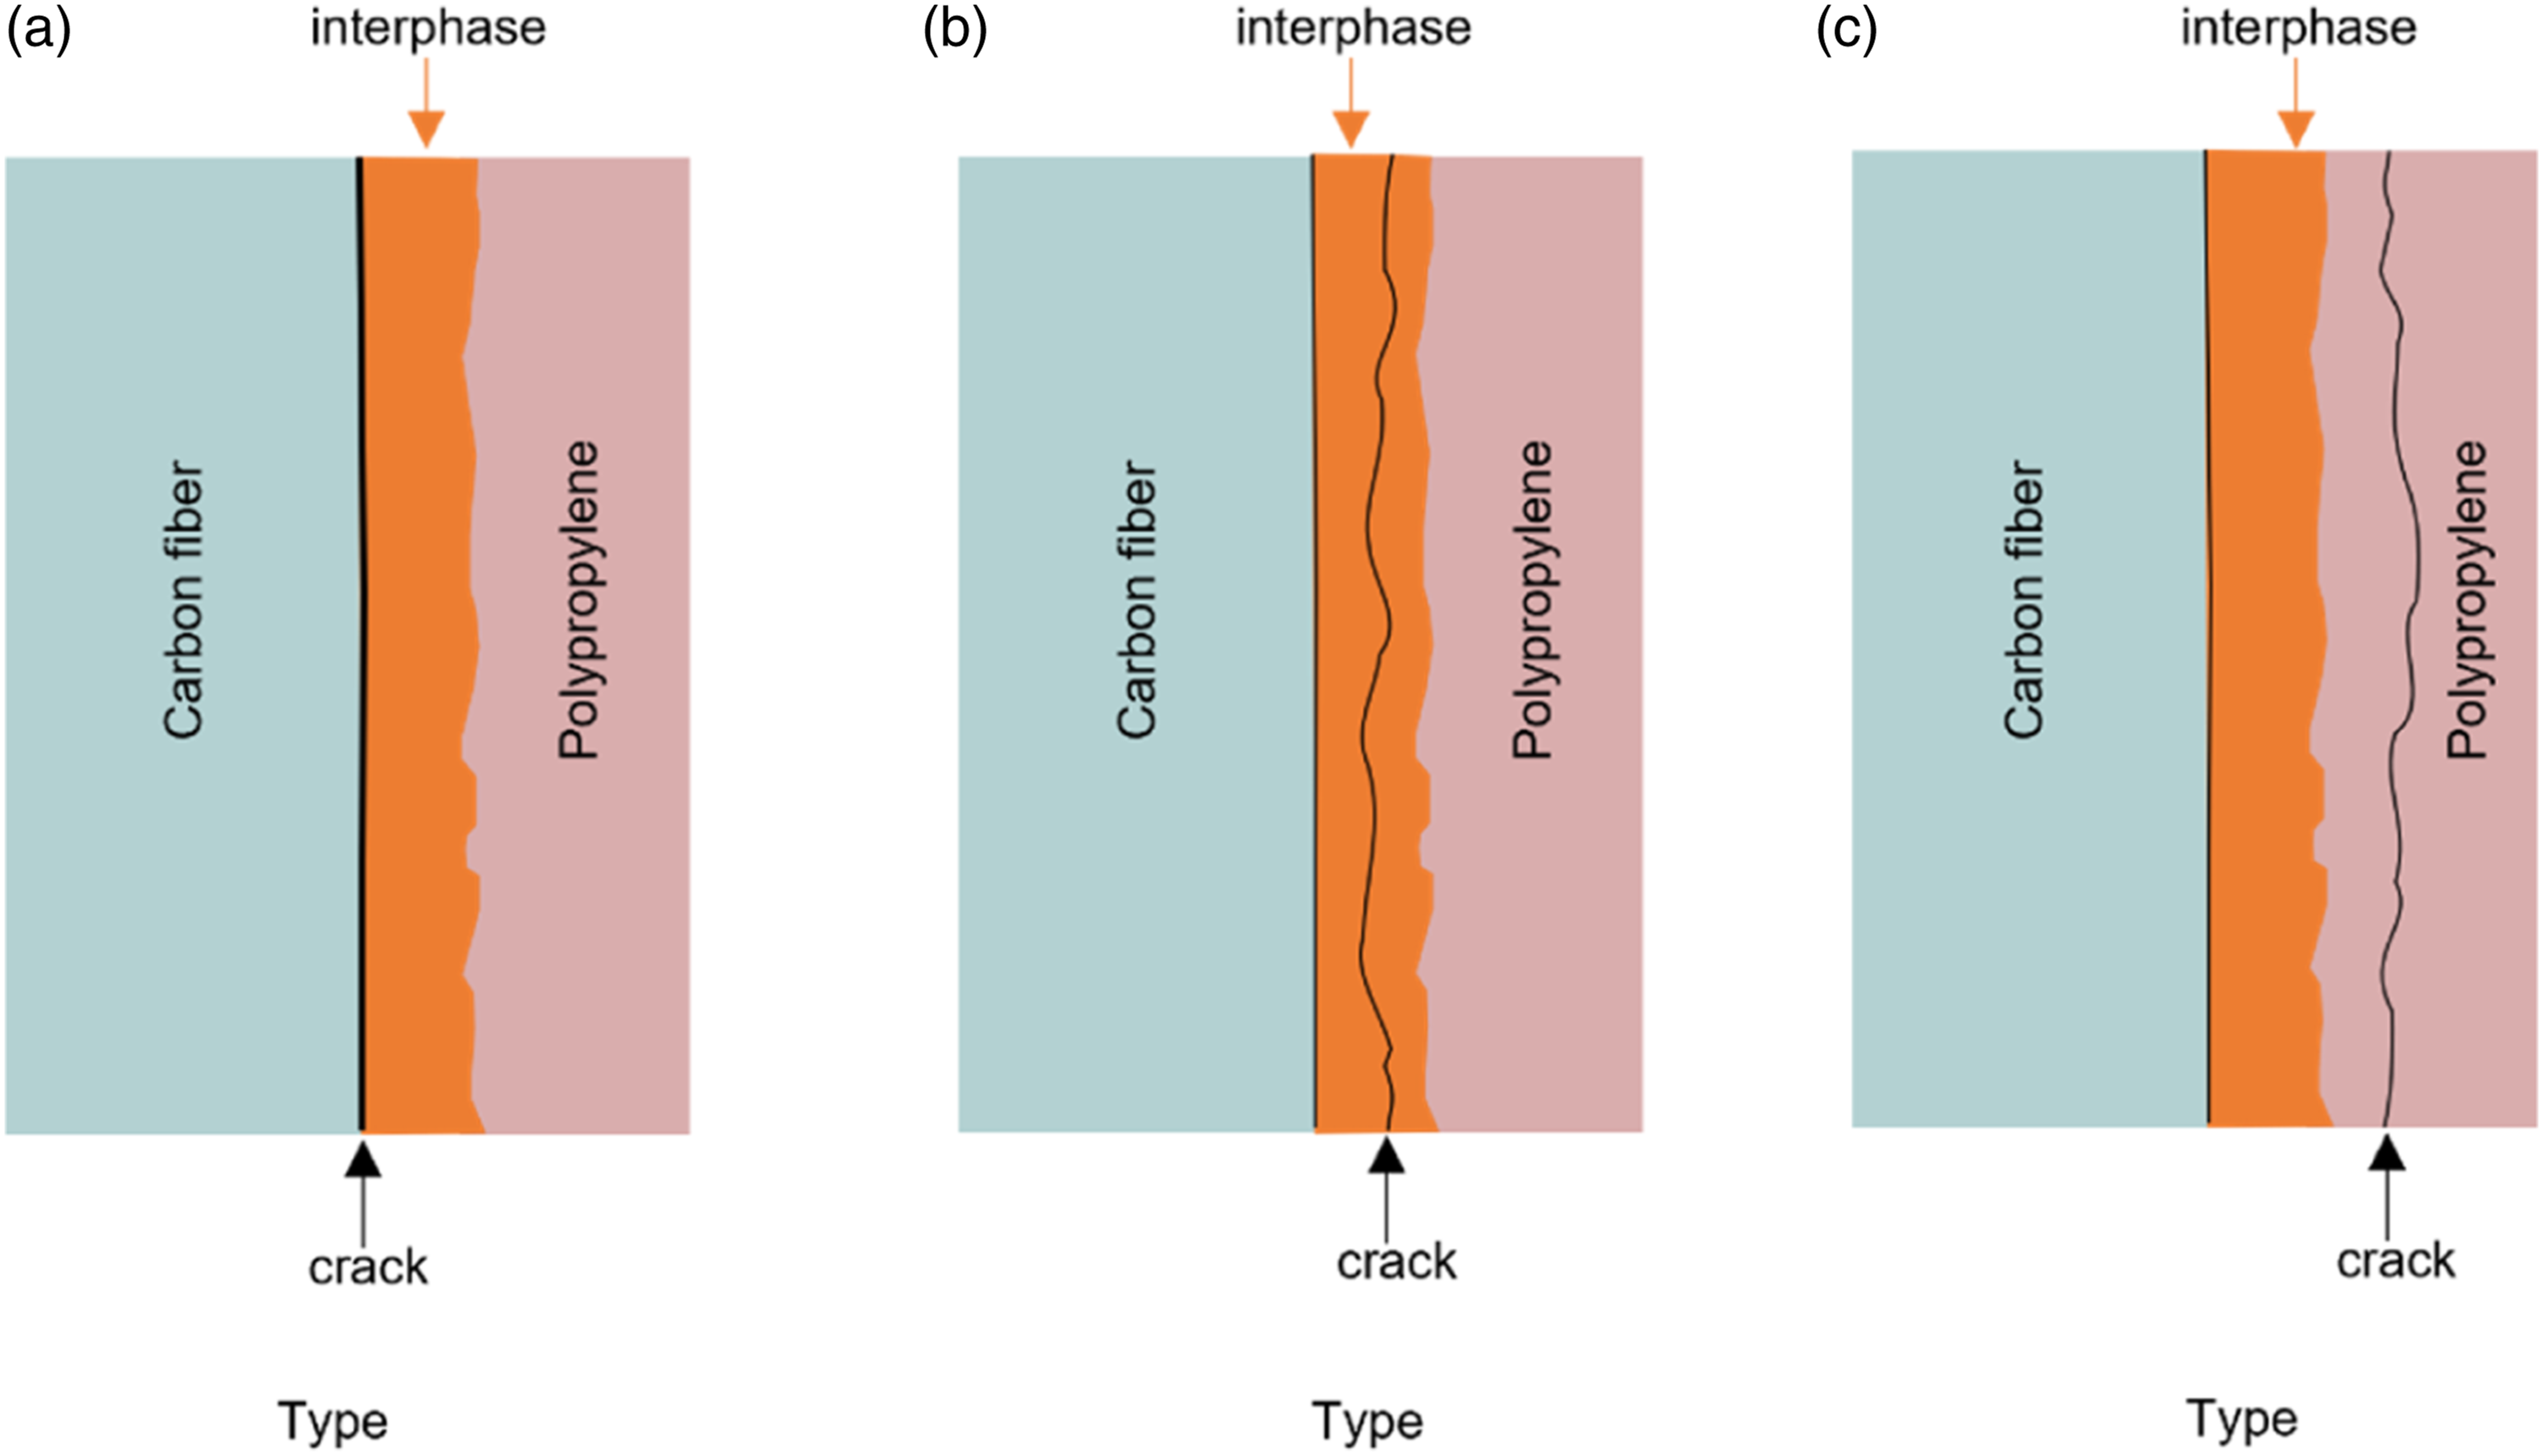
The SEM images of the fracture surface of sized and de-sized CF/PP composites followed by the tensile test in a previous study 16 were observed carefully to investigate the possible failure modes. In sized CF/PP composites, the fibers were pulled out of the matrix resin due to the poor interfacial bonding. Therefore, it can be formulated that the adhesive failure type was a dominant fracture mode in sized CF/PP composites. In comparison, in de-sized CF/PP composites, a mixed kind of failure behavior was observed. In de-sized CF/PP composites, only fewer fibers were pulled out of the matrix resin as compared to the sized CF/PP composites which indicates adhesive failure mode (type A). In addition, the PP resin segments were seen sticking to pulled out fibers’ surface which indicates a cohesive failure (type B). Cracks propagating through the interphase will be hindered by the fiber surface texture that has been created and force the crack along a tortuous path. This tortuous failure path triggered by texture absorbs more energy during relative sliding of the fiber to the resin.
Conclusion
In the following study, the effect of carbon fibers’ surface morphology on the nanomechanical properties of the sized and de-sized carbon fiber reinforced polypropylene was investigated. The interphase thickness and DMT modulus of the sized and de-sized carbon fiber reinforced polypropylene composites were determined by using AFM in PF-QNM mode. The interphase thickness data at different angles across the fiber’s cross-section was plotted and observed. The interphase thickness in de-sized CF/PP (212.9 ± 9.3 nm), was almost 80% thicker than the sized CF/PP composites (115.6 ± 2.4 nm). No apparent chemical changes were observed for the de-sized CFs therefore, the improvement of the interphase thickness, and interfacial shear strength is attributed to the better mechanical interlocking at the interphase region caused by surface morphology. The graphical illustration for sized CF/PP composites showed nearly a circular cross-section which indicated the presence of uniform sizing agent on the carbon fiber surface as expected. Whereas the de-sized CF/PP composites showed non-uniform cross-section with several highs and lows. This study demonstrates the possibility for employing mechanical interlocking effects to improve interphase thickness and interfacial shear strength in fiber reinforced composites without significantly affecting the chemical nature of carbon fiber.
Footnotes
Declaration of conflicting interests
The author(s) declared no potential conflicts of interest with respect to the research, authorship, and/or publication of this article.
Funding
The author(s) received no financial support for the research, authorship, and/or publication of this article.
Data Availability Statement
The data that support the findings of this study are openly available at ![]()