
Abstract
This study explores the influence of post-weld annealing on friction stir welded (FSW) carbon fiber reinforced thermoplastic (CFRTP) in woven laminate form. Field advancement occurs in three key areas including furthering the understanding low-melt polyaryletherketone (LMPAEK) welding/processing, effects of post-weld annealing on CFRTP joints, and determining feasibility for friction stir welding (FSW) of thermoplastics reinforced with continuous carbon fibers. High temperature annealing just below LMPAEK’s melting point improved ultimate tensile strength by up to 30% and weld toughness by up to 91%. Improvements to mechanical performance result from increases in joint crystalline content from 14.09% in non-annealed joints to 27.91% in joints subject to 280 ◦ C annealing. Annealing does not reduce porosity in the weld zones, rendering necessary further improvements to the FSW process for CFRTP joints. Further analysis also indicates that despite its slight molecular modifications, LMPAEK has highly similar crystalline structure and response to thermal treatment compared to PEEK.
Keywords
Introduction
Carbon fiber reinforced thermoplastics (CFRTP) are gaining popularity in aerospace sectors as a replacement for epoxy based composites due to their ability to be thermoformed, high impact resistance, and potential for recycling. Their thermoformability also allows for welded joints, reducing added weight from mechanical fasteners and limiting stress concentrations. Welded CFRTP joints are already used in industry. The following examples highlight industry applications that implement CFRTP welding. 1 GKN Fokker used induction welding to join elevator and rudder components on the Gulfstream G650 and Dassault Falcon 5X aircraft. They also used ultasonic welding to join parts to CFRTP floors in the G650. The airbus A340, A350, and A380 aircraft have resistance welded wing leading edges. Recently, researchers applied friction stir welding (FSW) as an alternative joining method to weld CFRTP. FSW was patented by Wayne Thomas et al. of the Welding Institute on December 6, 1991 as a novel process to join metal alloys. 2 The first available documentation on polymer FSW became available in the late 1990s 3 and a significant portion of the research occurred within the last decade, expanding to polymer composites.
Most studies concerning CFRTP FSW join thermoplastics reinforced with short carbon fibers (SCF).4–9 Many large structures such as fuselages and propellant tanks utilize continuous carbon fibers (CF) in their reinforcement. Many stamp formed components, such as mounting/support clips on the Airbus A350, utilize woven fabric reinforced laminates of just several layers from thin sheets. 10 Therefore, studies where FSW joins composites reinforced with continuous fibers are necessary to make FSW a potential competitive joining technology in future aerospace composite structures. The first known study to consider FSW of thermoplastics reinforced with continuous CF’s occurred recently. Wilkins et al. demonstrated friction stir welded lap joints of woven carbon fiber reinforced low-melt polyaryletherketone (LMPAEK) laminate which differs from traditional CFRTP welding methods in that the fibers are disturbed in the weld zone. They achieved approximately a 50% joint efficiency when comparing the FSW joint to a short carbon fiber reinforced thermoplastic (SCFTP). 11
The rapid heating and cooling cycles presents challenges when welding thermoplastics. Thermoplastic welding involves interdiffusion and entanglement of molecular chains to connect two or more components. 12 Welding requires melting of the polymer at the joint interface and pressing the joining components together for them to consolidate upon solidification. 13 This process creates a cycle of chain disentanglement and re-entanglement. 12
Temperatures above the polymer’s glass transition temperature (T g ) relaxes the molecular chains, allowing for them to slide past each other and diffuse across the joint. The amount and rate of molecular diffusion depends on the temperature and amount of time of time at said temperature. 14 For semi-crystalline polymers, rate of cooling from the melt affects not only polymer diffusion but degree of crystallinity as well. Ultimately, these elements affect mechanical performance. Higher degrees of crystallinity associate with increased modulus, shear strength, interfacial strength, and chemical resistance in CFRTP. 15 The formation of a transcrystalline region, or crystals oriented along the fiber/matrix interface, promotes improved interfacial shear strength between the polymer and fibers. 16 Low crystallinity can be beneficial under circumstances that requires ductility. However, low crystallinity increases permeability in the polymer that allows for diffusion of gases. 17
Rapid cooling rates common to polymer welding techniques can limit chain diffusion and crystallinity. Increasing the processing times during thermoplastic welding to decrease the cooling rate from the melt has been shown to improve crystallinity in ultrasonically welded polyphenylene sulfide (PPS) joints. 15 However, increasing individual joint processing times reduces the overall manufacturing efficiency. Semi-crystalline polymers can crystallize both from the melt and heating from the glass. 18 Crystal types and orientation biases have temperature dependency as nucleation and spherulites form at higher temperatures and rod-like growth occurs near T g . 18 Crystal growth below the melting temperature (T m ) makes post-weld annealing possible, which can improve process times since annealing can commence in large batches.
Most of the CFRTP annealing research focuses on molded and 3D printed parts. Kishore et al. found that post-fabrication annealing of CF reinforced PPS improves the torsional storage modulus as a result of increased crystallinity. They also indicated that annealing promoted crosslinking of polymer at the surface, but these effects were not representative of the bulk material. 19 Handwerker et al. observed a 50% increase in the ultimate tensile strength (UTS) of additively manufactured SCRTP when subjected to annealing. Void formation during the manufacturing process was the highest contributor to tensile failure and was not completely resolved by annealing. 20 Yu et al. found a similar trend in printed CF/PEEK (polyetheretherketone) composites with a 55.4% increase in interlaminar shear strength (ILSS). Annealing reduced porosity in their case, though did not completely remove the voids. 21 Um et al. considered the post annealed temperature dependent mechanical properties of CF/PET (polyethylene terephthalate) composites. In both 25°C and 100°C environments, slowly cooled specimens exhibiting higher crystallinity exhibited greater tensile strength and modulus. They attribute improved fiber/matrix adhesion from transcrystallinity and thermal stability as cause for increased performance. 22 Generally, annealing’s role in improved thermoplastic mechanical performance results from bulk crystallization that increases molecular chain order. 18 Improvements from annealing on bulk composites indicates that welded CFRTP joints will reap the benefits as well.
LMPAEK is a recent addition to the PAEK family of polymers. It is nearly identical to PEEK, except that it contains one extra aryl group in approximately 25% of the monomers. 23 As a result, LMPAEK has nearly identical mechanical properties and T g as PEEK with a reduced T m which makes it easier to process for injection molding, fiber impregnation, and welding. In addition to its nearly identical mechanical properties to PEEK, LMPAEK has also been shown to have a very similar response to thermal treatment as PEEK despite its slight chemical modification. 24 Schiel et al. studied the effects of process parameters on mechanical properties for CF/LMPAEK tape layup. They found that LMPAEK is less sensitive to layup processing speeds than PPS and PEEK, which allows for faster initial fabrication of components. However, LMPAEK was highly responsive to post-layup tempering. When heated to 290 ◦ C for 17 h, it reached near 30% crystallinity and improved lap shear values by up to 76%. 25
The following work explores the effects of post-weld annealing on friction stir welded LMPAEK reinforced with woven carbon fibers. The heat treating aspect of this research is the next phase to follow previous work studying the feasibility of joining woven CFRTP using FSW and utilizes previously established optimized welding parameters. 11 The manuscript aims to further establish the feasibility of CFRTP FSW and identify key weaknesses to address in future study. The principles of post-weld annealing not only apply to friction stir welded joints, but to all CFRTP welding.
Materials and methods
Joint Fabrication
Toray Advanced Composites supplied TC1225 woven laminate, with T300 carbon fibers and a polymer matrix composed of low-melt polyaryletherketone (LMPAEK). The laminates are four ply in [(0,90)]2S layup with a 1.2 mm sheet thickness. Specimens were cut to 30 mm × 70 mm and arranged by methods in previous study.
11
FSW commenced on Kearney and Trecker Milwaukee Model K milling machine modified with autonomous computer controlled spindle and axial drives. Joints were assembled in lap joint configuration with the top sheet’s lapped edge oriented to the FSW tool’s advancing side. The laminate sheets were oriented with the 0
◦
fiber parallel to the weld line and a 15 mm overlap. The lap configuration and fiber orientation is identical to that described and illustrated in previous study.
11
The tool consisted of a 25.4 mm diameter scrolled parabolic shoulder with a 6.35 mm threaded cylindrical pin and 0.79 mm pitch left-hand threads set to 1.143 mm length, shown in Figure 1. The tool rotated clockwise such that the threaded pin facilitated downward material flow. Welding parameters included 1000 RPM rotation speed, 30.5 mm/min traverse speed, 1.524 mm plunge depth, and 1.5
◦
rearward tool tilt. FSW tool consisting of threaded pin and scrolled parabolic shoulder.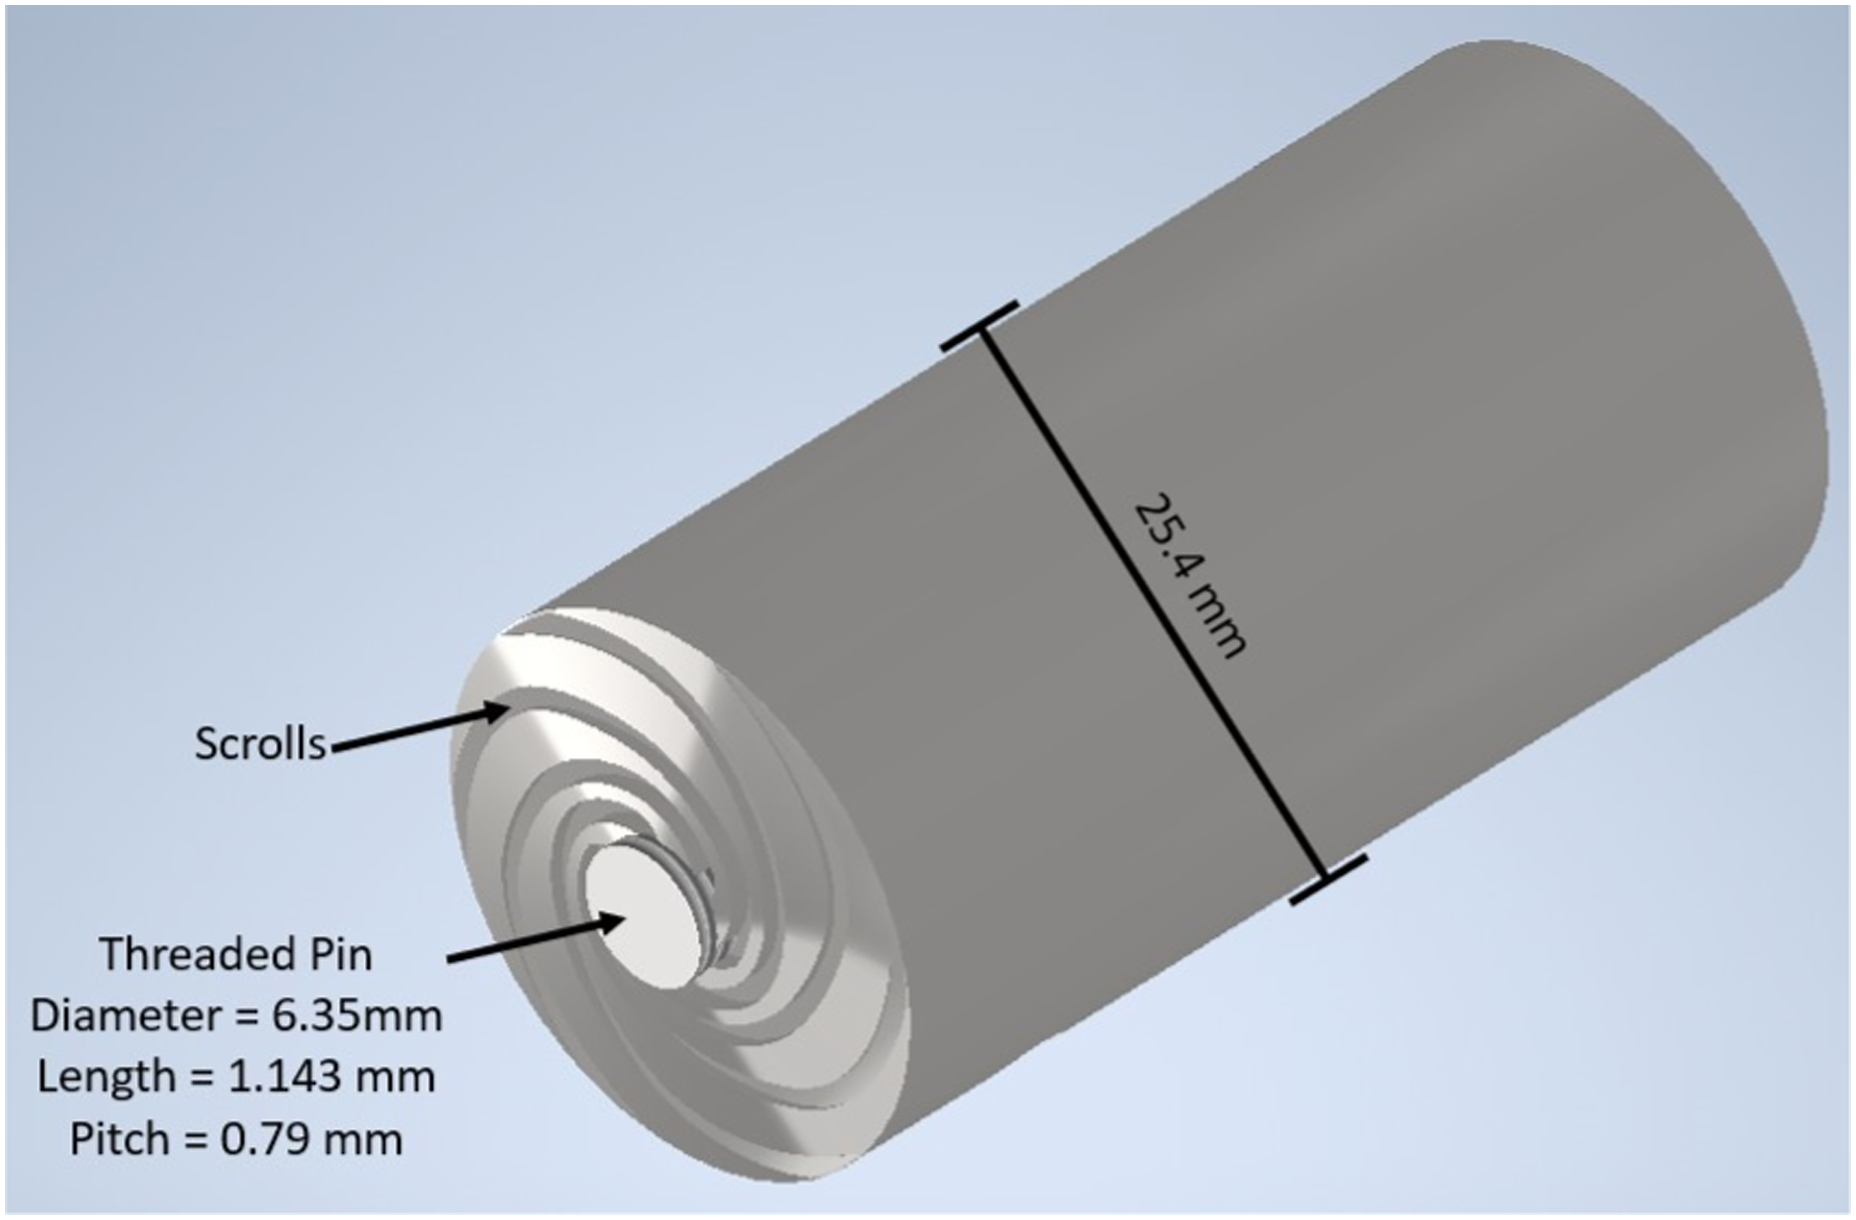
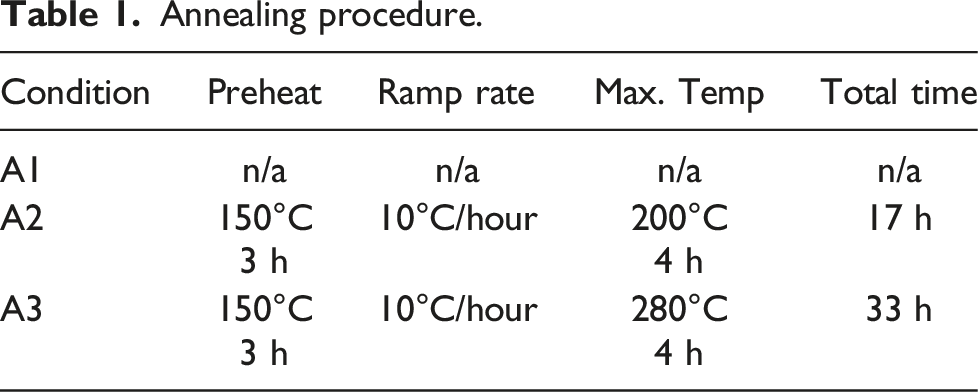
Annealing procedure
Annealing procedure.
Analysis
Imaging
Weld cross sections were polished down to 0.05 µm with alumina slurry. Polished cross sections were subjected to permanganic etching following the procedure outlined in Olley et al. 27 The procedure was modified by using a magnetic stirrer to agitate the etchant on submerged specimens rather than a bottle shaker. The etched cross sections were viewed under an optical microscope and an FEI FEG Quanta 650 environmental scanning electron microscope (ESEM). Tensile fracture surfaces were also viewed in the ESEM. ESEM parameters include 10 Pa chamber pressure, 10.00 kV electron beam, and 3.0 spot size.
Thermal analysis
A TA Instruments Q600 SDT simulta-neously performed thermogravimetric analysis (TGA) and differential scanning calorimetry (DSC). TGA weight cali-bration and DSC heat flow calibration preceded experiment runs. Specimens approximately 5 mm in diameter were cut from the weld zone, allowing for precise selection of material to be used in TGA/DSC runs. Figure 2 shows the location of test specimens with respect to the weld piece. Nitrogen gas purged the specimens in the furnace with a flow rate of 50 mL/min. The temperature was increased at 10°C/min with a final temperature of 900°C. This final temperature was chosen since additional weight loss has been shown to cease at 900°C in similar PEEK polymers.
28
The final weight was used to calculate the weight % CF. Though Toray publishes a CF weight fraction in their composite,
29
highly localized DSC specimens cannot guarantee the published values. Specimen locations for XRD, thermal analysis, and mechanical testing.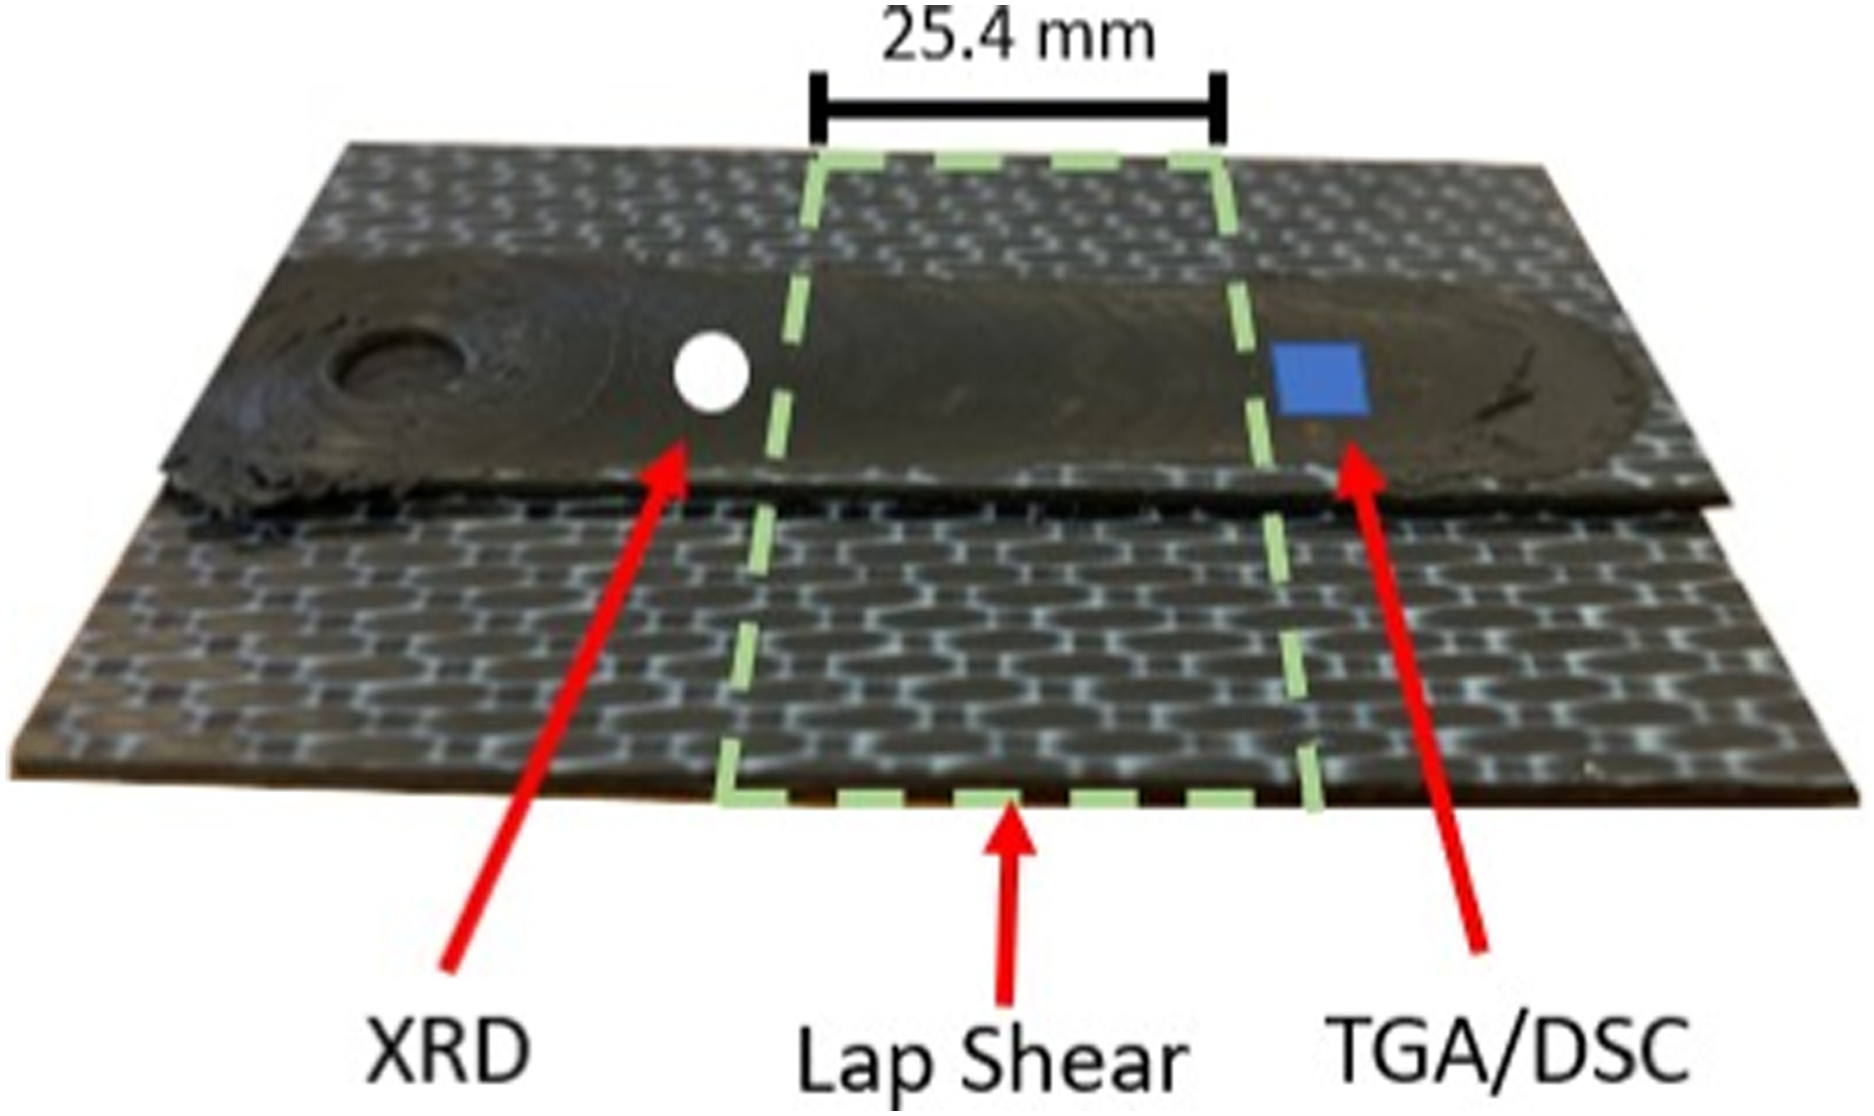
X-ray Diffraction
X-ray diffraction (XRD) was performed using a Rigaku Smart Lab powder XRD with a Cu K
α
source. Runs swept 2θ from 10°-50° on the weld surface of each annealing condition. An XRD run was also performed on a neat laminate specimen. XRD curves were analyzed using LIPRAS (Line Profile Analysis Software).
30
Diffraction peaks were fitted using Pseudo-Voigt profile functions. Crystallite size was calculated using the Scherrer Equation: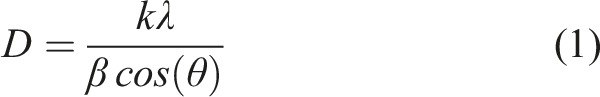
k is a correction factor (0.9 is sufficient 15 ), λ is the wavelength (1.5418 A˚ for Cu K α X-ray source), β is the full-width at half maximum (FWHM), and θ is the Bragg angle.
Mechanical testing
Mechanical testing consisted of single lap shear tests on an Instron load frame. 25.4 mm wide tensile specimens were cut at a minimum of 16 mm from the weld’s beginning location. CF pads adhered with abrasive paper accounted for the lapped material offset in the load frame’s jaws. All welds were pulled at 2 mm/min until failure. Nine single lap shear specimens were tested for each annealing condition.
Results and discussion
Visual analysis
All welds resemble the surface appearance observed in previous study.
11
Previous work using FSW to join CFRTP woven laminates states that refined fibers in the weld zone tend to orient along boundaries and have variable sizes dependent on their location.
11
These observations do make assumptions since the true fiber size and orientation is shielded by surrounding matrix. For example, a fiber cut on an angle may appear as an oblong particle in a polished cross section. Figure 3 shows a weld cross section prior to and after permanganic etching under an optical microscope. The etching removes some of the polymer at the surface without disrupting the fibers to partially expose them. Polarized light aids in distinguishing between the polymer and matrix. In Figure 3(b), speckled regions in the weld zone surround dark regions. The small bright spots correspond to fiber ends. Smaller fibers populated the dark regions before etching and were small enough to be released once the polymer was removed. Thus, the etched cross sections confirm claims made in the previous study that small particles populate the region deep in the weld zone.
11
Cross section of welded joint (a) pre-etching and (b) post-etching.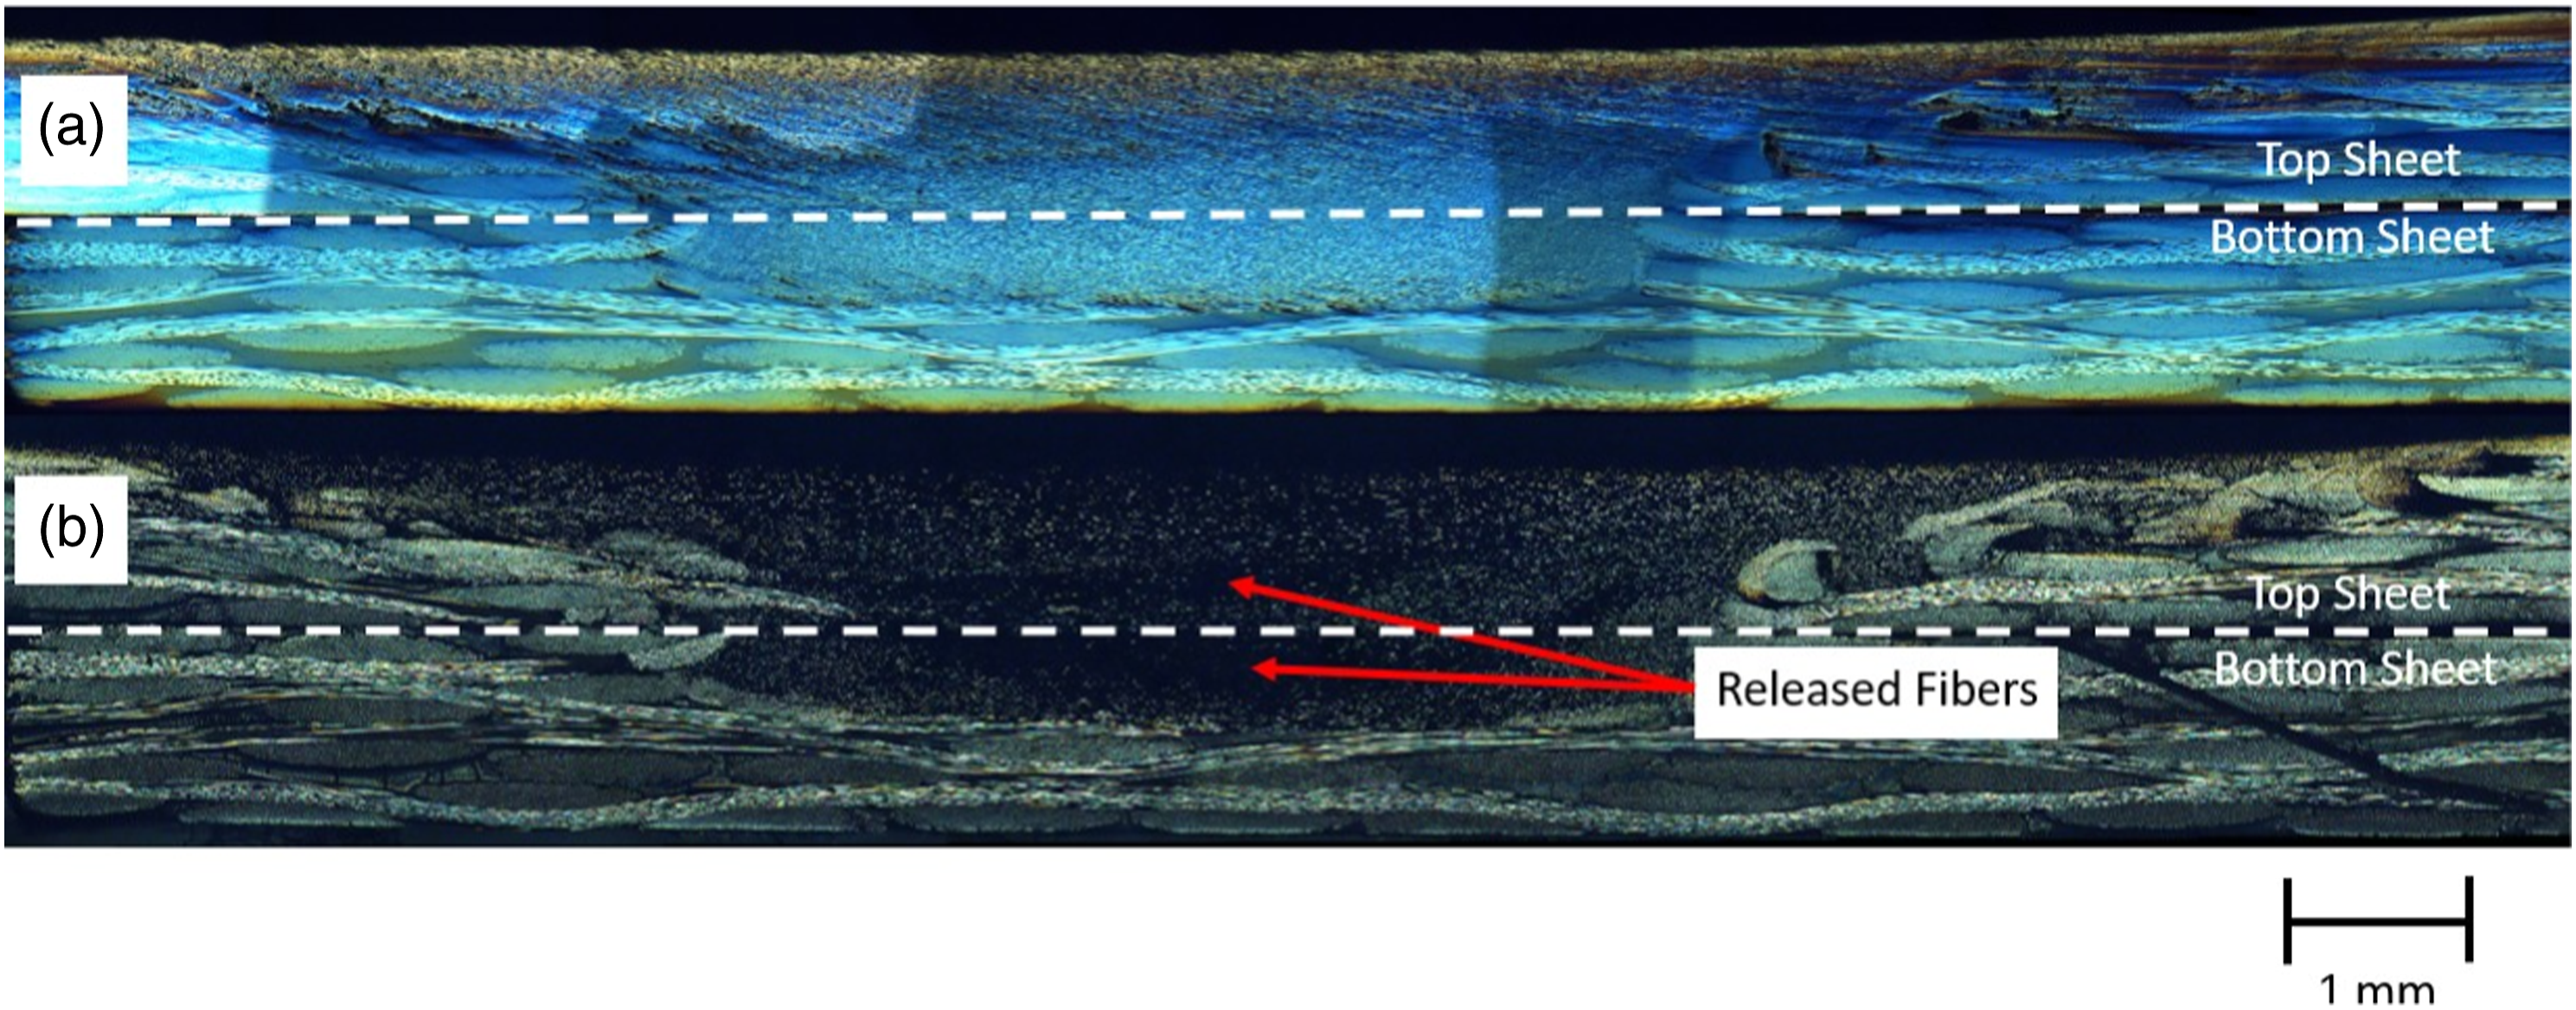
Figure 4 zooms in on the weld from Figure 3 under an SEM. The SEM provides a field of depth with the etched cross sections. At the boundary of the weld zone, the fibers orient into the page, or along the interface of the weld zone and base material. In the middle of the weld zone, the fibers tend to orient primarily across the weld zone tangent to the rotating tool. The revealed shape from CF exposure post-etching confirms the validity of those claims made in previous study.
11
Etched SEM cross sections at (a)weld zone boundary and (b) middle of weld zone.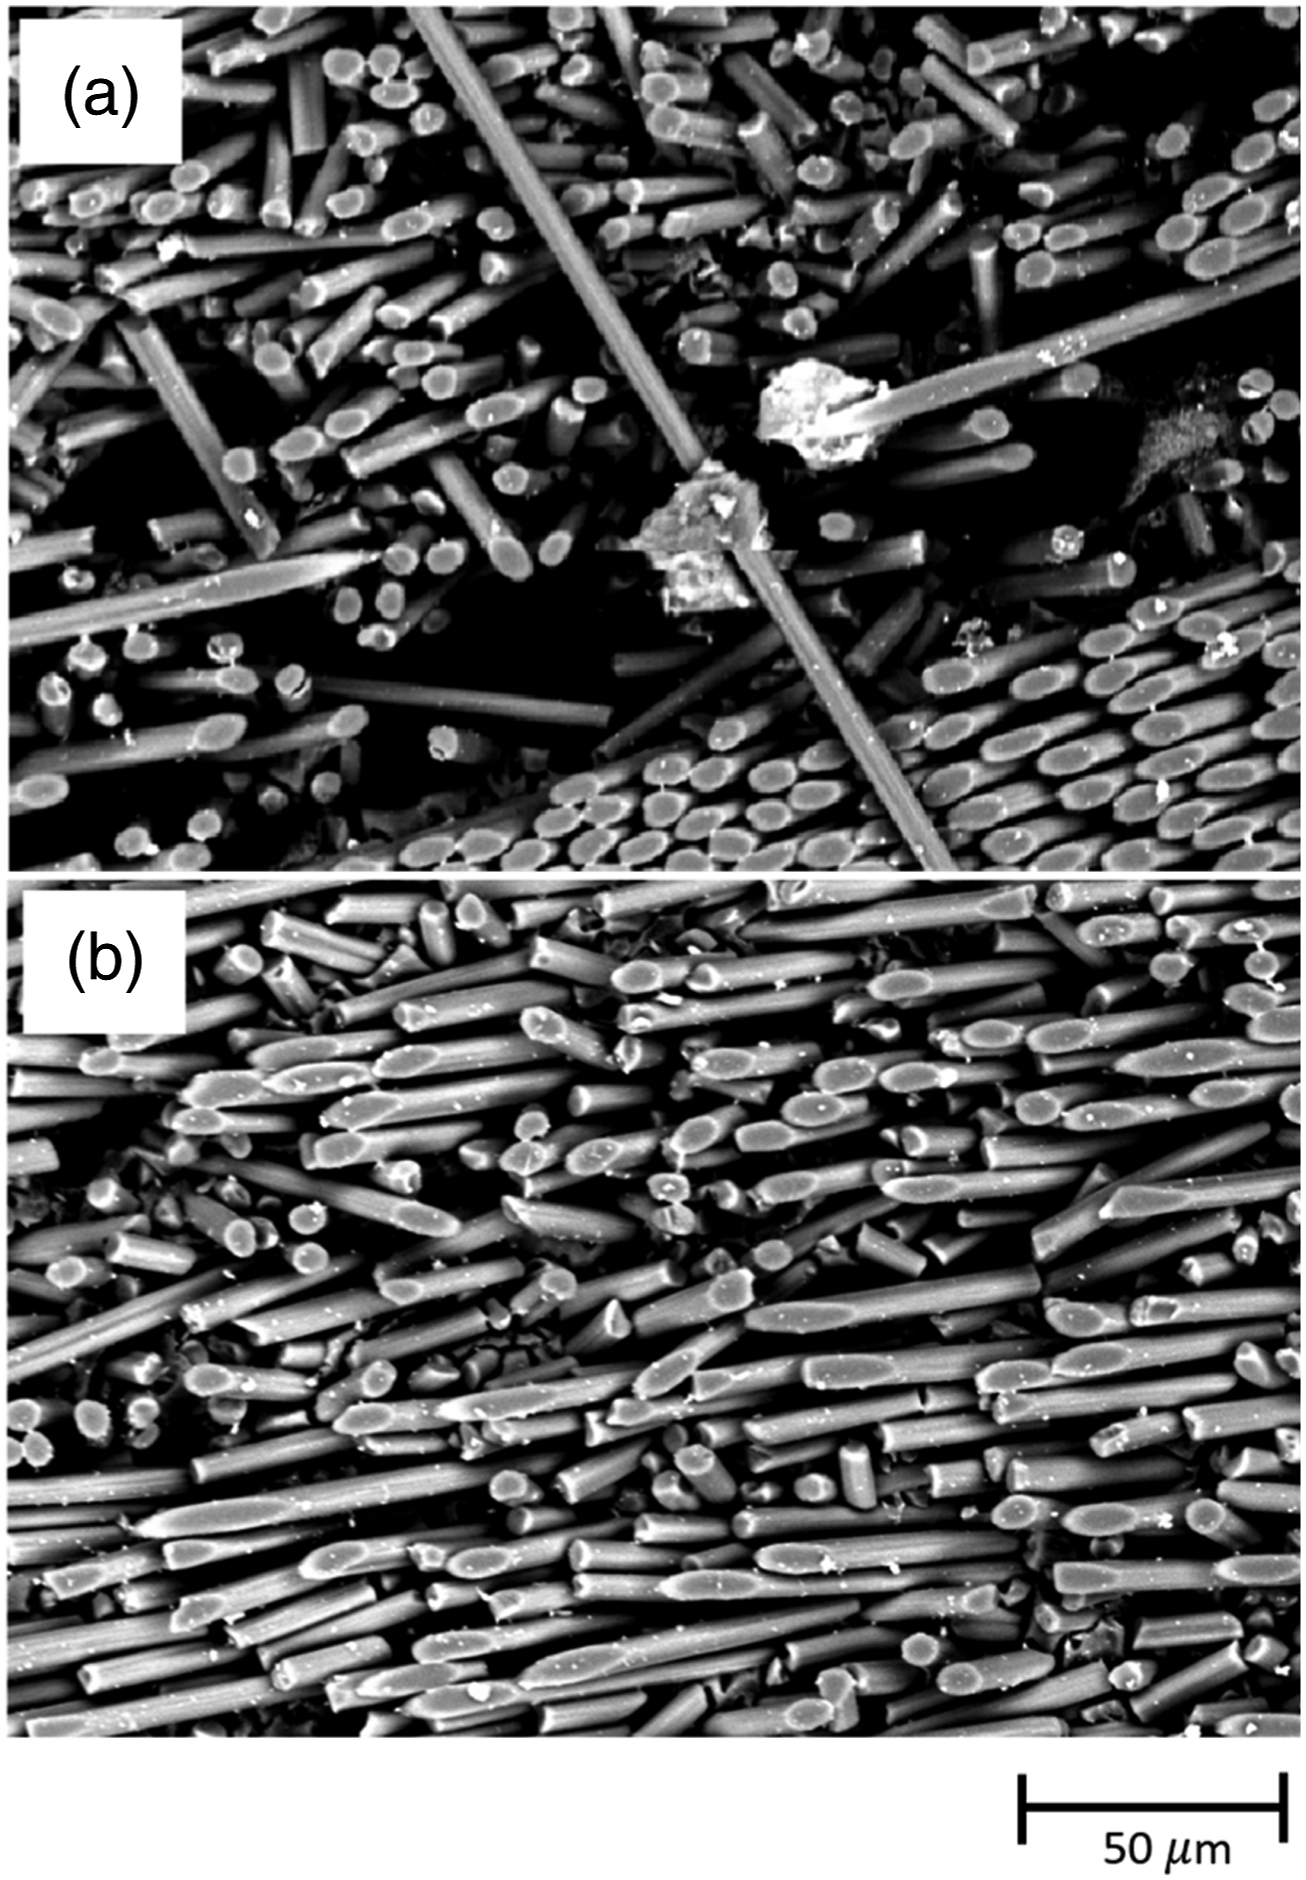
Figure 5 compares the composite surfaces outside of the weld zone for each annealing condition under polarized light. Conditions A1 (Figure 5(a)) and A2 (Figure 5(b) show sharp contrasts in color under polarized light with very little difference between them. Figure 5(c) does not show these color contrasts in condition A3 with an overall dull appearance which can also be observed upon visual inspection. The dull surface appearance in A3 results from oxidation at higher annealing temperatures.
19
Color variations between annealing conditions are not visible in specimen cross sections due to the lack of oxygen during annealing. A3 specimens also appear opaque compared A1 and A2 specimens in non-polarized light. Increased opaqueness in crystalline polymers often indicates higher degrees of crystallinity since crystallites can scatter visible light.
15
Degree of crystallinity is not the sole metric for a polymer’s transparency. After all, many opaque polymers, such as acrylonitrile butadiene styrene (ABS), come in non-transparent forms. Poly 4-methyl pentene-1, though highly crystalline, is transparent since the crystallites are too small to scatter visible light. Rather, the degree of homogeneity greatly influences a polymer’s transparency,
31
and the increased crystallinity of A3 specimens improves homogeneity. Top Surfaces of annealing conditions (a) A1 (b) A2 (c) A3. Scale bar applies to all subfigures.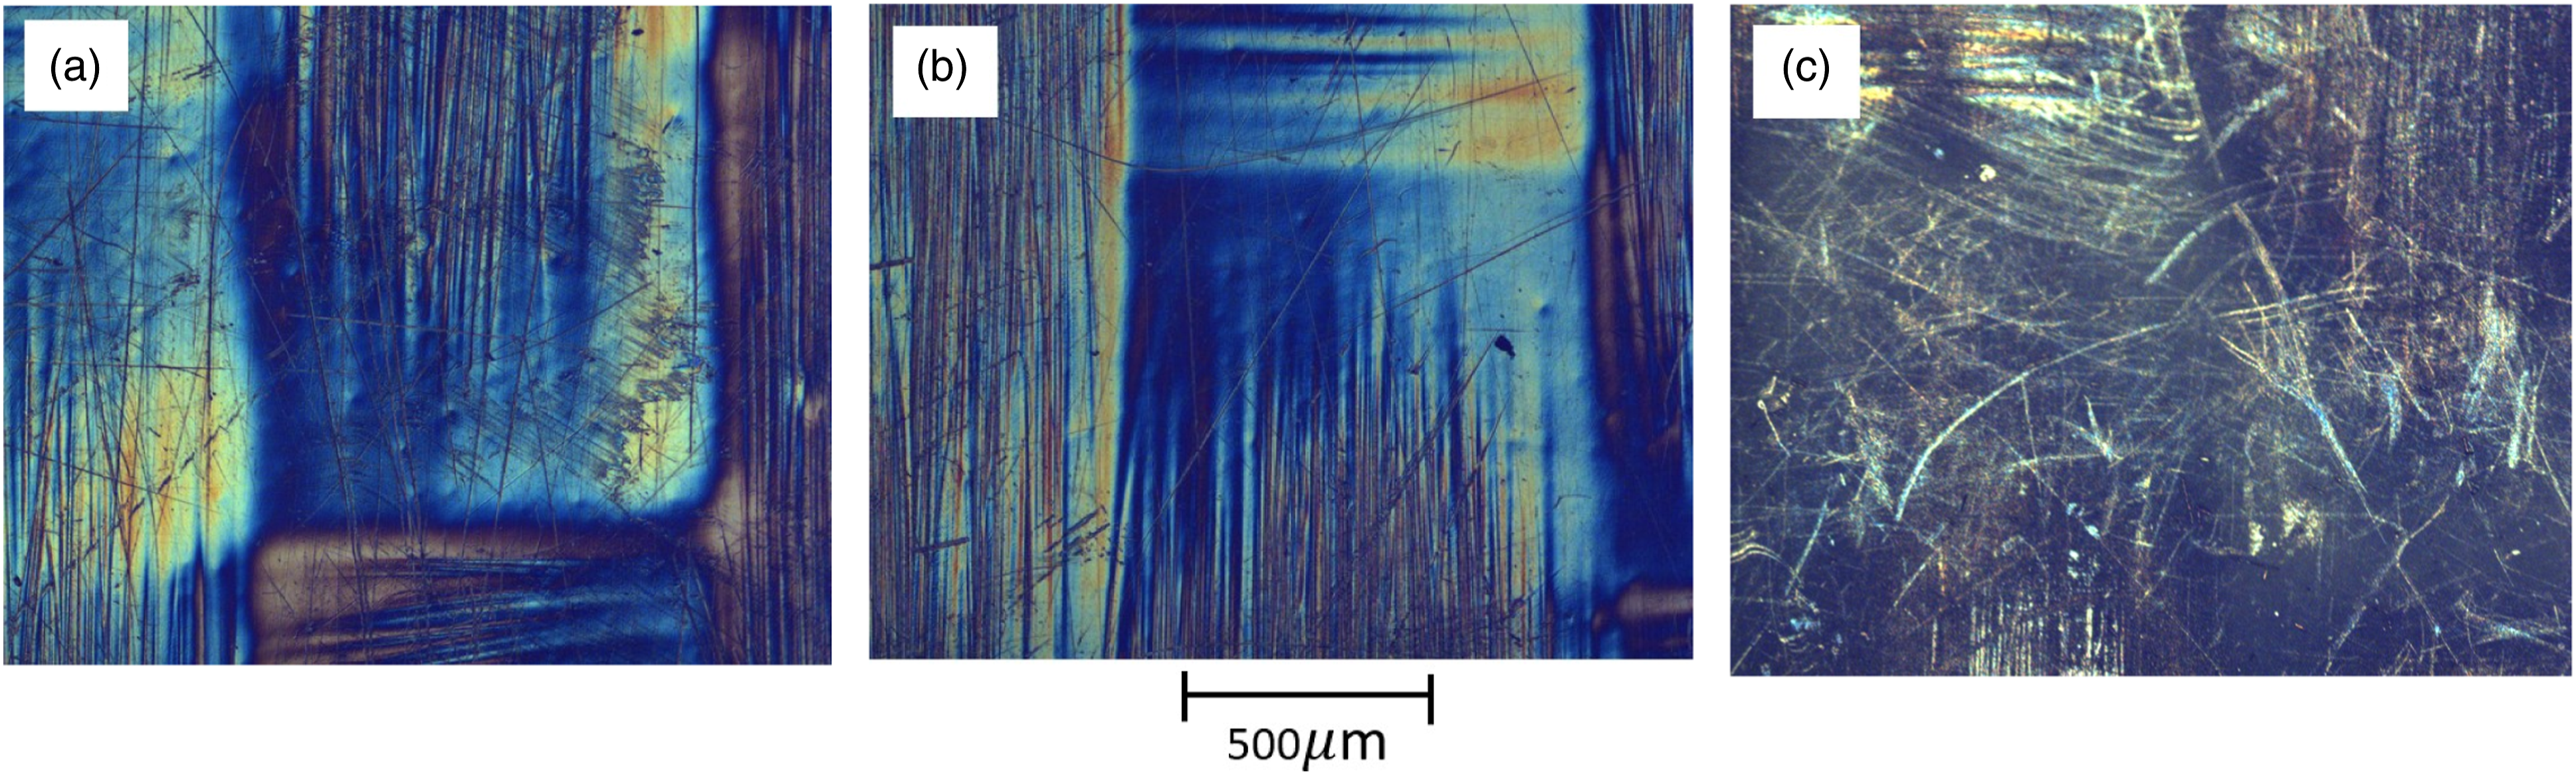
Figure 6 shows defects in the polymer matrix in cross sections of A1 and A3 specimens. Insufficient heating during FSW causes low matrix mobility and uneven cooling rates that leads to void formation.5,32 Lower processing temperatures along the retreating side (RS) of the weld and lack of swept material forging along the backside of the tool contribute to pronounced defects in this region as well.
33
Highly eccentric filler materials such as short carbon fibers also make it difficult for the molten polymer to fully encapsulate them and exasperate formation of defects.
34
Voids visible in weld cross section specimens in conditions (a) A1 and (b) A3.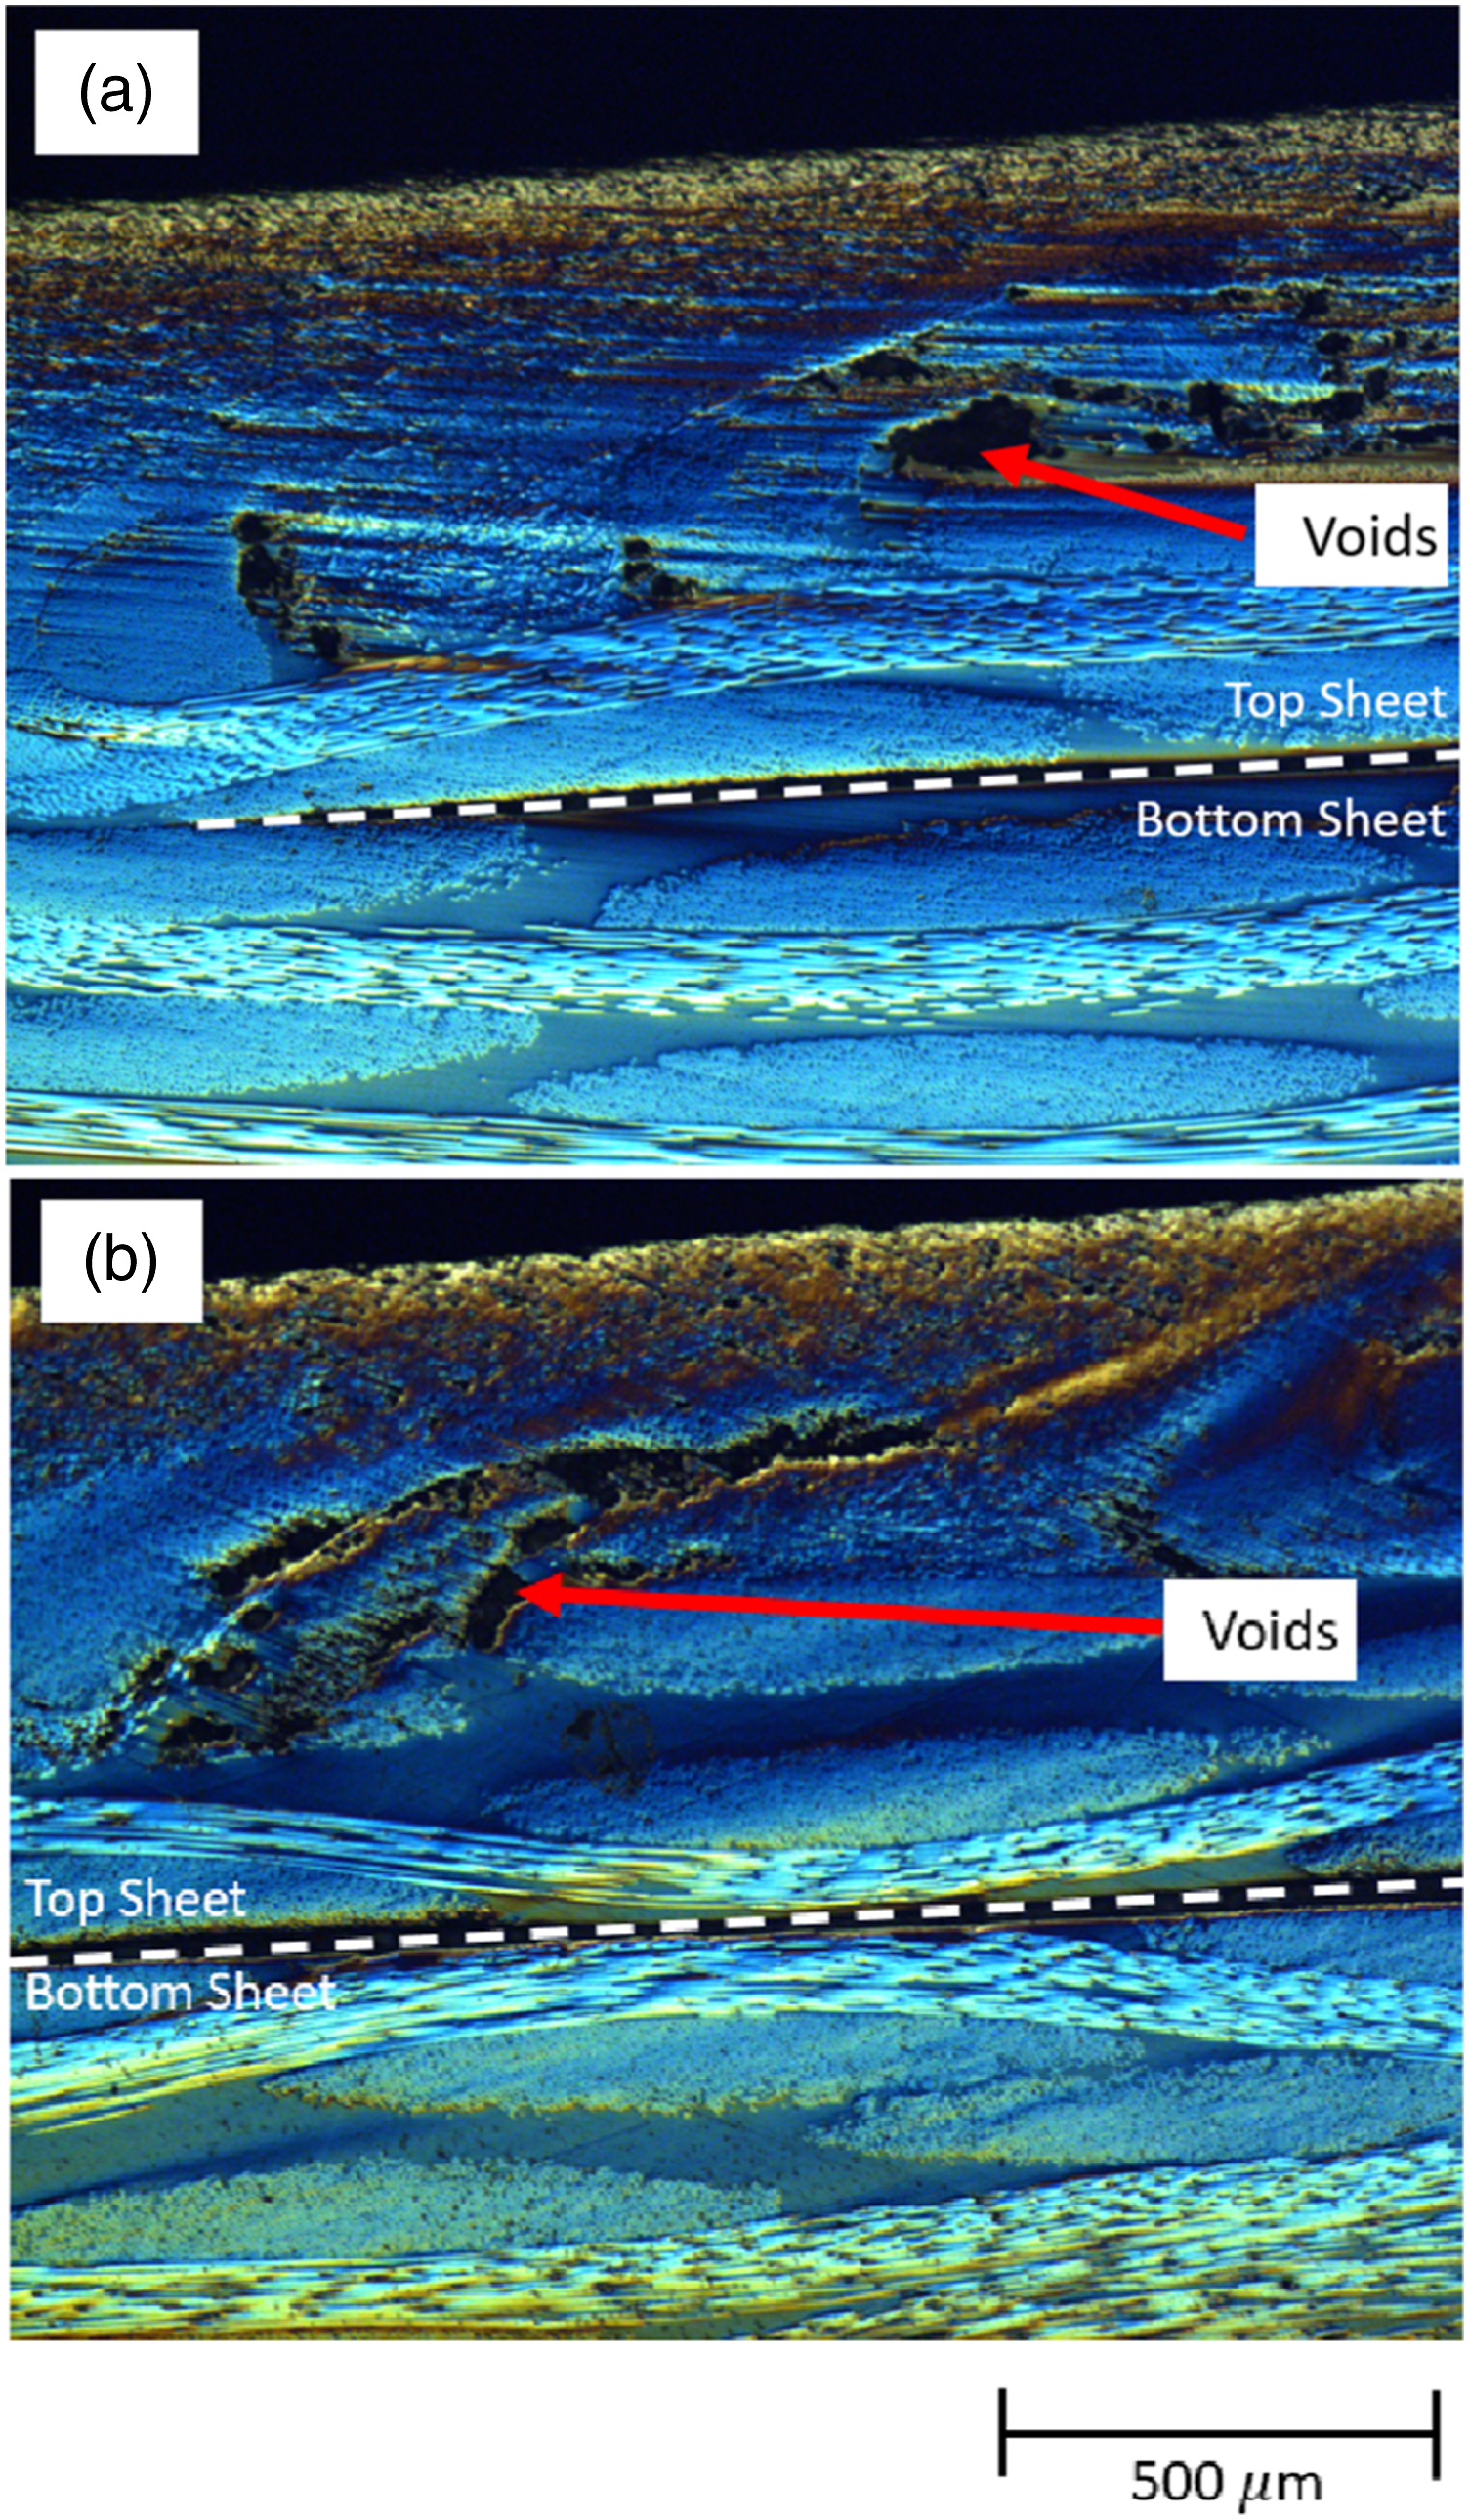
Annealing has been shown to reduce the porosity in CFRTP especially in 3D printed parts. Yu et al. report that annealing reduced overall porosity by 41.40% in printed CF reinforced PEEK annealed at 240°C, though individual pore size increased. The mechanism for pore reduction is combination of voids at high annealing temperatures which can travel to the surface and expel from the composite. 21 This phenomenon does not appear to occur in the FSW joints. No significant difference arises in the number of small pores between FSW annealing conditions. The largest voids in the welded specimens form near clusters of long fibers, especially those that protrude across the base material/weld zone boundary. Handwerker et al. observed a similar phenomenon in PA6 reinforced with continuous glass fibers. In their study, large pores formed between long fiber strands and were resistant to expulsion during the annealing process. 20 Thus it appears that void mitigation must be addressed in the FSW process, as post-weld annealing does not annihilate these defects.
Though ineffective at removing pores in the matrix, post-weld annealing does have a pronounced effect on adhesion between the matrix and fibers. Figure 7 shows fracture surfaces of specimens pertaining to each annealing condition under an SEM. Figure 7(a) shows fracture surfaces of an A1 condition. The fiber surfaces are nearly stripped clean of polymer indicating adhesive failure and weak fiber/matrix interface. A similar trend presents itself in the A2 condition with adhesive failure on the fiber/matrix interface. Figure 7(b) shows polymer tearing with a smooth texture. In the A3 condition (Figure 7(c)), fractured fibers are nearly fully encapsulated in polymer with primarily cohesive failure. The high temperature annealed polymer also consists of a rough surface texture due to the increased crystallinity in the polymer. Fiber encapsulation and texture in A3 specimens suggests improvements to the fiber-matrix interface bond as well as overall bulk matrix strength.18,22,35–37 Fracture surfaces of annealing conditions under an SEM for (a) A1 (b) A2 (c) A3.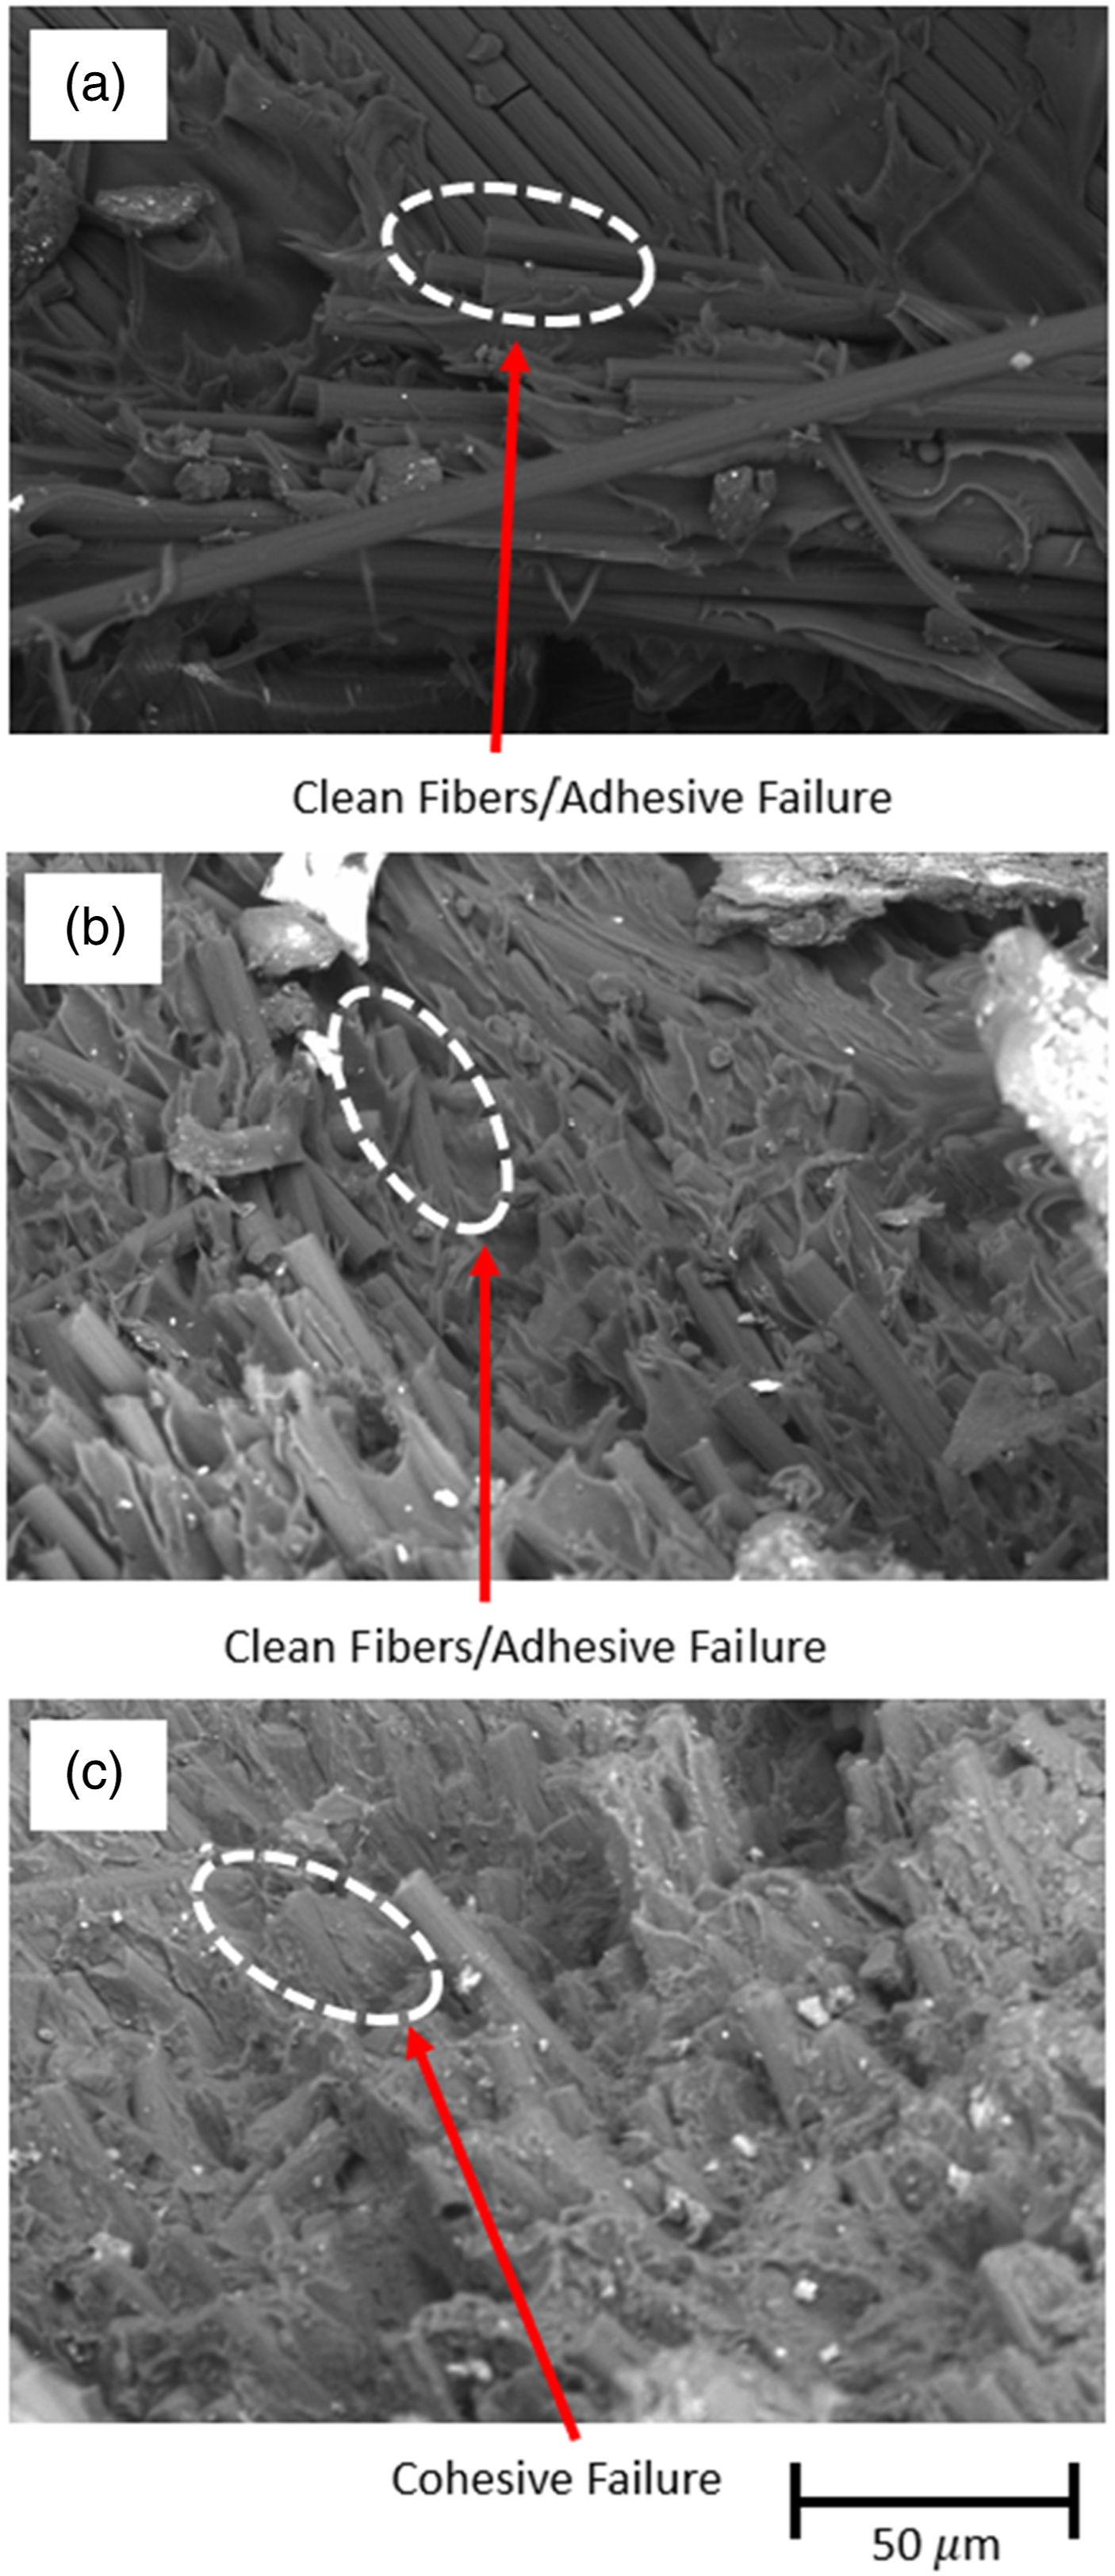
Thermal analysis
The base laminate sheet has 42% CF composition by weight according to Toray Advanced Composites,
29
but this weight fraction likely does not represent highly localized specimens in the weld zone disrupted by FSW. Thus, the weight fractions of CF and polymer in the composite are estimated using measured changes in mass caused by thermal degradation during TGA runs. Equation 2 expresses the weight fraction of carbon fiber in the composite: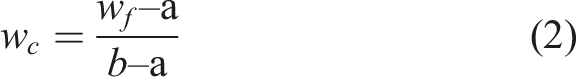
w c is the weight percent CF, w f is the total remaining composite weight fraction taken from the TGA curve, and a and b are the theoretical remaining post degradation weight fractions of pure polymer and CF, respectively. For T f = 900 ◦ C, a is estimated to be 0.48, 28 and b is estimated to be 0.96. 38 a was estimated based on PEEK thermal degradation since the literature for LMPAEK was not available at the time of this research. Due to the near identical local order of PEEK and LMPAEK, 24 similar maximum thermal degradation is assumed.
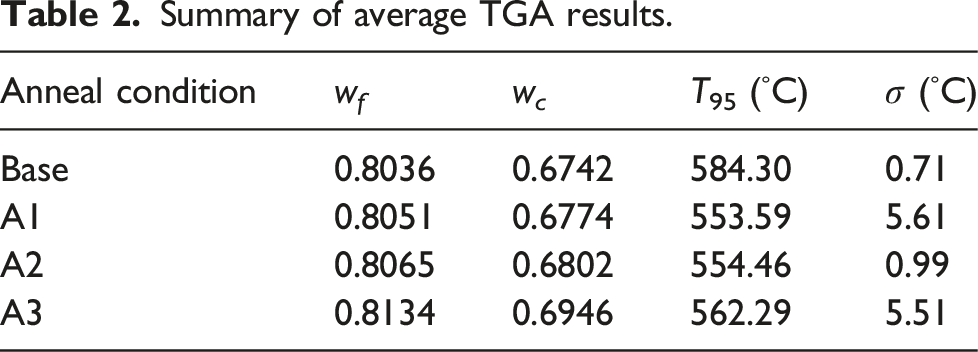
Summary of average TGA results.
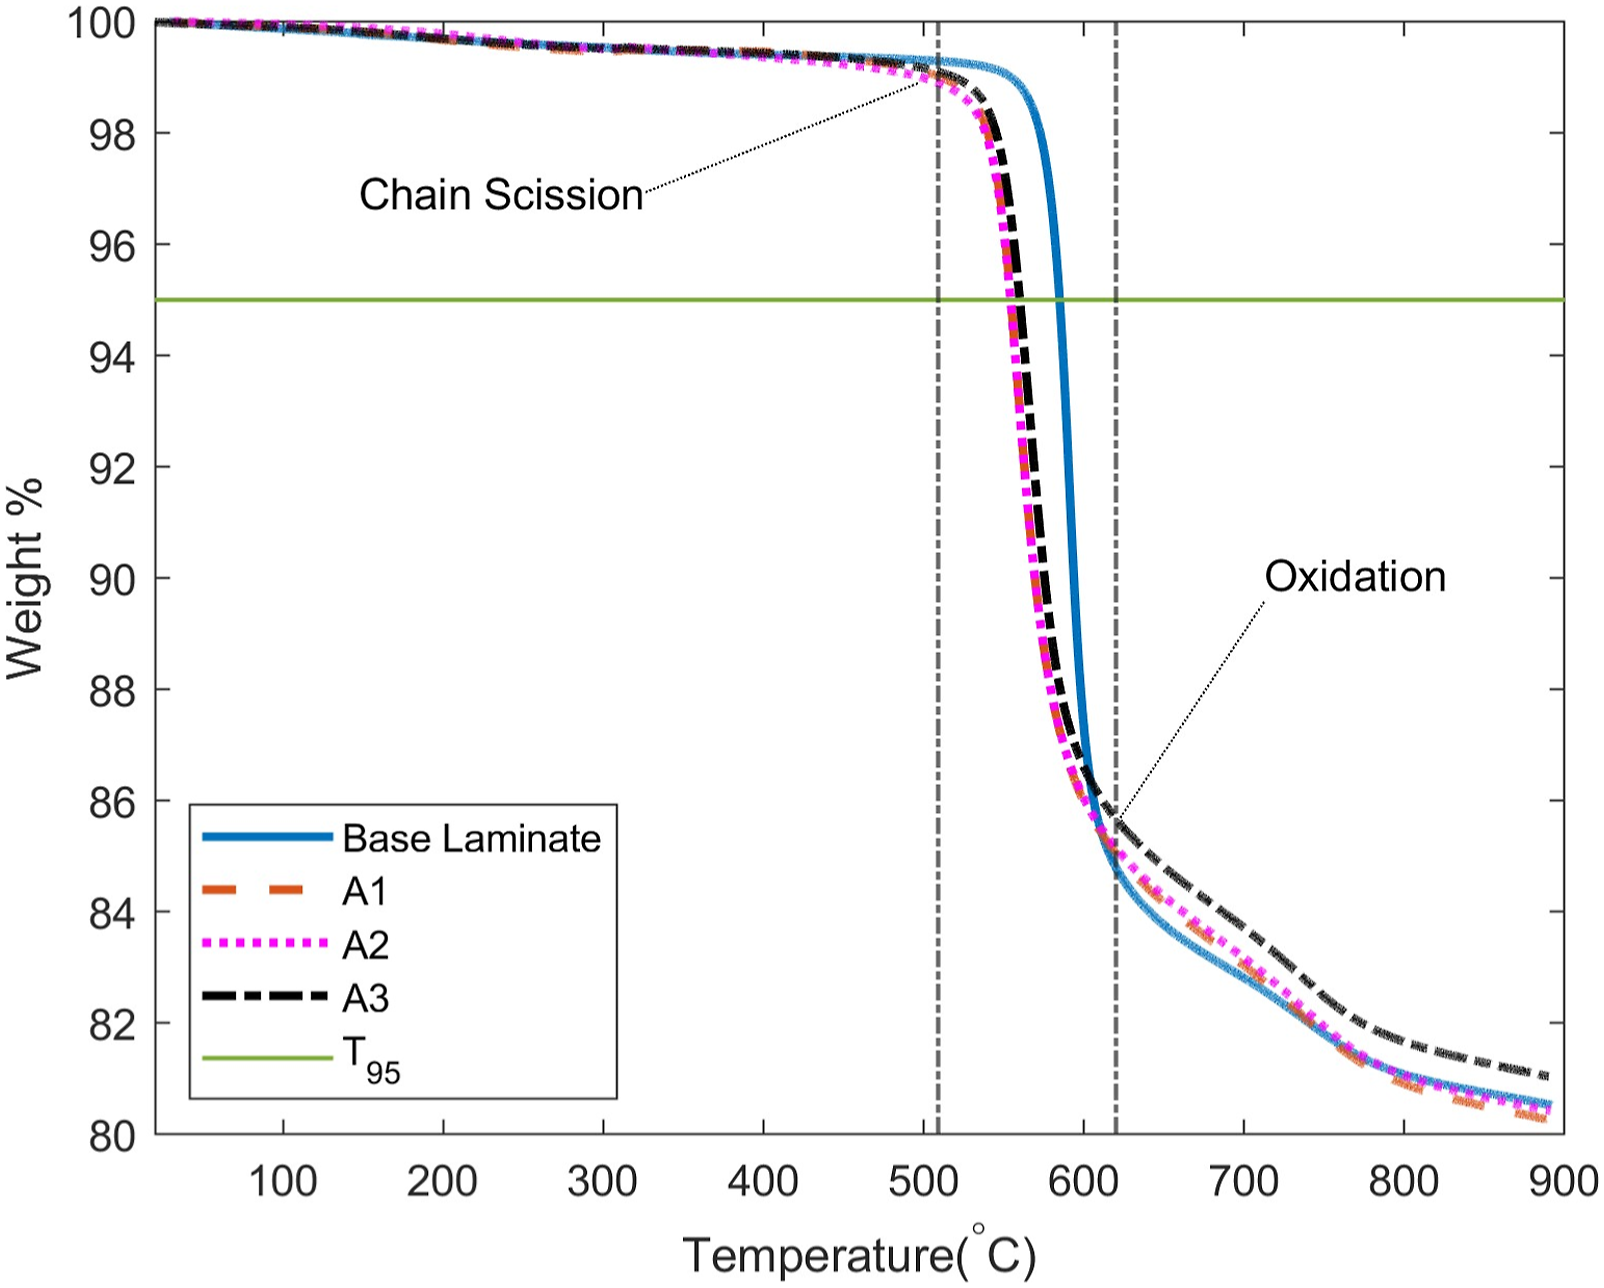
TGA curves for weld zones subject to each annealing condition.
All FSW specimens exhibit lower degradation temperatures than the base material. CF’s tend to increase degradation temperatures compared to neat polymers due to suppression of bulk heat transmission. 39 The woven fibers in the base material form pockets of polymers that further contribute to this suppression, while the chopped fibers in welded specimens no longer form these boundaries. A3 tends to have slightly higher degradation temperatures than A1 and A2, though these improvements are marginal.
Like PEEK, LMPAEK degrades in a two step process. Changes in the TGA curve slopes in Figure 8 reveal the degradation steps. The first step involved random chain scission of ether and ketone bonds indicated by a sharp linear drop in weight %. 40 The second step results from oxidation of carbonaceous char produced during the first step. 39 Flattening of the TGA curves at 900 ◦ C indicate completion of polymer degradation.
Figure 9 shows the DSC curves for each annealing condition and the non-annealed base material. Endotherms point upwards and exotherms point down. A distinct glass transition curve does not present itself in any of the specimen types. The lack of a distinct glass transition peak can be attributed to a high degree of crystallinity since the glass transition forms from the amorphous regions.
20
Table 3 summarizes the average peak melting points and crystallinity for specimens subject to each annealing condition. All specimens present a primary melting curve peak (Tm1) around 315
°
C. Annealing temperatures cause little shift in the peek primary melting point, which suggests little sensitivity of the primary crystal phase to both welding and annealing.41,42 A1 and A2 specimens show an additional endothermic curve at lower temperatures. Tm2 indicates the peeks of these curves. For A1, this occurs at approximately 20°C above the LMPAEK literature T
g
value of 147
◦
C.
29
For A2, the Tm2 lies approximately 38
◦
above the annealing temperature. These secondary peaks are attributed to the double melting behavior characteristic of polymers in the PAEK family resulting from reorganization of amorphous phases within smaller crystallites.24,42 Annealing has been shown to increase the peak of these secondary phases with higher annealing temperatures in LMPAEK.
24
Thus, specimens with higher degrees of crystallinity absorb the secondary phase curves within the primary curves. For this reason, the base material and A3 specimens do not present a secondary melting curve with the exception of one A3 specimen. DSC curves for weld zones subject to each annealing condition. Summary of average DSC results. aindicates measurable in one specimen.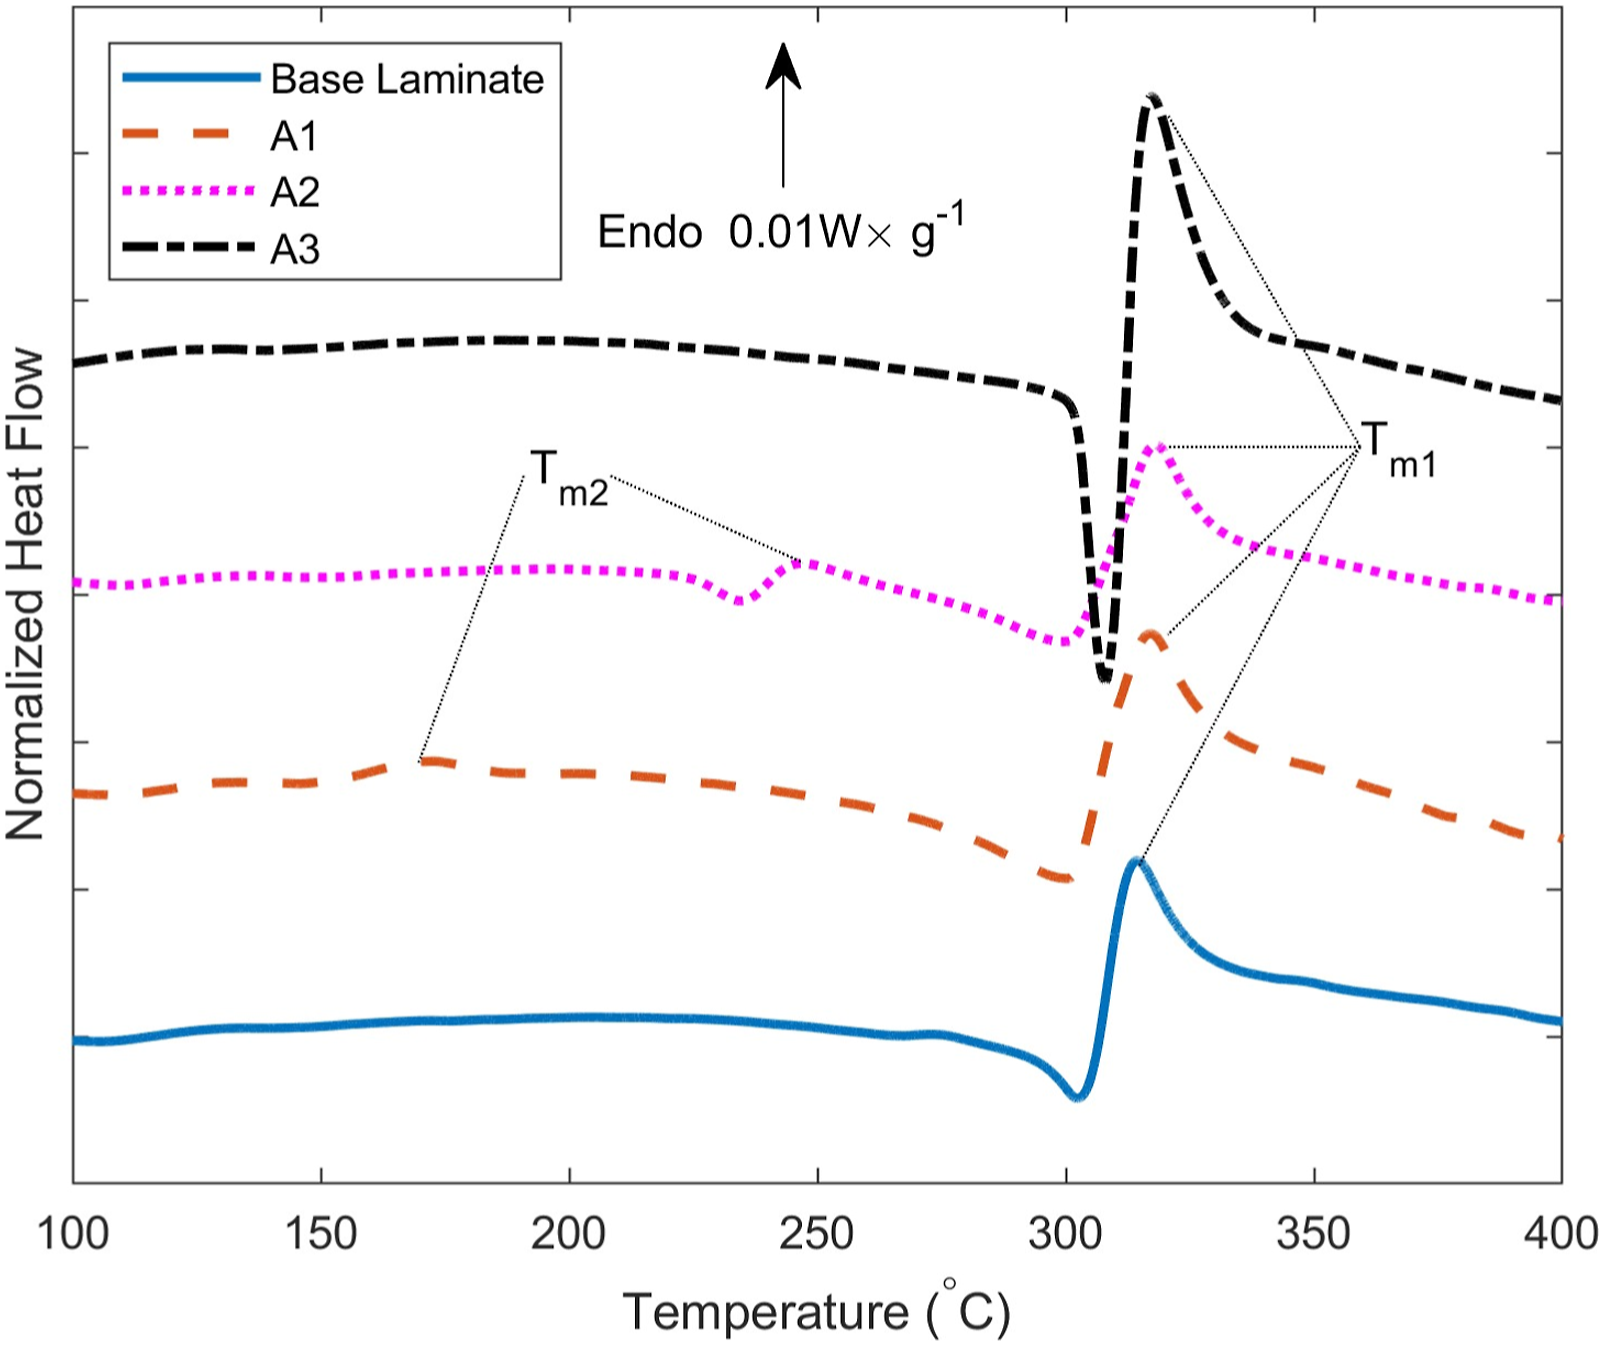
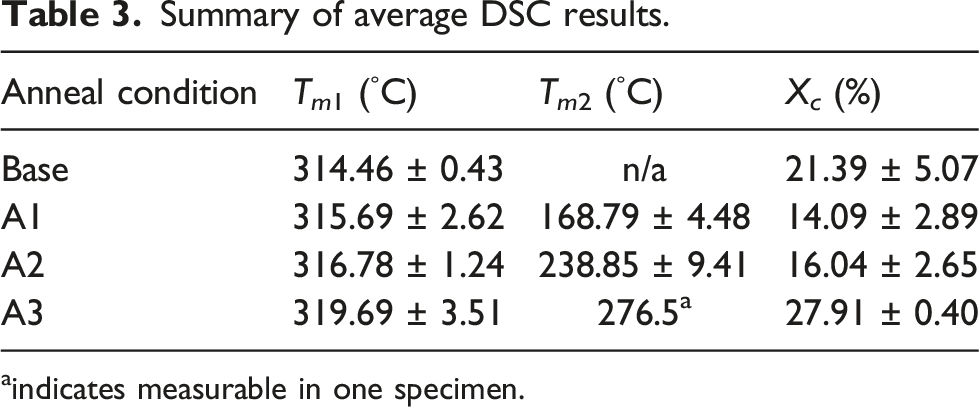
Equation (3) provides the means to calculate % crystallinity from DSC curves: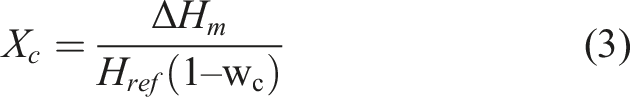
H m is the melting enthalpy calculated from the area under the curve with an extrapolated baseline. H ref is the maximum theoretical crystallization enthalpy (130 J/g ◦ C 25 ), and w c is the CF weight fraction. Table 3 displays the resulting % crystallinity for each annealing condition. A1 specimens have reduced crystallinity from the base material resulting from the rapid cooling during FSW. However, these specimens are not completely amorphous with a 14.09% crystalline content, demonstrating the rapid crystallization kinetics of LMPAEK. LMPAEK composites subject to tape layup achieve less than 10% crystallinity without post heat treatment. 25 FSW is has slower processing speeds two orders of magnitude than tape layup that provides additional time for the polymer to crystallize. A2 specimens have near negligible improvements to overall crystalline content, though the shifted and more pronounced secondary enthalpy curves and higher average crystalline content at 16.04% shows beginnings of such improvements. A3 specimens present crystalline content of 27.91% with significant improvements to A1 and A2 and surpasses the crystalline content of the base material.
The crystalline content of A3 specimens has been achieved in LMPAEK in other researchers as well. Audoit et al. reports a maximum LMPAEK crystallinity of 26% for specimens annealed at for 2 h at 250°C from the glass while the maximum crystallinity achieved from the melt was 27% in non-reinforced polymer. 24 Schiel et al. achieved 29.55% crystallinity in unidirectional reinforced tapes subject to tempering at 290°C for 17 h. 25 Thus, the available increased in crystallinity was exhausted in this study. Results from Audoit et al. and Schiel et al. also show that the overall processing time can be significantly reduced. Therefore, future study requires implementing effects of high temperature heat treatment for less duration to improve the overall manufacturing efficiency.
Lack of information on LMPAEK’s degradation behavior required assumptions based on those observed in PEEK to estimate the CF content. It appears from the conclusions in Audoit et al. that making such assumptions about LMPAEK’s degradation behavior are justified. Calculating the crystallinity fraction can vary depending on observation method. DSC tends to overestimate crystallinity. 43 Non-isothermal conditions during DSC allows the material to continue annealing while taking measurements. The DSC heating rate has a large influence on the degree to which further crystallization occurs. 44 The non-isothermal nature of DSC runs may overestimate crystallinity in A1 and A2 specimens. This possibility is not of concern for the purposes of this work, as clear imrovements arise from the A3 condition.
X-ray diffraction
Figure 10 shows the resulting normalized XRD curves for each annealing condition. Peaks at approximately 25
◦
and 43
◦
indicate the (002) and (101) planes of T300 CF.
38
Since the temperatures experienced during the annealing process are too low to alter the CF’s structure, the curves in Figure 10 are normalized to the intensity of the (002) peak. XRD curves.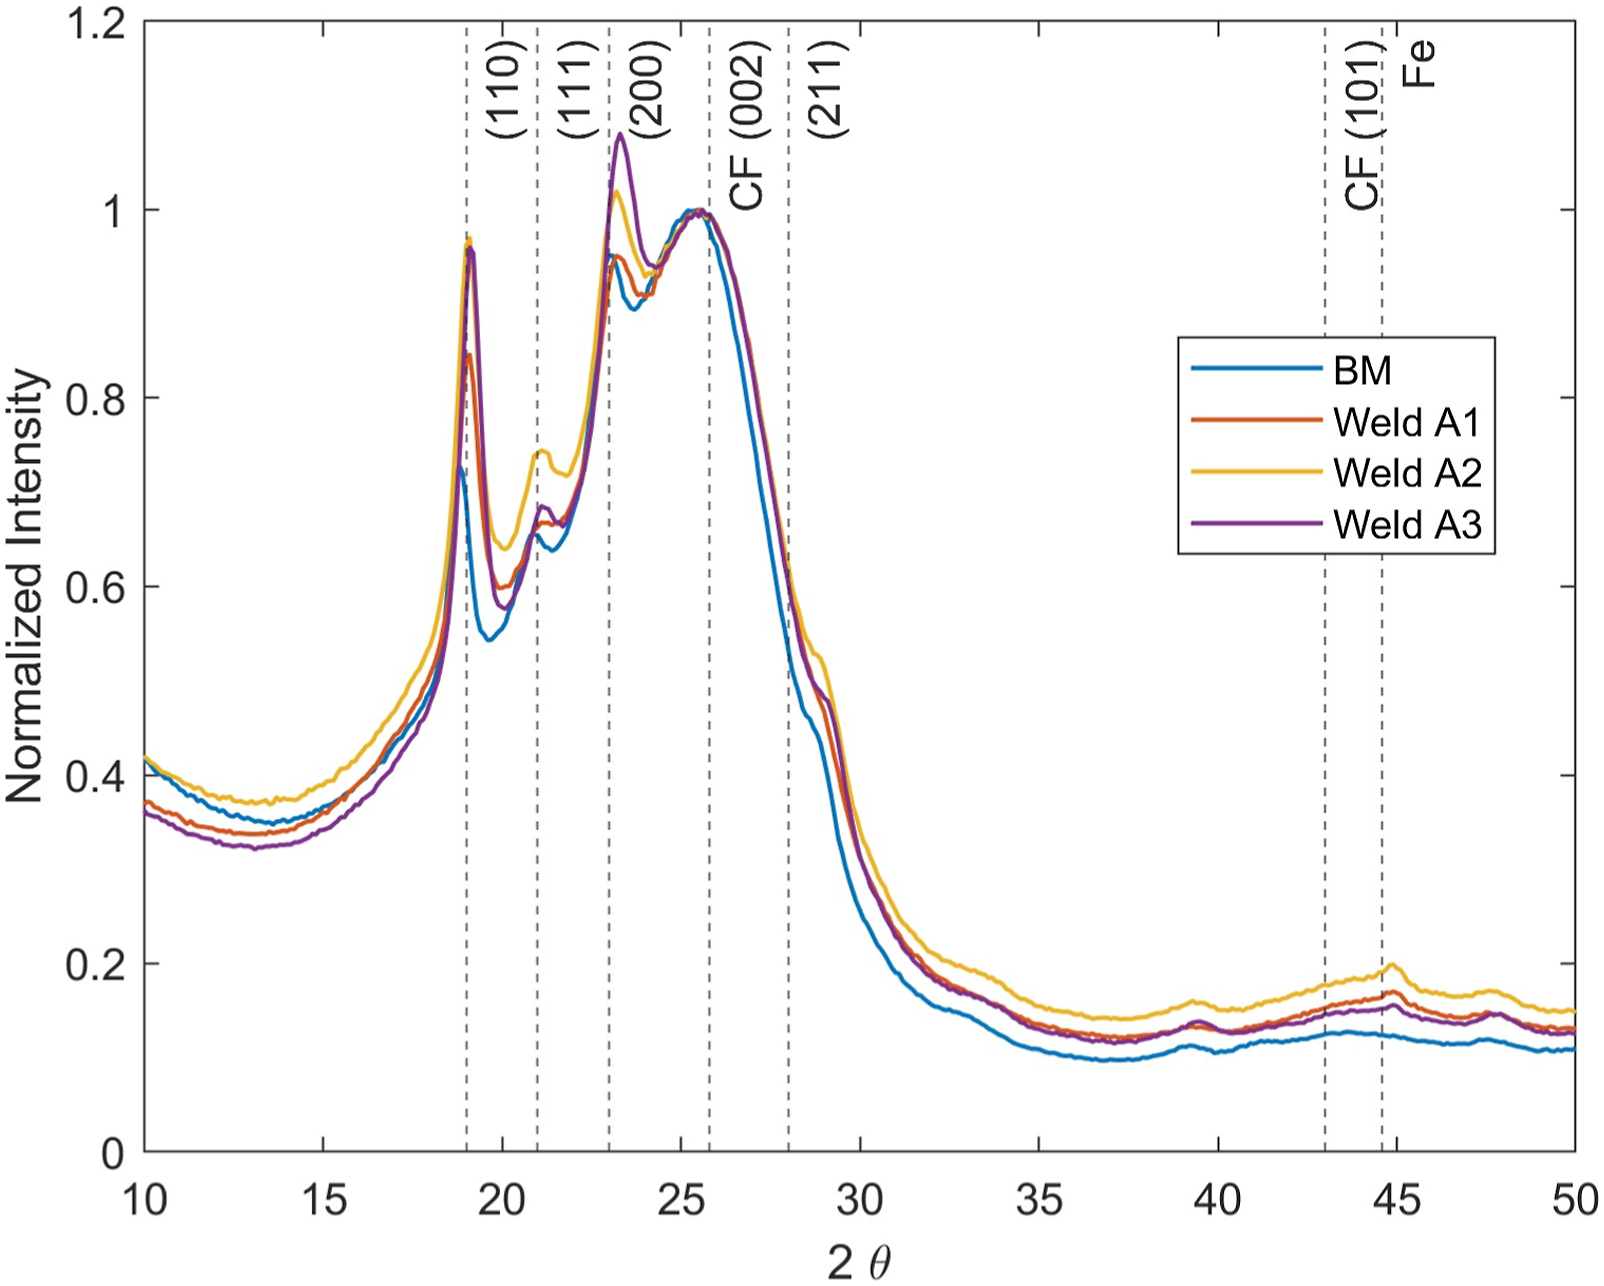
A peak at approximately 45 ◦ appears in the weld zones, but not the base material. An XRD peek at 44.6 ◦ corresponds to iron according to the Crystallography Open Database CODID 1100108, which indicates deposited material in the weld zone due to tool wear. Powder from these regions also reveal small particles exclusive to the weld zone with magnetic properties.
Four peaks at approximately 19°, 21°, 23°, and 28° correspond to the polymer matrix. These peaks match nearly perfectly to those found from PEEK XRD curves with an orthorhombic structure, indicative of the (110), (111), (200), and (211) crystal planes.
43
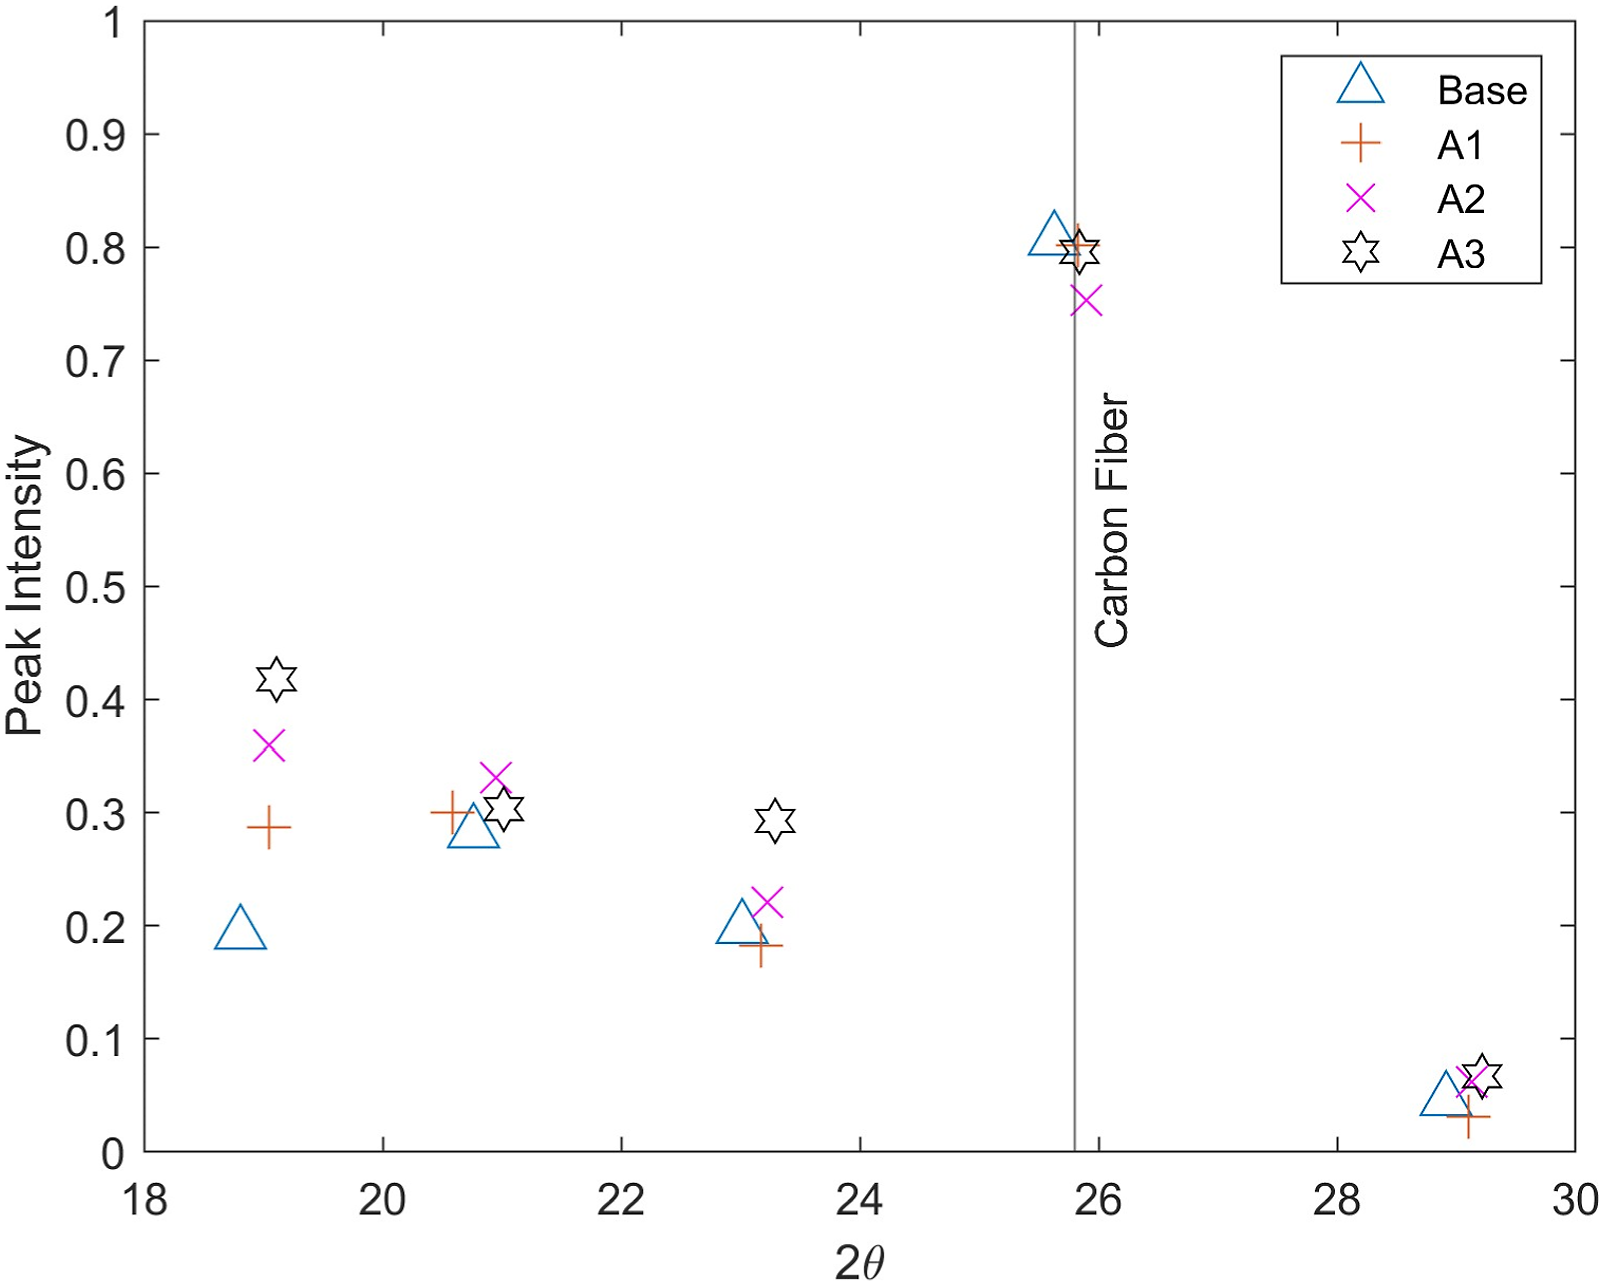
The XRD curves were deconstructed into individual diffraction peaks using LIPRAS. Figure 11 shows fitted curves corresponding to each crystalline peak in the A3 weld zone. Figure 12 plots the intensity of each peak. The CF peak intensity is consistent across each annealing condition, indicating that normalizing the XRD curves around the CF curve is adequate and confirming that the welding and heat treating processes do not change the CF’s crystalline structure. The intensity corresponding the (110) crystal plane increases from the base material with each annealing condition. The A3 condition provides the only noticable contribution to the (200) crystal plane. The increased intensity of these crystal planes may indicated more preferred orientation in a transcrystalline layer near the fiber/matrix interface.
45
Deconstructed A3 XRD curve using Pseudo-Voigt fits for each diffraction peak. (a) Deconvoluted XRD curves with background and observation and (b) Deconvoluted XRD curves with background removed. Peak intensities for each diffraction peak.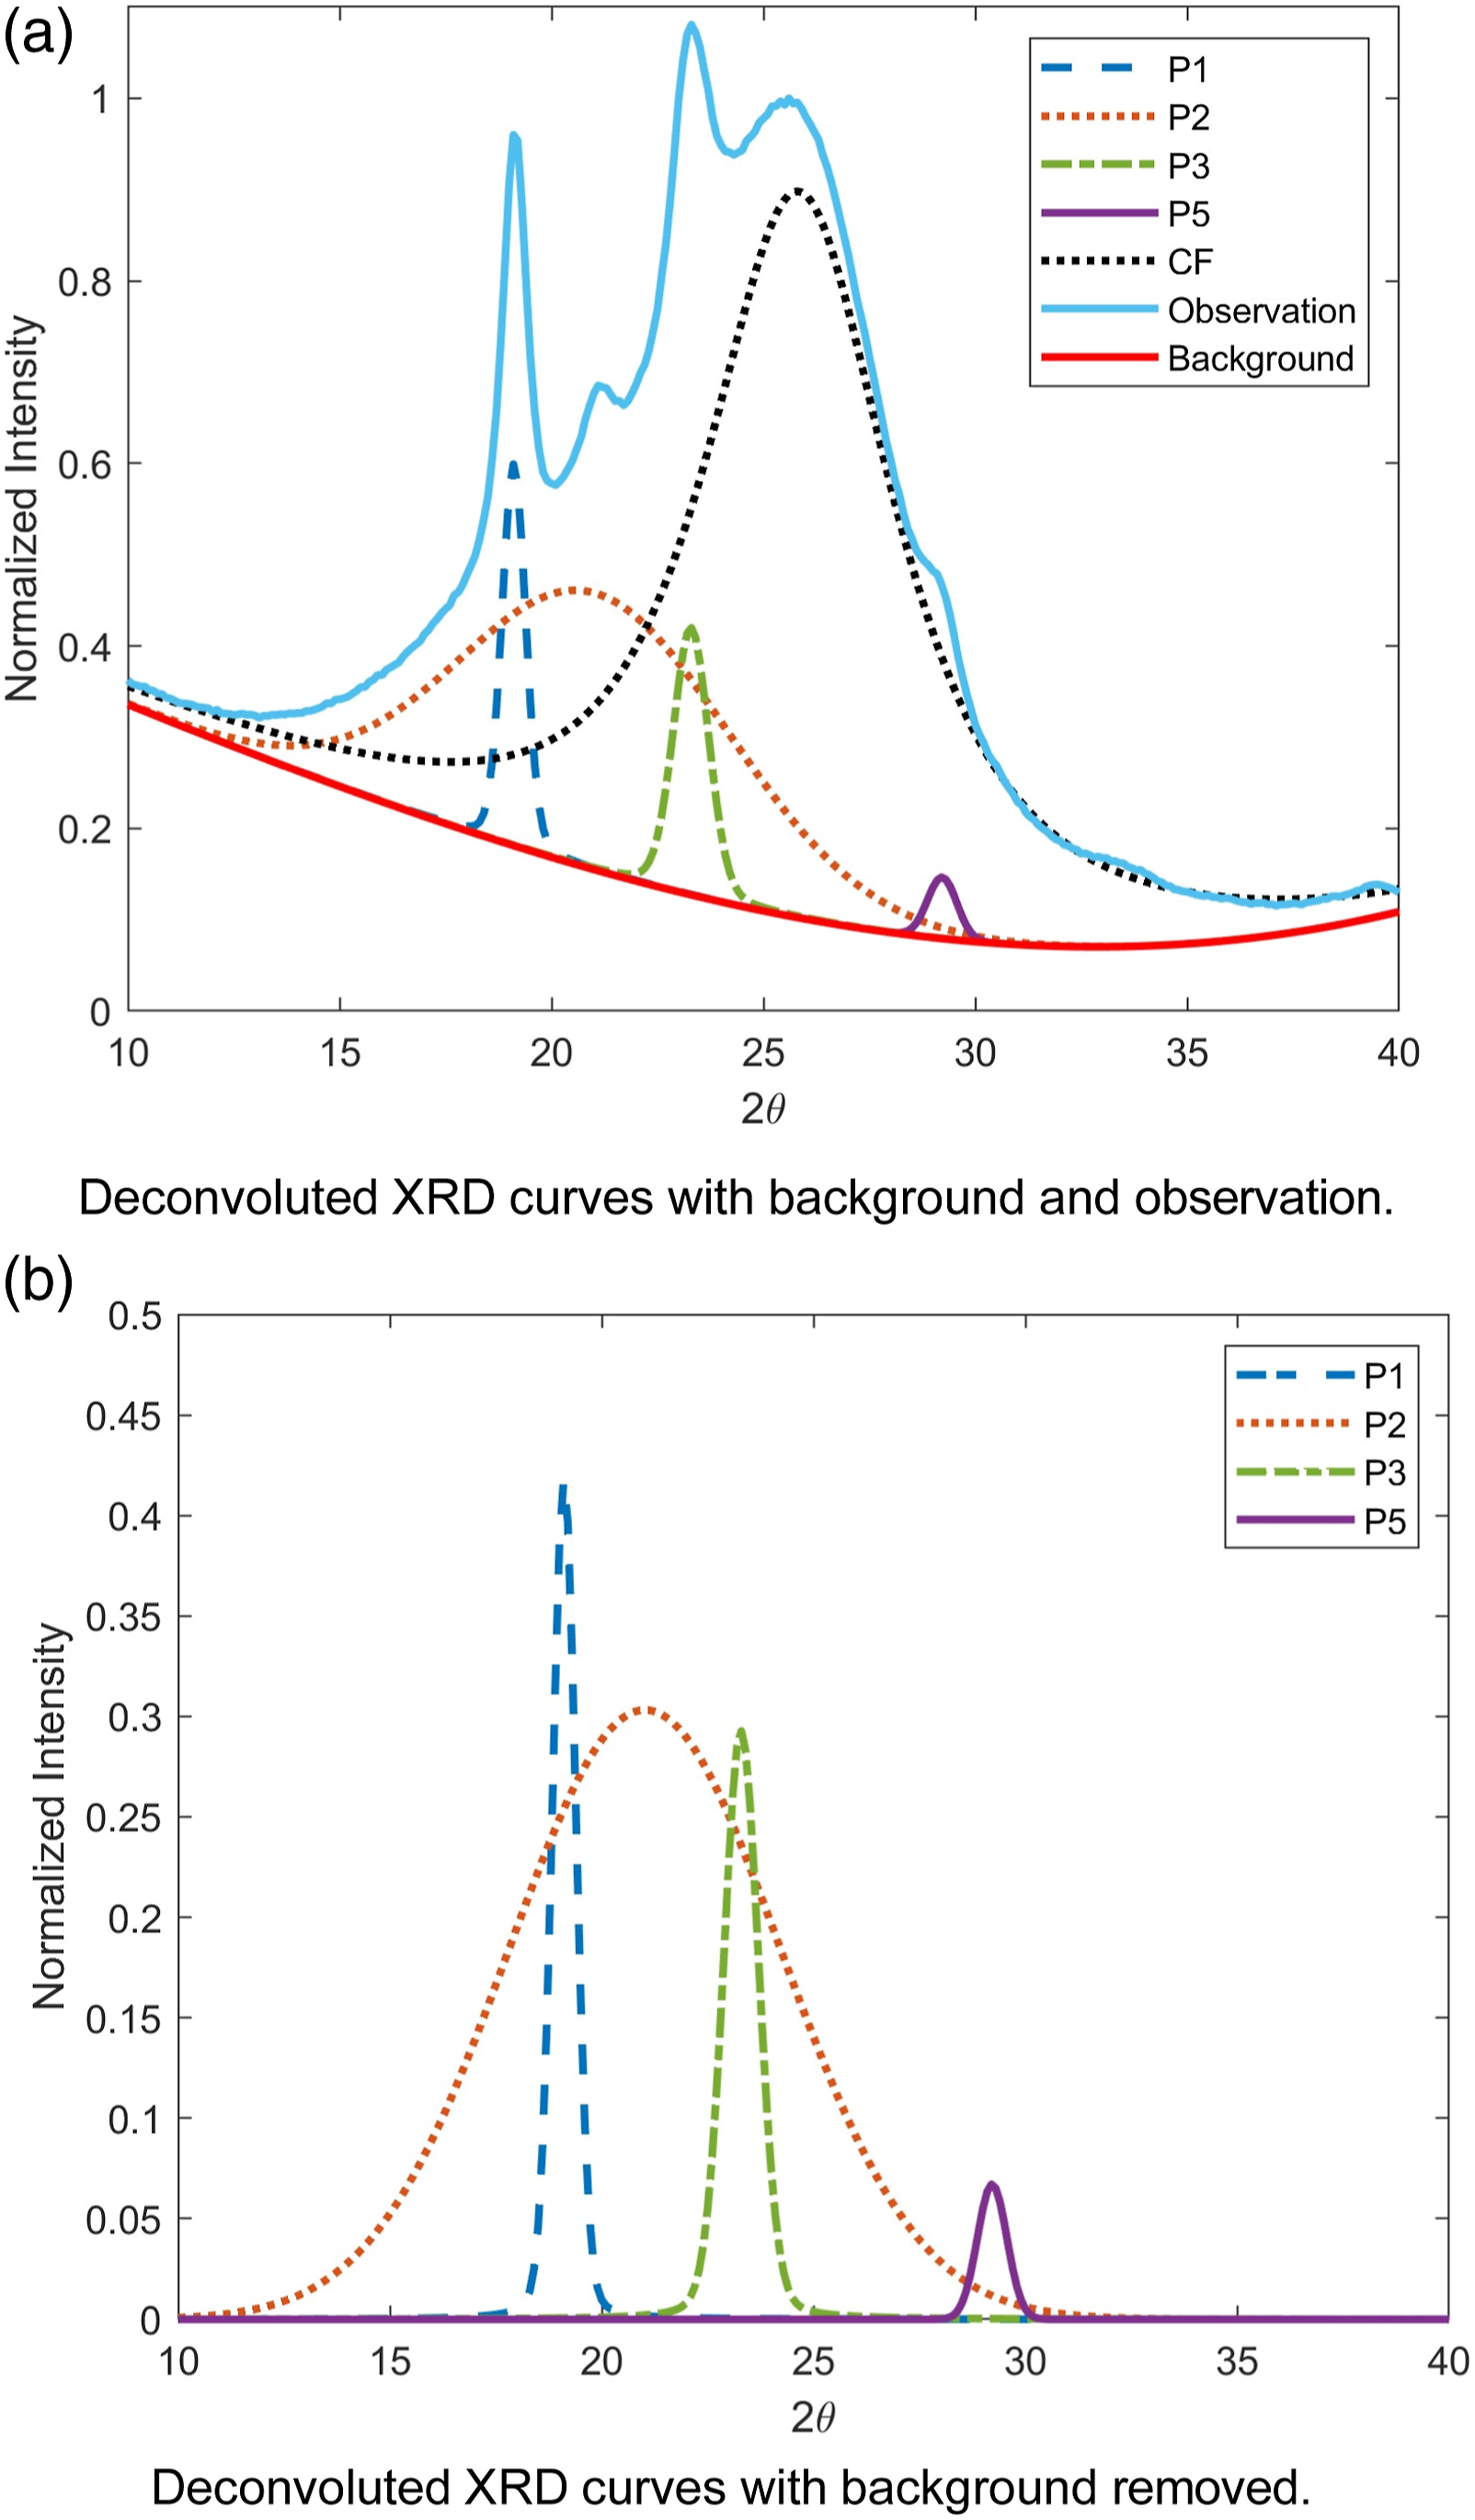
FSW shifts all of corresponding polymer peaks to the right by an average of 0.30 ◦ compared to the base material with no significant alteration to the CF peak measured at 2θ = 25.8 ◦ . Incorporation of fibers does not change the crystal form of PEEK.16,46 Therefore, shifts exclusive to the polymer peaks in welded specimens compared to the non-welded base material indicates that FSW slightly increases the unit cell spacing, resulting in a reduction in crystal packing.
Figure 13 reports the crystallite size for each peak under each annealing condition, calculated using equation (1). The A3 condition slightly increases the (110) and (200) crystal sizes. FSW reduces the (211) crystal size in all annealing conditions. The XRD curves suggest that FSW and post-weld annealing provide change to LMPAEK’s crystal structure. More notably though, is that the XRD curves confirm the structural similarity between LMPAEK and PEEK. Crystallite size calculated by the Scherrer Formula.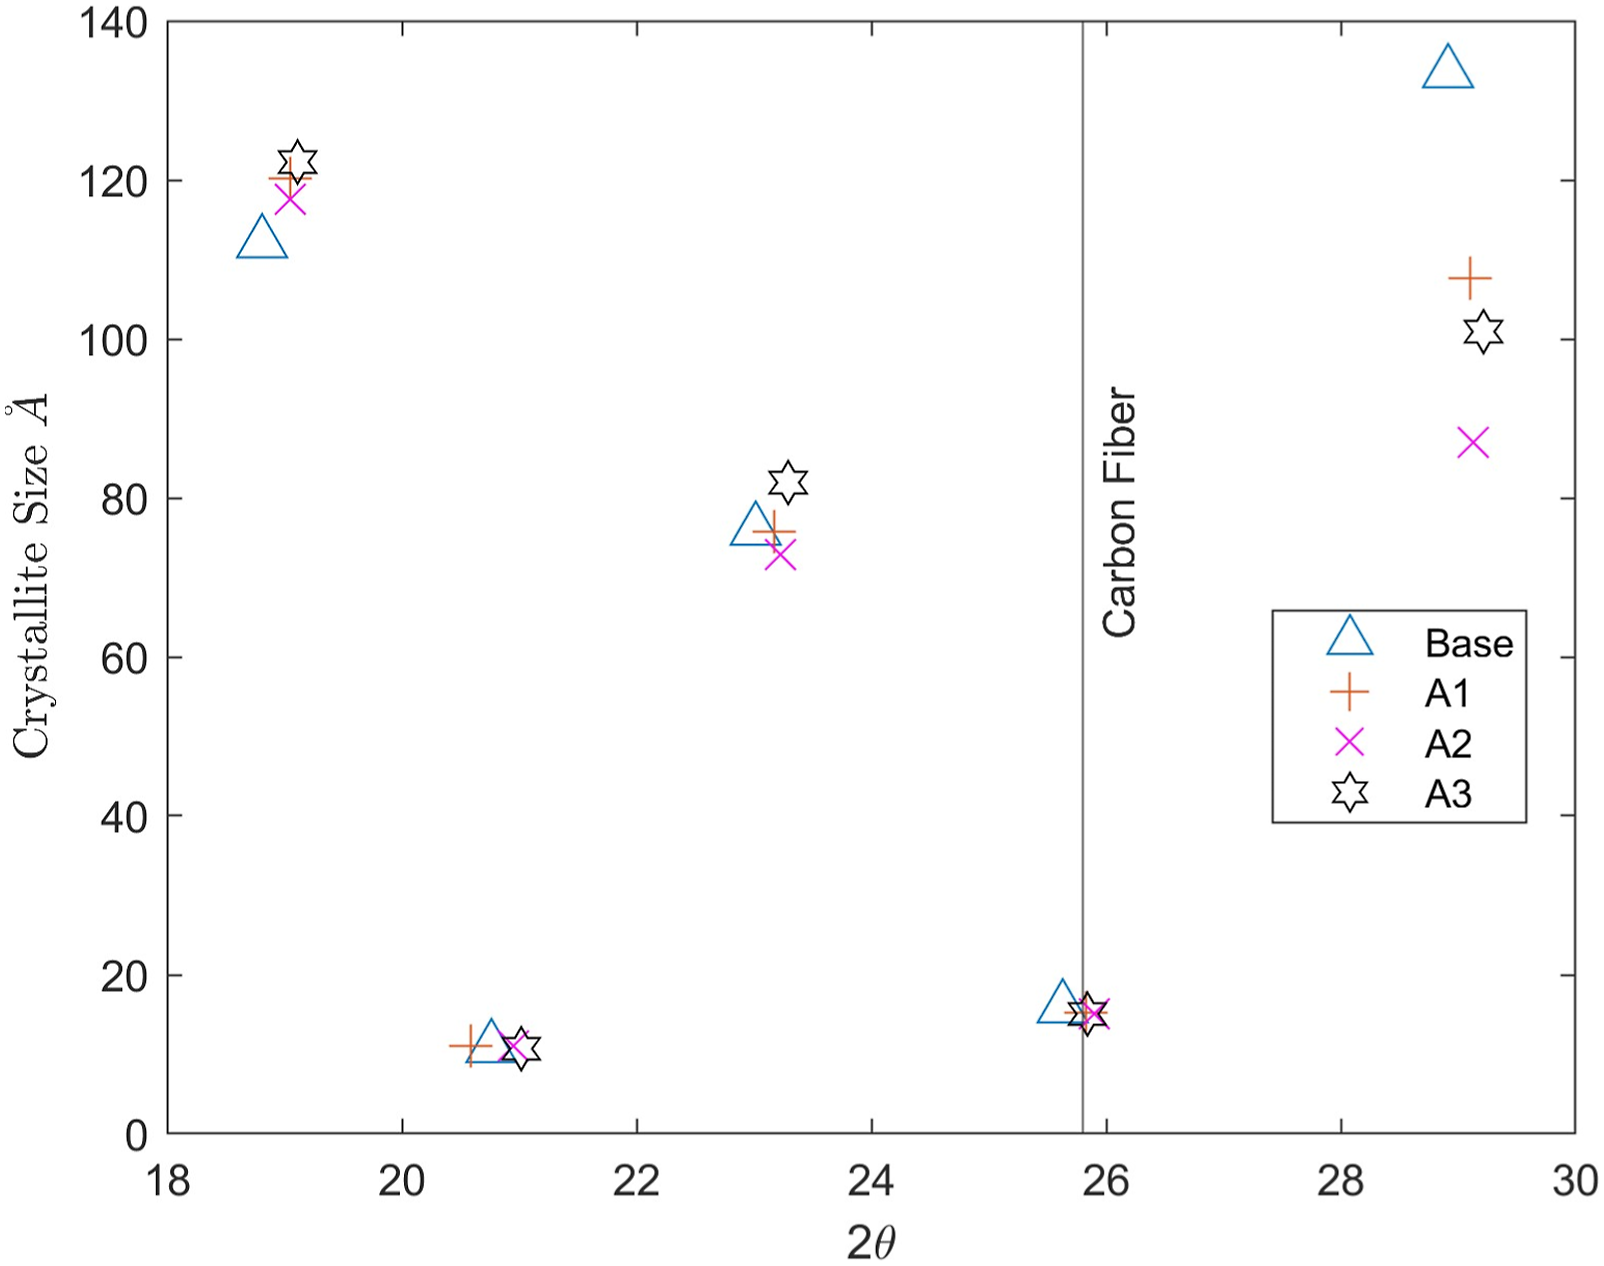
Mechanical properties
All specimens subjected to single lap shear testing in a load frame fractured via tensile fracture in the top sheet weld zone. Fracture occurred along the weld zone/base material boundary interface in all specimens regardless of annealing condition. The fracture location in single lap shear specimens closely resembles that of those observed in previous work.
11
Figure 14 illustrates the fracture location in each annealing condition. Fracture location of single lap shear specimens. (a) A1 (b) A2 (c) A3 (e) Cross view of typical fracture specimen.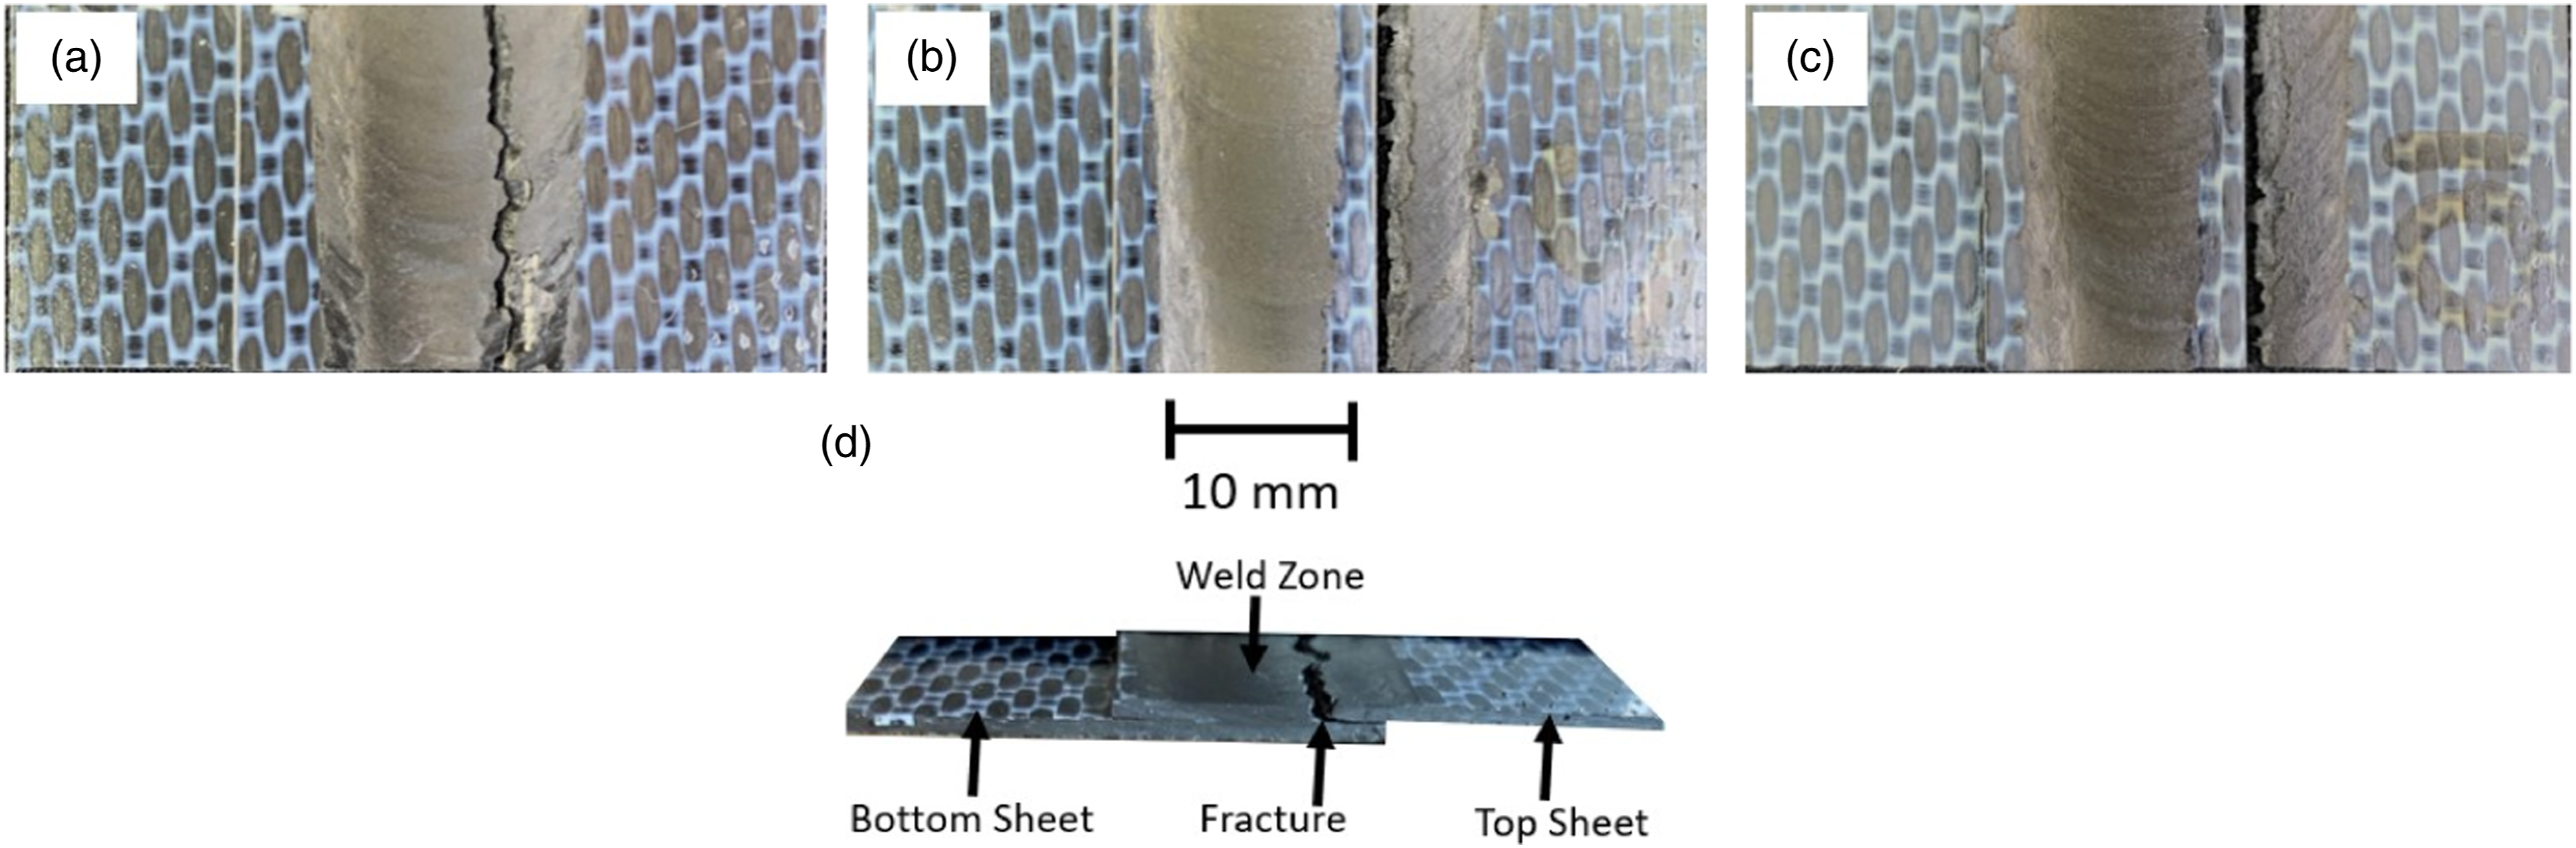
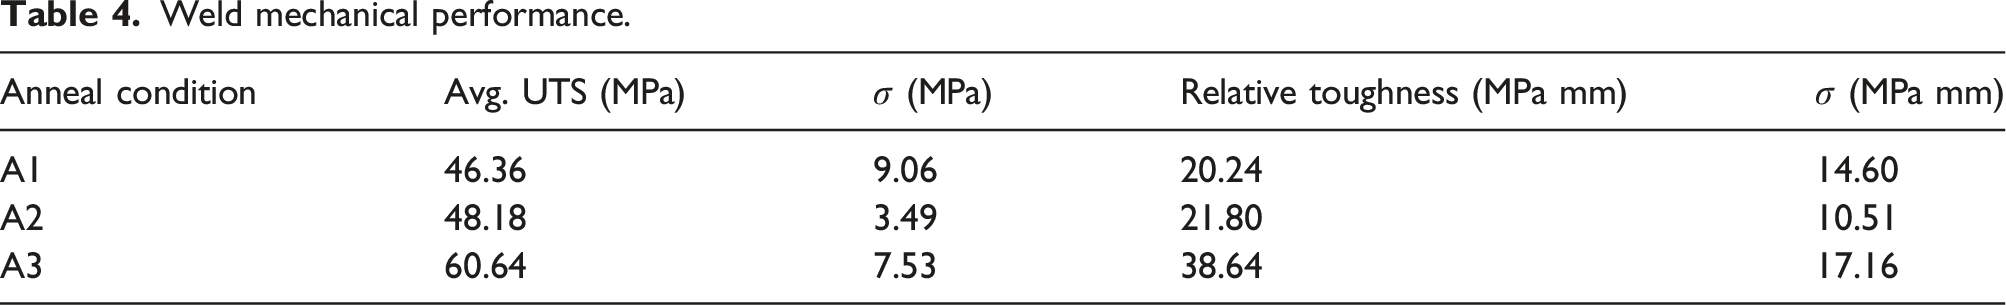
Weld mechanical performance.
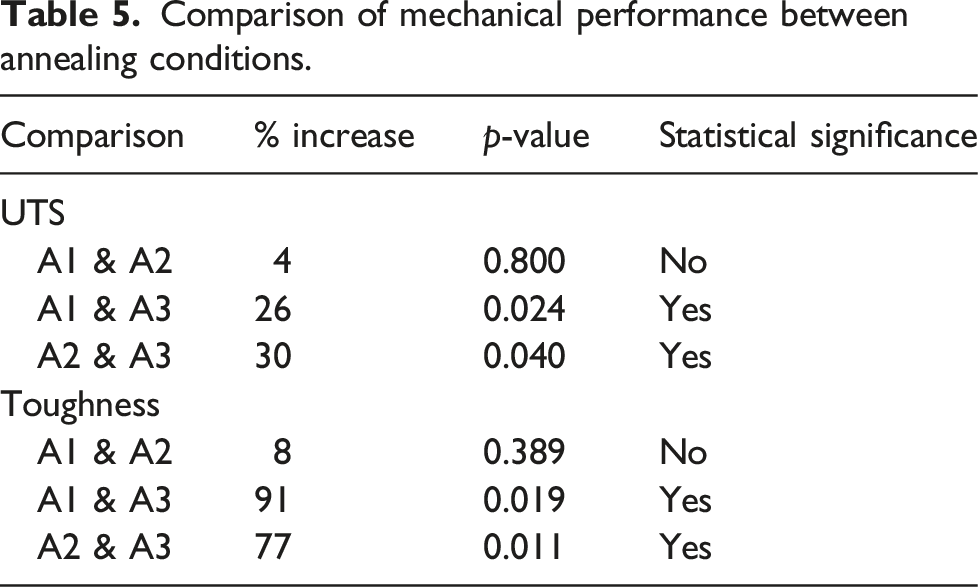
Comparison of mechanical performance between annealing conditions.
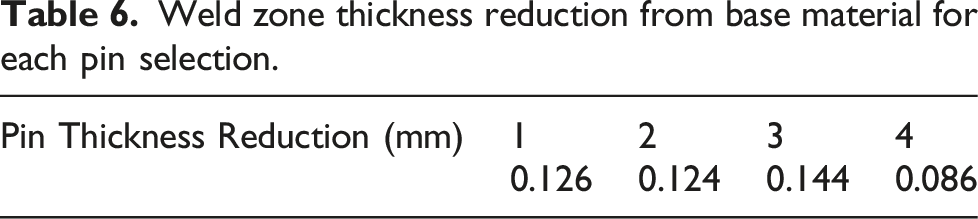
To further validate the influence of post-weld annealing on UTS, a general linear model with analysis of variance (ANOVA) was used to check for overall statistical significance. The model also incorporated the influence of each tool pin as switching tool pins throughout the experiments may incorporate sources of variation through minuscule deviations in setup and pin dimension. The ANOVA model indicates statistically significant contribution of both the annealing condition (p = .002) and pin selection (p = .000). Figure 15 plots the mean effects of both the annealing condition and pin used on UTS. Welding runs using pin 4 had drastically reduced mechanical performance. Table 6 reports that welds subject to pin 4 had a lower thickness reduction from the base material than pines 1, 2, and 3. Pin 4 welds were performed separately from the initial experiment to increase the number of replicates and required resetting the tool tilt angle, which only has 0.5
◦
precision. Thus, very small deviations in the tool tilt can have large effects on the shoulder depth, which produced pronounced effects when welding thin materials. The results highlight the paramount importance of tooling setup since each pin was fabricated to the same specifications. However, pin 4 welds still have the same relationship between the annealing condition and UTS. Average annealing and tool pin effects on UTS. Weld zone thickness reduction from base material for each pin selection.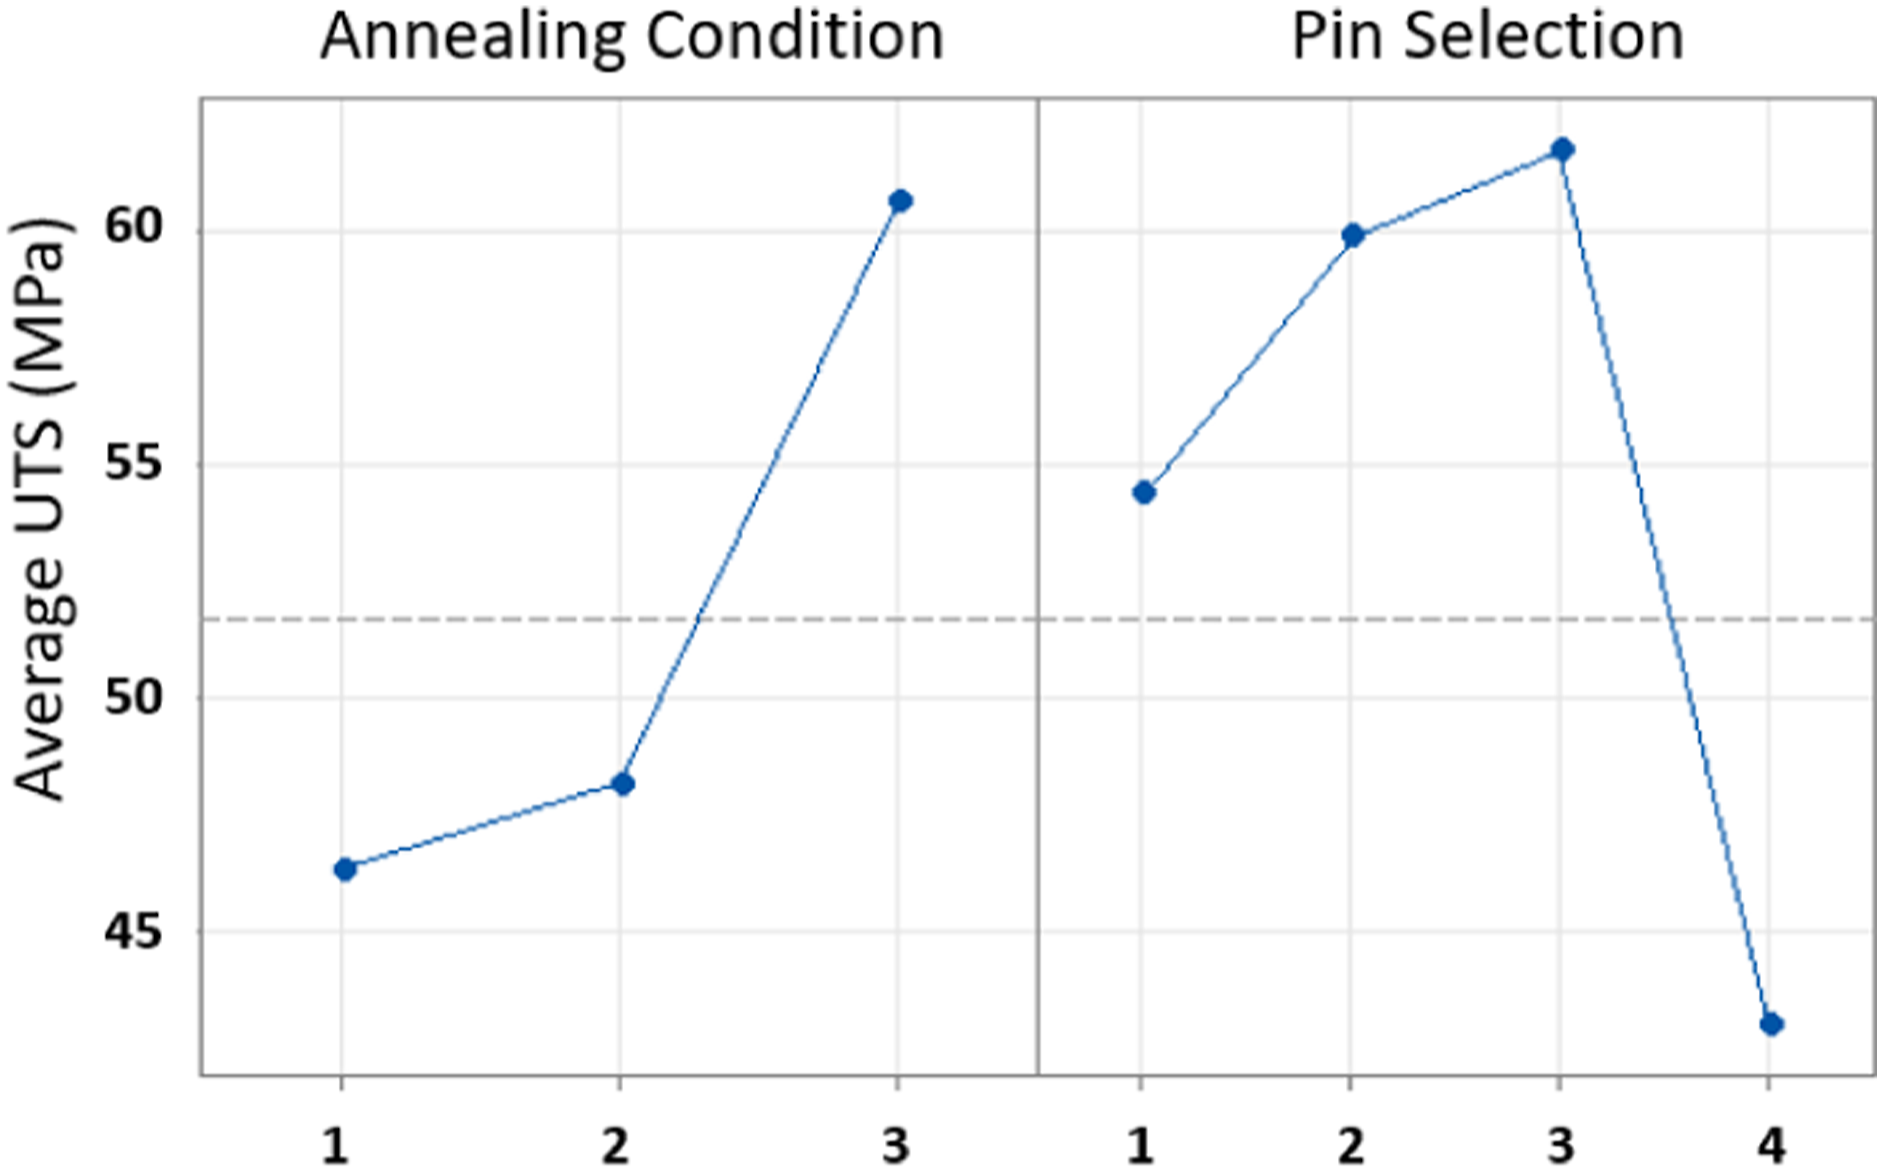
Future work
Though improvements were observed in FSW joints from post-weld annealing, improvements must be made in future work to adapt FSW to CFRTP welding and make it a useful and competitive joining process. The continuation of porosity in this study’s friction stir welded joints indicates that defect mitigation must occur during the welding process. Other researchers have demonstrated techniques utilizing preheating, 47 in-situ heating, 48 and heated stationary shoulders3,49 can significantly reduce void formation. Void formation not only occurs in composite FSW, but presents issue in many composite manufacturing processes. 50 Research shows that air void content in composites can be reduced by applying pressure. 20 This modification to the FSW process with applied pressure to the weld zone may help reduce porosity.
Another downfall to FSW for CFRTP is its slow joining times. It was theorized that void mitigation by annealing would allow for faster welding speeds. The results do not justify this hypothesis, but the aforementioned modifications to the FSW process may allow faster welding speeds of CFRTP.
Conclusion
This study explores the effect of post-weld annealing on lapped woven carbon fiber reinforced thermoplastic (CFRTP) joined by friction stir welding (FSW). The variable condition includes non-annealed welds, welds annealed at a 200°C low temperarure condition, and welds annealed at a 280°C high temperature condition. This work satisfies goals of advancing three key areas including the understanding of low-melt polyaryletherketone (LMPAEK), annealing effects on welded carbon fiber reinforced thermoplastic, and feasibility and identifying necessary aspects to improve when using FSW to join thermoplastics reinforced with continuous carbon fibers.
Annealing LMPAEK just below its melting temperature increases the mechanical performance of friction stir welded joints with up to a 30% improvement in lap shear strength and 91% increase in toughness over non-annealed joints. Improvements in mechanical performance result from increases in the polymer matrix crystalline content. Joints subject to high temperature annealing yielded a 27.91% crystalline content, which is among the maximum achieved for LMPAEK in other studies. Response to thermal treatment and crystalline structure also provide additional evidence of LMPAEK’s similar structure to PEEK despite its slight molecular modifications. Post-weld annealing fails to reduce porosity in the welded joints, which limits the potential of FSW joint performance in CFRTP’s with continuous reinforcement. However, this works shows clear influence to LMPAEK’s structure and performance due to post-weld processing, which can be applied to other processing methods including competing welding methods, molding, and composite tape layup.
Footnotes
Declaration of conflicting interests
The author(s) declared no potential conflicts of interest with respect to the research, authorship, and/or publication of this article.
Funding
The author(s) disclosed receipt of the following financial support for the research, authorship, and/or publication of this article: This work was supported by the NASA Space Grant Program though the Tennessee Space Grant Consortium (SFP_300530).