
Abstract
Dynamic crushing of composites is studied proposing an optimised experimental design: flat, millimetre-scale specimens reduce geometrical influences and facilitate detailed numerical studies. Crushing behaviour is investigated on a universal testing machine and a drop-tower at varying loading rates using two different force measurement techniques. The results show a decrease in the maximum stress and absorbed energy at elevated rates due to a higher extent of delamination, caused by strain-rate-induced increase of intralaminar damage property values. The experiments are simulated in an explicit finite element solver with different through-thickness discretisation, showing that a stacked-laminate model is incapable of reproducing the crushing response at high velocities. However, a discrete-ply model is capable of describing the main failure mechanisms and energy absorption for all loading rates. Further improvement of the model’s predictive capability could be achieved by adding a plasticity formulation in the ply material model.
Keywords
Introduction
Since the late 1970s, numerous studies have been published on the failure of fibre-reinforced plastic (FRP) materials when subjected to crushing. 1 Yet, this type of damage behaviour remains of interest to academia and industry.2–7 This is due to the high specific energy absorption (SEA) capacities and the complex interaction of mechanisms taking place during this kind of composite failure.8–10 The influencing factors include trigger shape, specimen geometry, stacking sequence, and material properties.11,12 Strain-rate-induced property changes observed in experiments with composite materials are yet another influence on their crushing response and resulting SEA. For carbon-epoxy material systems, most lamina13–17 and interlaminar material characteristics18–20 increase under elevated strain rates (SR). However, this does not necessarily lead to a corresponding increase in the crushing force level in laminated composites. This issue has recently been discussed by another author. 21
Due to composite crushing being highly sensitive to external factors, numerical modelling of crashworthy FRP structures can be unreliable such that designs are often based on costly experiments. Therefore, to increase understanding, it is crucial to reduce the number of parameters or be able to quantify parameter influences. In a first approach, Lavoie et al. proposed flat, guided coupons to eliminate geometrical influences.22,23 More recently, further studies were carried out with a similar experimental procedure to crush moving coupons in a guiding fixture.24–29 Another approach with coupon geometries unsupported in the crushing area was proposed by Bru et al. and adapted by other authors.30–33 They used specimens of just a few millimetres in size, clamped into a fixture to provoke a crushing response upon compression or impact of a guided mass. Feindler proposed a novel experimental design using laterally clamped specimens. 34
In addition to his experimental work, Feindler numerically investigated coupon crushing with discrete-ply models (DPM) and built-in material formulations in PAM-CRASH. During the stable crushing phase, his models and the experiments showed good agreement, but they overestimated the initiation stress. Simulation of crushing at coupon level was also conducted by Israr et al. in a pseudo 2D approach. 27 With DPMs and their proprietary material model in ABAQUS/Explicit, they achieved good agreement in the splaying failure modes and load-displacement characteristics, but also unrealistic decreases in the force down to a zero force value. Grotto et al. extended their work to a 3D representation and crushing stress definitions resulting in even better agreement with conducted experiments. 28 Liu et al. set up a 3D material model and defined multiple solid elements through the thickness of each ply to evaluate crushing with two different trigger geometries. Their simulations obtained very accurate predictions of the coupon failure behaviour. 33 Single-shell models (SSM) and DPMs of flat, guided crushing coupons were compared by Feser applying an existing academic material model. 35 SSMs were unable to accurately mimic the failure behaviour since splaying failure was observed in the underlying tests, whereas DPMs demonstrated good correlation. Feser also emphasised the need for further study to examine how SR affects composite crushing.
This study investigates crushing of FRP coupon specimens optimised for experiments under elevated loading rates. The experiments are combined with numerical evaluations: A ply-by-ply shell model is used for detailed prediction of the crushing behaviour. For application at structural length scales, a homogenised shell model is employed. Results are produced under three loading rates and facilitate the study of dynamic composite crushing with a particular interest in the rate dependency of the material properties. It is shown that the current discrete-ply modelling approach enables crushing simulations with an unprecedented prediction quality at nominal SRs ranging from 1 1/s to 456 1/s. In addition, the models facilitate a first-time identification of material properties, whose rate-induced changes have a detrimental influence onto the maximum initiation stress and specific energy absorption.
Following this introduction, section
Experimental approach
Specimen design
The coupon specimen design of the present study was derived from the triangular through-thickness trigger (TTT) geometry proposed by Bru et al.
30
Preliminary numerical studies were conducted to optimise the specimen geometry for experiments under high SRs. The numerical studies were conducted with early-phase models on a rectangular mesh leading to unphysical high-frequent noise in the trigger phase. Still, the stress-displacement diagram in Figure 1(a) shows, that the TTT design with a trigger angle of 20° and a free length of 10 mm proved superior to other trigger angles, specimen lengths and a bevel trigger (BT) system regarding the buckling tendency. The BT FE model is presented in Figure 1(b). TTT specimens were machined from a carbon-fibre-reinforced epoxy IM7/8552 plate with a 2 mm thick quasi-isotropic (QI) laminate ((90/0/±45)2
s
). In order to minimise the surface roughness, the processed edges were ground down to the final dimensions subsequently. The specimen dimensions and the boundary conditions for the TTT experiments are shown in Figure 1(c). (a) Stress-displacement diagram of prestudy to optimise the crushing geometry shape. (b) Four-shell BT FE model with shown shell thickness. (c) Specimen dimensions and boundary conditions for TTT experiments and (d) immediate specimen surroundings for TTT HR2 experiments consisting of drop-tower with impactor, load cell, specimen, lighting and two high-speed cameras.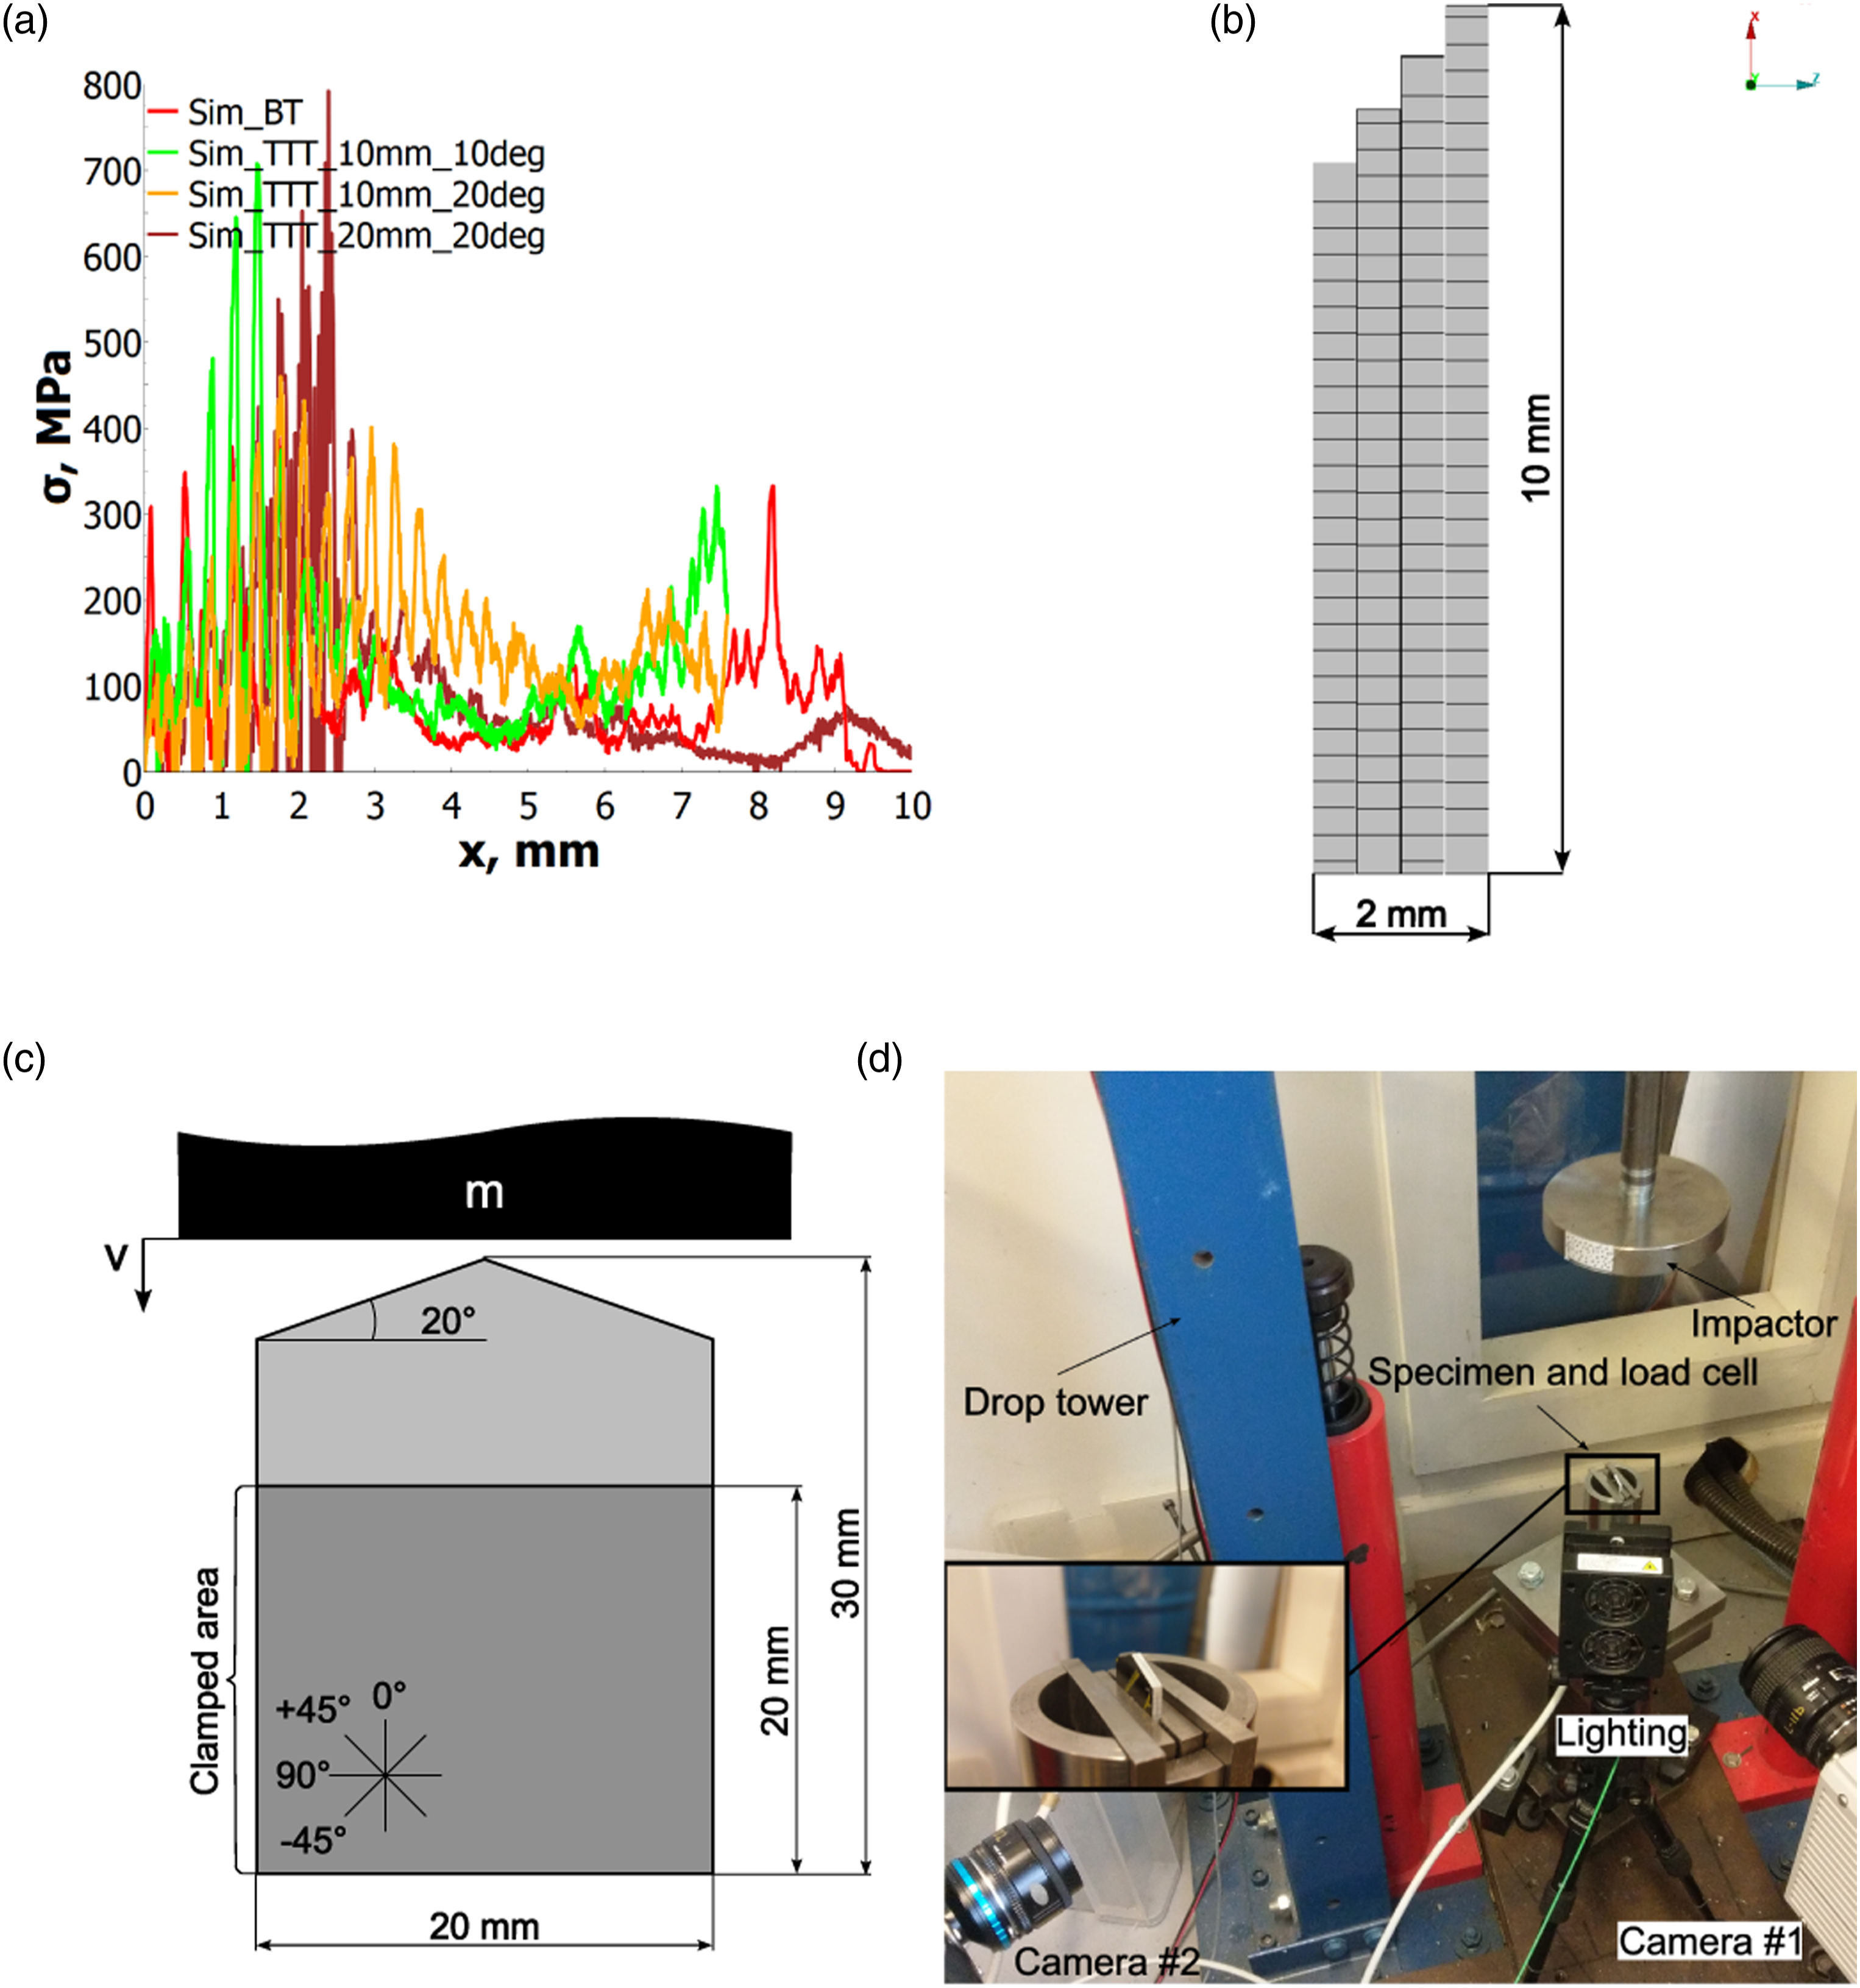
Experimental setups
Three identical series of five specimens each were tested in the Impact Engineering Laboratory at the University of Oxford: (a) at a medium, constant loading rate of 1 mm/s on a ZwickRoell Z050 servo-hydraulic testing machine (MR); (b) on a custom-made drop-tower setup with a maximum drop height of 6 m. For the first high-rate experiments, a cylindrical stainless steel impactor of 51 mm diameter and 15.3 kg mass at 1.59 m/s initial impact velocity was used (HR1); (c) on the same drop-tower setup with a guided 130 mm diameter cylindrical stainless steel plate of 6.2 kg mass at 4.56 m/s initial impact velocity (HR2). The MR experiments were carried out at a medium instead of quasi-static loading rate to have the option to carry out simulations with the same time step as the HR and therefore comparable to each other. The HR1 setup was designed with preliminary simulations to facilitate complete deceleration within the specimen length, whereas HR2 was set up with the smallest available mass and a higher velocity, which was still considered uncritical regarding plastic deformation of the overloading protection. The velocity on the drop-tower was measured using a photoelectric sensor. The testing fixtures were bolted onto a steel frame and the specimens were finger-tightened in the fixtures to prevent movement-induced vibrations as reported by Dalli et al. 32 Figure 1(d) is a general view of the HR2 experimental setup. As the HR1 was very similar to the HR2 setup it is not shown.
Fixture designs and data reduction
Two kinds of fixtures were used: (a) a simple fixture machined from stainless steel blocks (Young’s modulus E = 210,000 MPa, Poisson’s ration ν = 0.3) so that initial results could be quickly obtained without having to risk the destruction of a load cell. (b) A force transducer fixture shown in Figure 1(d) was also manufactured from stainless steel with a built-in Kistler 9349A load cell, which provided a sampling rate of 2.5 MHz. Its signal was recorded via an amplifier integrated within a Tektronix DPO4034. The corresponding load cell displacement signal was obtained by integrating the measured force twice and dividing it by the drop weight mass.
Optical measurement technique and data reduction
For the drop-tower experiments two high-speed cameras were used at approximately 100,000 fps. They were arranged perpendicular to each other to record the impactor displacement, capture the damage patterns and possibly facilitate a subsequent evaluation of the strain field on the specimen surface. A Python convolution algorithm was utilised to follow the edge between the brighter impactor and the darker background to derive a displacement signal from the recorded videos. To filter out the noise occurring in the differentiation process of the raw displacement data, a Savitzky-Golay (SG) filter was applied using the signal function of the Python SciPy library with a filtering window size of 1 ms, polyorder = 3, and deriv = 0.
36
The force was subsequently calculated by using the second derivative of the SG filter (deriv = 2) and multiplying the result by the respective drop weight mass. The MR specimens were tested with the force transducer and the built-in load cell of the testing machine, whereas the HR1 batch used the optical measurement method alone. The HR2 experiments combined both measurement techniques to verify the optical data reduction procedure – above all the suitability of the SG filtering window size (see subsection
Further analyses were conducted on the unfiltered curves to determine their maximum initiation stress, crushing stress, and SEA.
Numerical approach
Composite material modelling
Numerical models were used continuously to design and complement the presented experiments. In turn, the results from the experiments allowed for the validation of the numerical models as is presented in section
Relevant quasi-static material properties of UD IM7/8552 for the numerical models (adapted from Pohl et al. 37 ).
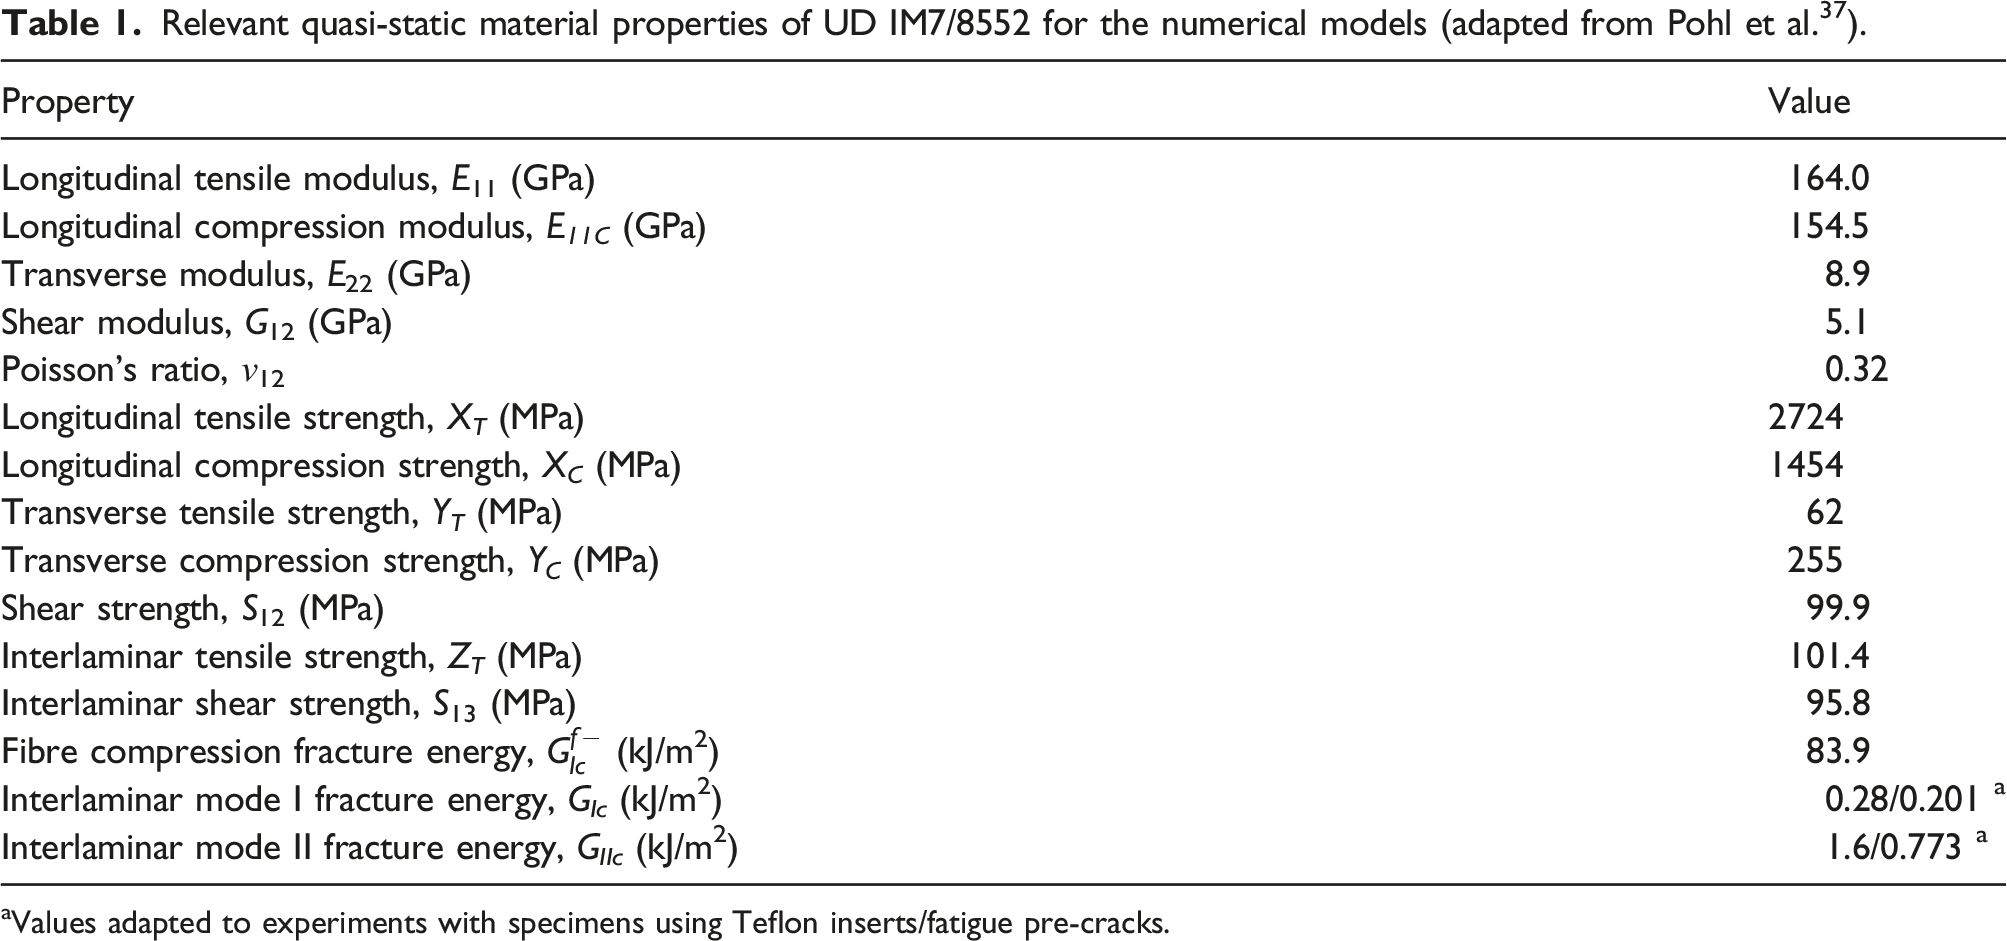
aValues adapted to experiments with specimens using Teflon inserts/fatigue pre-cracks.
Delamination was considered using cohesive zone model (CZM) *MAT_COHESIVE_MIXED_MODE_ELASTOPLASTIC_RATE (*MAT_240) or the corresponding *CONTACT_…_TIEBREAK option 14. The relevant interlaminar material properties for the stacked-laminate model were obtained from numerical studies of published double-cantilever beam (DCB) and end-notched flexure (ENF) experimental data and are also presented in Table 1.40,41 Based on literature criteria for maximum element lengths to stabilise interlaminar crack progress under the assumptions of a linear softening law and a slender specimen geometry, 0.54 mm (mode I) and 0.58 mm (mode II) were identified as uncritical.42,43 Therefore, the element length of 0.3 mm is sufficient to dispense with the purely numerical interlaminar strength reduction described by Turon et al. 44 The analytical calculations were confirmed by DCB and ENF simulations using experimental IM7/8552 out-of-plane properties similar to what was used by Pohl et al. 37 The nominal strength properties in through-thickness direction turned out to be applicable without adaption. In contrast, the interlaminar initiation fracture toughnesses require increases of about 25% when compared to the literature values for non-pre-cracked specimens with Teflon inserts. These calibrated initiation fracture toughnesses were only considered suitable for the MR models because rapid and instable crack propagation appeared in the experiments. Such instabilities were also reported by Czabaj and Ratcliffe for their non-pre-cracked samples. 41 For the HR models with stable crack propagation, values from fatigue pre-cracked specimens were used consistently.
Apart from the longitudinal tensile moduli, E11 and E11C, longitudinal tensile strength XT, and matrix fracture energies GIc and GIIc, all material properties were considered rate-dependent using the Cowper-Symonds extrapolations by Koerber. 45 Strain-rate sensitivities were included in the CDM and CZM by use of look-up tables in the same way as implemented by Pohl et al. 37 The reader is referred to this very publication for more information regarding the applied modelling approach.
Constraints and general settings
A consistent transition from rhomboid to rectangular element shape was used to mesh the specimen plies. As part of an optimised meshing method, triangular elements were completely foregone. Experimental settings were adopted in the numerical models as far as necessary: the impactor was represented by a *MAT_RIGID plate with either an impact mass and an *INITIAL_VELOCITY or a *PRESCRIBED_MOTION definition. The impactors were provided with an initial velocity of 1.59 m/s for HR1 and 4.56 m/s for HR2 respectively. MR simulations were conducted with two settings: (a) at a constant, but increased velocity of 1 m/s compared to the experiments combined with quasi-static material properties or (b) at the original velocity of 1 mm/s with strain-rate-dependent implementation and without mass scaling. The latter had been shown to suppress the contact between specimen and impactor at high mass scaling levels sufficient to considerably reduce the runtime, thus leading to a forceless penetration. It was demonstrated in an early phase of the investigations that the response with a simplified fixture and impactor is equivalent to a more sophisticated model which considers the influence of the surrounding structures (see Figure 2(c)). Modelling was limited to the specimen’s free length with the fixture represented as *CONSTRAINED_NODAL_RIGID_BODY. The motion of the fixtures was fully constrained at their sides away from the impact, whereas the motion of the impactor was completely constrained except along the impact axis. The friction coefficient of 0.3 was taken from the previous publication by the authors and is subject to a numerical study in subsection (a) 4S model and (b) 16S model with description of constituents, boundary conditions, and output entities. Shell thickness and contacts are not shown in the figures. (c) Comparison of stress-displacement response of 4S_HR2 with reduced model (Rigid) and fully modeled fixture and impactor (Impactor).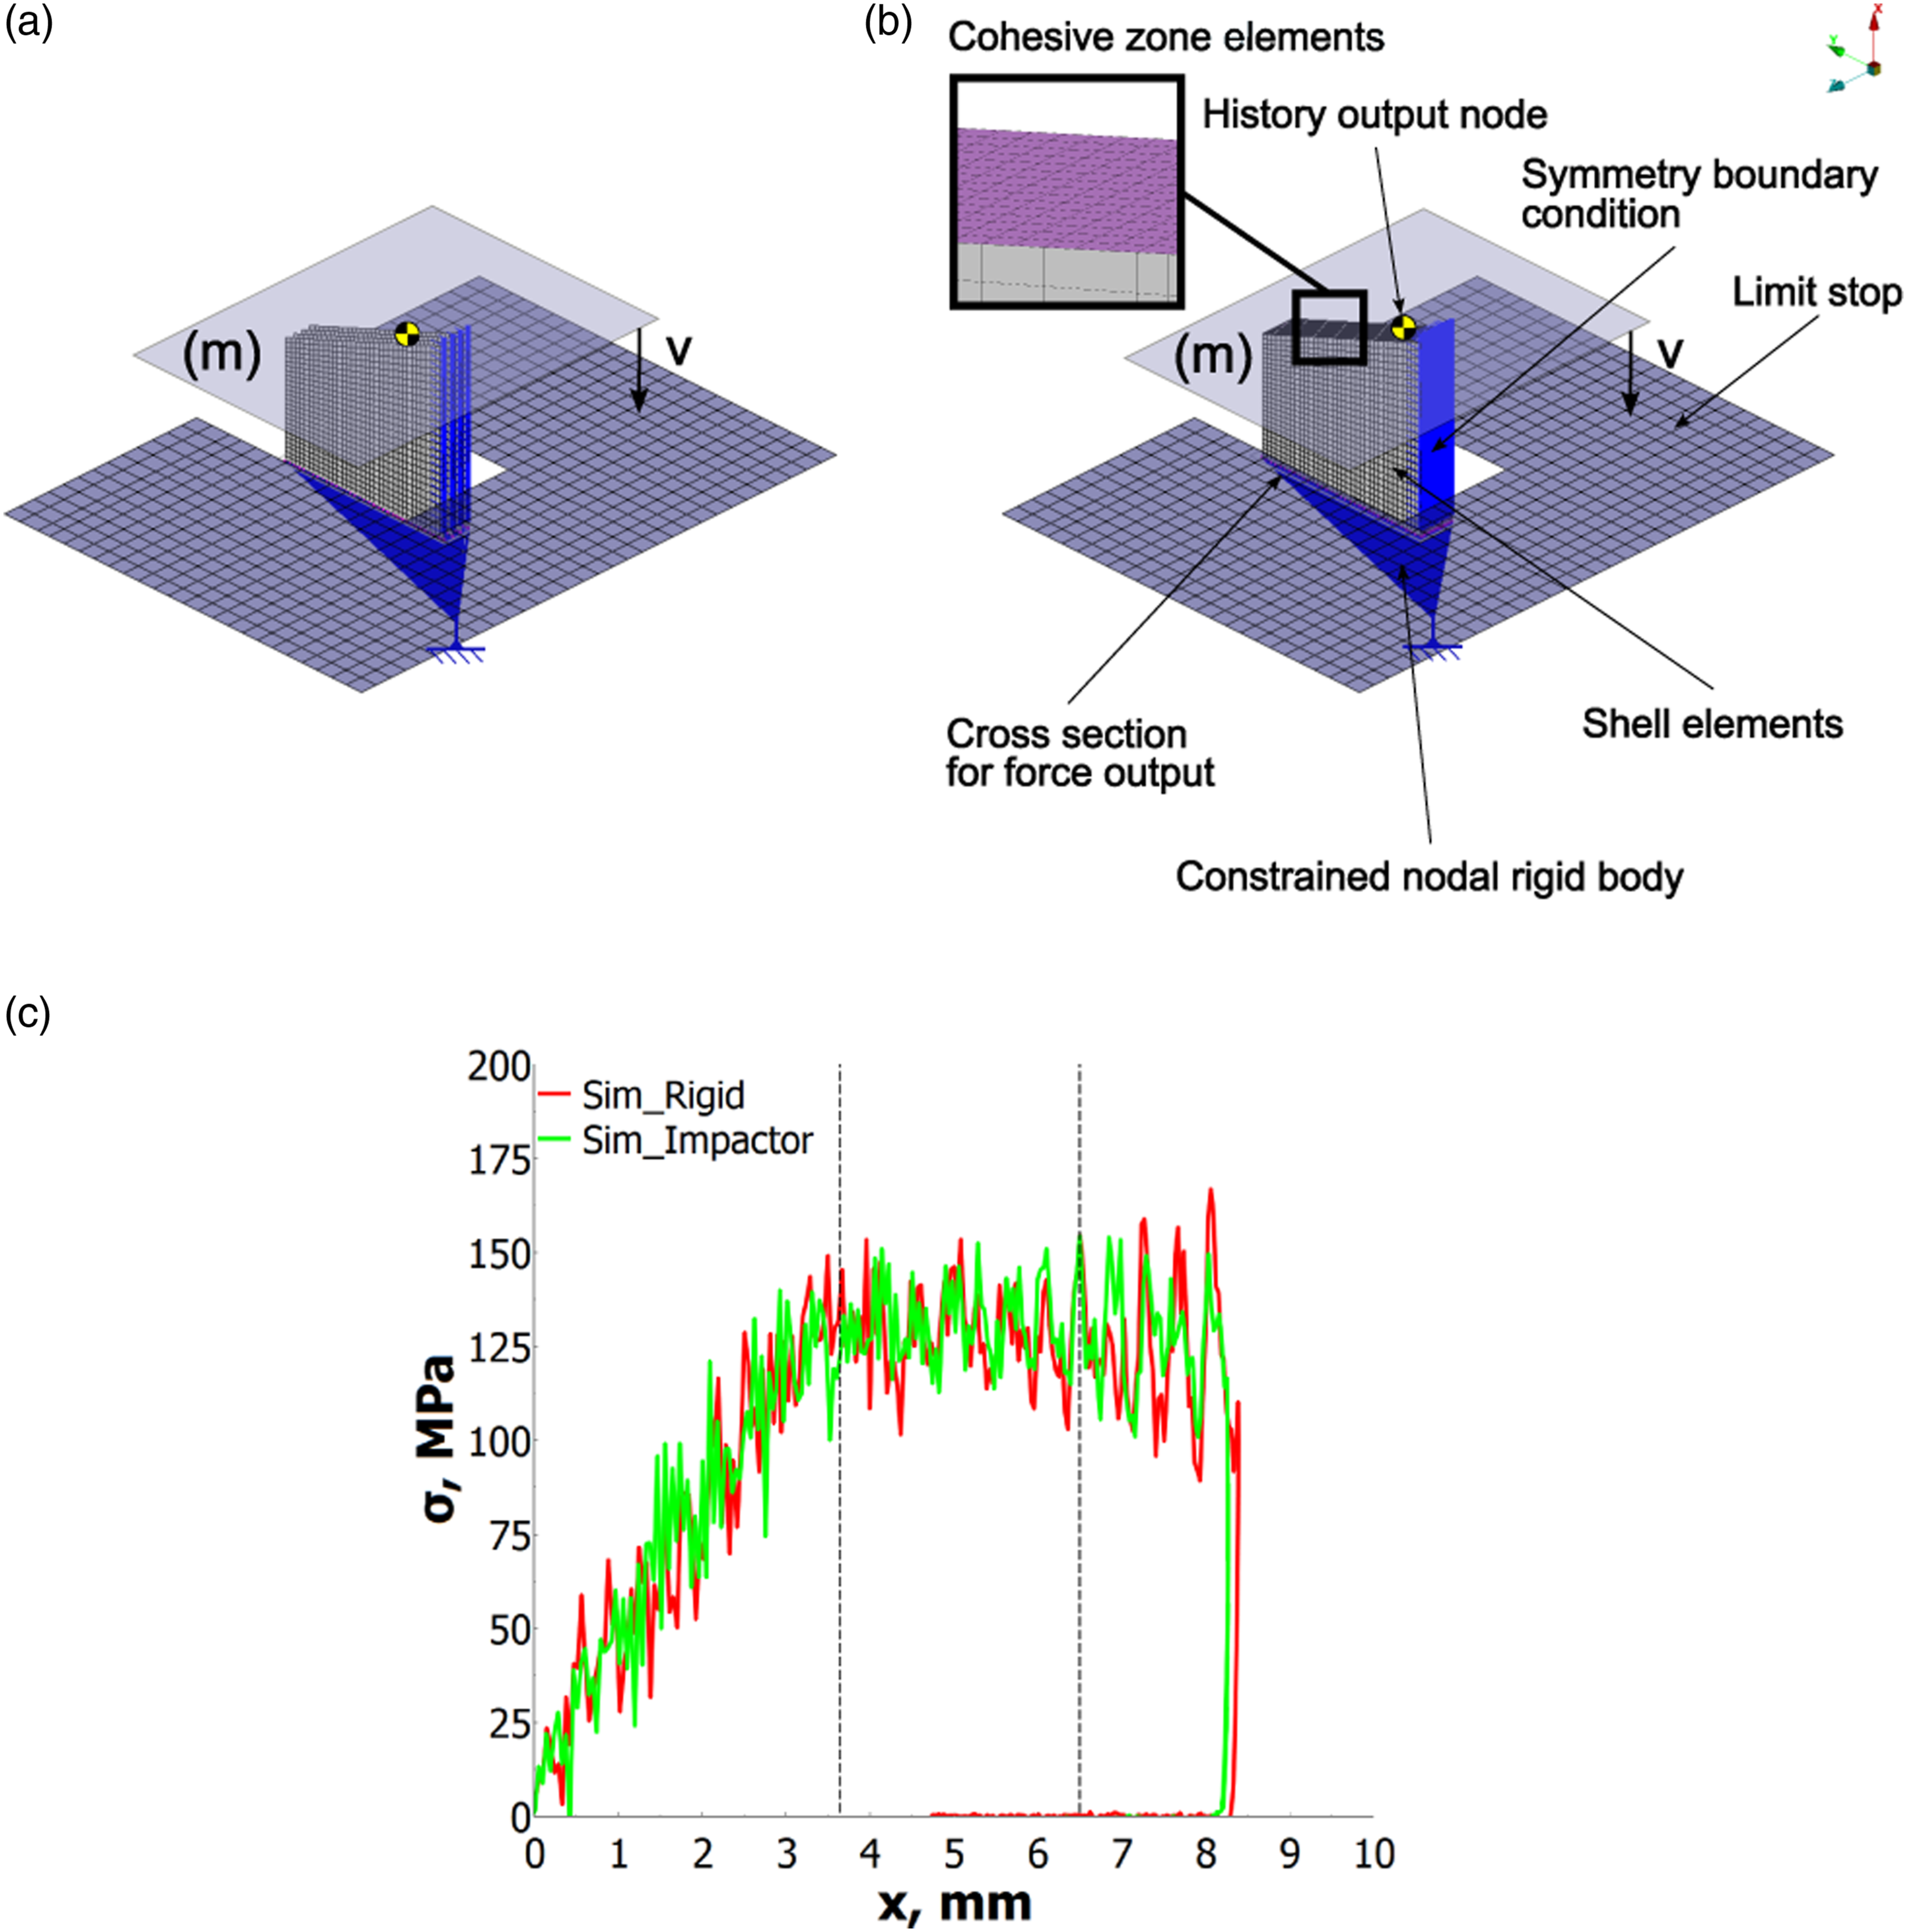
Data reduction
As for the experimental data, analyses were conducted on the unfiltered curves from the numerical evaluations to determine their maximum initiation stress, crushing stress, and specific energy absorption. These key figures facilitated a quantitative evaluation of the numerical simulations based on the success criteria defined by the Composite Material Handbook-17’s Crashworthiness Working Group
46
: • Excellent: model differs by less than 10% from the experimental mean • Good: model deviates by between 10% and 15% from the experimental mean • Fair: model deviates by 15% to 20% from the experimental mean • Poor: model deviates by more than 20% from the experimental mean.
Moreover, the models allowed for a division of the SEA into the relevant energy absorption mechanisms: delamination, friction, and ply damage.
Results overview and evaluation of numerical models
Comparison of measurement methods
As two different measurement methods were applied, the following section will highlight and explain the deviations between them. Figure 3(a) shows the averaged stress-displacement curves from the optical measurement (OM) and the load cell (LC) for all HR2 specimens and their respective scatter band. Although the OM curve was SG-filtered, it still has a jagged appearance. This is even more pronounced for the HR1 measurements shown later. The noise is caused by the optical discretisation since the distance of the local extrema is about the length of one pixel of the high-speed camera (0.19 mm). During the initial stress increase up to approximately 3 mm displacement and 80 MPa the LC curve lies above the OM level. This can be attributed to the influence of the SG filter, whose window of 99 data points corresponds to data acquired over a distance of about 5 mm. After reaching the trigger end at 3.6 mm displacement, the curves are close to each other with scatter bands that largely overlap. The OM reaches a constant maximum stress level of around 50 MPa. At about 5 mm displacement, the OM starts to increase due to the onset of deceleration when the impactor approaches the limit stop with high variation between the experiments. The LC curve remains at a relatively constant load level until the load starts to be bridged by the overloading protection and peaks at around 9 mm displacement and 125 MPa. It should be noted, that even though OM is considered a reliable approach for verifying the measurement method, LC data are used henceforth to evaluate HR2 because the data are less noisy and appear more dependable at the higher velocity. To evaluate the HR1 batch, approximately three times the number of data points are available which should improve the reliability of the OM method. (a) Stress against crushing displacement for both data reduction methods of the HR2 batch. (b) Stress and (c) absorbed energy against crushing displacement for the tested flat coupons at the three loading rates MR, HR1, and HR2. The dashed vertical line on the left indicates the end of the trigger length (3.6 mm), whereas the line on the right is the designated end of the crushing length (6.5 mm).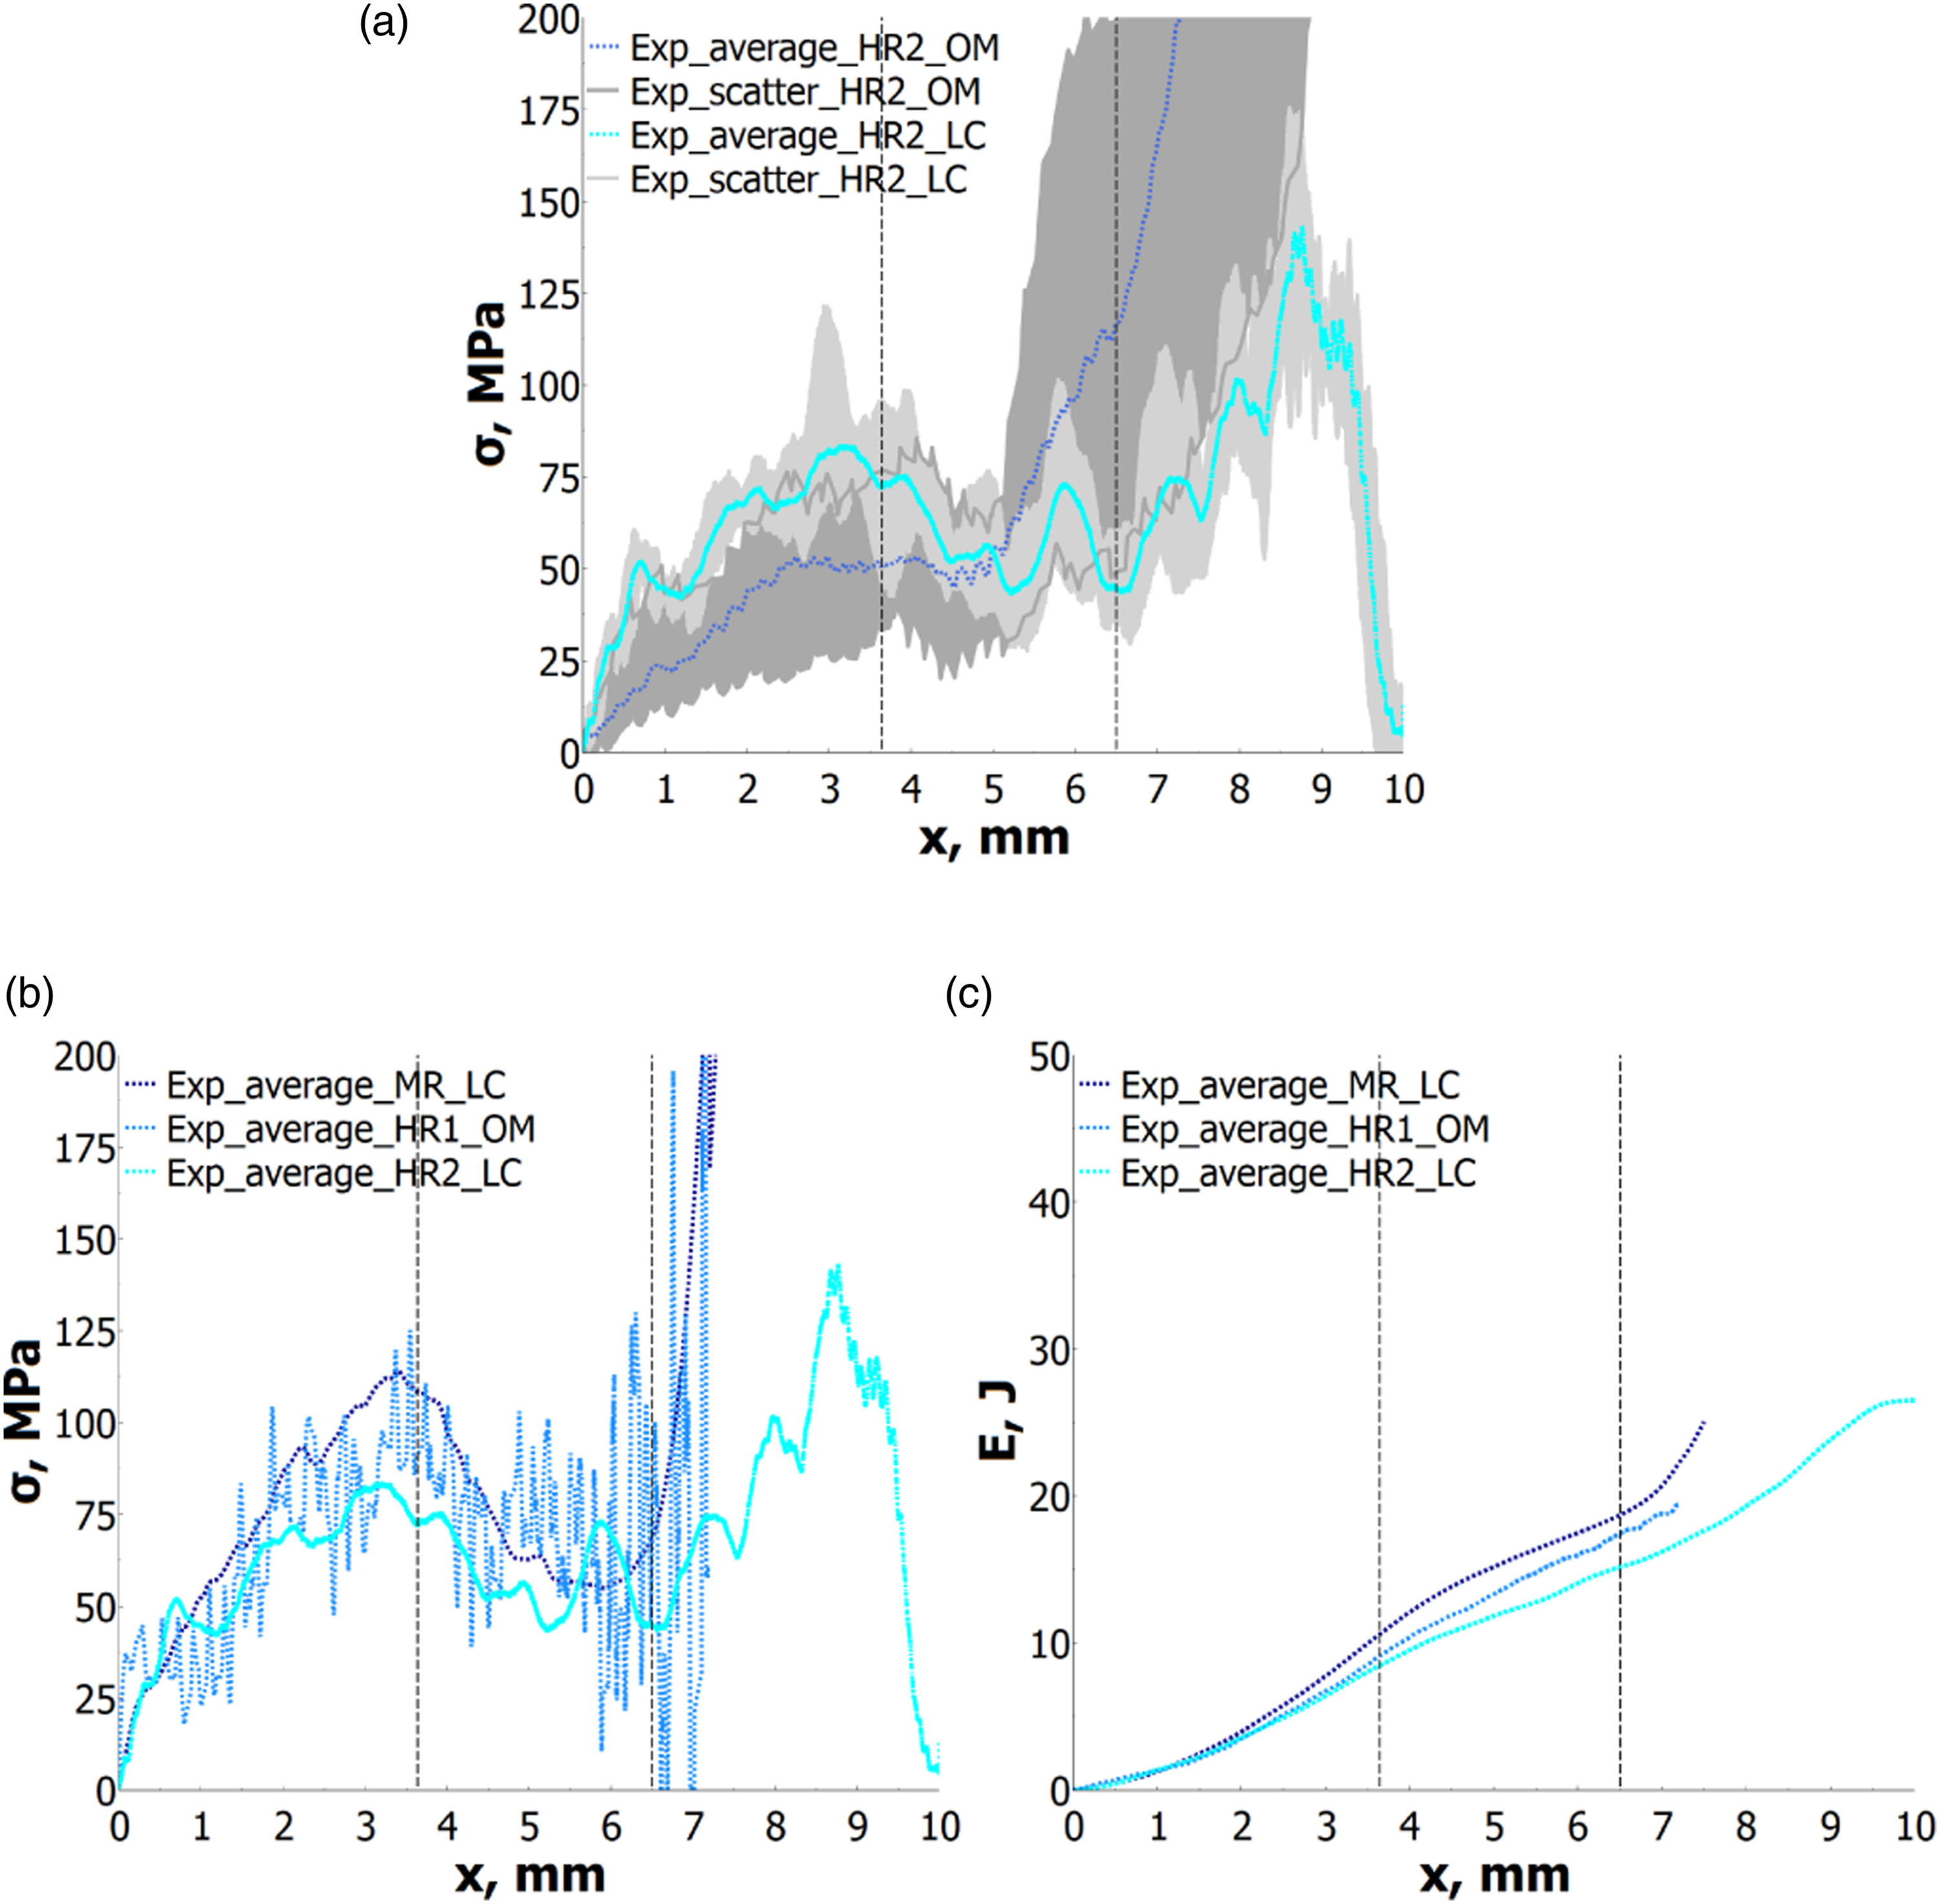
Experimental results
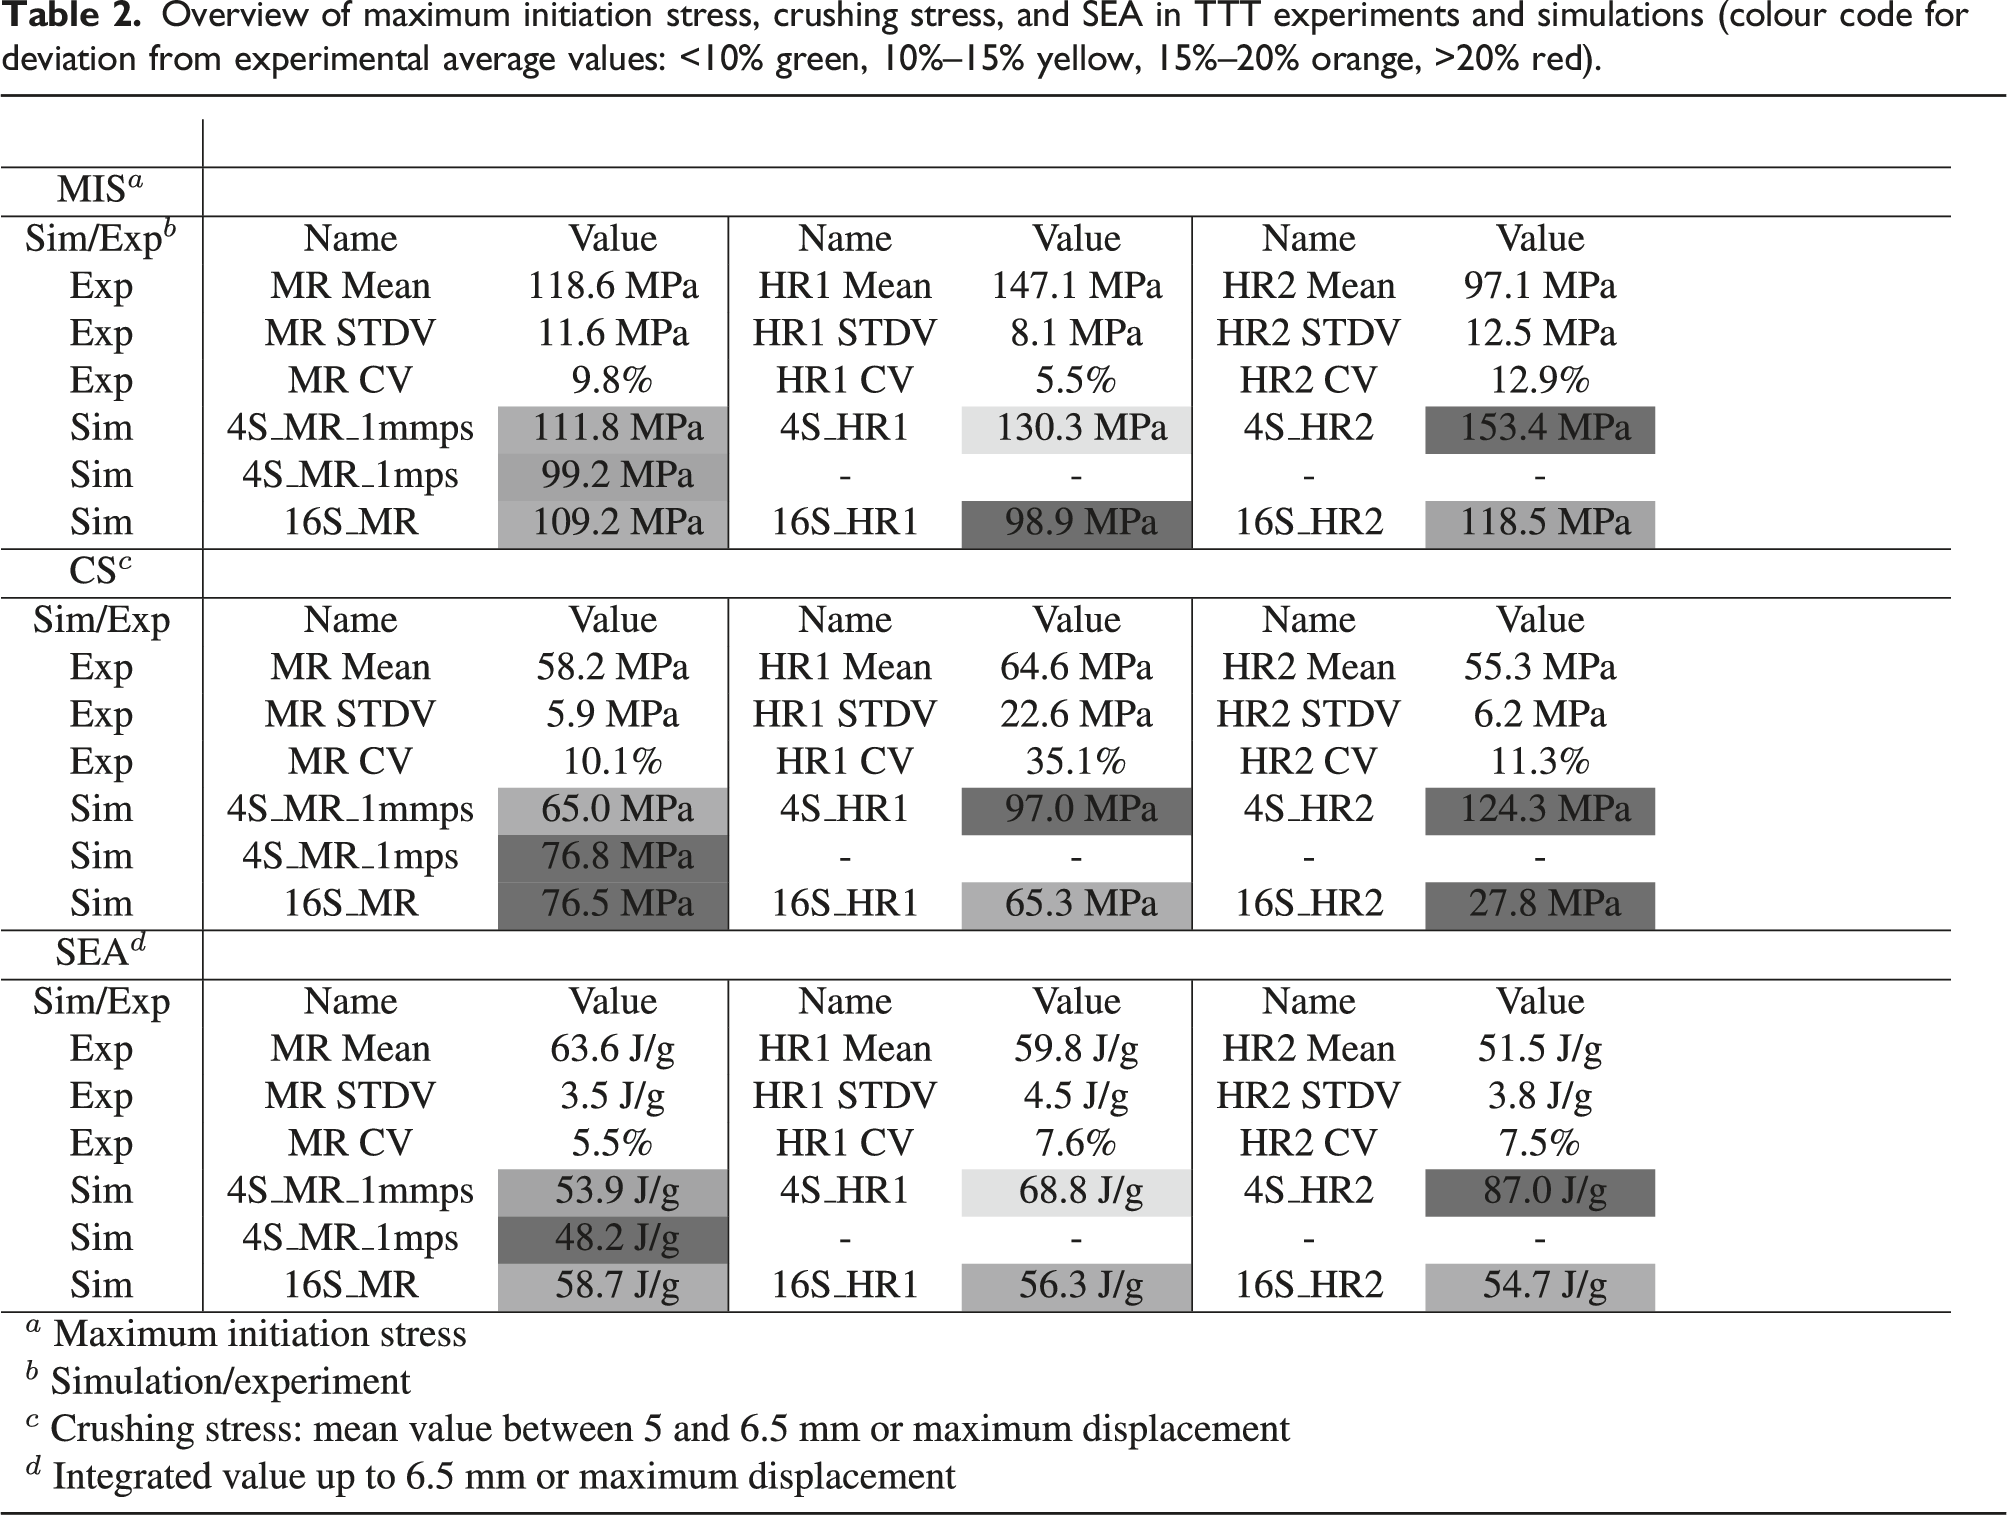
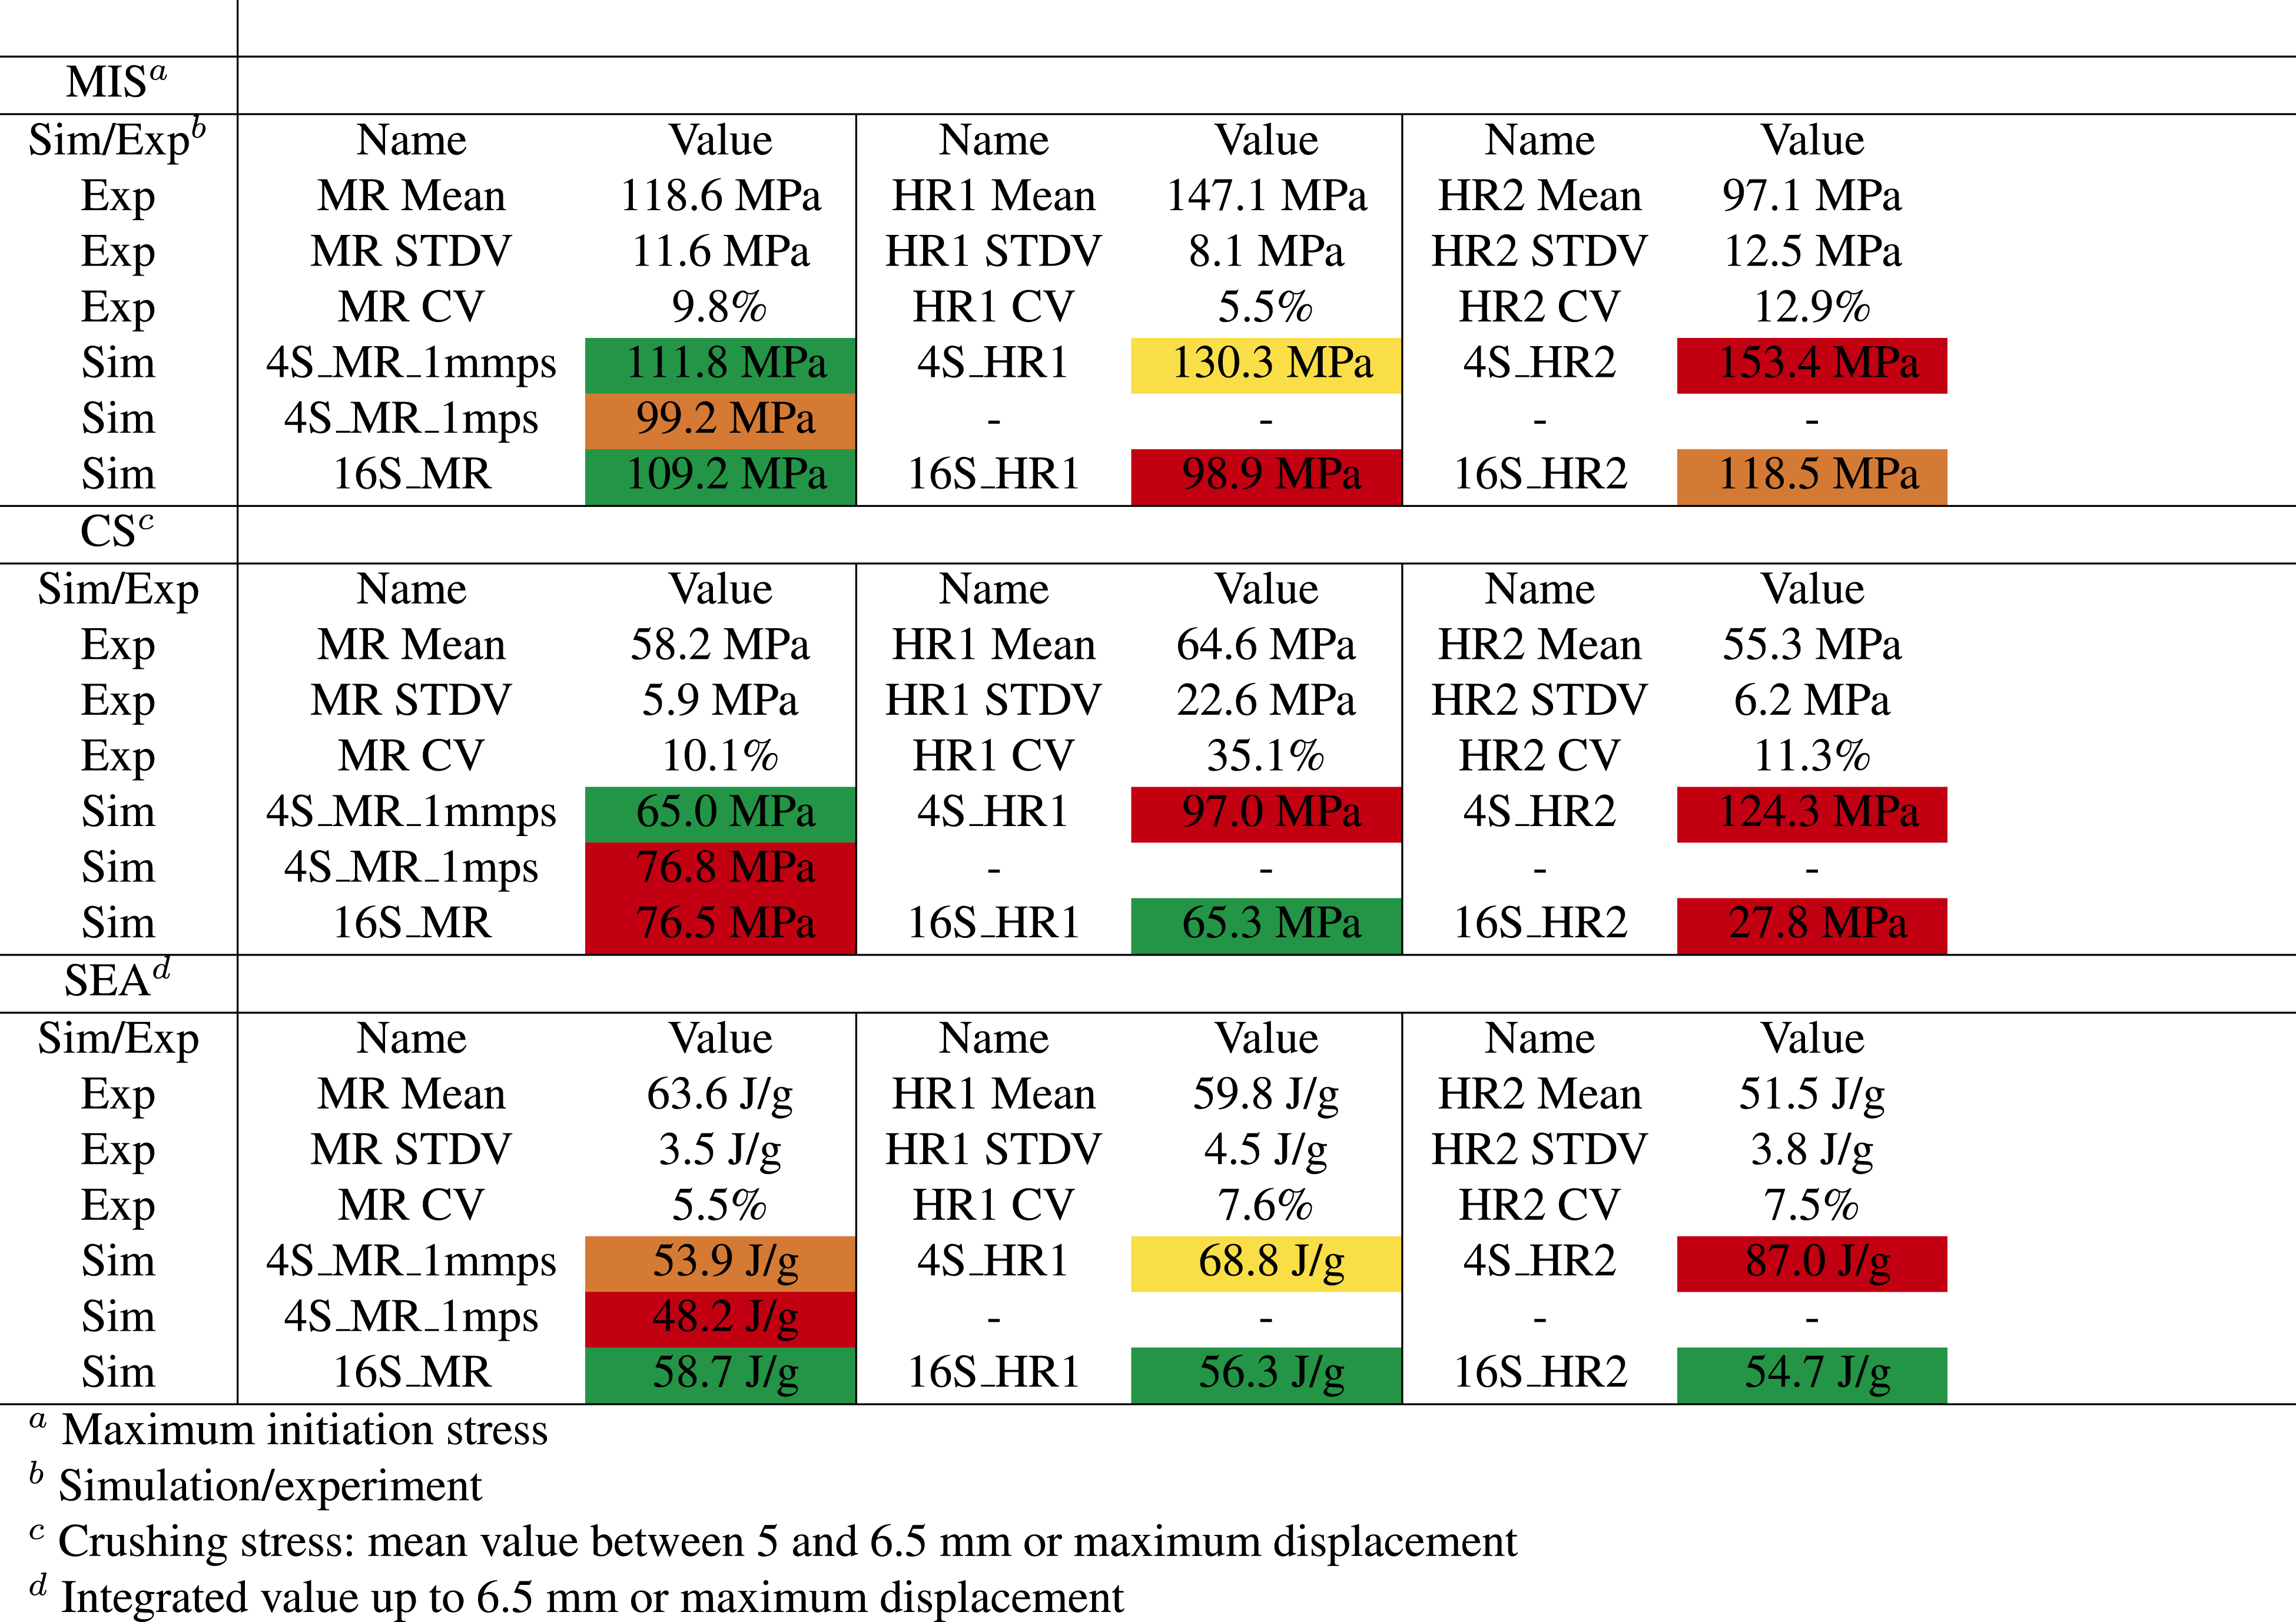
Overview of maximum initiation stress, crushing stress, and SEA in TTT experiments and simulations (colour code for deviation from experimental average values: <10% green, 10%–15% yellow, 15%–20% orange, >20% red).
All curves show nonlinear behaviour in the first phase of the trigger loading with MR and HR2 resembling each other very closely. After this phase, the stress levels continue to increase in a similar manner for all loading rates until a displacement of approximately 2 mm, when the increase firstly stagnates for HR2 before stagnating about 2.5 mm for HR1. Both curves reach local stress maxima of around 75 and 90 MPa, respectively, at the onset of delamination in the specimens. Towards the end of the trigger length, HR1 stress increases again and peaks with MR at approximately 120 MPa. It should be noted that the tabular initiation stress maxima may deviate from the depicted average curve as they represent the mean values of the maximum peaks in each measurement. The difference in the stress level is also visible in the energy-displacement diagram. Exceeding maximum initiation stress, the stress-displacement curves drop to a level of 58.2 MPa, 64.6 MPa, and 55.3 MPa for MR, HR1, and HR2, respectively. It can be assumed that all configurations yield stable crushing for the distance between 5 mm and 6.5 mm or maximum displacement. Subsequently, MR starts to rise again as it reaches the limit stop, HR1 becomes even noisier as the impactor decelerates completely and HR2 increases less steeply as most of the additional deceleration load starts to be bypassed through the overload protection cylinder. The SEA is reduced from 63.6 J/g for MR to 59.8 J/g for HR1 to 51.5 J/g for HR2. It should also be noted, that the measured SEA values are within the range of the findings of Courteau under quasi-static (QS) and HR loading for 20° tulip-triggered QI IM7/8552 tubes. He reported 65.8 ± 8.5 J/g for QS and 54.8 ± 1.0 J/g for HR loading. 47 The coefficient of variation (CV) is comparably high for the HR1 crushing stress because the pixel-induced noise increases when the impactor is decelerated completely. Other than this, CV does not exceed 15% for any key figure. Depictions of the experimental failure patterns are not shown in this section because they are included in the following comparisons with the numerical models.
Evaluation of numerical models
Medium-rate domain
Figure 4(a) and (b) are the stress-displacement and energy-displacement diagrams of the MR experiments as well as the corresponding 4S and 16S simulations. Failure patterns of the MR experiments and simulations are shown in Figure 5, a numerical overview of the curve characteristics is shown in Table 2. The stress increase in all simulations is initially underestimated in comparison to the experiments. Debris generation could be the cause of this deviation since in the MR experiments, the material is crushed beneath the impactor and the specimen still has intact fibre bundles linked to it. Therefore, fronds undamaged in fibre direction remain in the fracture zone and can enhance load introduction into the impactor. By contrast, debris is removed in the simulations when elements reach the critical effective strain. This leads to conflicting requirements to either keep elements available for the solution or risk negative Jacobians of the element transformation matrix in distorted elements which may abort the simulation. This issue was also discussed by Liu et al.
33
(a) Comparison of stress-displacement average and scatter band from MR experiments with the numerical variants 4S_1mps and 16S. (b) Comparison of the corresponding energy-displacement curves. The trigger end and designated end of the crushing length are depicted as vertical lines. (c) Mean energy absorption and standard deviation from MR experiments and energy breakdowns for the numerical variants at 6.5 mm displacement. MR failure patterns at 3 mm displacement of (a) specimen 6, (b) 4S at original velocity (1mmps), (c) 4S at scaled velocity (1 mps), and (d) 16S model. Failure patterns at 5 mm displacement of (e) specimen 6, (f) 4S at original velocity, (g) 4S at scaled velocity, and (h) 16S model. Cohesives, impactor, and limit stop are removed in the models, shell thickness is shown.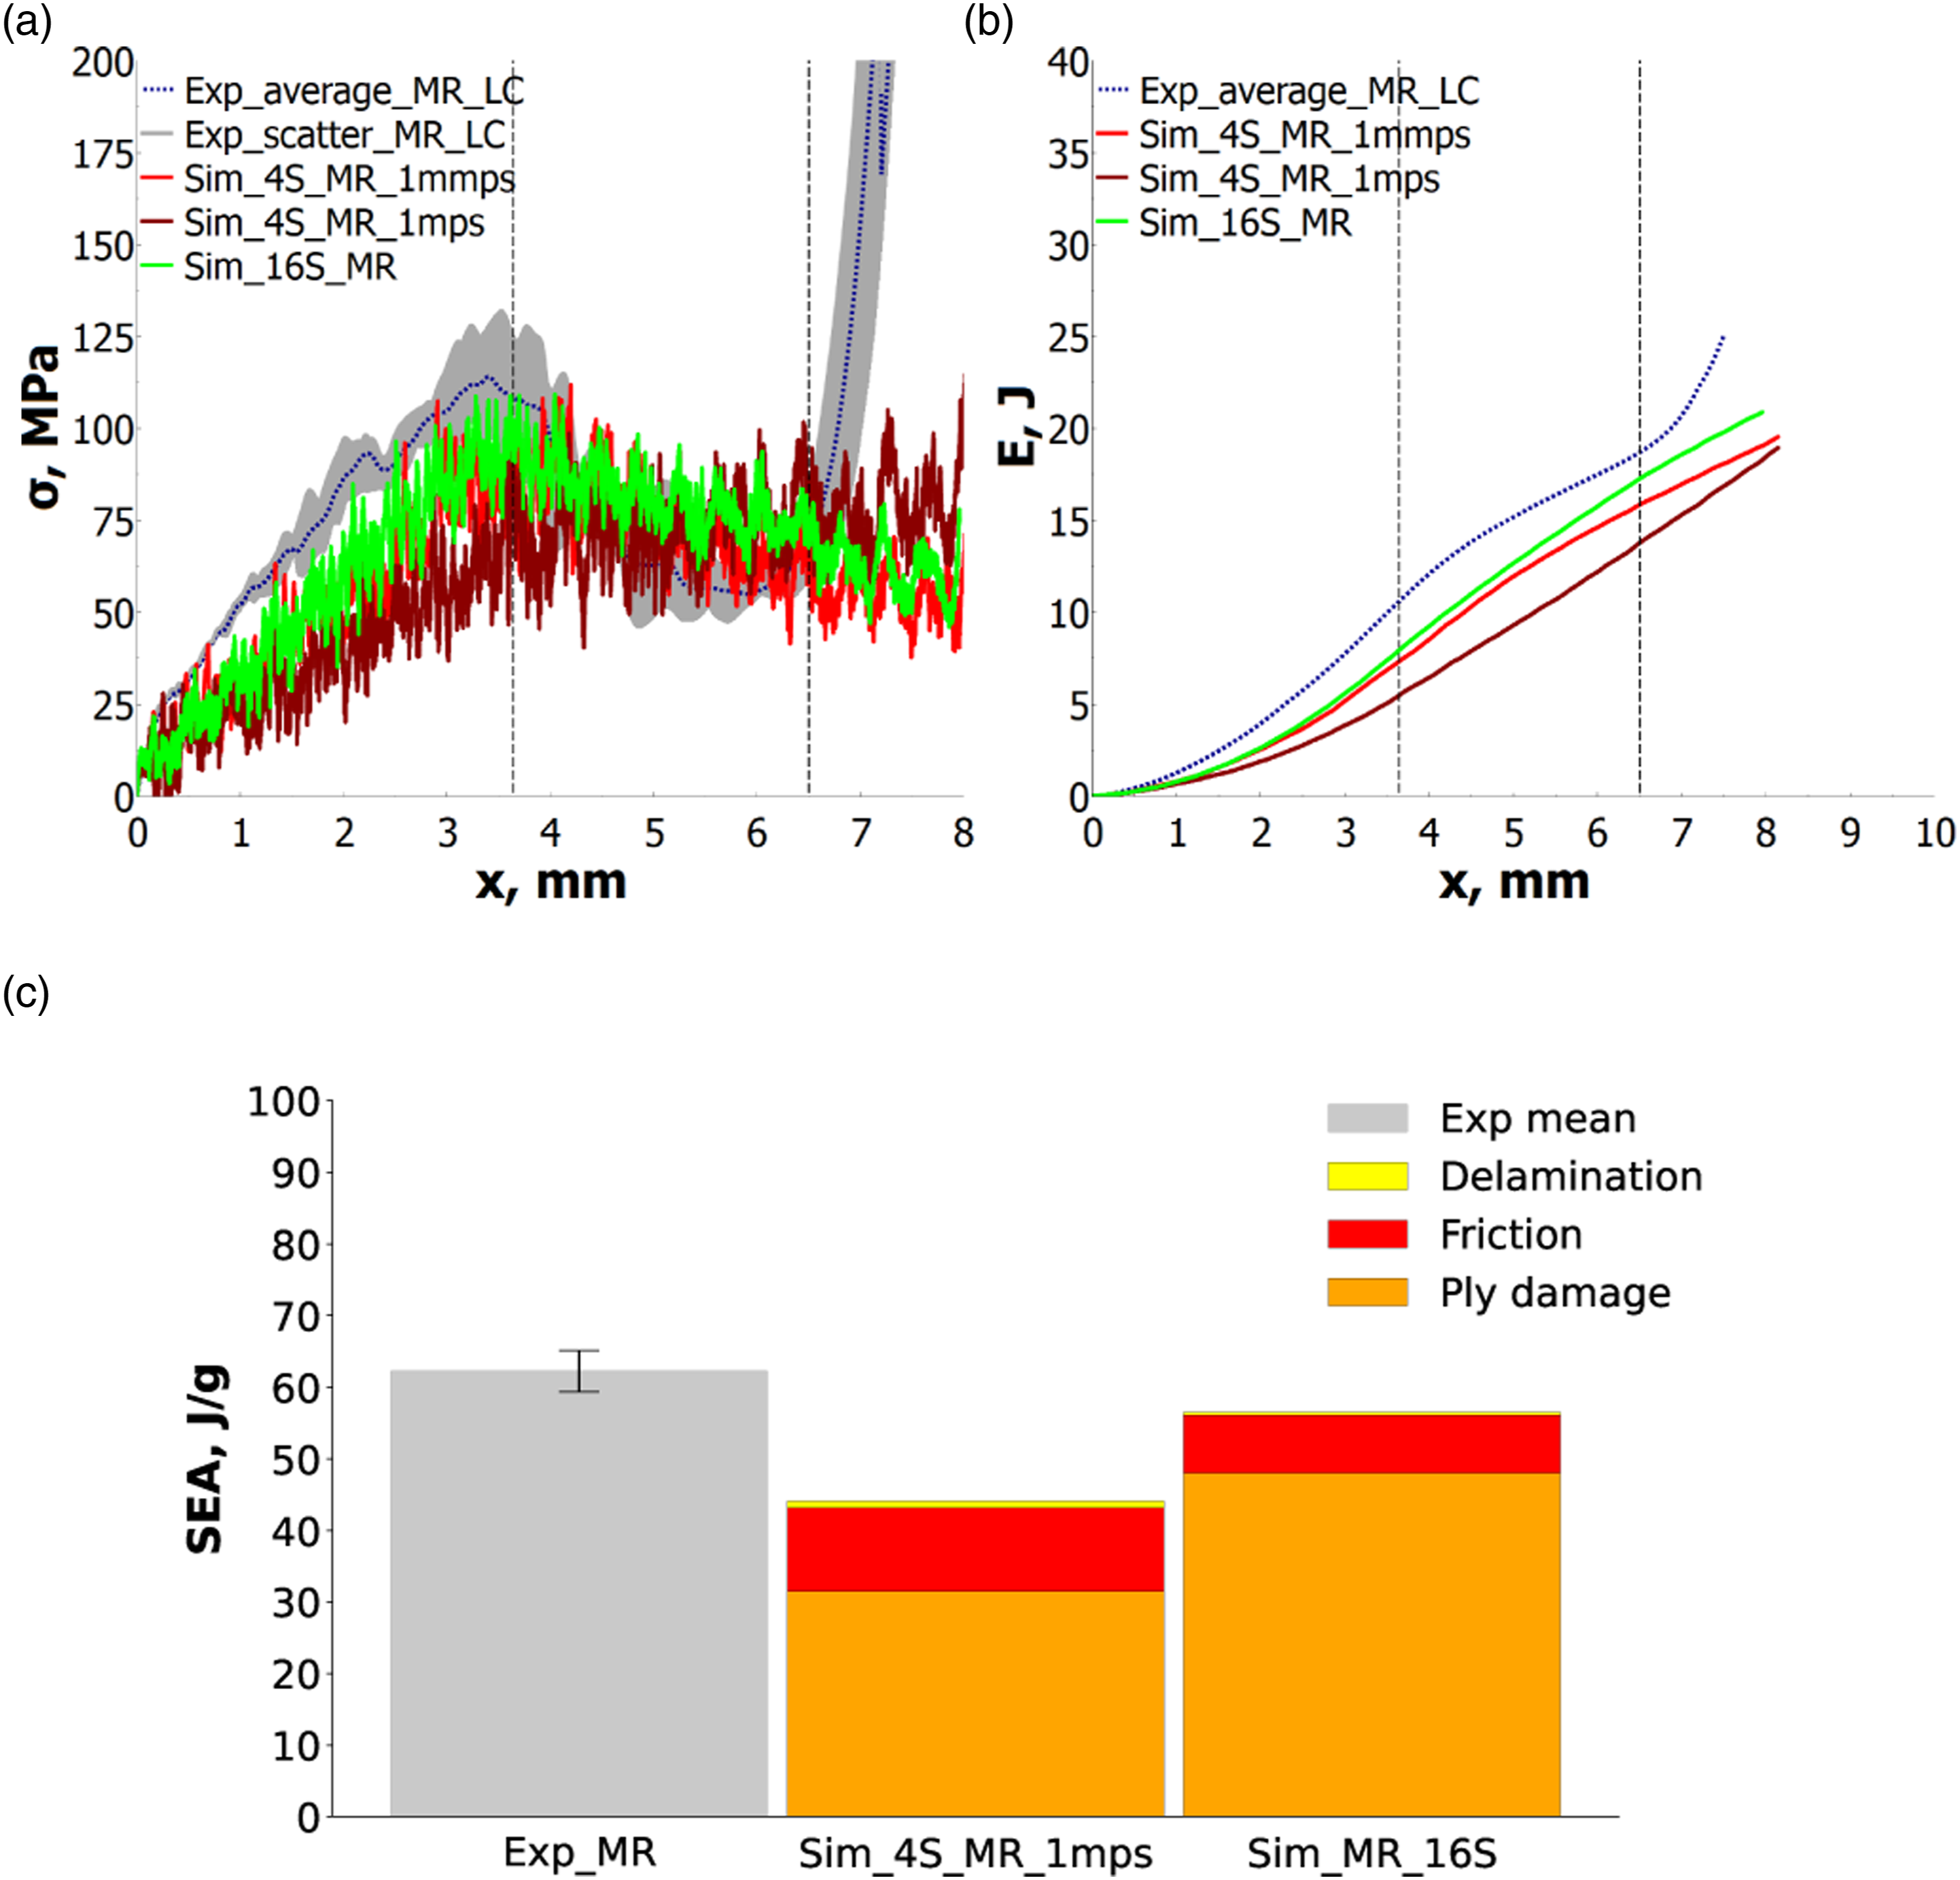
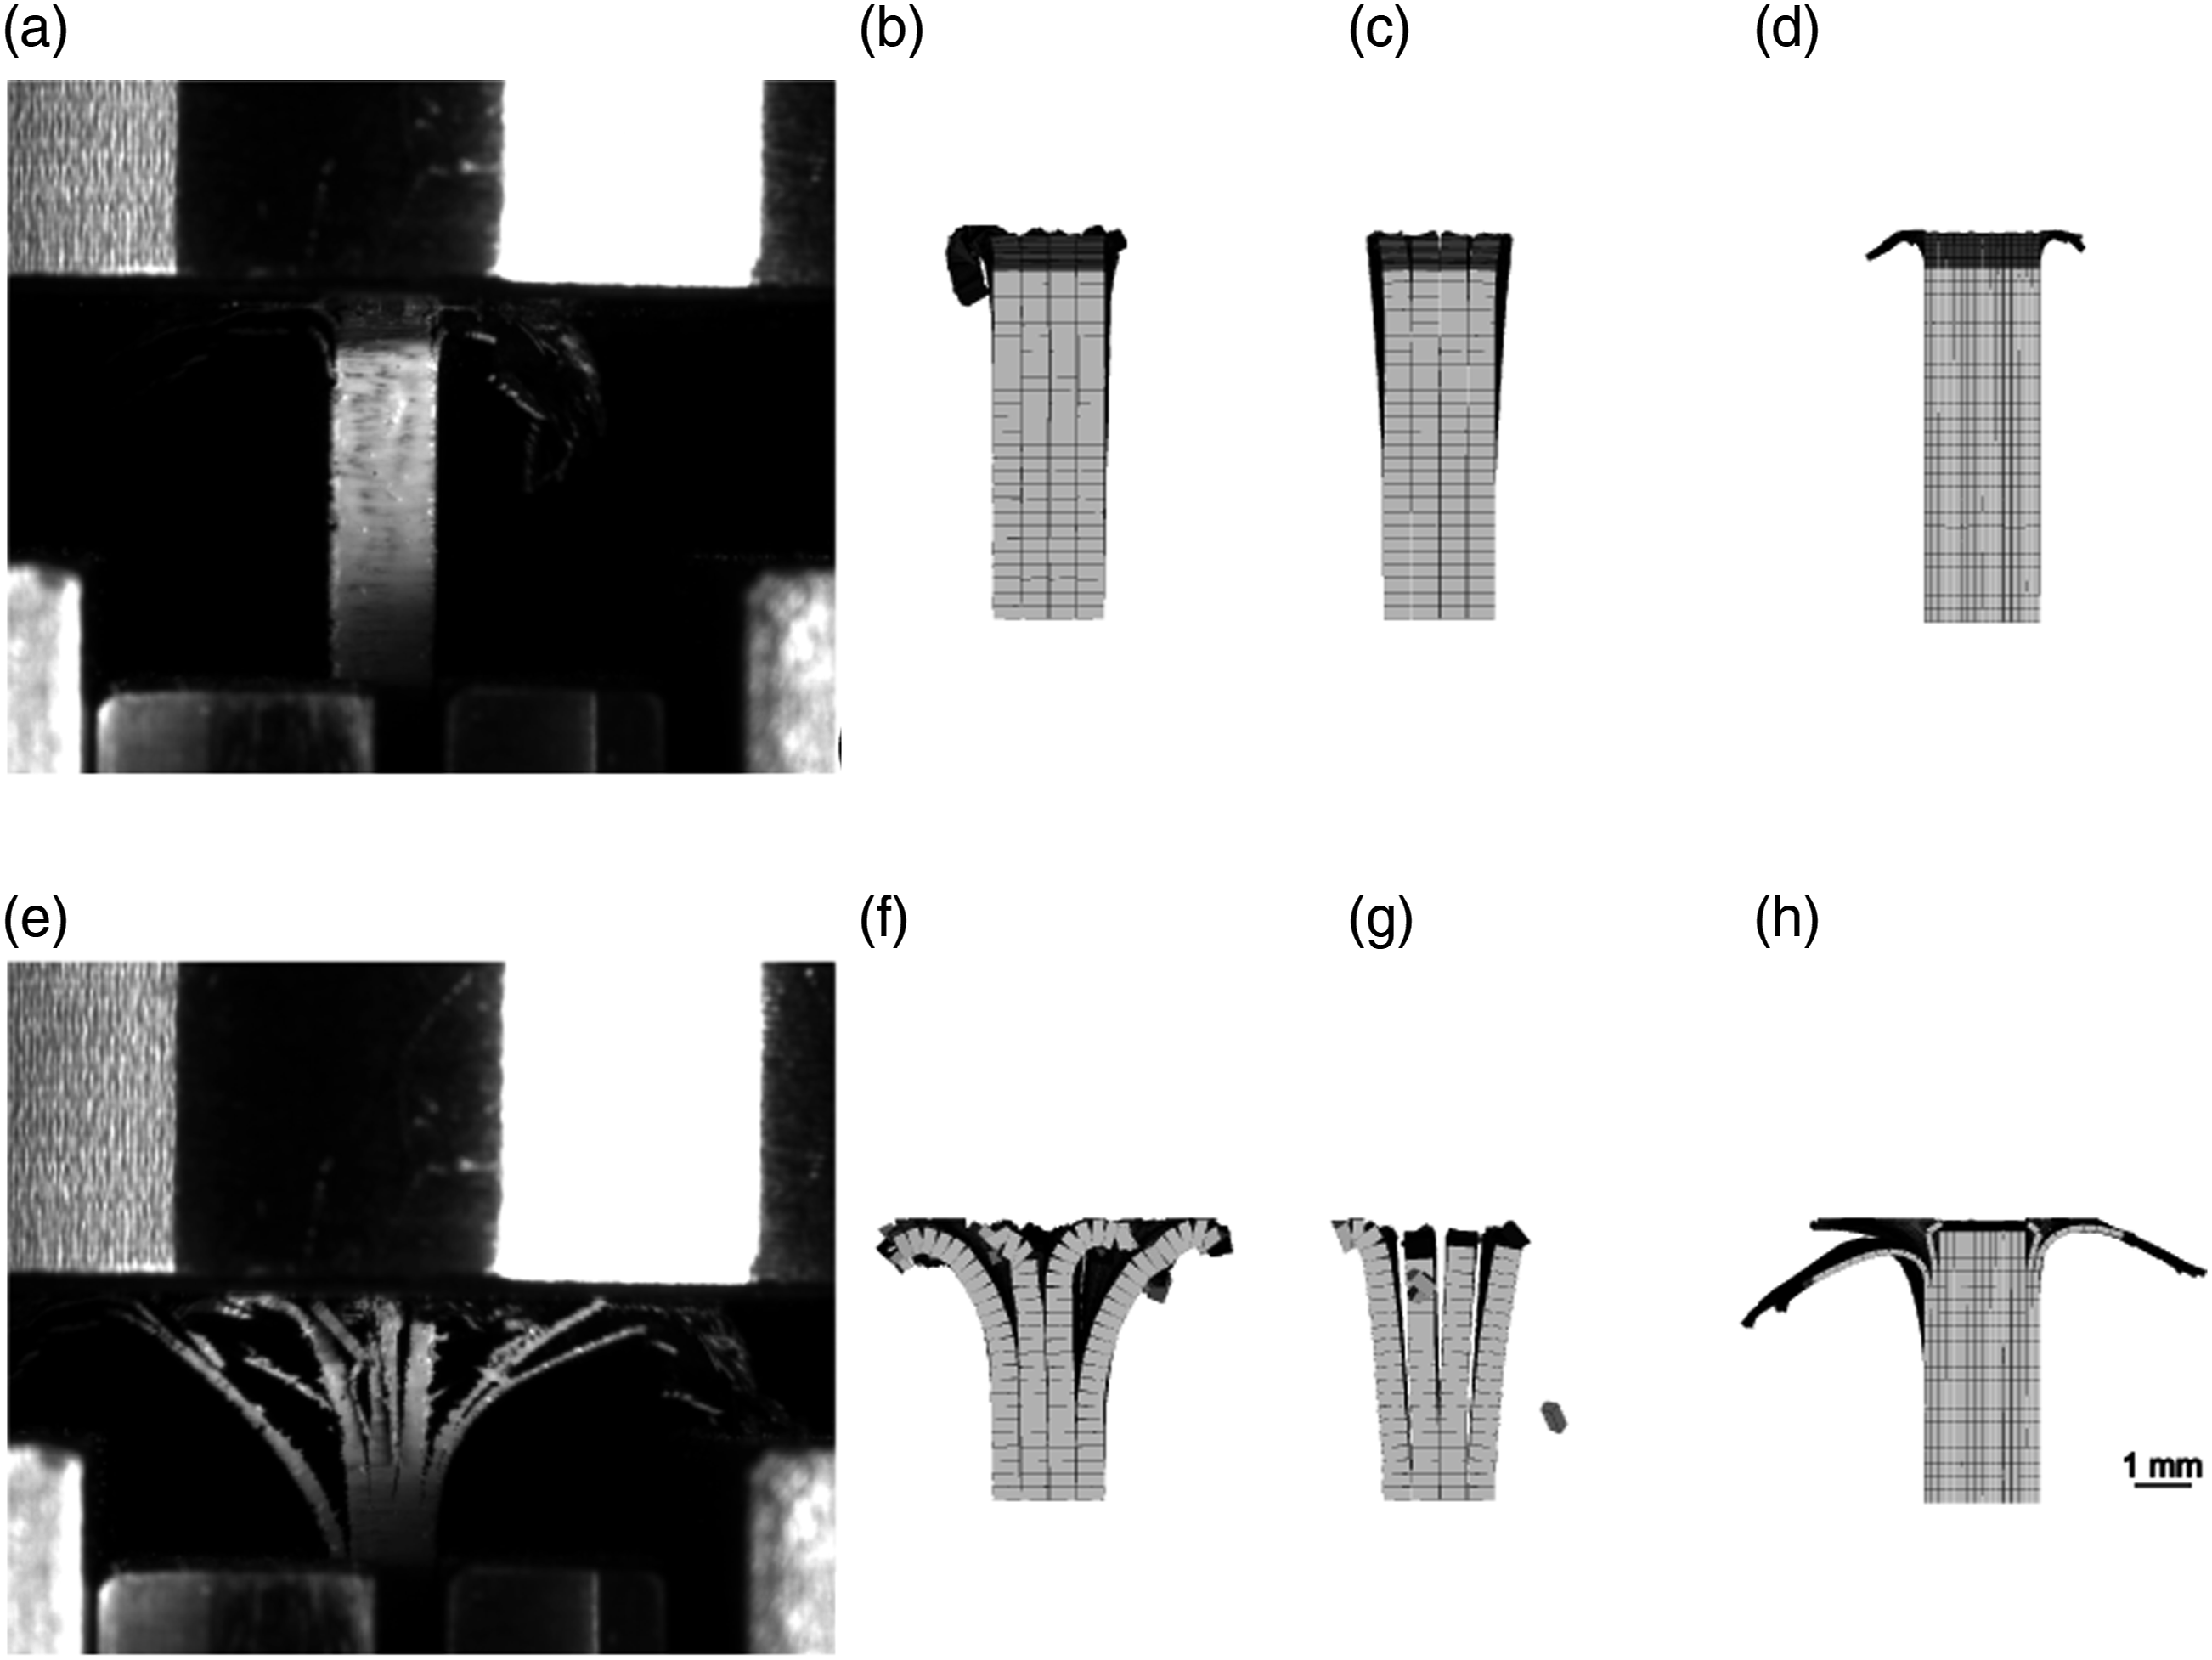
From trigger initiation onward, the 4S variants display different failure patterns and load levels: the original-velocity model (1mmps) can replicate the splaying failure on the outside and fragmentation on the inside of the specimen, as shown in Figure 5(b) and (f). This behaviour yields stress peaks that are close to the maxima observed in the experiments. Given that the load level of 4S_1mmps is higher than that of 4S_1mps, it also confirms the influence of the abovementioned mechanism, because hardly any fronds form in the scaled-velocity simulation. The load drop, crushing stress level (65.0 MPa), and SEA (53.9 J/g), which resemble the experimental mean values, can all be reproduced using the variant 4S_1mmps.
During the initiation phase, 16S_MR displays a damage pattern with outward bending exterior plies similar to the experiments (see Figure 5(d)). Nevertheless, the extent of delamination is underestimated after the trigger phase has ended, as seen in Figure 5(h). The SEA is correctly predicted (58.7 J/g) and the experimental stress maximum is almost reached (109.2 J/g), but crushing stress is overrated (76.5 MPa). A 16S original-velocity variant could further enhance the prediction, as demonstrated by the stress increase seen in the 4S simulation at original velocity compared to scaled velocity. However, a simulation of this kind is beyond the scope of this study because the appropriate DPMs would require cluster runtimes of over 1000 h or an implicit simulation approach, if feasible.
An additional summary of the SEA in the simulations and experiments is given in Figure 4(c), including a breakdown of the energy absorption mechanisms. As can be seen, ply damage accounts for the majority of the energy absorption, whereas delamination and friction absorb the remainder of the energy. Friction (29.4%) and delamination (2.1%) are more significant in the 4S_1mps model than in the 16S model absorbing 14.2% of the energy in friction and 0.7% in delamination mechanisms. The percentage of contributions per mechanism is consistent with component-level literature data at elevated loading rates.2,37,48 Although the original-velocity 4S simulation was conducted using a model that was equivalent to the scaled-velocity run, it does not provide a proper distribution of the energies for each mechanism. A more in-depth investigation of this problem was outside the scope of this study due to the excessive simulation runtime. Hence, no energy breakdown is presented for this simulation.
High-rate domain 1
Figure 6(a) and (b) present the stress-displacement and energy-displacement diagrams of the HR1 experiments and the two simulations. Damage patterns during and after the trigger phase are shown in Figure 7 along with the related damage patterns of a typical experiment. Moreover, Table 2 provides a summary of the maximal initiation stress, crushing stress, and SEA. (a) Comparison of stress-displacement average and scatter band from HR1 experiments with the numerical variants 4S and 16S. (b) Comparison of the corresponding energy-displacement curves. The trigger end and designated end of the crushing length are depicted as vertical lines. (c) Mean energy absorption and standard deviation from HR1 experiments and energy breakdowns for the numerical variants at 6.5 mm displacement. HR1 failure patterns at 3 mm displacement of (a) specimen 3, (b) 4S, and (c) 16S model. Failure patterns at 5 mm displacement of (d) specimen 6, (e) 4S, and (f) 16S model. Cohesives, impactor, and limit stop are removed in the models, shell thickness is shown.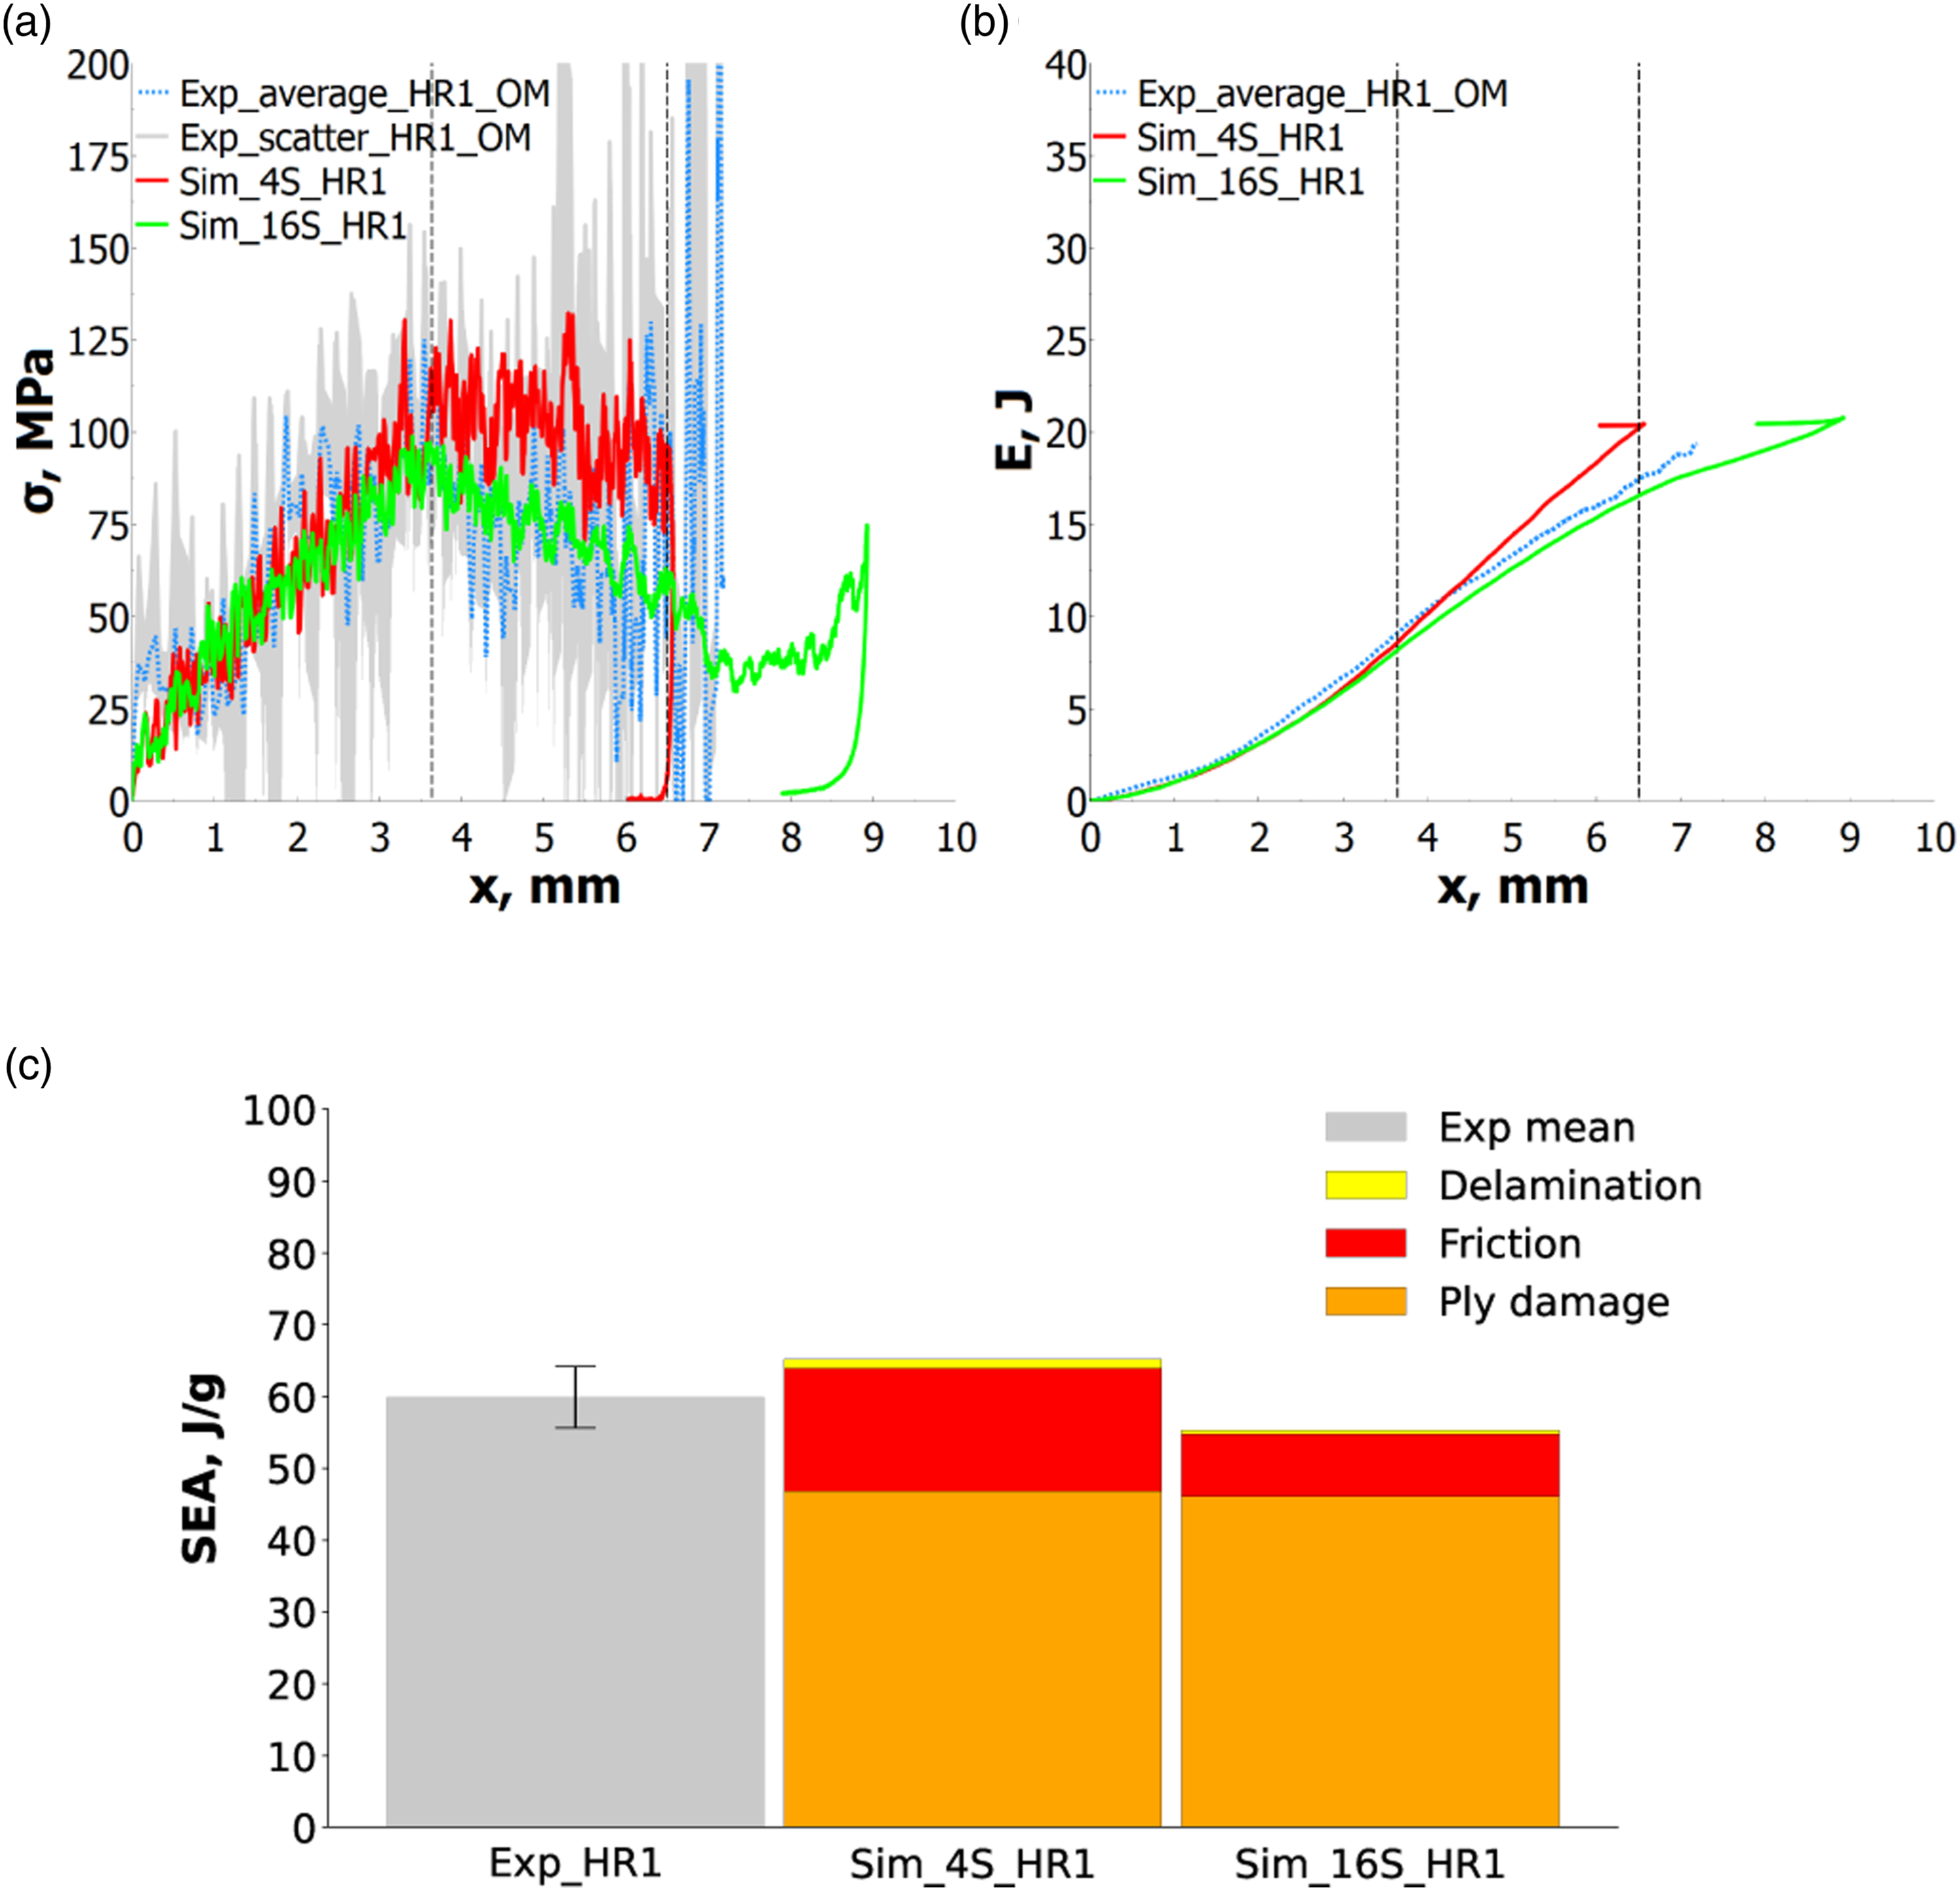
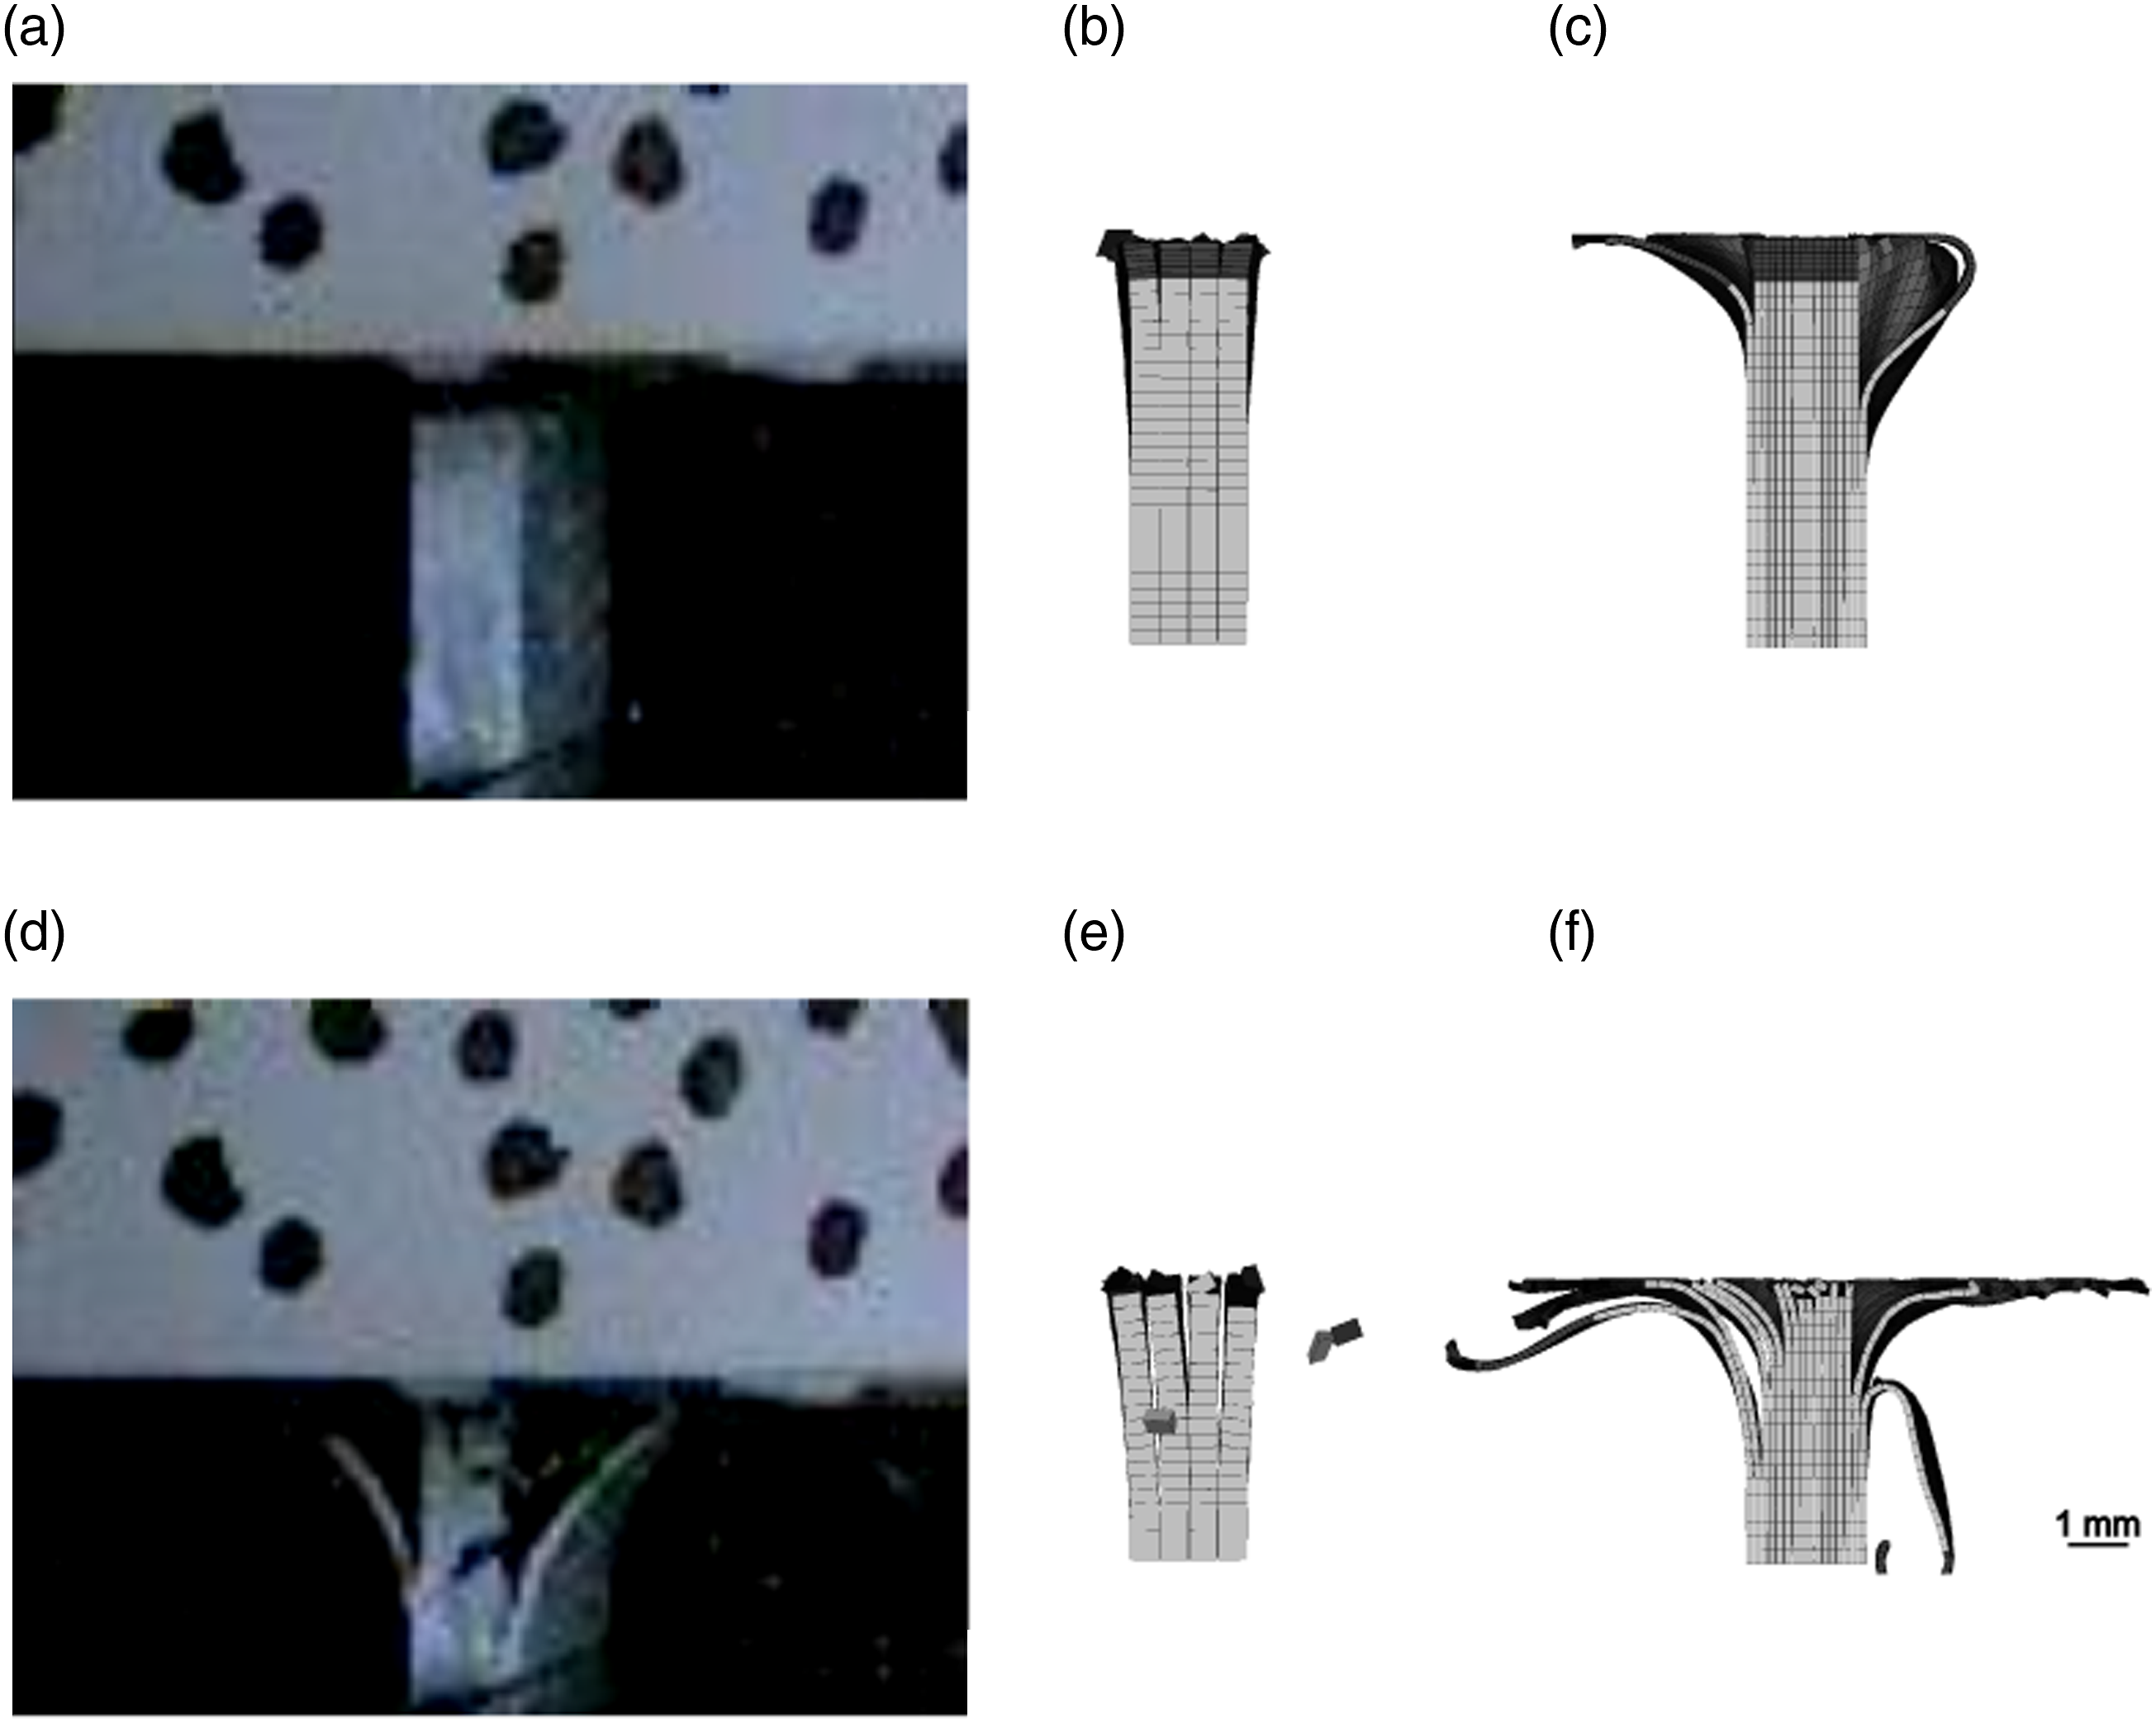
The curve of the 4S variant initially coincides with the experimental stress increase. The maximum initiation stress peaks in the experiments lead to good comparability of the variant’s tabular values (130.3 MPa). Also, SEA is predicted well (68.6 J/g). Although interlaminar gaps appear during crushing, the laminate layers remain connected over the whole crushing length as shown in Figure 7(b) and (e). Without delamination, the material behaviour is driven by strain-rate-induced intralaminar property value increases. Thus, stress remains high after the impactor reaches the trigger end, leading to an overprediction of the experimental crushing stress (97.0 MPa).
The 16S model displays significant delamination over the complete crushing length (see Figure 7(c) and (f)). The model overestimates the delamination of the outer 90° plies, but the impactor hides the fracture zone in the experiments, making it difficult to evaluate. Fortunately, the damage pattern can also be evaluated from the remains of the specimen because the impactor was completely decelerated within the free length instead of hitting the limit stop as for MR and HR2. Figure 8 shows the microsection of a central cut along the impact direction for representative specimen 3. The upper part of the specimen shows completely delaminated and partly fractured plies along with debris, whereas the lower portion of the specimen is undamaged. Nevertheless, interlaminar cracks, which are mainly located between the outer and inner 0° plies, extend far into the intact laminate. This observation agrees well with the failure pattern in Figure 7(f). Additional delamination interfaces lower the maximum initiation stress to 98.9 MPa, which is well within the scatter band of the experiments, but below the mean peak value as already explained above. The model is also able to precisely predict the crushing stress (65.3 MPa) and SEA (56.3 J/g). Microsection of HR1 specimen 3.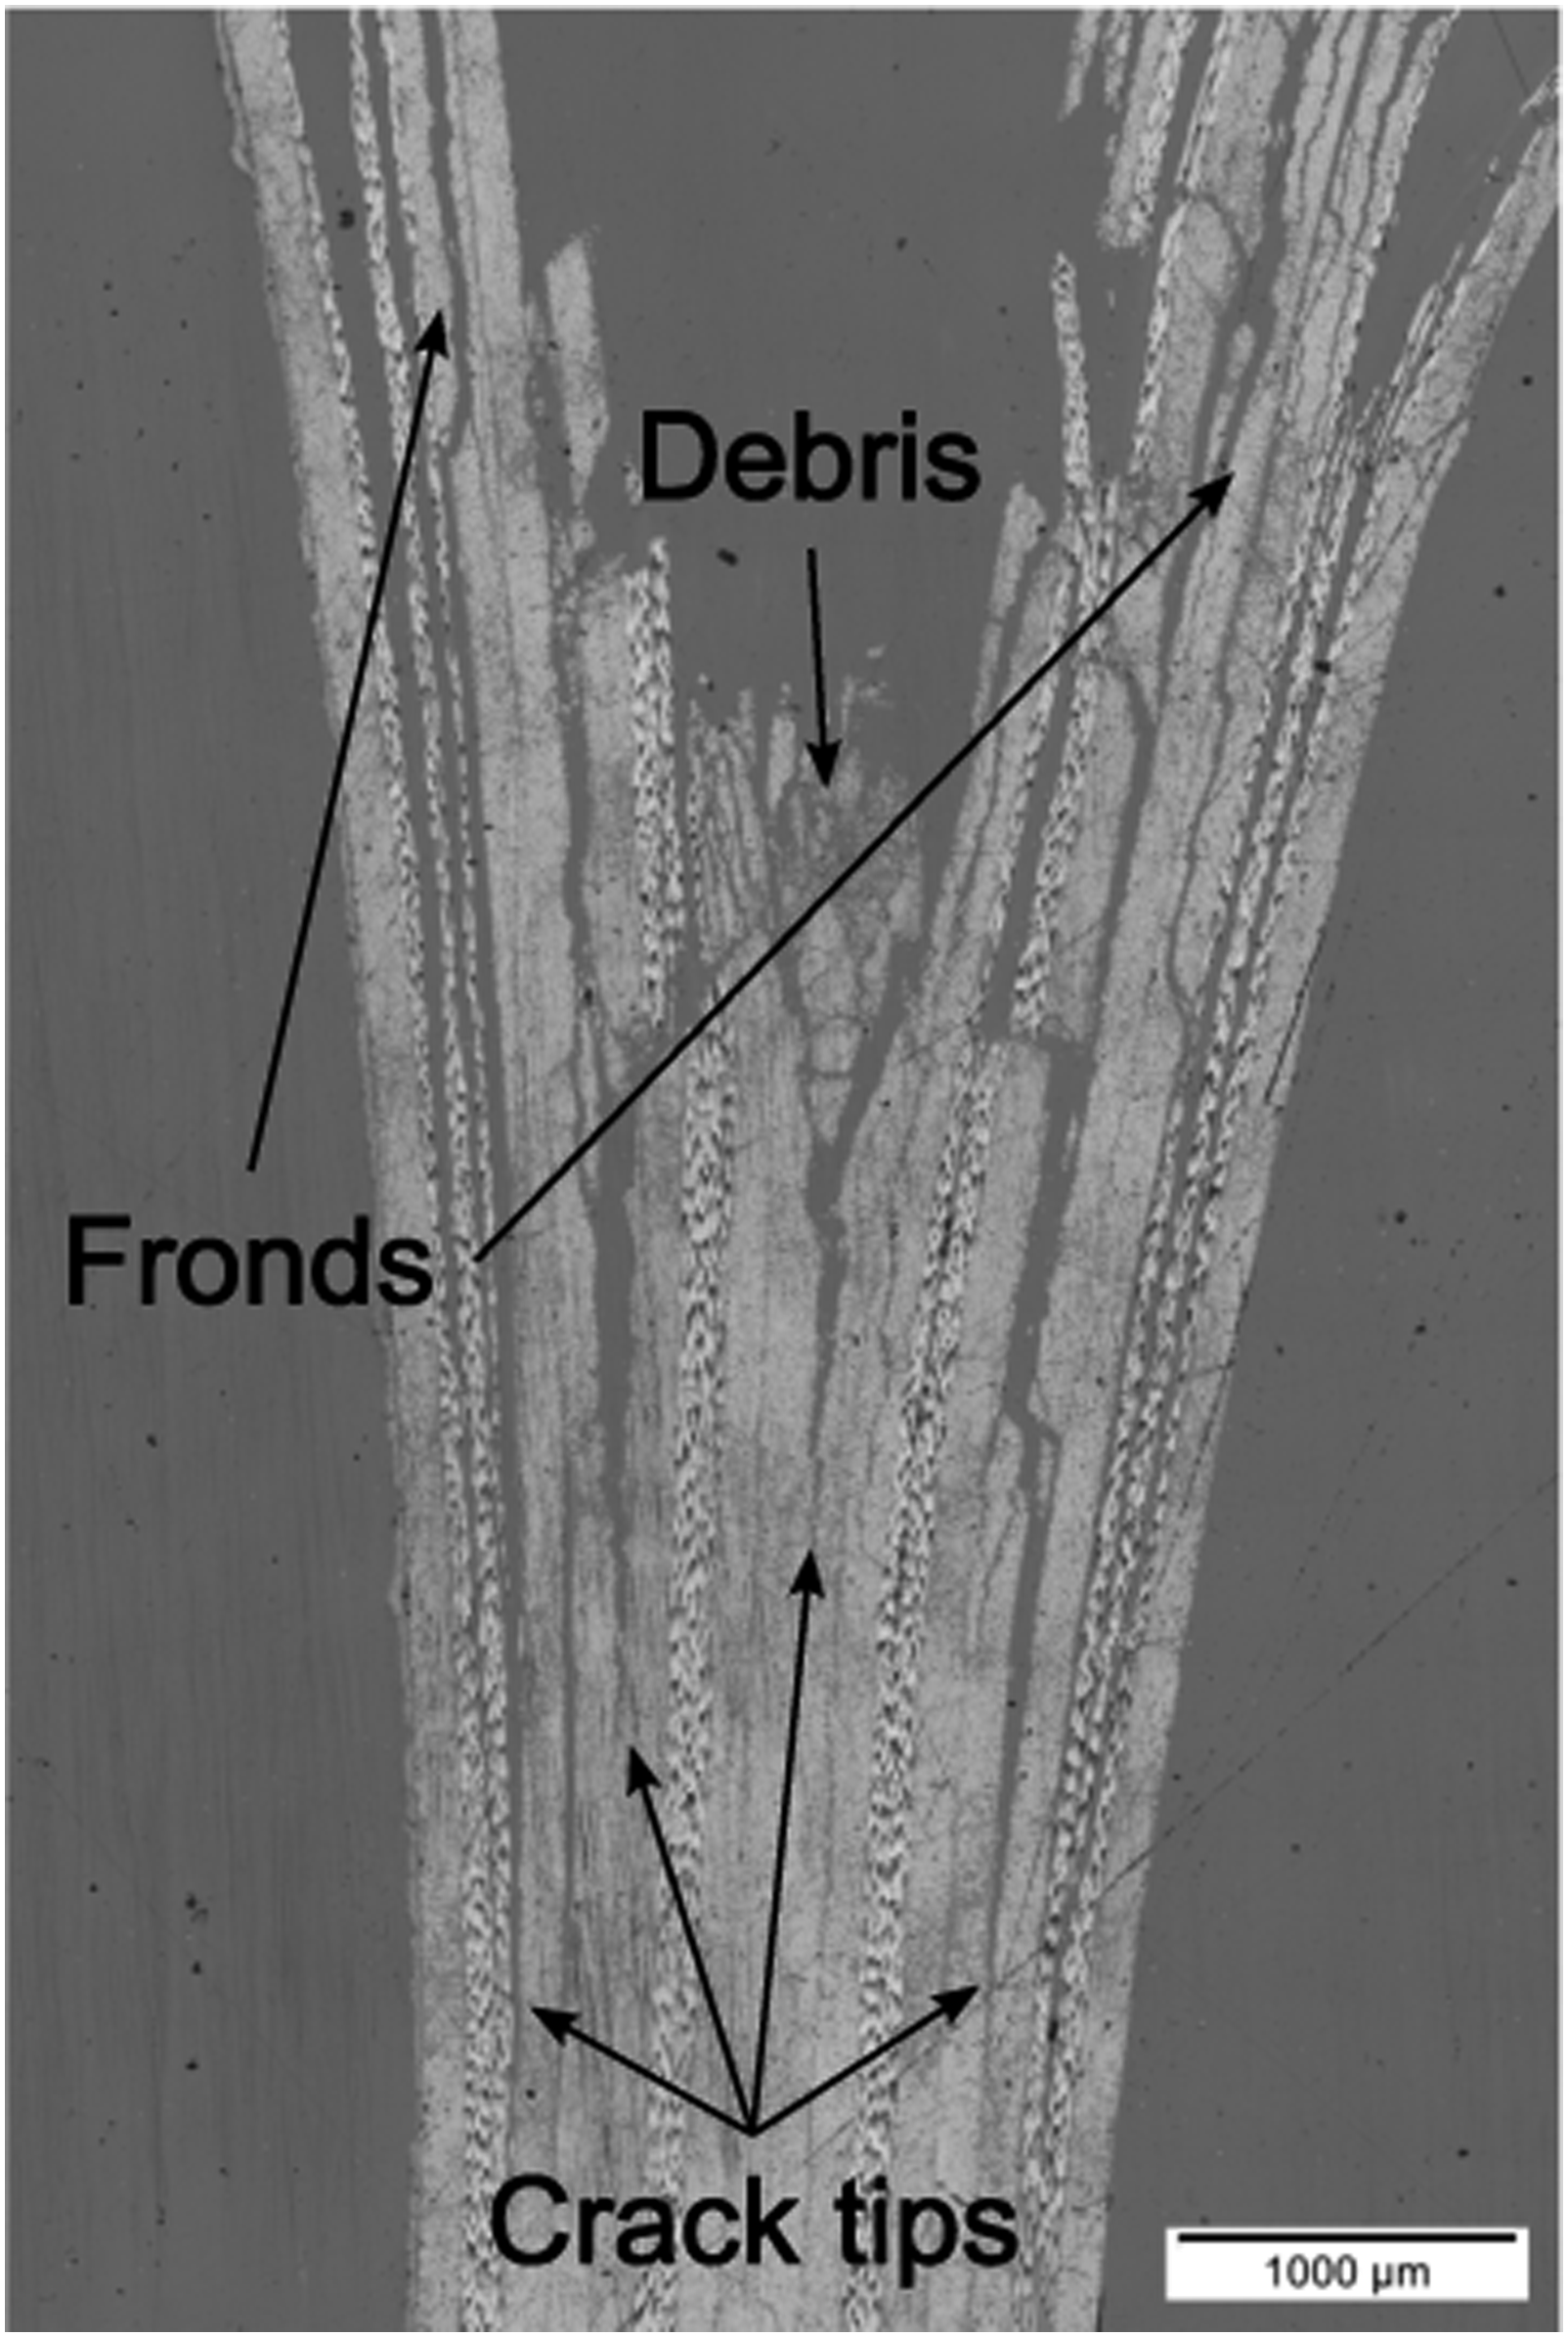
The SR levels in the plies and in the delamination planes can be evaluated using the 16S_HR1 model. The effective intralaminar and interlaminar SR fringe plots are shown in Figure 9(a) and (b), respectively. In the trigger initiation phase, the figures show local SR multiple times the nominal SR (159 1/s). The interlaminar SR field shows less scattering than the intralaminar field. Unfortunately, a meaningful comparison of the numerical results with high-speed camera footage was not possible because the SR field is very localised and also partly obscured by debris forming below the impactor. (a) SR fringe plot of outer 90° layer and (b) of cohesive elements on the 16S_HR1 model. All fringe plots are shown on undeformed mesh and at 1.5 mm diplacement.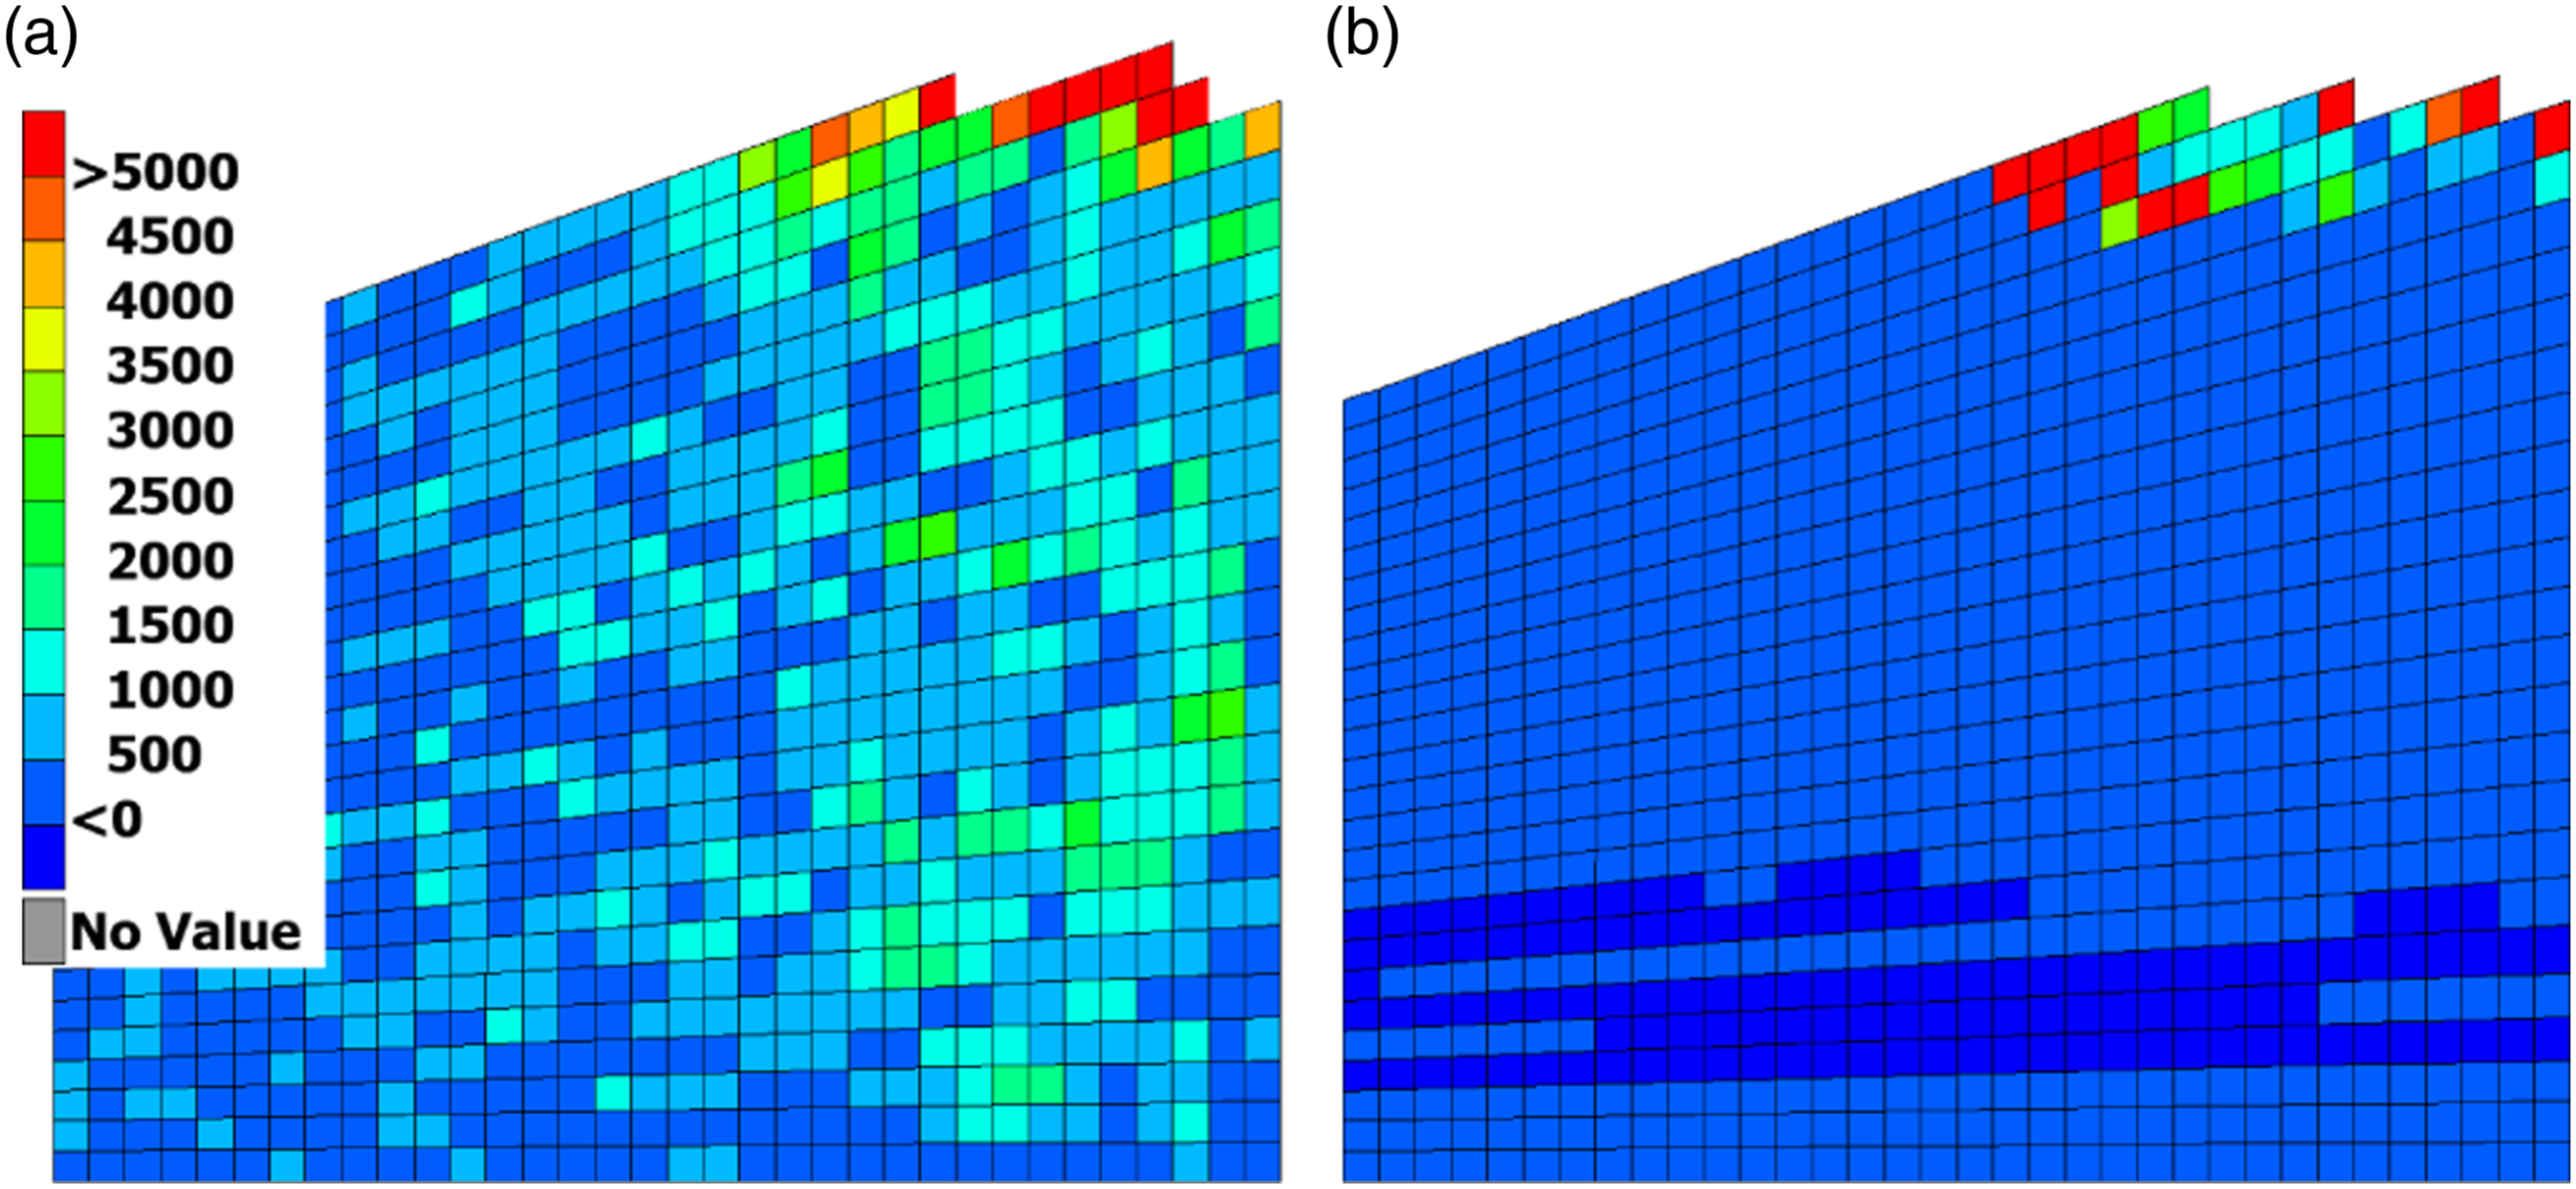
The breakdown of the absorption mechanisms for the simulations and the total value of the SEA in the experiments are shown in Figure 6(c). Ply damage absorbs the majority of the energy whereas delamination and friction only play a minor role as a means of energy dissipation. In the 4S model, friction (26.3%) and delamination (1.8%) are more significant than for the 16S model, in which 15.7% of the energy is absorbed by friction and 0.9% by delamination. The ratio of contributions per mechanism agrees well with literature values.2,37,48
High-rate domain 2
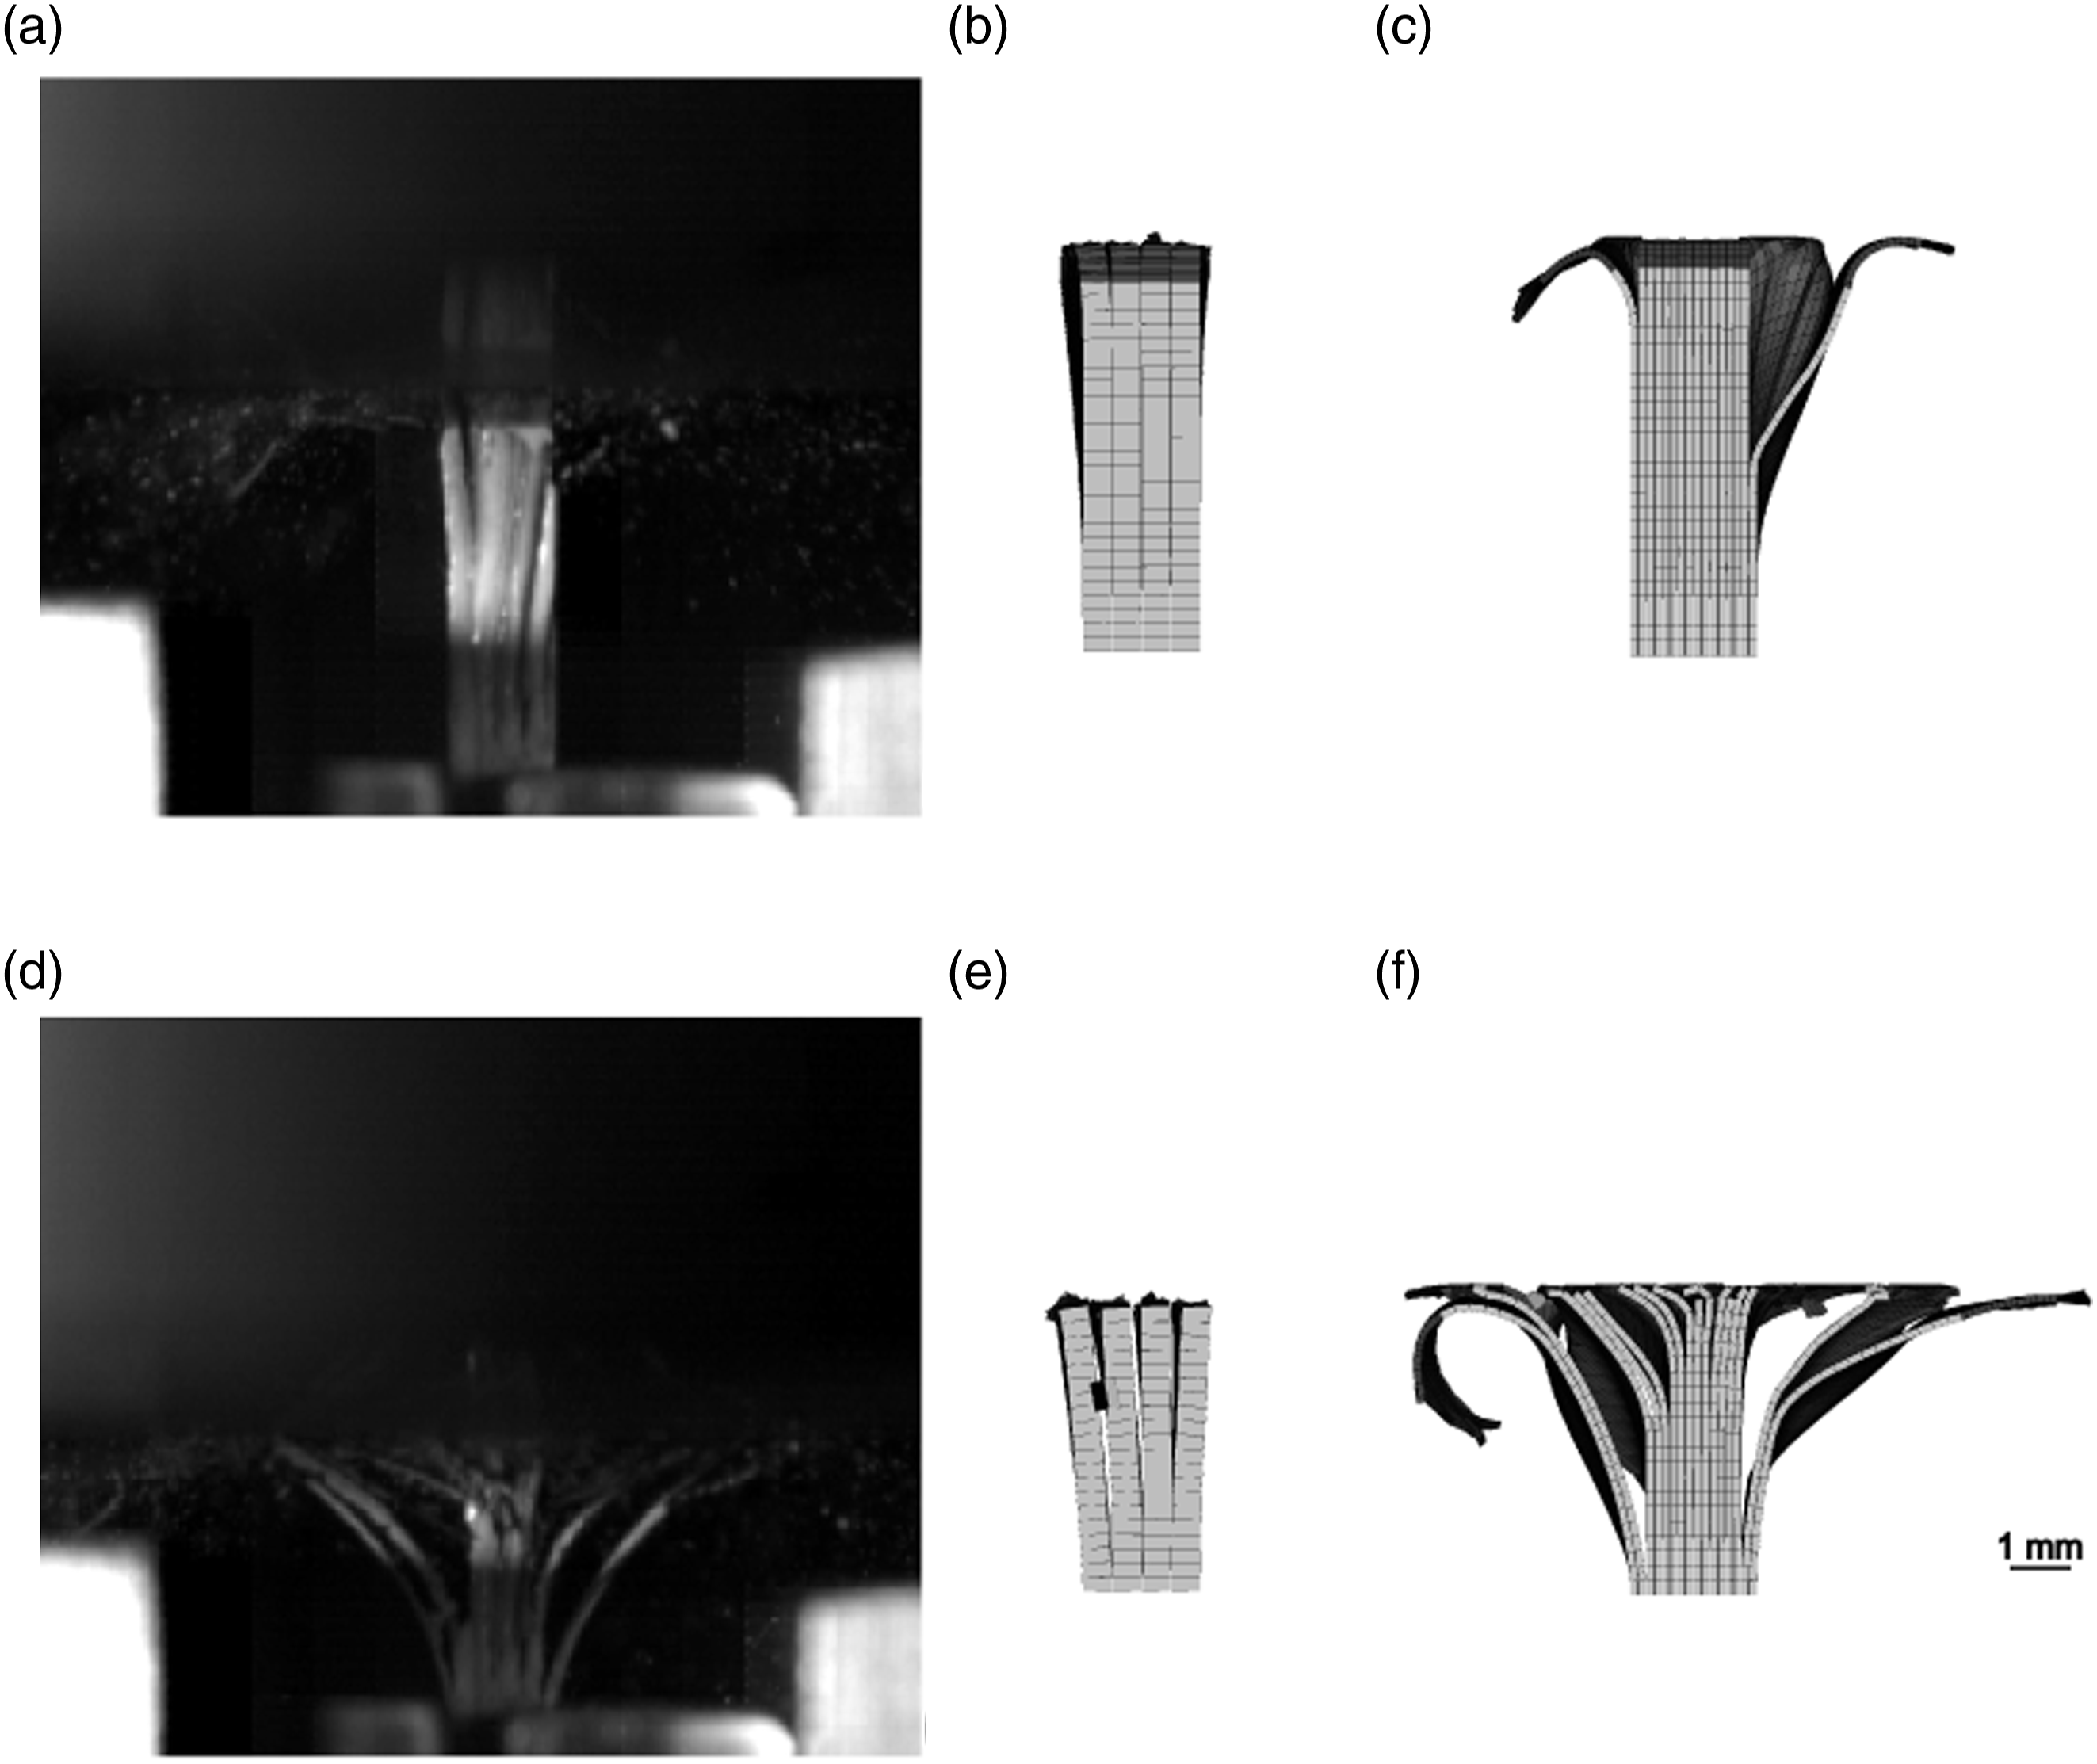
Figure 10(a) and (b) are the stress-displacement and energy-displacement diagrams of the HR2 experiments and the two simulations. The models during and after the trigger phase are provided in Figure 11 along with the related damage patterns of a typical experiment. Moreover, Table 2 provides a summary of the maximal initiation stress, crushing stress, and SEA. (a) Comparison of stress-displacement average and scatter band from HR2 experiments with the numerical variants 4S and 16S. (b) Comparison of the corresponding energy-displacement curves. The trigger end and designated end of the crushing length are depicted as vertical lines. (c) Mean energy absorption and standard deviation from HR2 experiments and energy breakdowns for the numerical variants at 6.5 mm displacement. HR2 failure patterns at 3 mm displacement of (a) specimen 6, (b) 4S, and (c) 16S model. Failure patterns at 5 mm displacement of (d) specimen 6, (e) 4S, and (f) 16S model. Cohesives, impactor, and limit stop are removed in the models, shell thickness is shown.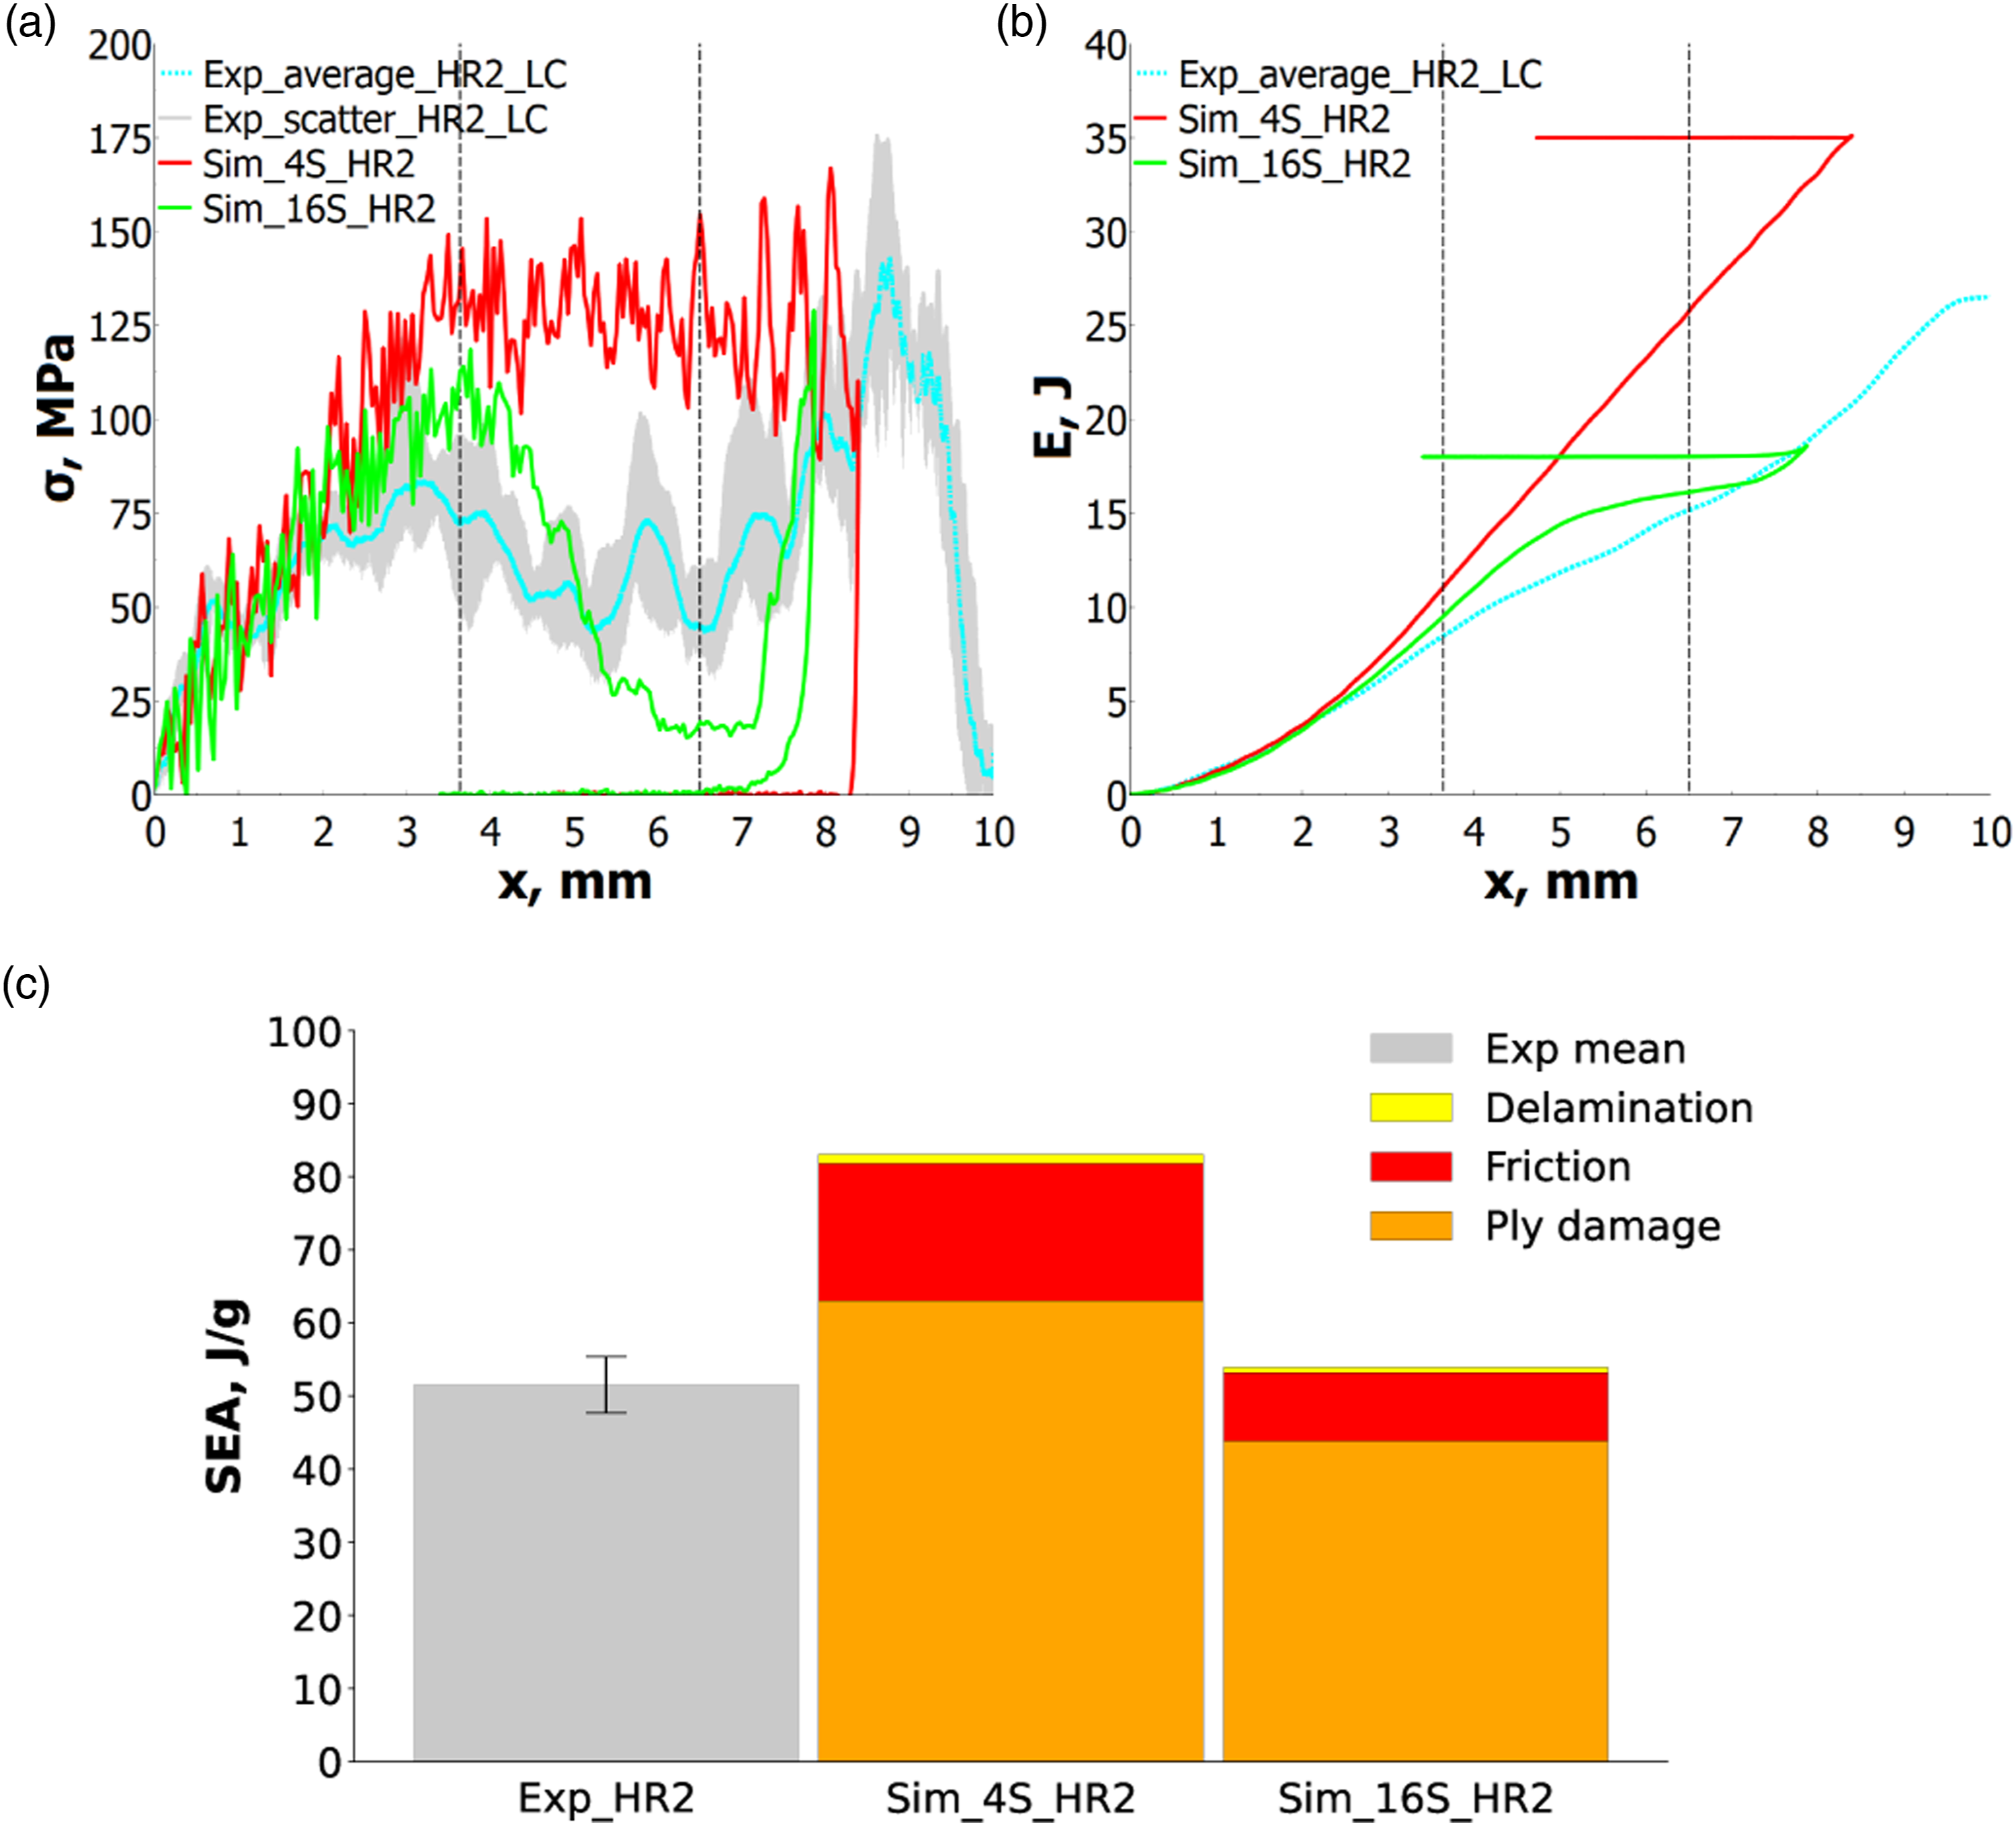
The curve of the 4S variant initially matches the experimental stress increase, but along with the SEA (87.0 J/g), it exceeds the maximum initiation (153.4 MPa) and crushing stress (124.3 MPa). Again, the laminate layers remain connected over the whole crushing length (see Figure 11(b) and (e)), such that the crushing stress is overpredicted. Also, it should be noted that the ’bullnose effect’, which produces a positive fillet at the edges of shell elements is the cause of the maximum displacements varying between the variants although a limit stop was added at 8 mm displacement. This virtual fillet, which has a radius half the height of the shell, causes the specimen’s edge to come into premature contact with the impactor, thus causing a maximum displacement of more than 8 mm. The 4S model is subject to this effect even more.
From the trigger phase on, 16S displays notable delaminations and fronds of damaged material in the outer shells (see Figure 11(c) and (f)). In both experiment and simulation, a firstly one-sided detaching of the outer plies occurs. When compared to the 4S model, delamination lowers the maximum initiation stress to 118.5 MPa at the trigger end. Interlaminar failure can also be observed in the experiments (see Figure 11(a)). The maximum stress level is higher when compared to 16S_HR1, but is still close to the experiments as is the case for the SEA (54.7 J/g). A systematic underestimation of the residual elasticity is to blame for the load reduction that occurs after the trigger phase has ended. The residual elasticity in *MAT_058 decreases excessively as the damage progresses. This deficiency of the material model was also reported in literature.
49
As a consequence, the primarily load-bearing 0° layers partially buckle, thus interrupting load transmission in these layers (see Figure 12(c)). (a) SR fringe plot of outer 90° layer and (b) of cohesive elements on the 16S_HR2 model at 1.5 mm displacement. (c) 0° damage variable of outer 0° layer on the 16S_HR2 model at 6.5 mm displacement. All fringe plots are shown on undeformed mesh.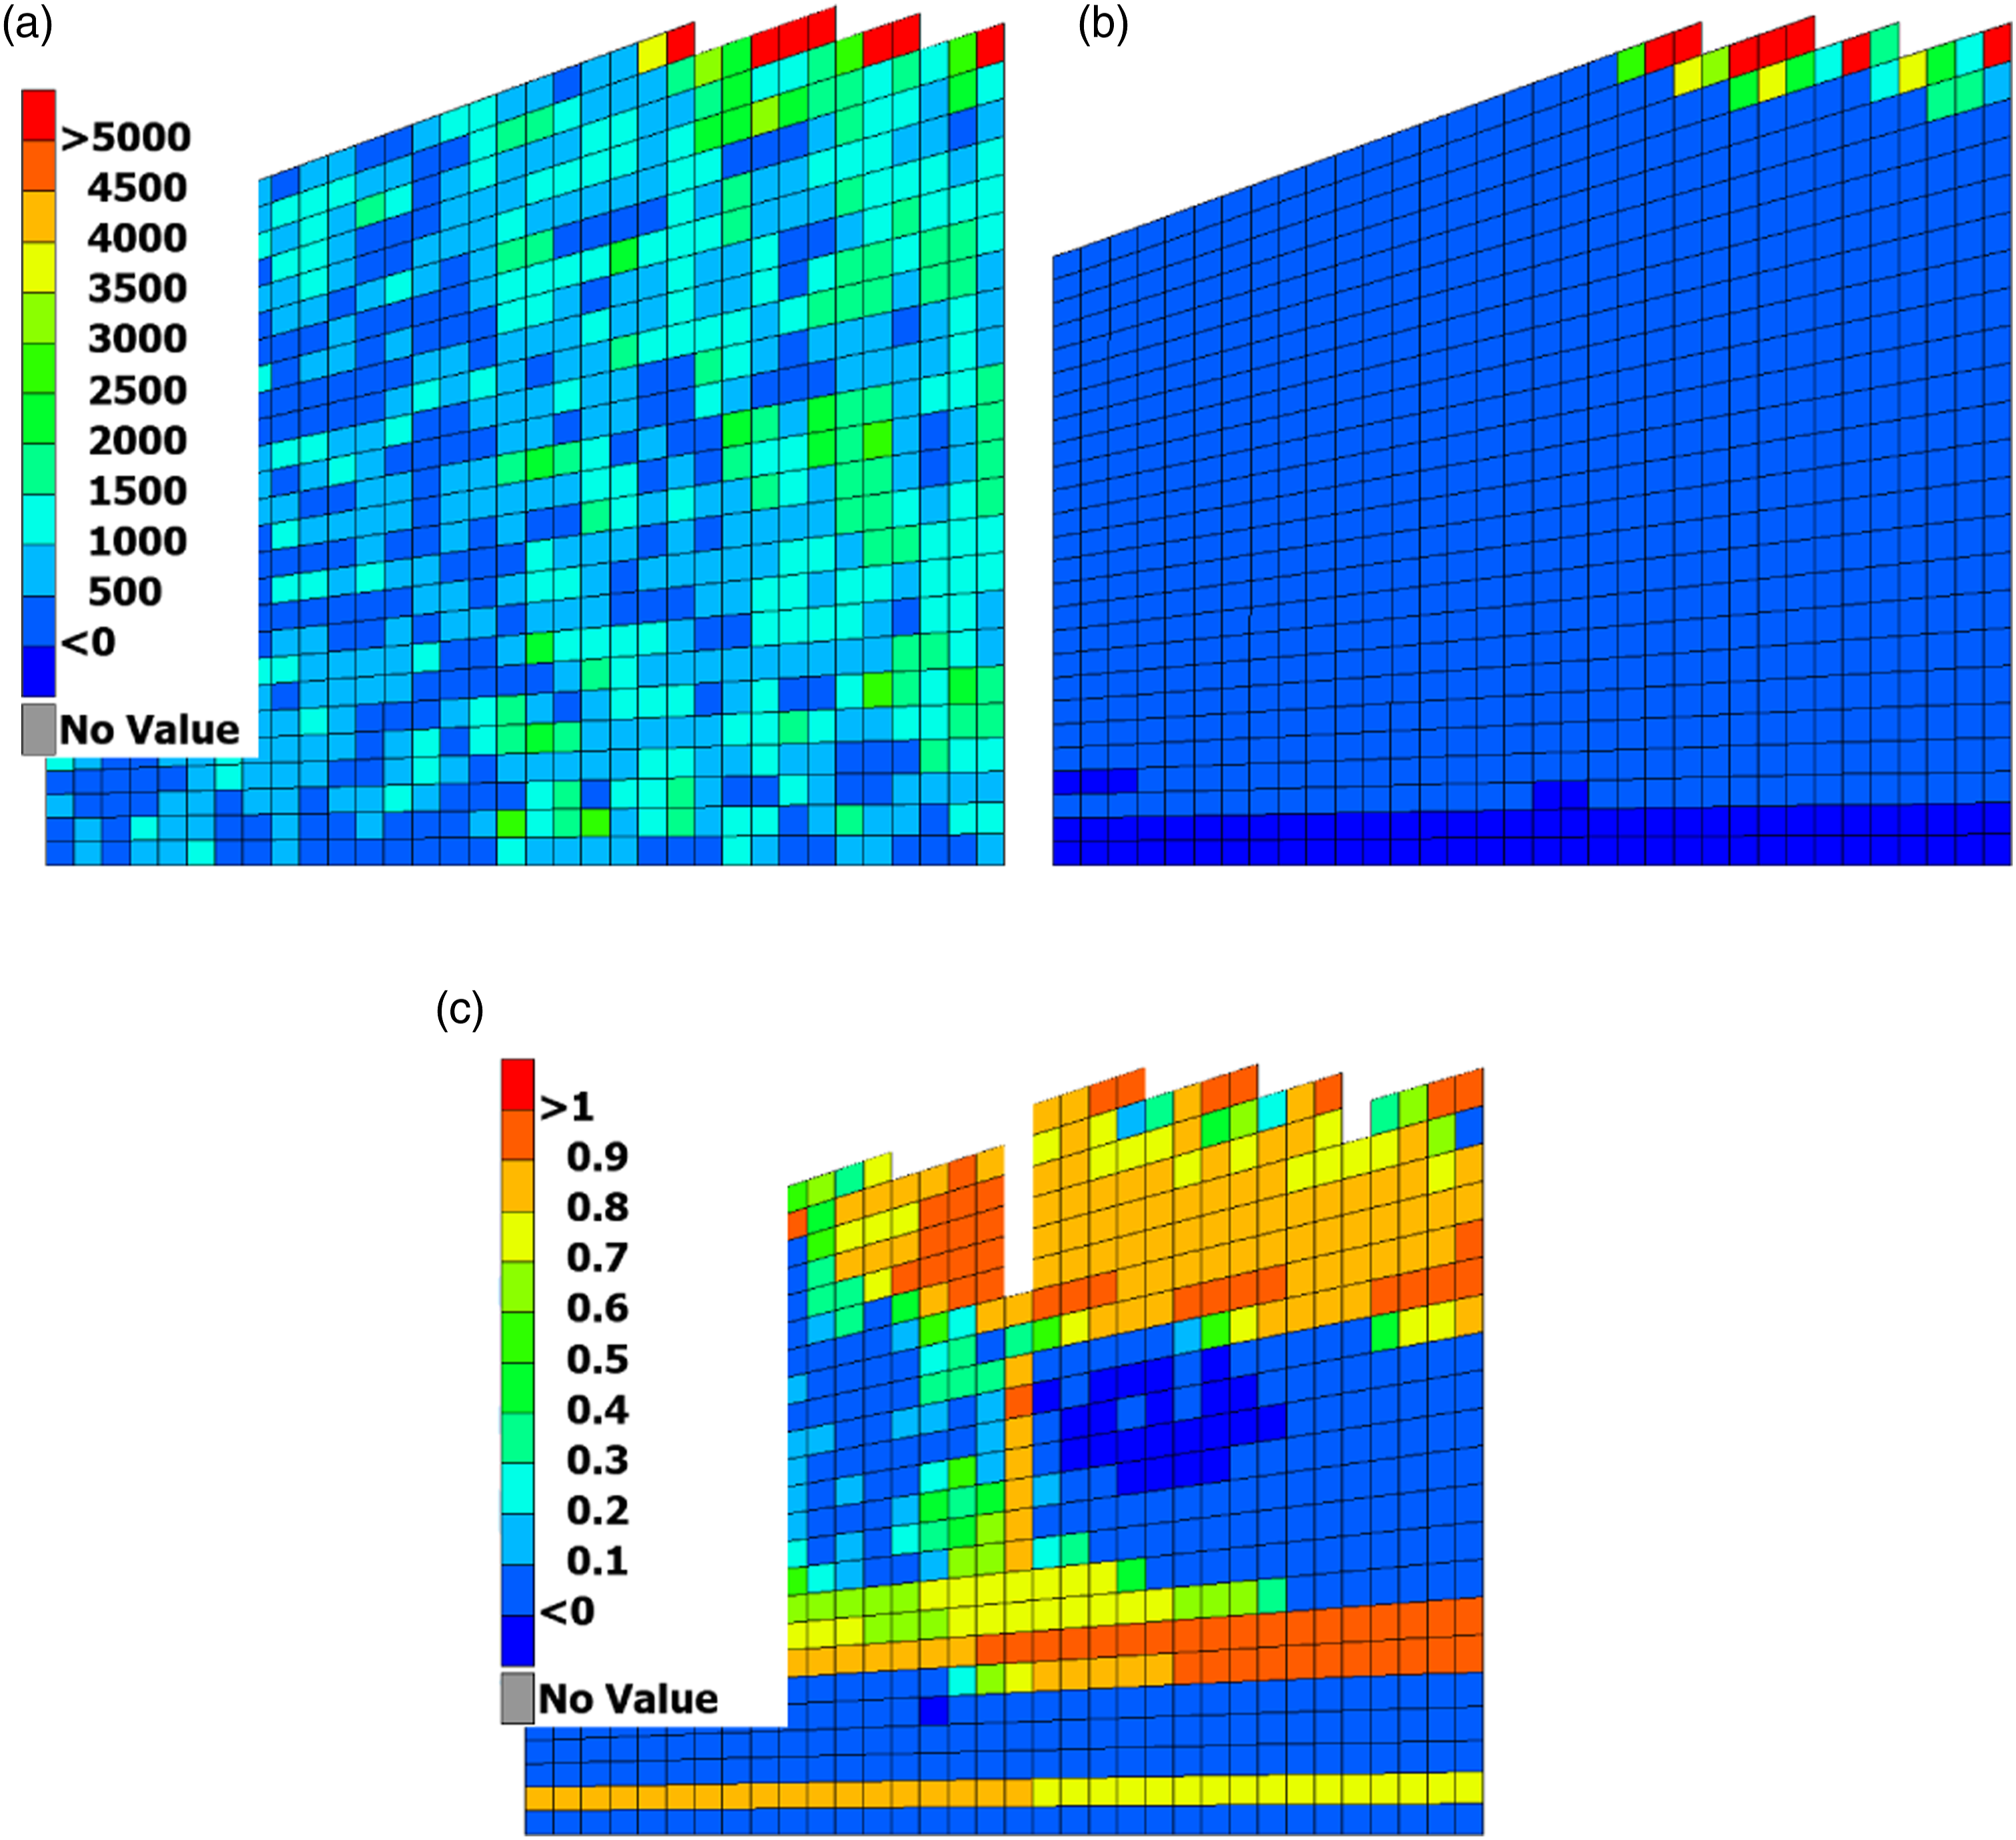
The SR levels in the plies and in the delamination planes can also be evaluated using the 16S_HR2 model. The effective intralaminar and interlaminar SR fringe plots are shown in Figure 12(a) and (b), respectively. Interestingly, the SR field resembles the 16S_HR1 variant although the nominal SR is about three times higher (456 1/s). This points to an even more pronounced localisation of SR effects than can be resolved with the present models. Again, a meaningful comparison of the numerical results with high-speed camera footage could not be conducted due to the reduced visibility of the loaded specimen surface.
The breakdown of the absorption mechanisms for the simulations and the total value of the SEA in the experiments are provided in Figure 10(c). As can be seen, ply damage absorbs most of the energy whereas delamination and friction only account for a small portion. In the 4S model, friction (22.6%) and delamination (1.6%) are more significant than in the 16S model, which absorbs 17.3% of the energy through friction and 1.4% through delamination. The ratio of contributions per mechanism matches literature values.37,48 For the 16S models, a slight increase in the friction and delamination contributions can be observed with increasing loading rate. Chen et al. also reported this effect, but it was bigger in their thick-walled composite tubes. 2
Additional numerical studies
To complement the numerical evaluations, studies were conducted on the influence of friction and the role that inter- and translaminar SR dependencies play in the crushing process.
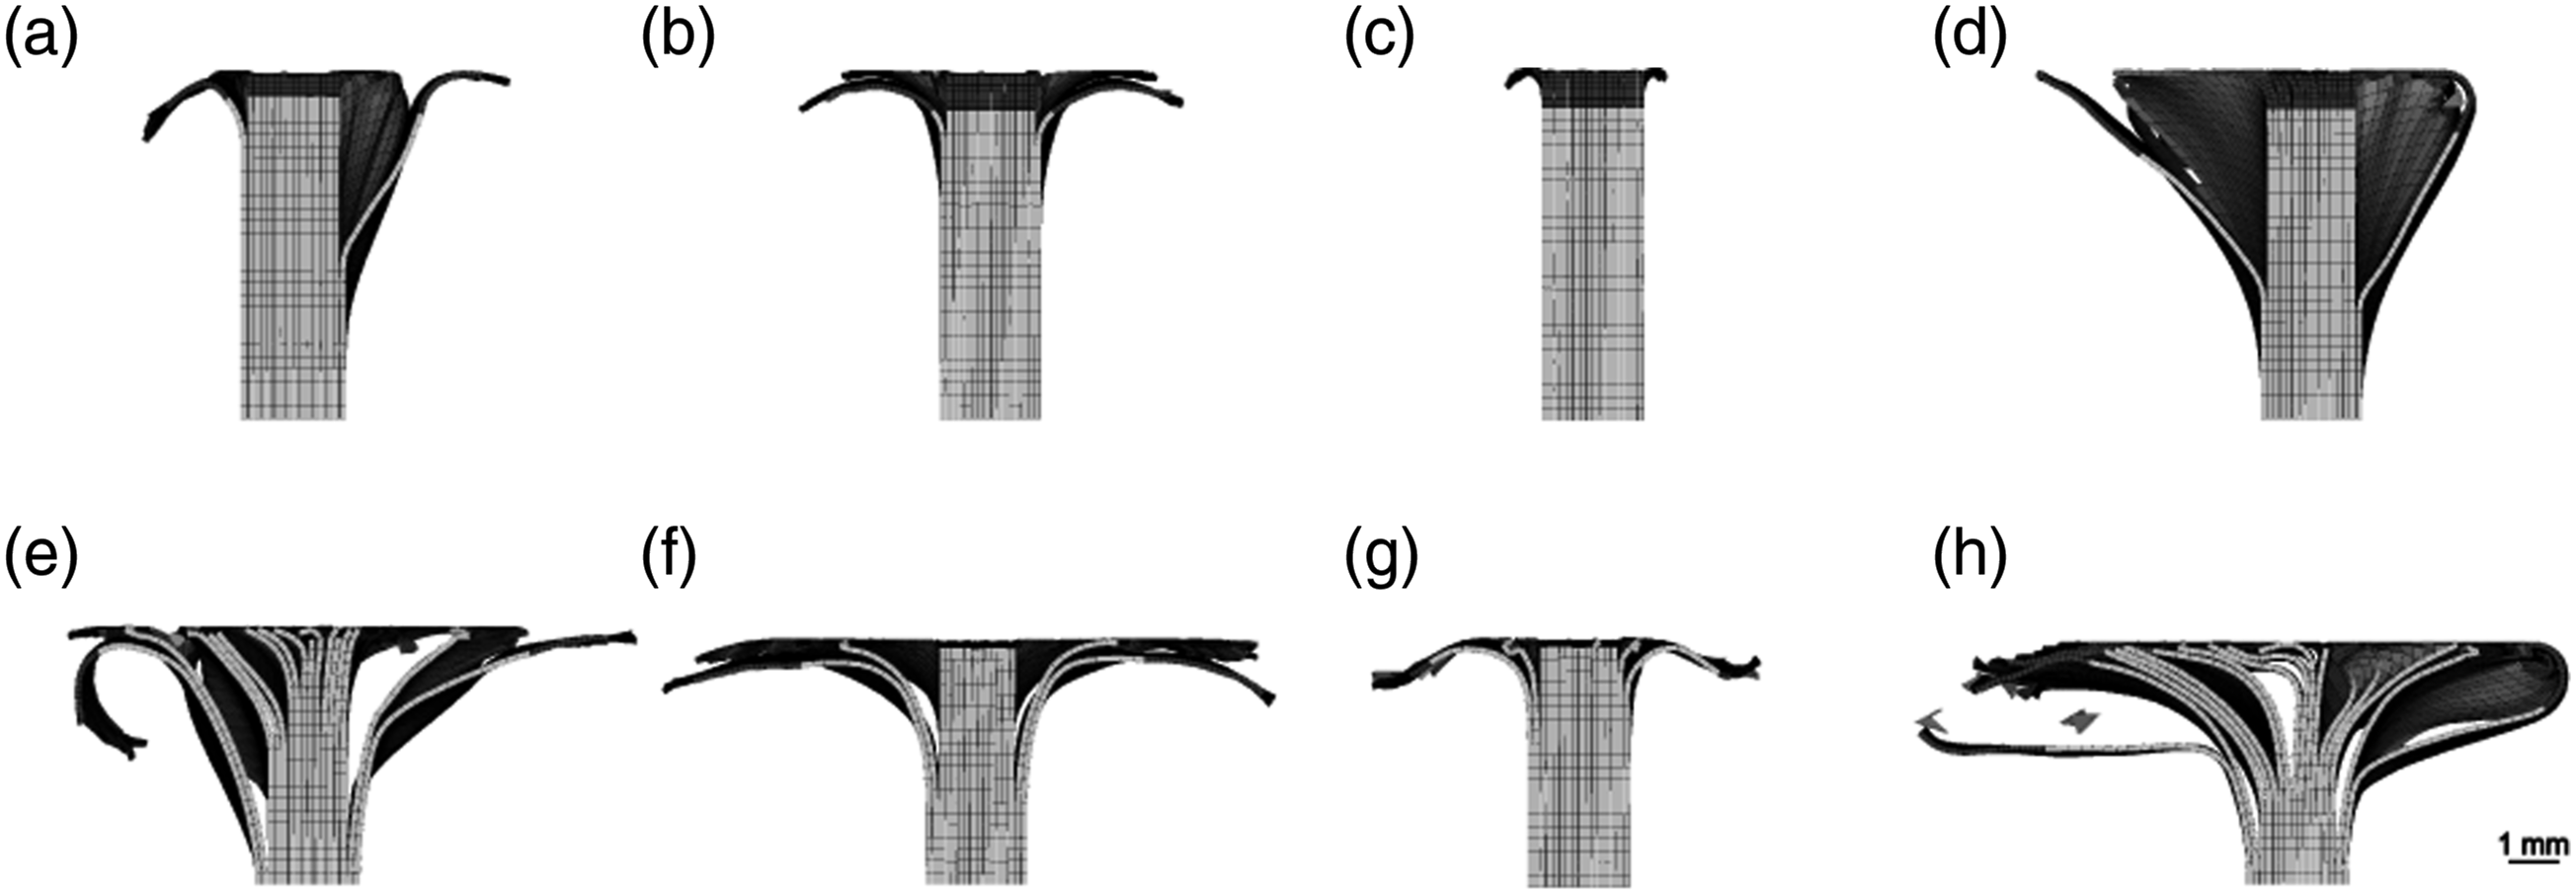
Figure 13(a) and (b) demonstrate that there is no obvious trend in the friction coefficient’s influence on the stress level within the physically reasonable range from 0.2 to 0.4: the 0.4 coefficient variant produces comparable stress levels during the trigger phase. Stress remains at a higher level during the crushing phase when compared to the 0.3 variant because of less delamination. The variant with a friction coefficient (FC) of 0.2 has a lower maximum initiation stress. Along with the lower FC, this is caused by delaminations that occur on both sides of a stable column of central plies from the trigger phase onward (see Figure 15(a), (b), (e), and (f)). On the other hand, the central column also leads to a higher crushing load level than in the 0.3 FC variant. Comparison of response from 16S_HR2-based friction study: (a) Comparison of stress-displacement diagram for FC ranging from 0.2 to 0.4 and (b) corresponding energy-displacement diagram.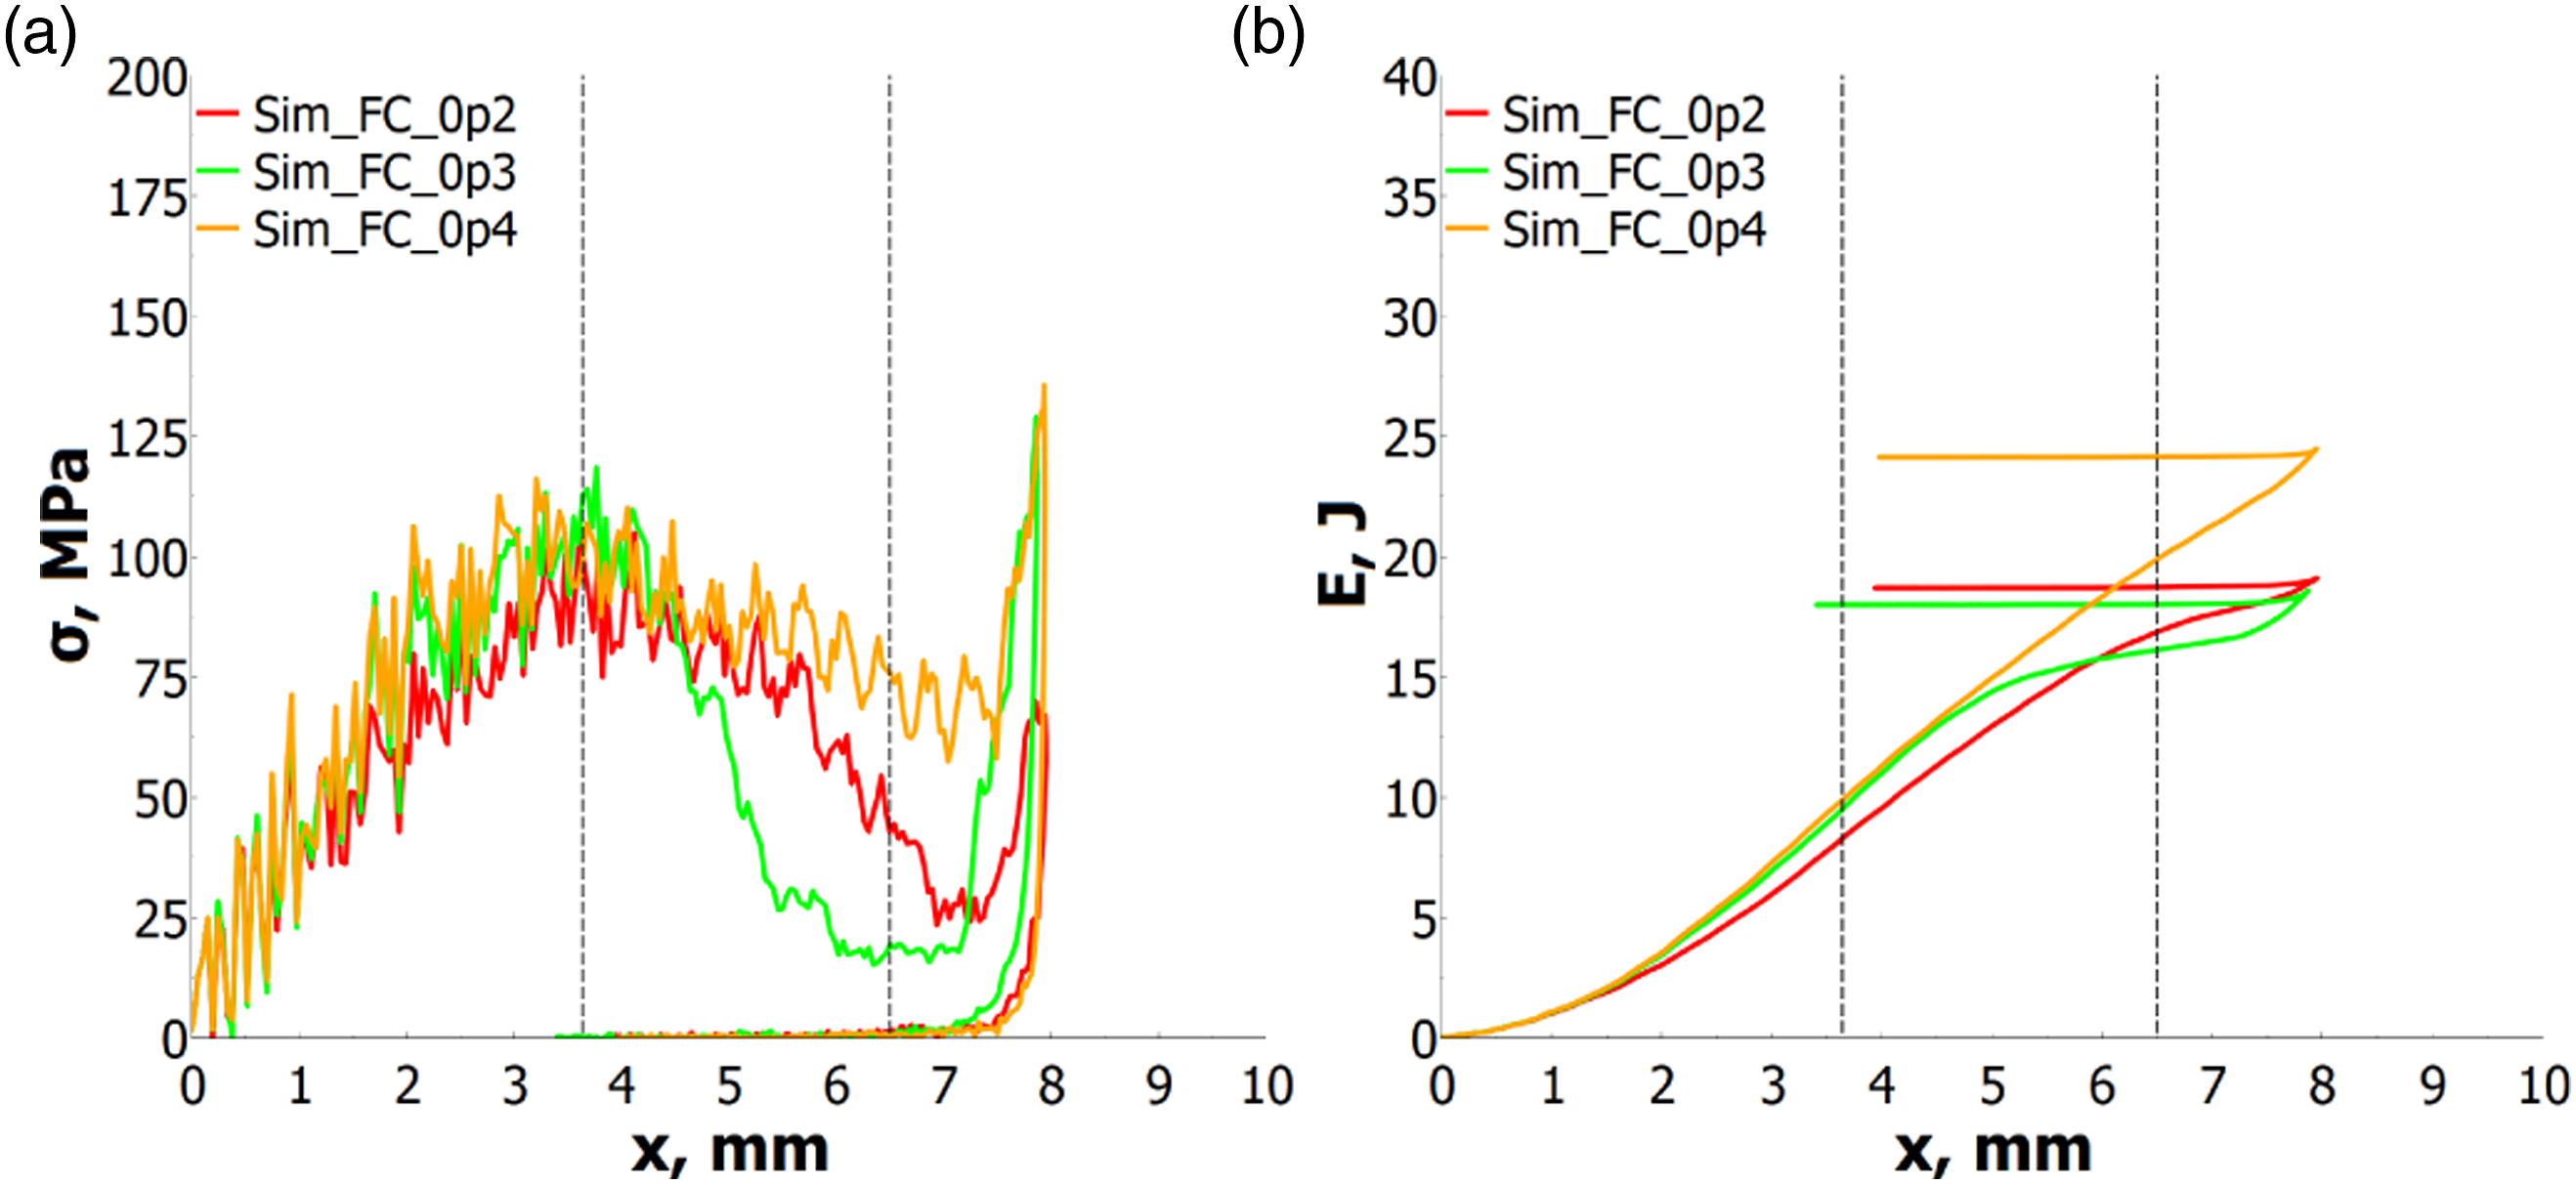
Figure 14(a) and (b) are plots of stress and energy against displacement for a study with selective activation of intralaminar (IL) and interlaminar (DEL) SR dependency. The responses of the four models do not differ significantly during the trigger phase, although the variants with intralaminar SR dependency attain somewhat higher stress levels (IL_on). As observed for the basic 16S_HR2 variant in Figure 15(a) and (e), which is identical to IL_on_DEL_on, a reduction in load results from delamination after the trigger is exhausted in those models. As shown in Figure 15(c) and (g) (IL_off_DEL_off), the variants lacking intralaminar SR dependency scarcely exhibit delamination. After the end of the trigger phase, they produce an almost constantly high stress level because the centre plies remain connected. Interestingly, intralaminar SR dependencies appear to encourage delamination, which counteracts the beneficial effect these property value increases have on the stress level seen in the trigger phase. A further study was conducted to identify whether the stress reduction is driven by elastic or damage ply properties. Unfortunately, the chosen representation of the damage properties in *MAT_058 did not allow a further breakdown to separate the influence of the strength and that of the FT.
37
As shown in Figure 14(c) and (d), the cause of the excessive delaminations can be traced back to the SR dependencies of the damage properties: yielding an initially higher load level, the exclusive activation of rate-sensitive damage properties clearly reduces the maximum initiation and crushing stress. Due to increased intralaminar stresses, out-of-plane buckling rather than in-plane crushing becomes the energetically preferred failure mode. After the trigger phase, plies delaminate and buckle throughout the whole specimen not even leaving a central ply column (see Figure 15(d) and (h)). It should be noted that these observations may only apply to the current material and geometry. Comparison of responses from 16S_HR2-based studies: (a) Comparison of stress-displacement response with intralaminar (IL) and interlaminar (DEL) SR dependencies switched on or off. (b) Corresponding energy-displacement diagram. (c) Comparison of stress-displacement response with intralaminar elastic (IL_E) and damage (IL_D) SR dependencies switched on. (d) Comparison of energy-displacement curves from the corresponding studies. Failure patterns of 16S HR studies: (a) original study 16S_HR (FC 0.3/IL_on_DEL_on), (b) FC 0.2, (c) IL_off_DEL_off, and (d) IL_D_on_DEL_off at 3 mm displacement. (e) Original study, (f) FC 0.2, (g) IL_off_DEL_off, and (h) IL_D_on_DEL_off at 5 mm displacement.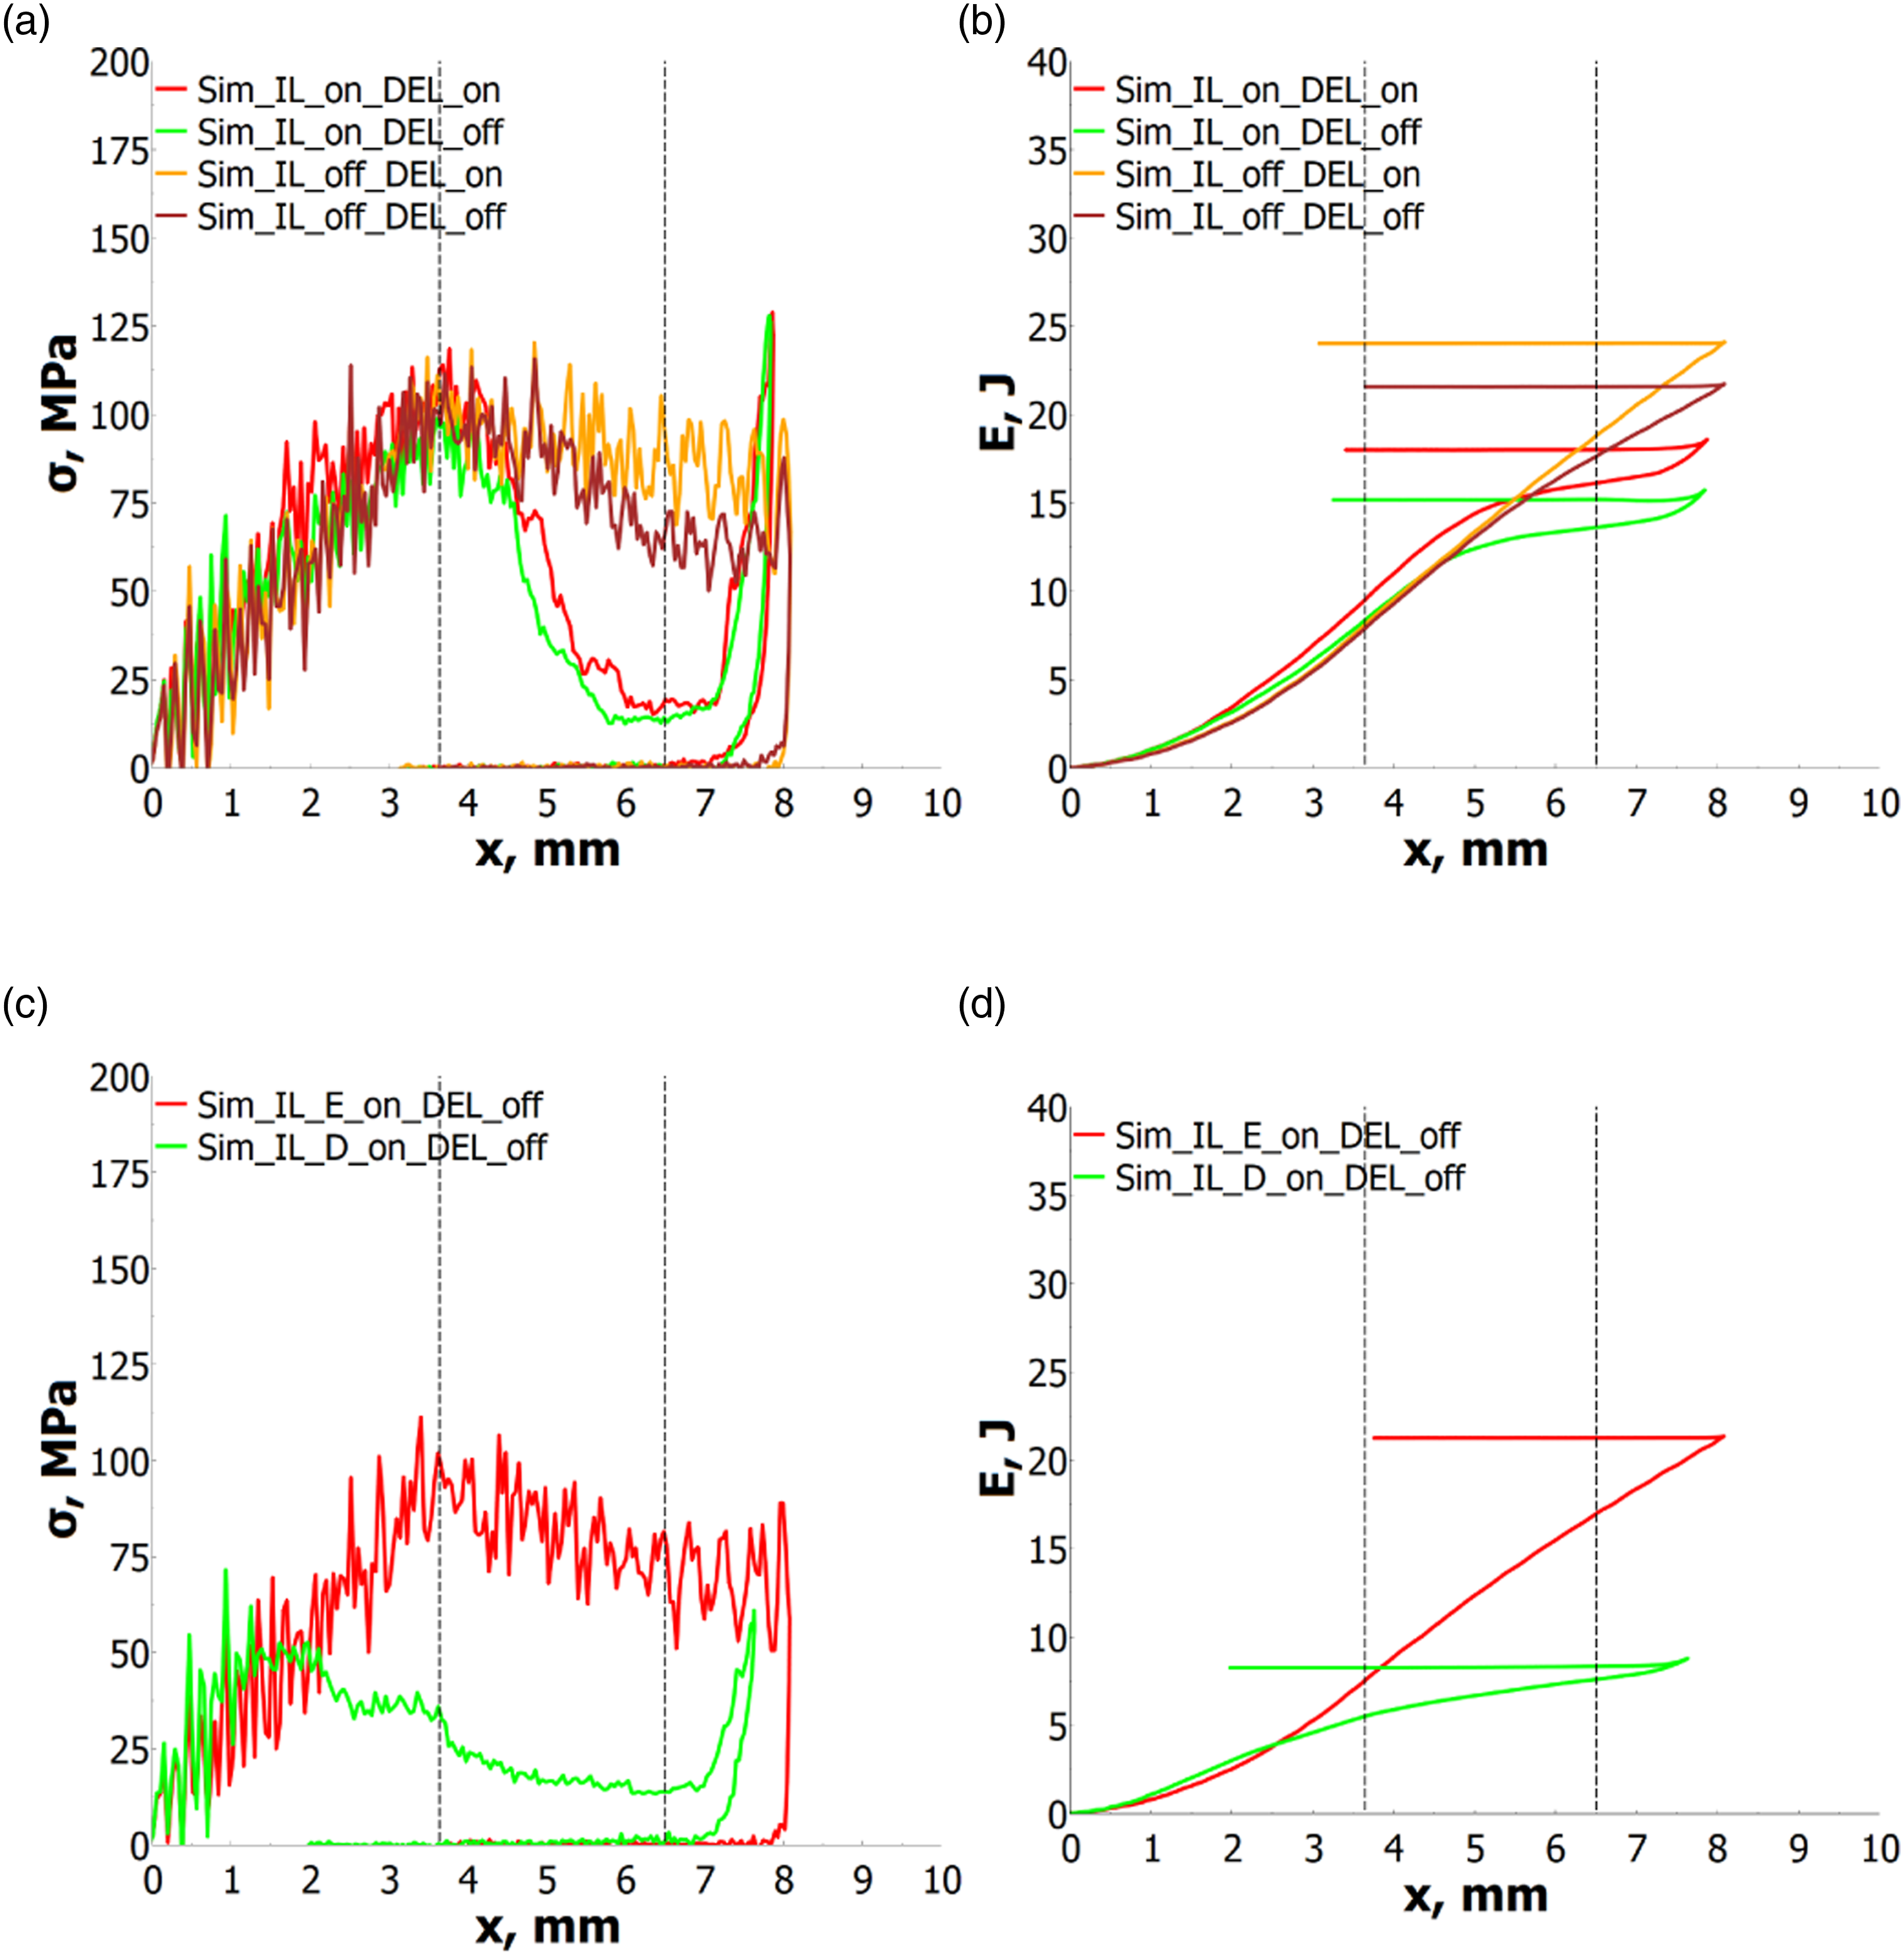
Conclusions and outlook
The purpose of this study was to investigate crushing of flat prismatic composite specimens at one medium (1 mm/s) and two high loading rates (1.59 m/s and 4.56 m/s) through a series of experiments combined with numerical modelling at different through-thickness homogenisation levels.
The experimental setup comprised a standard testing machine and drop-tower combined with an optical high-speed measurement system. Additionally, a force transducer fixture was designed and used successfully for the measurements. Experiments with force transducer measurement provided the most reliable results on both testing machines and are recommended for future use.
The numerical study was created using LS-DYNA material models *MAT_058 and *MAT_240 along with IM7/8552 material data as building blocks. Two different shell-modelling approaches were applied: a ply-by-ply model was used for detailed resolution of the crushing behaviour, then to improve applicability at structural length scales, a homogenised stacked-laminate model was set up. Strain-rate-dependent behaviour was integrated where physically reasonable.
The experiments revealed largely reproducible results. They indicate a strain-rate-induced decrease in the maximum initiation stress and specific energy absorption, whereas the crushing stress remains virtually unchanged. Decreases in the key figure values can be correlated with enhanced delamination toward the end of the trigger phase.
Predictions of the stacked-laminate model are accurate for medium-rate loading, but only at the original velocity in a very costly simulation. The model can neither replicate the failure mode nor the stress characteristics for the high-rate evaluations.
The discrete-ply model yields good to excellent results for most investigated characteristics – especially the specific energy absorption. It is capable of reproducing the failure patterns over a wide range of loading rates. Existing deviations can be attributed to a high variation in the experimental results, numerical element deletion in the scaled-velocity simulation, and the missing plasticity formulation in *MAT_058.
Additional numerical studies were conducted: Friction was shown not to have a clear impact onto the damage pattern and load level of the discrete-ply model. However, selective activation of the in-plane and out-of-plane rate sensitivities unveiled that the degree of delamination is linked to the strain-rate-induced increases of the lamina damage property values. The correlation offers a possible explanation of the question referred to in the introduction, namely why it is that strain-rate-induced increases do not necessarily lead to an increase in the load level at component level. Further investigations are recommended regarding this subject, since the findings only cover a short stable crushing phase.
Since local strain rates of more than 5000 1/s were observed in the study, it is questionable whether the extrapolation of property value increases is valid over more than one magnitude based on the experimental database. Therefore, future experimental efforts should focus on characterising material properties at even higher rates than typically achievable on, e.g., split-Hopkinson bar systems. For quasi-static or medium-rate crushing simulations, the element deletion strategy must be monitored when scaled velocities are used. The missing plasticity formulation was shown to be one of the major downsides of the present discrete-ply models. This could be overcome with, for example, academic modelling strategies for 3D material representations.50,51 Using these models, the influence of the interlaminar strengths and fracture energies could also be considered separately.
Data Availability Statement
The raw/processed data required to reproduce these findings cannot be shared at this time as the data also form part of an ongoing study.
Footnotes
Acknowledgments
The first author would like to thank Prof. Nik Petrinic and his research group for the great hospitality and outstanding academic support during a research stay at University of Oxford in spring 2022. The experimental data gathered during the visit formed the basis of this study. The authors also acknowledge the constant support of Christian Liebold from Dynamore GmbH Stuttgart. Also, the authors would like to acknowledge support from Rolls-Royce Plc. through the UTC for Solid Mechanics, University of Oxford. The funding sources were not involved in the formation process of this publication.
Declaration of conflicting interests
The author(s) declared no potential conflicts of interest with respect to the research, authorship, and/or publication of this article.
Funding
The author(s) disclosed receipt of the following financial support for the research, authorship, and/or publication of this article: This work was supported by the project CraCpit (grant number 20E1703B) provided by the German Federal Ministry for Economic Affairs and Climate Action along with project FANTASTICAL provided by Innovate UK (reference number 113190).