
Abstract
In this work, the monitorability of fatigue damage in notched thermoplastic-based hybrid fiber metal laminate, containing AA6082-T4 sheets and glass and carbon fiber-reinforced polyamide 6, is investigated using constant amplitude tests. Electrical resistance measurement and digital image correlation were combined to determine the initiation and evolution process of fatigue damage. Preliminary to the application of the electrical resistance measurement during fatigue load, basic investigations regarding necessary measurement accuracy and conditions, e.g. temperature and cross-section influence, were conducted to achieve reliable measurement results. Via digital image correlation fatigue crack growth was determined and correlated with the change in electrical resistance for two metal/fiber-reinforced polymer layer configurations (2/1 and 3/2) and notch geometries (drilling hole and double-edge notch). The results show that reliable detection of fatigue-related damage states is possible independent of aluminum sheet treatment (mechanically blasted or anodized surface), with earlier crack initiation and faster propagation for higher metal volume fraction (layer configuration 2/1). For the two investigated notch geometries an overall similar crack behavior was found. The electrical resistance values directly correlate to varieties of crack formation and growth, representing the aluminum sheet damage progress of the laminate well, and enabling the possibility of e.g. a limit value-based failure criterion. However, geometry and crack-related changes in electric current flow and thus current density must be taken into account for targeted monitoring of the laminate condition, as they cause significant changes in electrical resistance.
Keywords
Introduction
Fiber metal laminates (FMLs) in most cases contain fiber-reinforced polymers (FRPs) based on thermoset matrix systems. Considering aluminum-based laminates, ARALL (aramid fiber-reinforced epoxy 1 ), GLARE (glass fiber-reinforced epoxy 2 , and CARALL (carbon fiber-reinforced epoxy 3 ) are some of the more prominent examples, which have proven their fatigue performance4–7 and some of them their practicability for applications like the aeromotive industry.8,9
The design for prolonged and partly sequential damage development, where the metal underlies mostly crack-related stiffness degradation until its failure, after which the FRP still can withstand the remaining load10,11, makes FML ideal for condition monitoring. Especially for FML based on aluminum and glass FRP (GFRP), like GLARE, many investigations regarding the influence of notches, covering mostly drill holes and saw-cuts, have been conducted.12–19 Both conventional constant amplitude loading and variable amplitude loading including overloads have been investigated in terms of their influence on crack growth and delamination evolution. In general, for crack development initiating from notches, a progressive course is observed 20 , which, depending on the applied load and specimen width may also contain a linear segment at the beginning. A good indicator of the stages of crack development can be the crack growth rate 20 , which also affects the growth of adjacent delamination. The latter occurs as a result of shear stresses in the interface due to the fiber bridging effect and is representative of stress redistribution capabilities. Compared to GFRP-based FML, carbon FRP (CFRP) -based ones3,10,11,21 can significantly improve the resilience against crack growth but lack corrosion resistance.
Investigations of crack initiation and growth in FML usually rely on electrical measurement of cross-sectional reduction or tracking of crack growth using optical measurement devices.
It is well known that the electrical resistance of metals, which are the primary electrical conductor in FML, depends significantly on microstructure, defects (pores, cracks), and temperature. This highlights why its use for damage detection is so viable and thus is proposed in standardizations as an effective method for measuring crack length. 22 Rather than resistance-based, many investigations rely on the voltage-based determination of crack length for metals with sheet-like geometries and notches. 23 This is due to the difficult recording of the true material’s resistance at close-distanced voltage measuring points on specimen geometries with non-uniformly distributed electrical field strength and current. Measuring the voltage in relation to the initial voltage has the advantage that it primarily follows the ratio of total crack length to initial notch-related crack length, irrespective of the microstructural properties of the metal and sheet thickness. Accurate as well as comparable statements can be made via a preceding calibration of the measured voltage and crack development. 24 Over time, optimized mathematical descriptions of the voltage-based determined crack length followed while additions, such as the continuous measurement of a reference voltage to avoid temperature influences, were implemented and the measurement method was applied to FML using calibration curves.3,25–28 The use of electrical resistance measurement rather than voltage drop can enable conclusions to be drawn about the specific material resistance if the conducting material volume is known, and thus the microstructure-dependent properties of the material. In combination with CFRP, for which resistance measurement can also be applied for fiber damage detection 29 , holistic monitoring of the FML condition is achievable.
Recent investigations primarily adopt the use of optical crack measurements using cameras2,14,16,18,30 or microscopes.1,13,14,20 The crack initiation and growth measurement is usually carried out by means of automated image analysis for defined numbers of cycles. Although digital image correlation is used for the full-surface evaluation of the deformation field at the crack, it enables also the evaluation of crack-related stress concentrations 13 and delamination areas.14,30 Compared to the electrical crack length determination the optical does not rely on the calibration of voltage/crack length relation, can be applied to any specimen geometry, and enables the investigation of multiple cracks at the same time. Disadvantages are the need for visibility of the crack, therefore excluding measurements of hidden layers, and the necessity of a stochastic pattern for deformation analysis. The accuracy of both, voltage measurement and optical detection, can reach sufficient levels for the discussed tasks with current technology (electrical current sources, voltage measurement systems, and high-resolution camera sensors).
Despite the diversity of investigations and findings obtained, there is still room for improvement regarding the used polymer matrix system as well as the application of the condition monitoring strategies. Thermoplastic-based FML, like CAPAAL, offer significantly shorter consolidation times, shaping through thermoforming31,32, and enhance recyclability. Only a few results are available for thermoplastic-based FML regarding mechanical behavior, e.g.33,34 In previous investigations35,36 leading up to this study, the general fatigue behavior of such a hybrid FML, consisting of polyamide 6 based GFRP and CFRP combined with aluminum, was investigated for rectangular specimens without notches. This study focuses on investigating the fatigue properties and evaluating the applicability of electrical resistance measurement and digital image correlation for condition monitoring of the crack evolution, utilizing notched specimens (drilling hole or double-edge notch). Using the measurement results an interpretation of the fatigue damage evolution process and lifetime, with emphasis on the monitoring of crack growth, was done for two different FML layer configurations.
Experimental
Hybrid fiber metal laminate partners and manufacturing
The investigated thermoplastic-based hybrid FML consists of three laminate partners: AA6082-T4 sheets (initial thickness 0.5 mm) and unidirectional carbon as well as glass fiber-reinforced polyamide 6. As shown by 11 the use of CFRP combined with GFRP increases the residual strength after the failure of the aluminum compared to the sole use of GFRP significantly, by more than doubling it. This makes the laminate more tolerant to aluminum failure while preventing direct contact between the carbon and aluminum through isolation for increased corrosion resistance. Further, the implementation of the GFRP helps with compensation for the mismatch in the thermal expansion coefficient between aluminum and CFRP.
Two different laminate structures were investigated, as shown in Figure 1. These contain 2/1 and 3/2 metal-to-FRP layer structures with 4 and 8 layers of FRP. The rolling direction of the aluminum sheets is aligned with the orientation of the unidirectional FRP, which is along the specimen length. Investigated hybrid FML structures: (a) 2/1 (GC) with four FRP layers and (b) 3/2 (GC) with 2 × four FRP layers between aluminum sheets.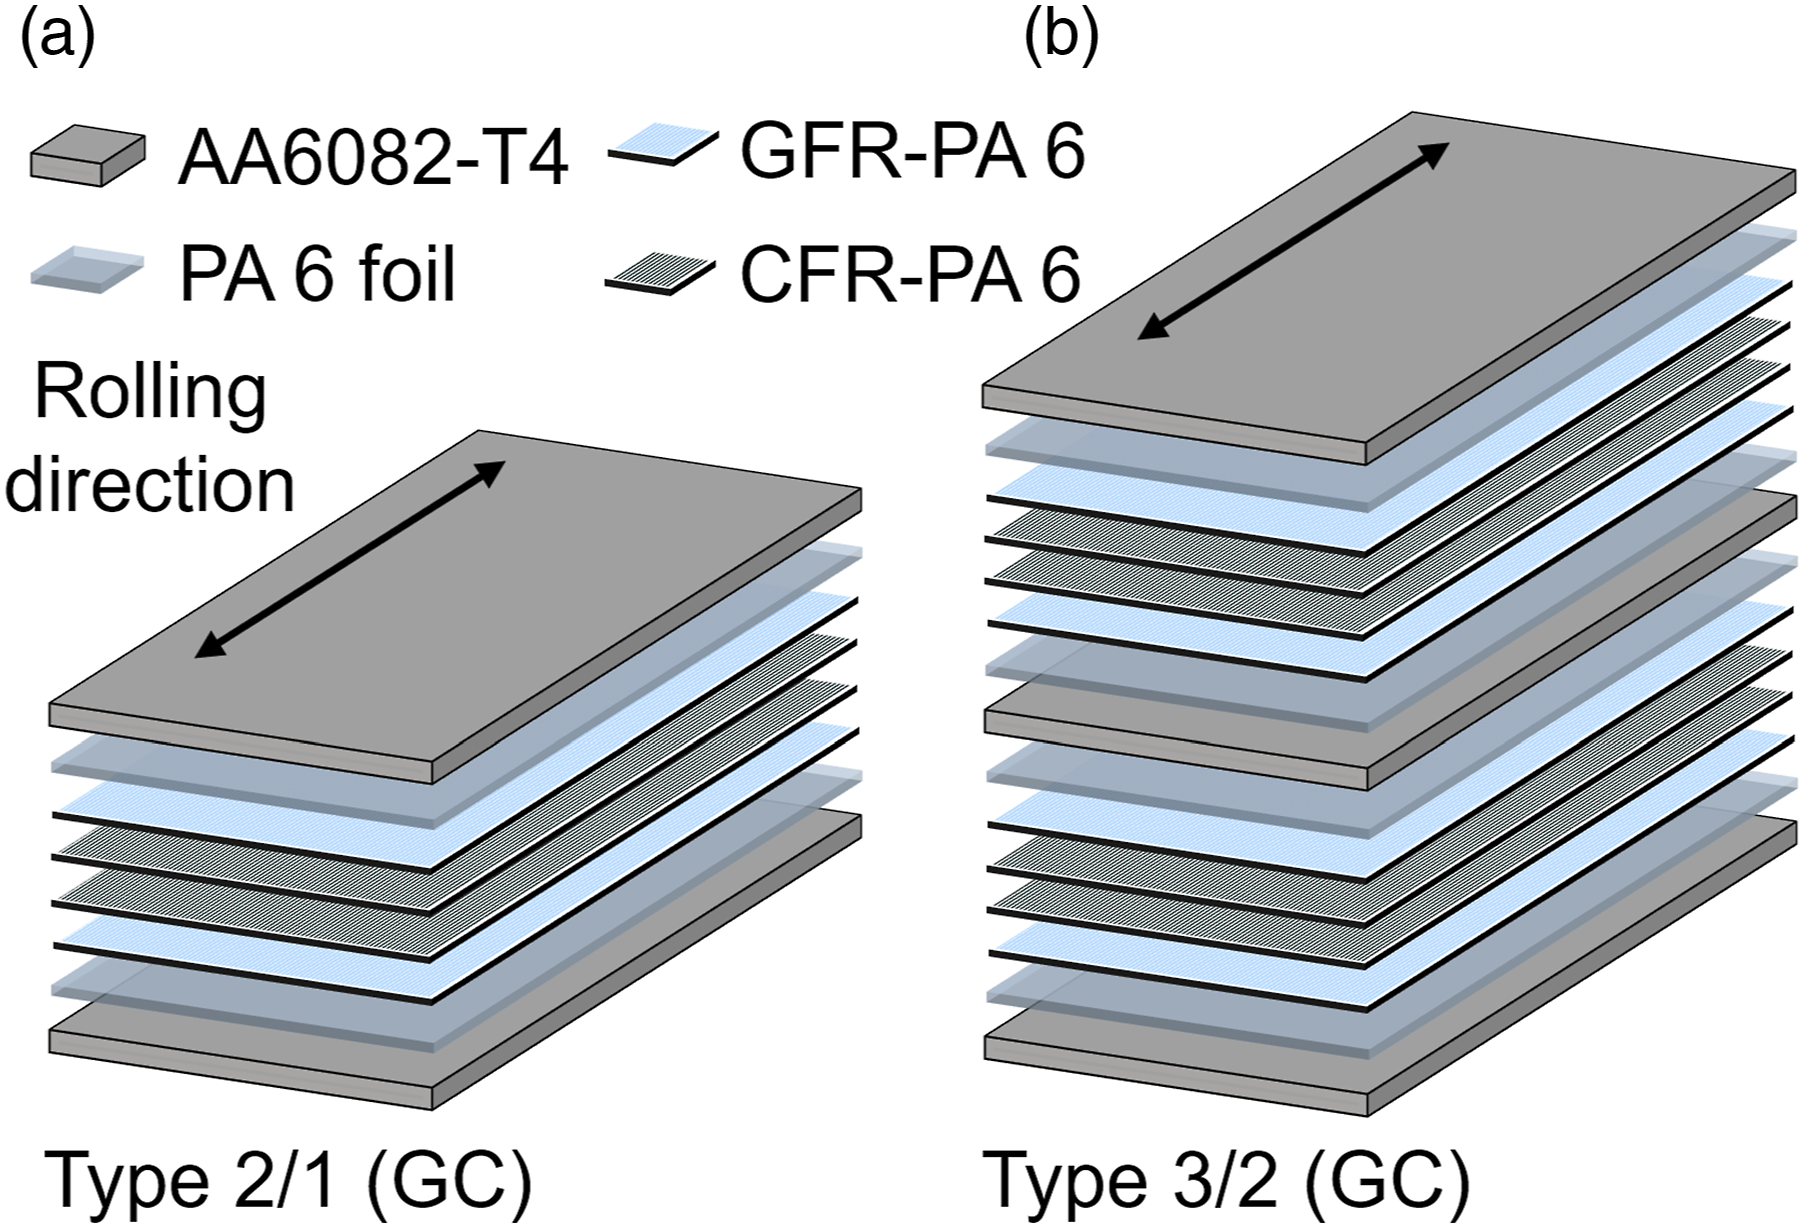
Investigated layer structures of hybrid FML made of AA6082 and carbon and glass fiber-reinforcedpolyamide 6.
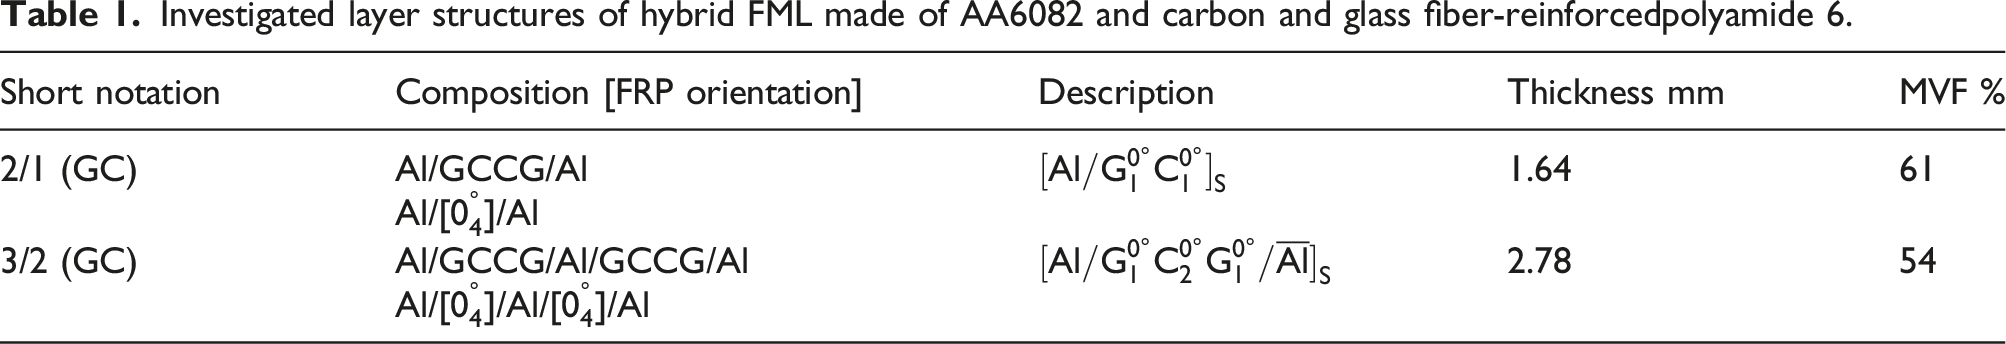
The FRP layers are arranged as a symmetrical build-up made of CePreg (Cetex Institut gGmbH, Chemnitz, Germany), which are pre-consolidated thermoplastic prepregs with a calculated fiber volume fraction of 0.5. The carbon fiber-reinforced polyamide 6 (CFR-PA6) consists of two 40 µm thick polyamide 6 (PA6) foils (mf-Folien GmbH, Kempten, Germany) and ZOLTEK PX35 50K (ZOLTEK Corporation, Bridgeton, NJ, USA) fibers, which are continuously processed into 300 mm wide tapes as described in. 32 The glass fiber-reinforced polyamide 6 (GFR-PA6) contains TURov 4588 (Nippon Electric Glass Co. Ltd., Tokyo, Japan) fibers. Additionally, PA6 foil is placed between the aluminum and FRP to enhance consolidation quality by minimizing pore formation.
Two different aluminum sheet surface treatments were applied before laminate consolidation to investigate the influence on notch-inflicted crack development: mechanical blasting (hereafter declared and referred to as MB) as well as anodization (hereafter declared and referred to as AN). Details regarding the surface process applications are mentioned in 35 . The surface treatment led to sheet thicknesses of 0.49 mm for the MB sheets and 0.47 mm for the AN sheets (effective 0.45 mm thickness when counting out the anodized layer). The FML with AN-treated aluminum sheets were investigated only in the 2/1 (GC) configuration since it is sufficient for a direct comparison to MB-treated aluminum sheets.
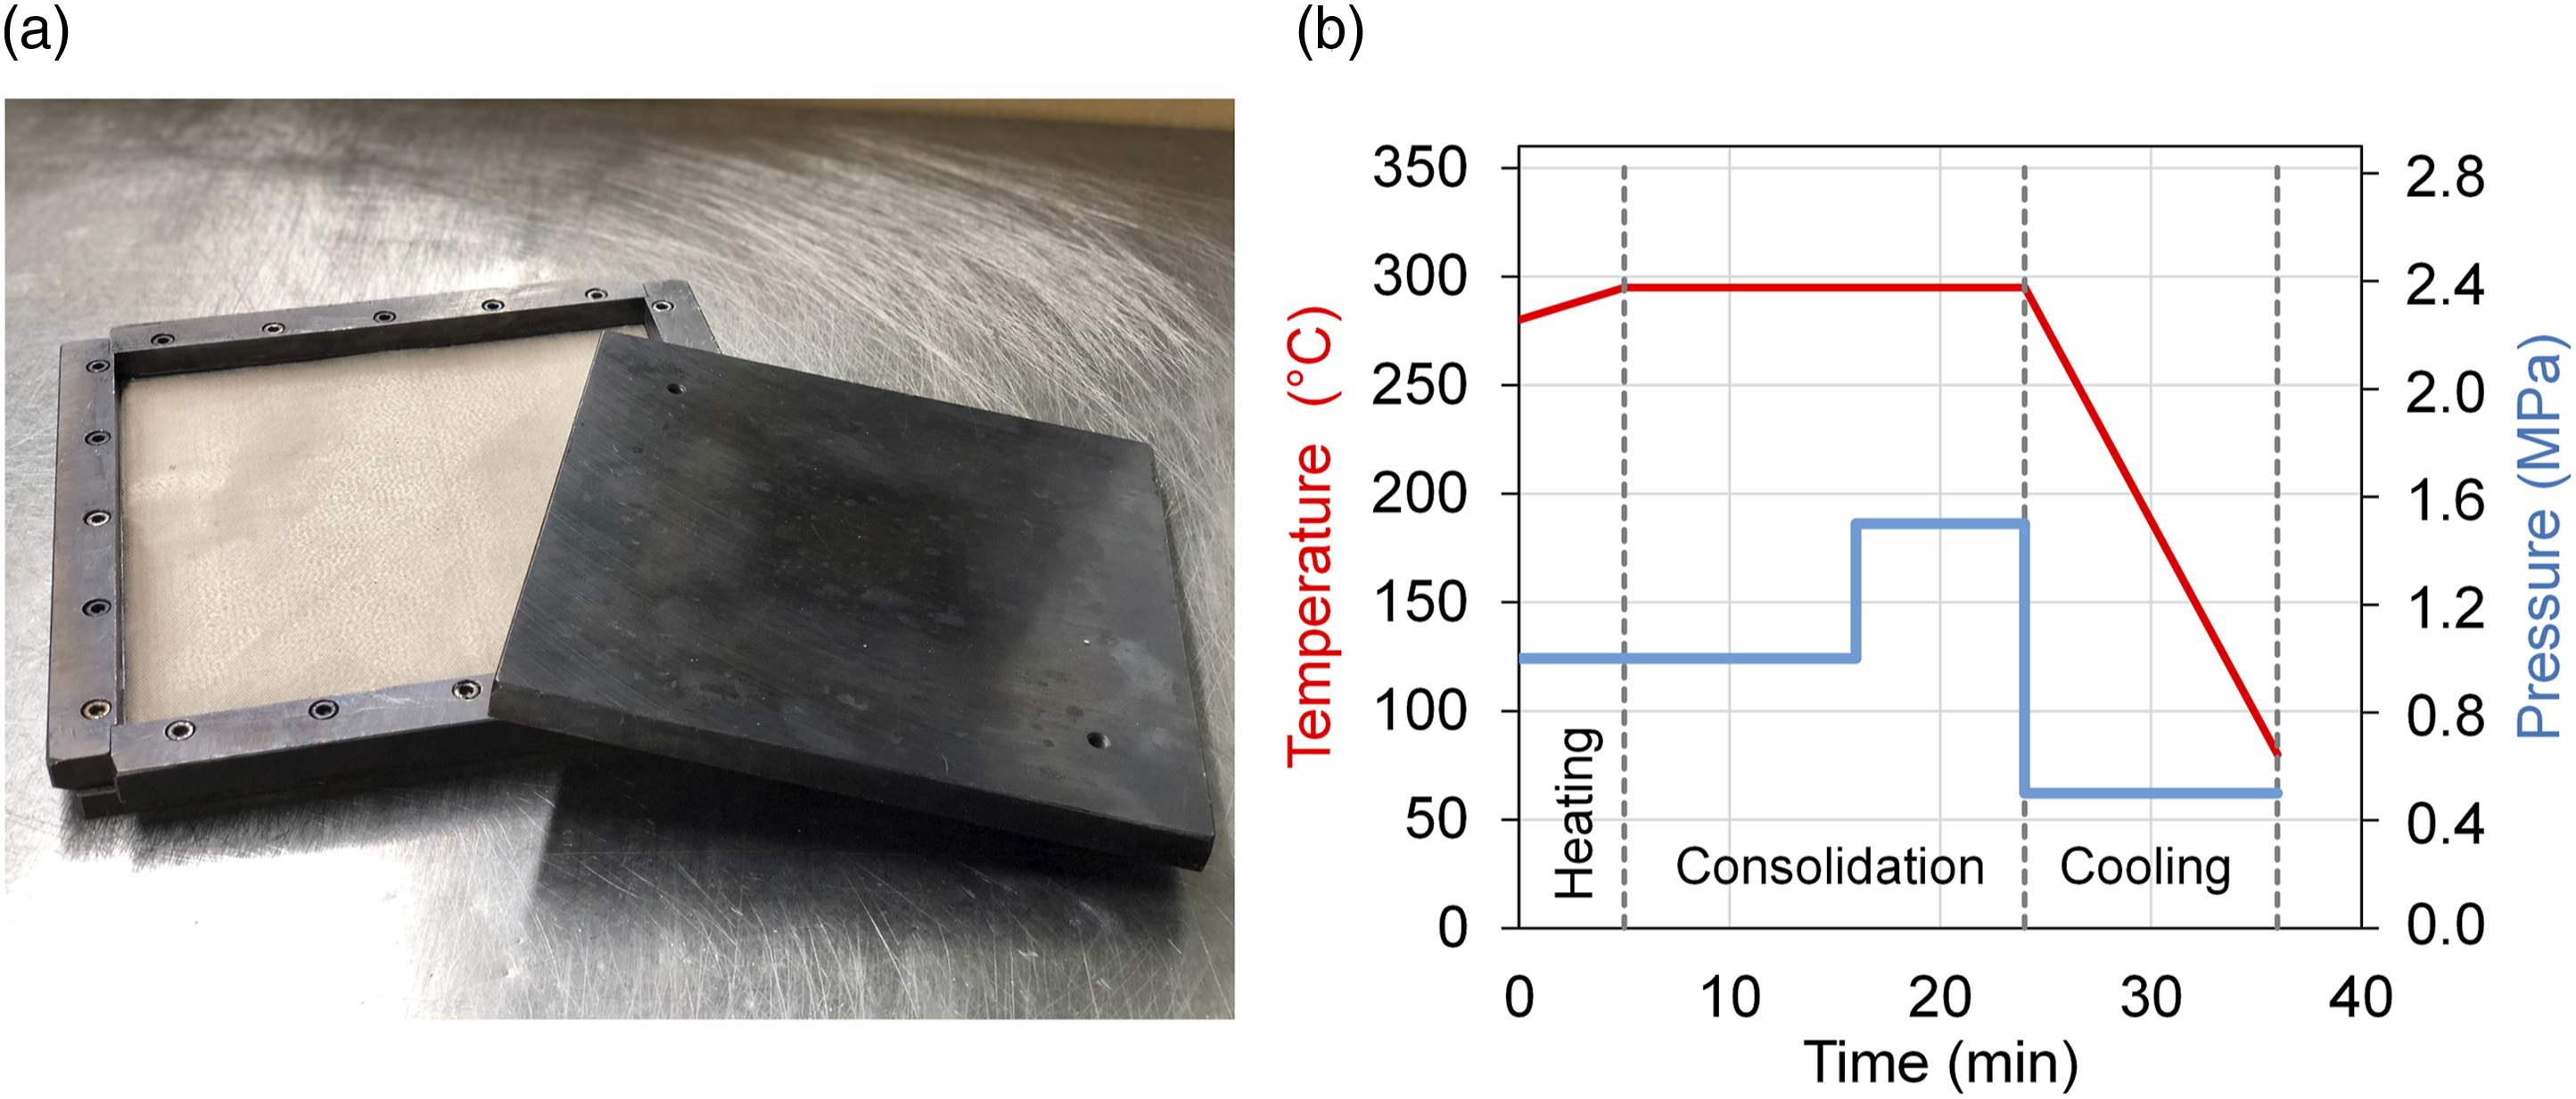
The laminate consolidation is carried out by thermal pressing and takes place in a laboratory platen press Collin PM300 (COLLIN Lab and Pilot Solutions GmbH, Maitenbeth, Germany) using a 260 × 260 mm2 dipping-edge tool (Figure 2(a)). Before processing, the FRP tapes and PA6 foils are dried in an oven at 80°C for 1 hour. Figure 2(b) graphically shows the consolidation process cycle. Specimens were cut out of the laminate sheets using micro water-jet cutting. Results regarding the laminate consolidation quality and structure-dependent mechanical performance are described in.
36
Configuration 2/1 (GC) reaches with MB aluminum sheets an ultimate tensile strength (UTS) of 625 MPa and with AN aluminum sheets 610 MPa, yielding overall similar quasi-static performance. 3/2 (GC) with MB configuration achieves a UTS of 660 MPa. (a) Dipping edge tool and (b) consolidation process cycle for the investigated FML.
36
Measurement procedure
The following measurement procedure for FML condition monitoring under fatigue load was performed. General steps, including the acquisition of fundamental basic data about the measurement conditions considering the FML, have been conducted. Specific tasks were executed following the step sequences visible in Figure 3, shown in a flow chart covering one initial and a second step procedure. This procedure represents a generally applicable approach for any material, not just metal within FML. The individual self-heating of each laminate partner is not taken into account, but its effect on the measured change in electrical resistance is also avoidable if considering, e.g. testing frequency adjustment as shown in21,38 or voltage reference measurements. Step sequence of the performed measurement procedure for a reliable and reproducible damage state assessment of FML under fatigue load in terms of condition monitoring.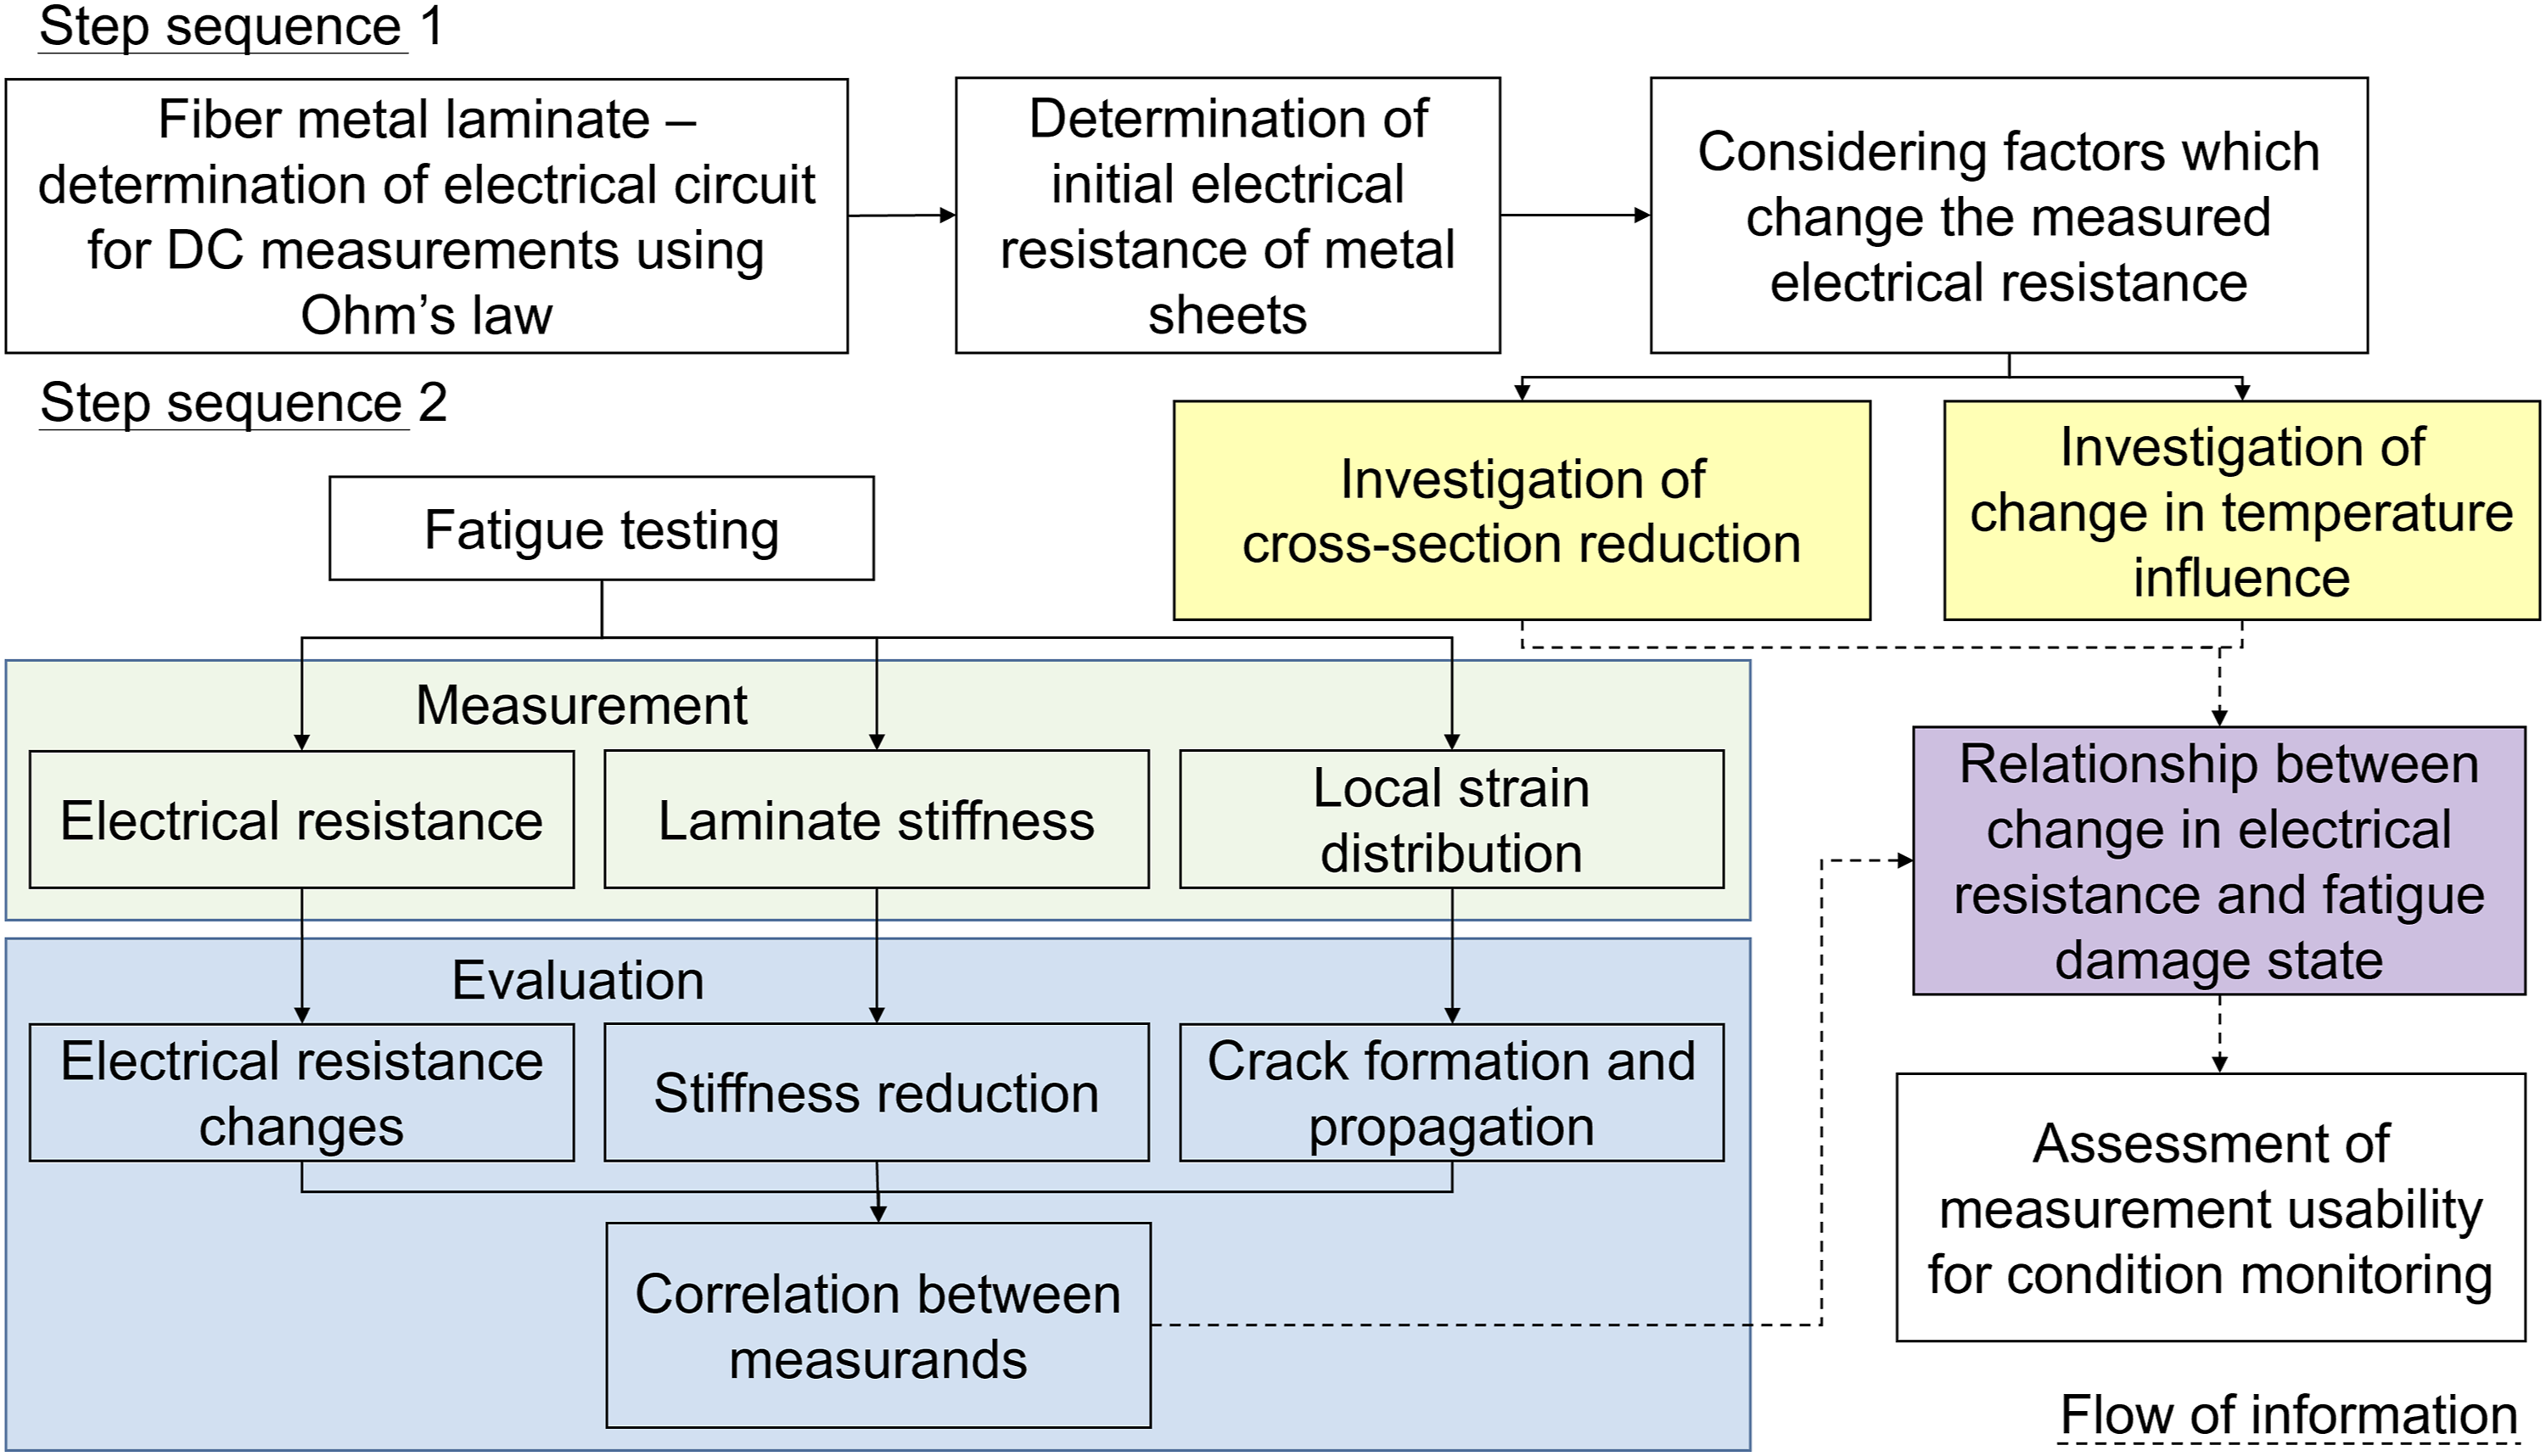
When considering the electrical resistance as a representative characteristic value for the condition of the laminate, besides optical deformation measurement and conventional recordings of mechanical properties like stiffness values, the measured electrical circuit needs to be known (step sequence 1). Ohm’s law can be applied to separate the specific resistivities from each other and establish one representative equation, which will be demonstrated in Chapter 3. To verify the established theoretical electrical resistance relationships, the initial electrical resistance of the metal sheet should be measured without having to take thermoelectric voltages or contact resistances into account. The electrical resistance of a material is not just material-dependent, but also temperature dependent, which is an important aspect and must be known for the aluminum sheet to be monitored correctly.
After the preliminary steps, in step sequence 2, the measurand development of the applied instrumented measuring principles is monitored, recorded, and evaluated with regard to correlations between the change in mechanical properties like stiffness reduction, electrical resistance, and strain distribution. Correlations between the different measurand developments pinpoint occurring events like damage initiation and evolution in the laminate. This enables the establishment of relationships between the measurands but also evaluates if the measurement of electrical resistance is valuable and feasible for condition monitoring of such laminates. The preliminary results out of step sequence 1 enable the classification of the quantitative changes in electrical resistance to material processes, such as cross-section reduction due to crack propagation, or plasticization as well as changes in temperature.
Specimen
For the preliminary investigations in step sequence 1, aluminum sheets were used for electrical resistance measurements. The aluminum sheet specimens had widths of up to 15 mm and total lengths of up to 250 mm. For fatigue investigations specimen geometries similar to previous investigations on the same material35,36, based on DIN EN 527-5 type A, were used with integrated notches as shown in Figure 4. The notches have the same diameter but differ in notch geometry: while (a) has a drill hole (hereafter declared and referred to as DH5), (b) has a double-edge notch (hereafter declared and referred to as DEN5) representing the inverse case of (a). To enable DIC measurements the surface of the specimen front and rear were speckled with a stochastic pattern. Protective tabs, adhered with epoxy to the clamping area, were used to reduce stress concentrations at the transitional area of the clamping and testing area. For electrical resistance measurement, the area between the DIC speckle pattern and the protective tabs was kept clean to ensure electrical conductivity for the measurement clamps. Prepared specimen with speckle pattern for DIC measurement, electrically conductive areas for measurement connection, and adhesively bonded protective tabs. (a) shows the specimen geometry with a central 5 mm drill hole (DH5) and (b) with a 2.5 mm radius double-edge notch (DEN5).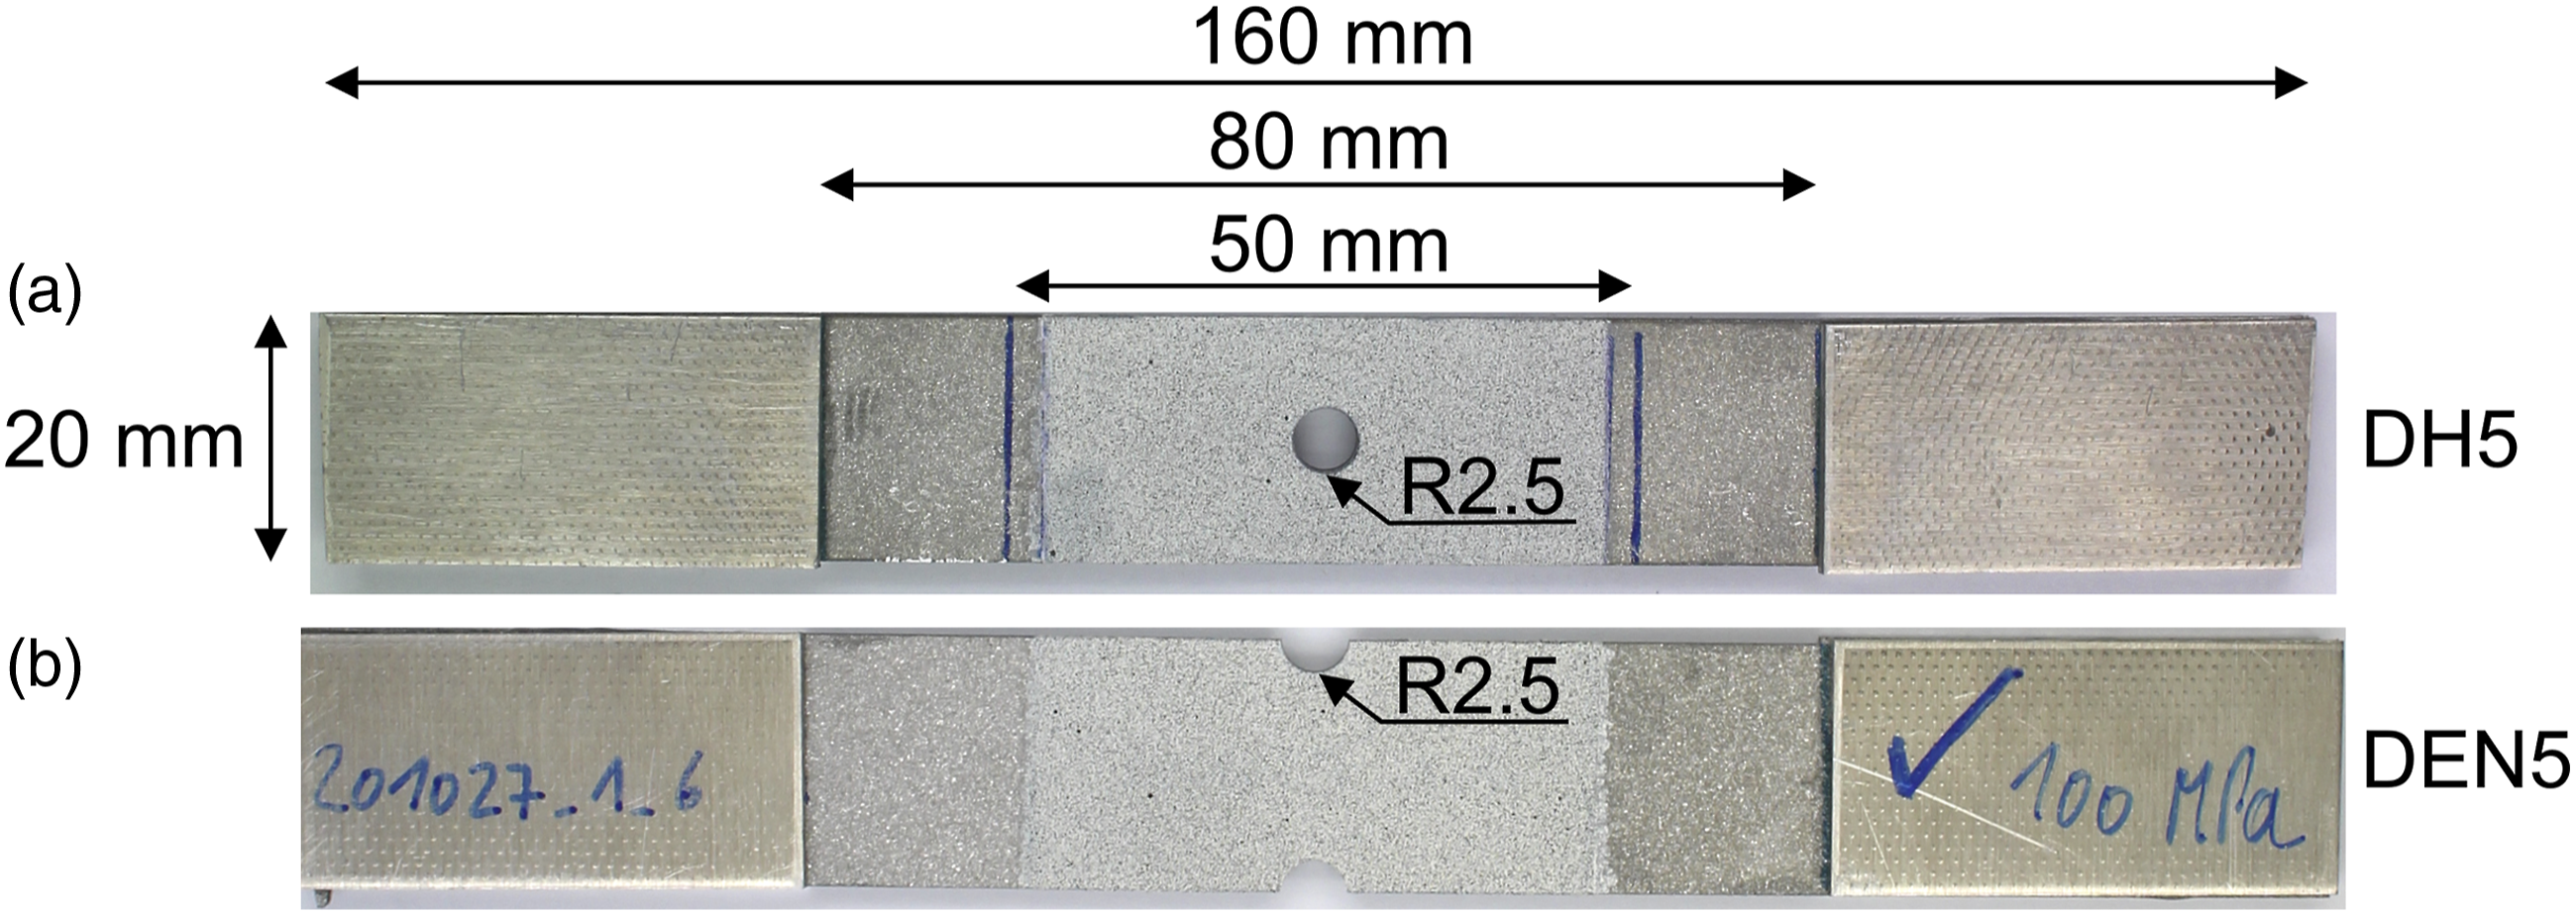
Measurement equipment and fatigue testing method
For condition monitoring using electrical resistance measurement, a high-precision Keithley system was applied, containing a 2601B source measure unit connected via R232 null modem cable to a 2182A nanovoltmeter (Tektronix Inc. Beaverton, USA). The system was operated in delta mode, which is based on the current reversal technique: direct current is pulsed and the resistance measurement is performed alternately at positive and negative currents, enabling the compensation of thermoelectrical voltages occurring between contacts of different metals. Electrical resistance measurements were performed to assess the general electrical conductivity properties, but also fatigue-related changes (as described in Figure 3). In addition, the system was used for local voltage measurements to deduce the electrical current distribution in the DH5 and DEN5 specimens and identify notch- and crack-induced changes in electrical current flow and its effects on the measurements. The voltage measurements were conducted on the specimen surface within 5 mm spots and distances between each spot of 5 mm (Figure 5), and taken in the area of current flow corresponding to the positioning of the clamps during the fatigue experiments. The x-axis shows the primary direction of electrical current flow and therefore the chosen direction for the voltage measurements. Setup for electrical current distribution measurement on the investigated DH5 (as shown) and DEN5 specimens using local voltage measurements on the specimen surface within 5 mm spots and distances between each spot of 5 mm. The x-axis shows the chosen direction for the voltage measurements.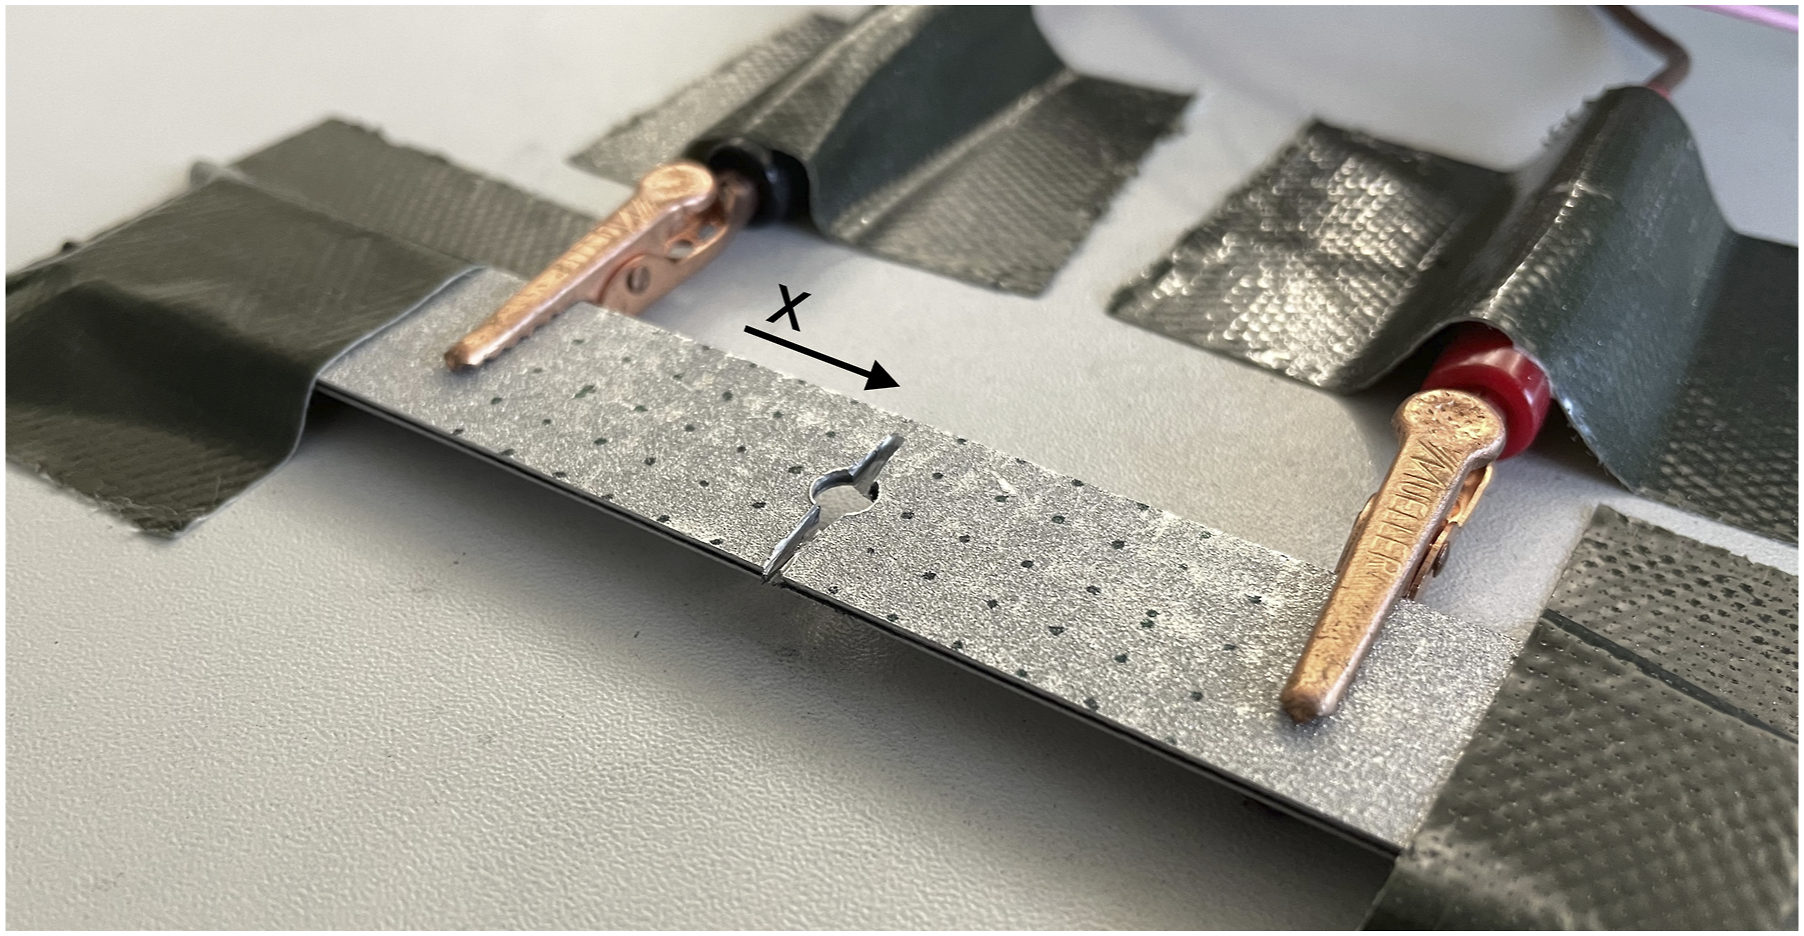
To correlate fatigue-related changes in electrical resistance to deformation and damage events a Limess Q400 digital image correlation (DIC) system (Limess Messtechnik und Software GmbH, Krefeld, Germany) was used. For temperature measurements, a MicroEpsilon TIM 400 thermography camera (Micro-Epsilon Messtechnik GmbH and Co. KG, Ortenburg, Germany) recorded the front aluminum surface temperature. Additionally, the machine piston displacement (s) was recorded by a linear variable differential transformer (LVDT) for stress-displacement hysteresis values to reflect on integral damage-related changes within the laminate. One used value is the dynamic stiffness (Cdyn), which represents the change of force divided through the change of piston displacement: (Fmax – Fmin)/(smax – smin).
The metrology setup for the fatigue investigations is shown in Figure 6(a). 3D DIC measurements for strain analysis on the front and rear aluminum sheets were executed with four 5 megapixel cameras: two in the front (Ricoh TV lens FL-CC7528-2M, 75 mm focal length, 10 mm extension tube) and two in the rear (Ricoh TV lens FL-CC7528-2M, 75 mm focal length). For the electrical resistance measurement, 50 mm markers were applied and used for the voltage drop clamp placement (Figures 4(a) and 6(b)) to ensure reproducible measurement results, and the current in/out clamps were placed adjacent. A reference specimen, which underlies the same environmental changes in temperature as the tested specimen, was placed directly to the tested specimen to determine the testing and damage-induced changes in temperature (Figure 6(b)). Condition monitoring setup for fatigue testing: (a) servo-hydraulic testing system with front and rear instrumented DIC cameras and thermographic camera with a schematic visualization of camera placement; (b) electrically contacted, clamped specimen with reference target for temperature measurements, below a schematic visualization of the clamped specimen and contacting variants.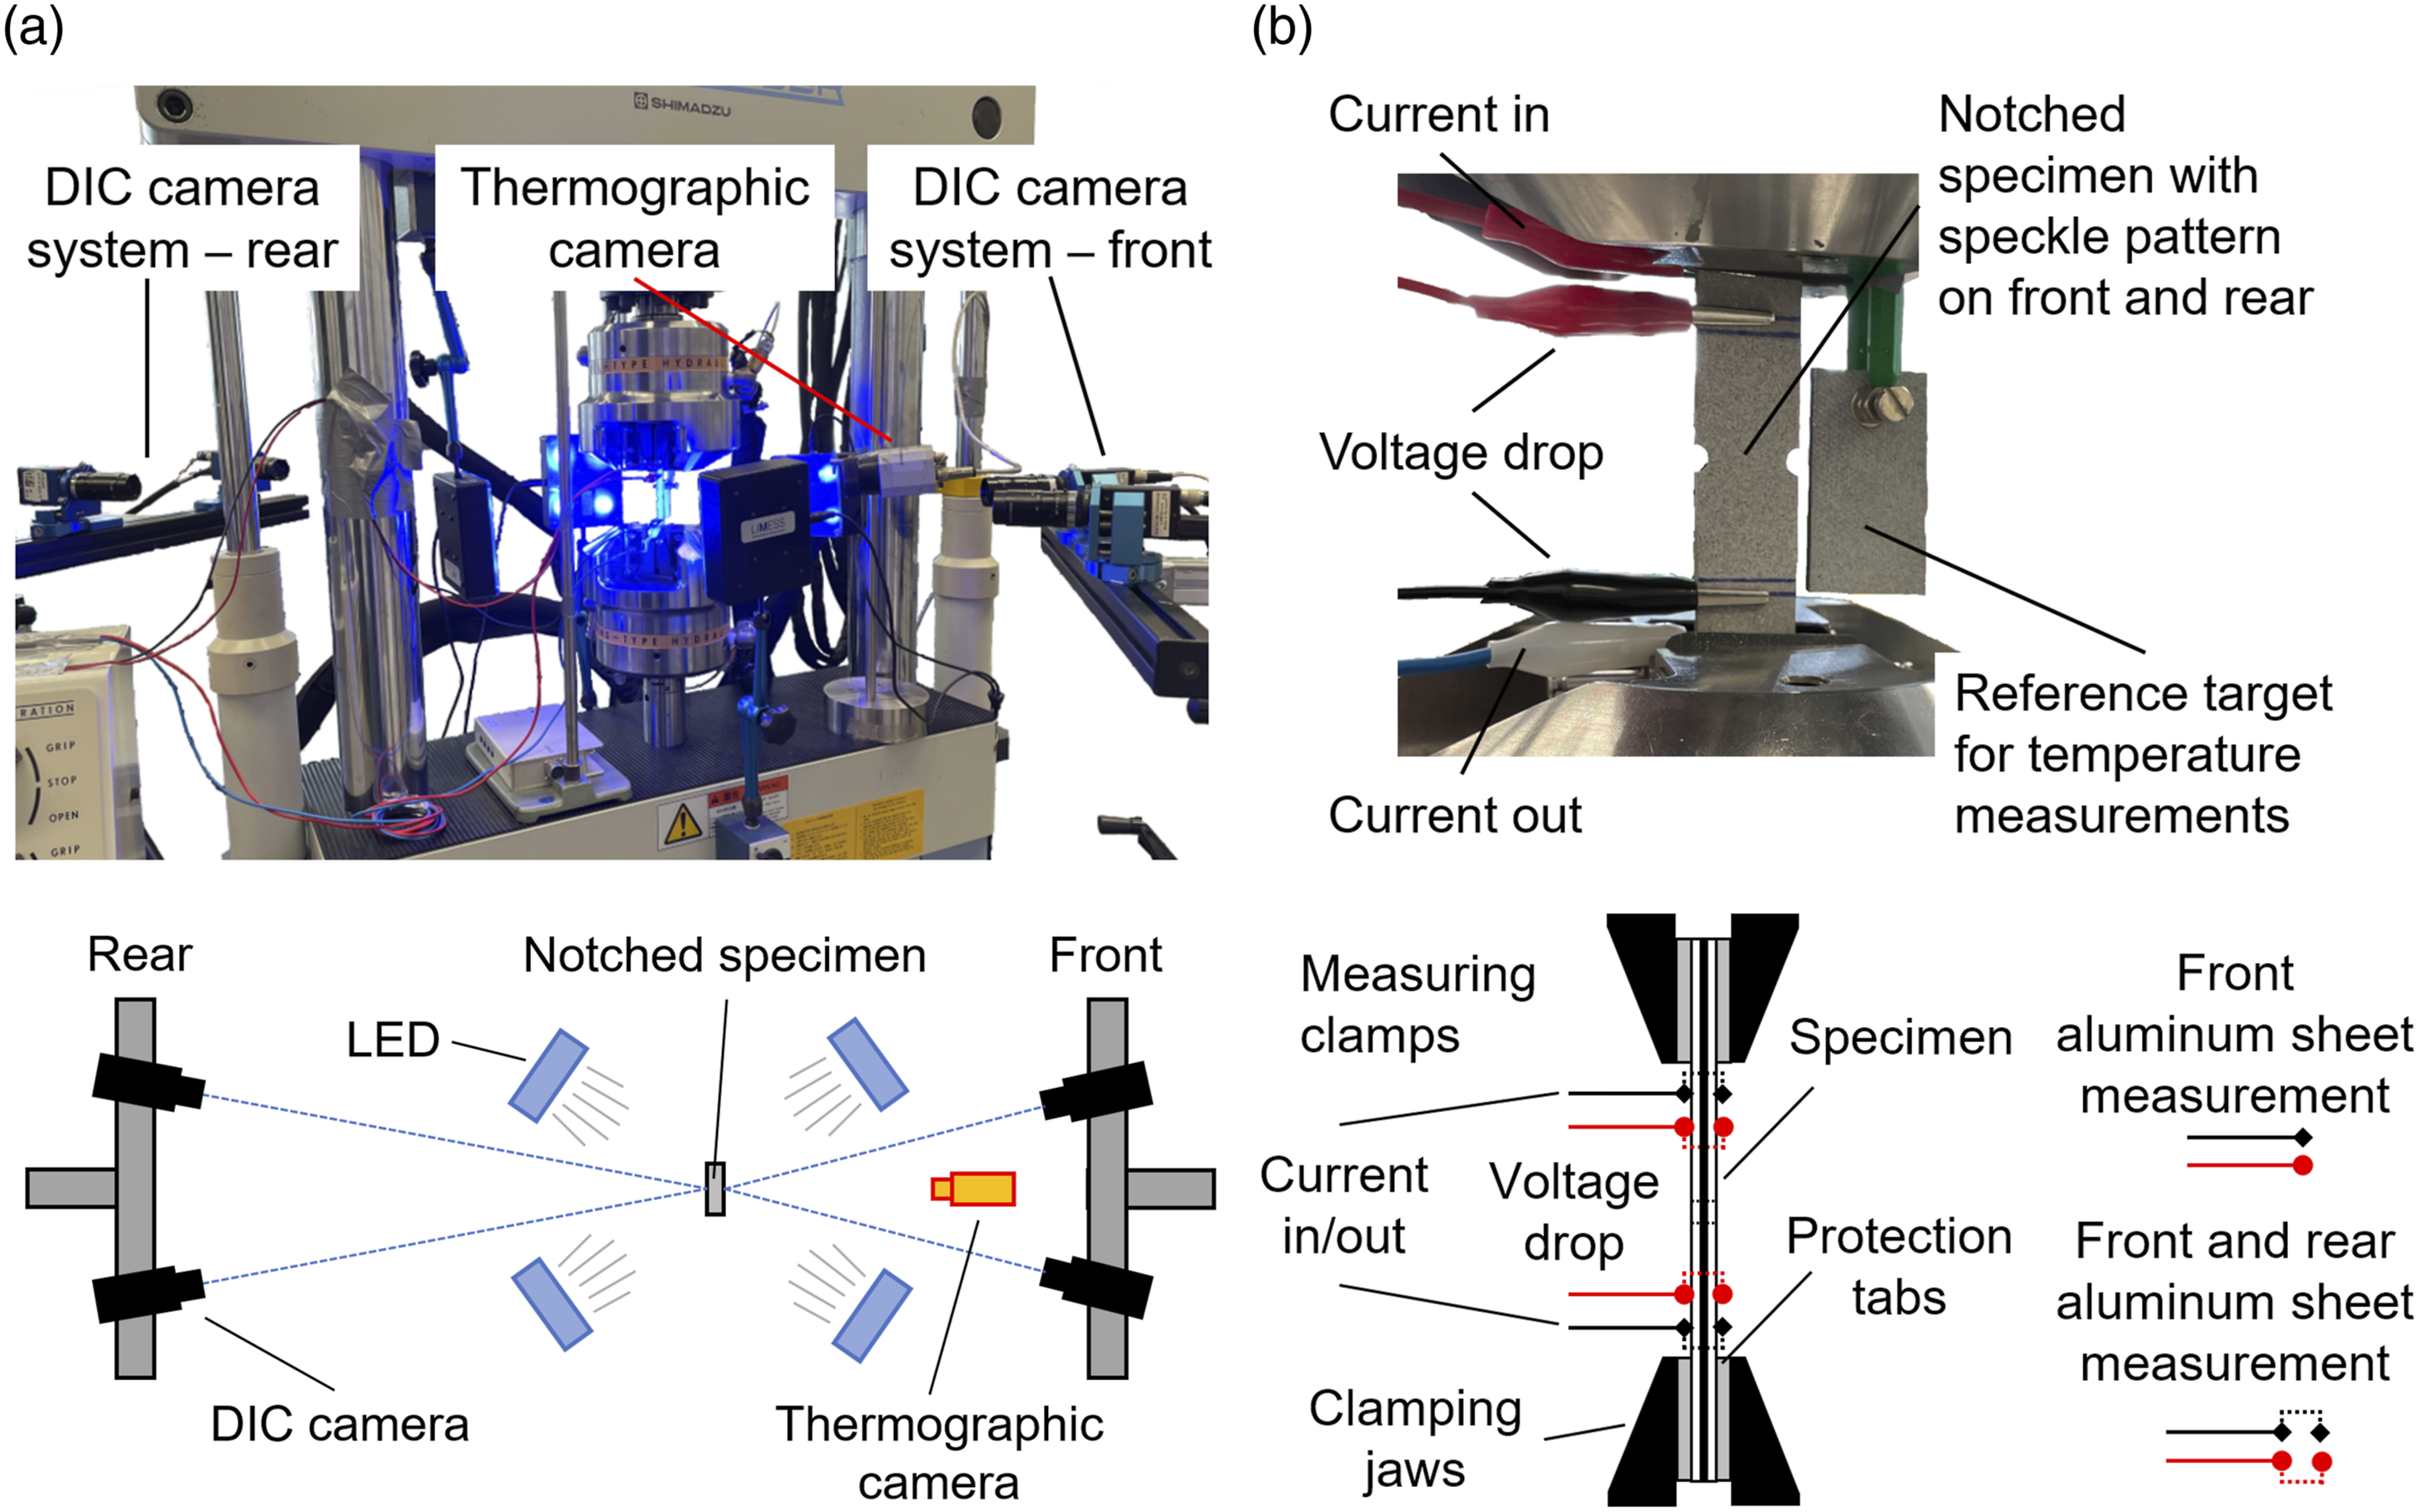
Two electrical contacting methods were applied (Figure 6(b)): The measurement of the FML’s (i) front aluminum sheet and (ii) the simultaneous measurement of front and rear aluminum sheets, where the measurement clamps contact simultaneously front and rear aluminum sheet to correlate its change in electrical resistance with crack growth and deduce onto aluminum failure on both surface sides. For (i) the rear side of the clamps was isolated from the specimen’s aluminum surface to ensure only front-sided clamp conduction.
Tests were performed on a servo-hydraulic testing system EHF-EV50 (Shimadzu Corporation, Kyoto, Japan, maximum force Fmax ±50 kN). Constant amplitude tests (CATs) were conducted under ambient temperature with a sinusoidal load-time function at a stress ratio R = 0.1 (tension/tension loading). The testing frequency was kept at f = 10 Hz and according to ISO 13003 did not increase the specimen temperature significantly. Investigations focused on low (LCF, <104 cycles) and high cycle fatigue (HCF) up to 2 × 10⁶ cycles.
To detect volume inner laminate damage for evaluation and validation of the measured results with the mentioned measurement equipment, computed tomography (CT) images were taken with a Nikon XT H 160 (Nikon Metrology GmbH, Alzenau, Germany) for selected specimens. The Nikon XT H 160 contains an X-ray tube with a maximum voltage of 160 kV, maximum power of 60 W, and a 10082 pixel detector. The CT acquisition parameters are mentioned in 36 . VG Studio Max 2.2 software from Volume Graphics (Volume Graphics GmbH, Heidelberg, Germany) was used for the image analysis.
Results and discussion
Electrical resistance behavior of the hybrid fiber metal laminate
The electrical resistance (R) of the hybrid FML depends decisively on the aluminum sheets. It needs to be determined to evaluate the suitability of the used measuring instrumentation and to establish a basis for the electrical resistance composition of the investigated FML configurations during measurements. Therefore, the electrical resistance (R) of aluminum sheet specimens with known cross-section area (A) was measured for different lengths (l) (Figure 7), and plotted in a graph to validate the relationship between electrical resistance and length of conductor material (1), and to determine the specific electrical resistance (⍴) (2) at room temperature (RT, 21°C) using the following equations Relationship between (a) electrical resistance and length of aluminum sheets (b) and their specific electrical resistance values.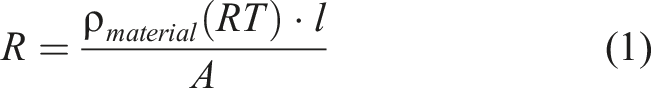

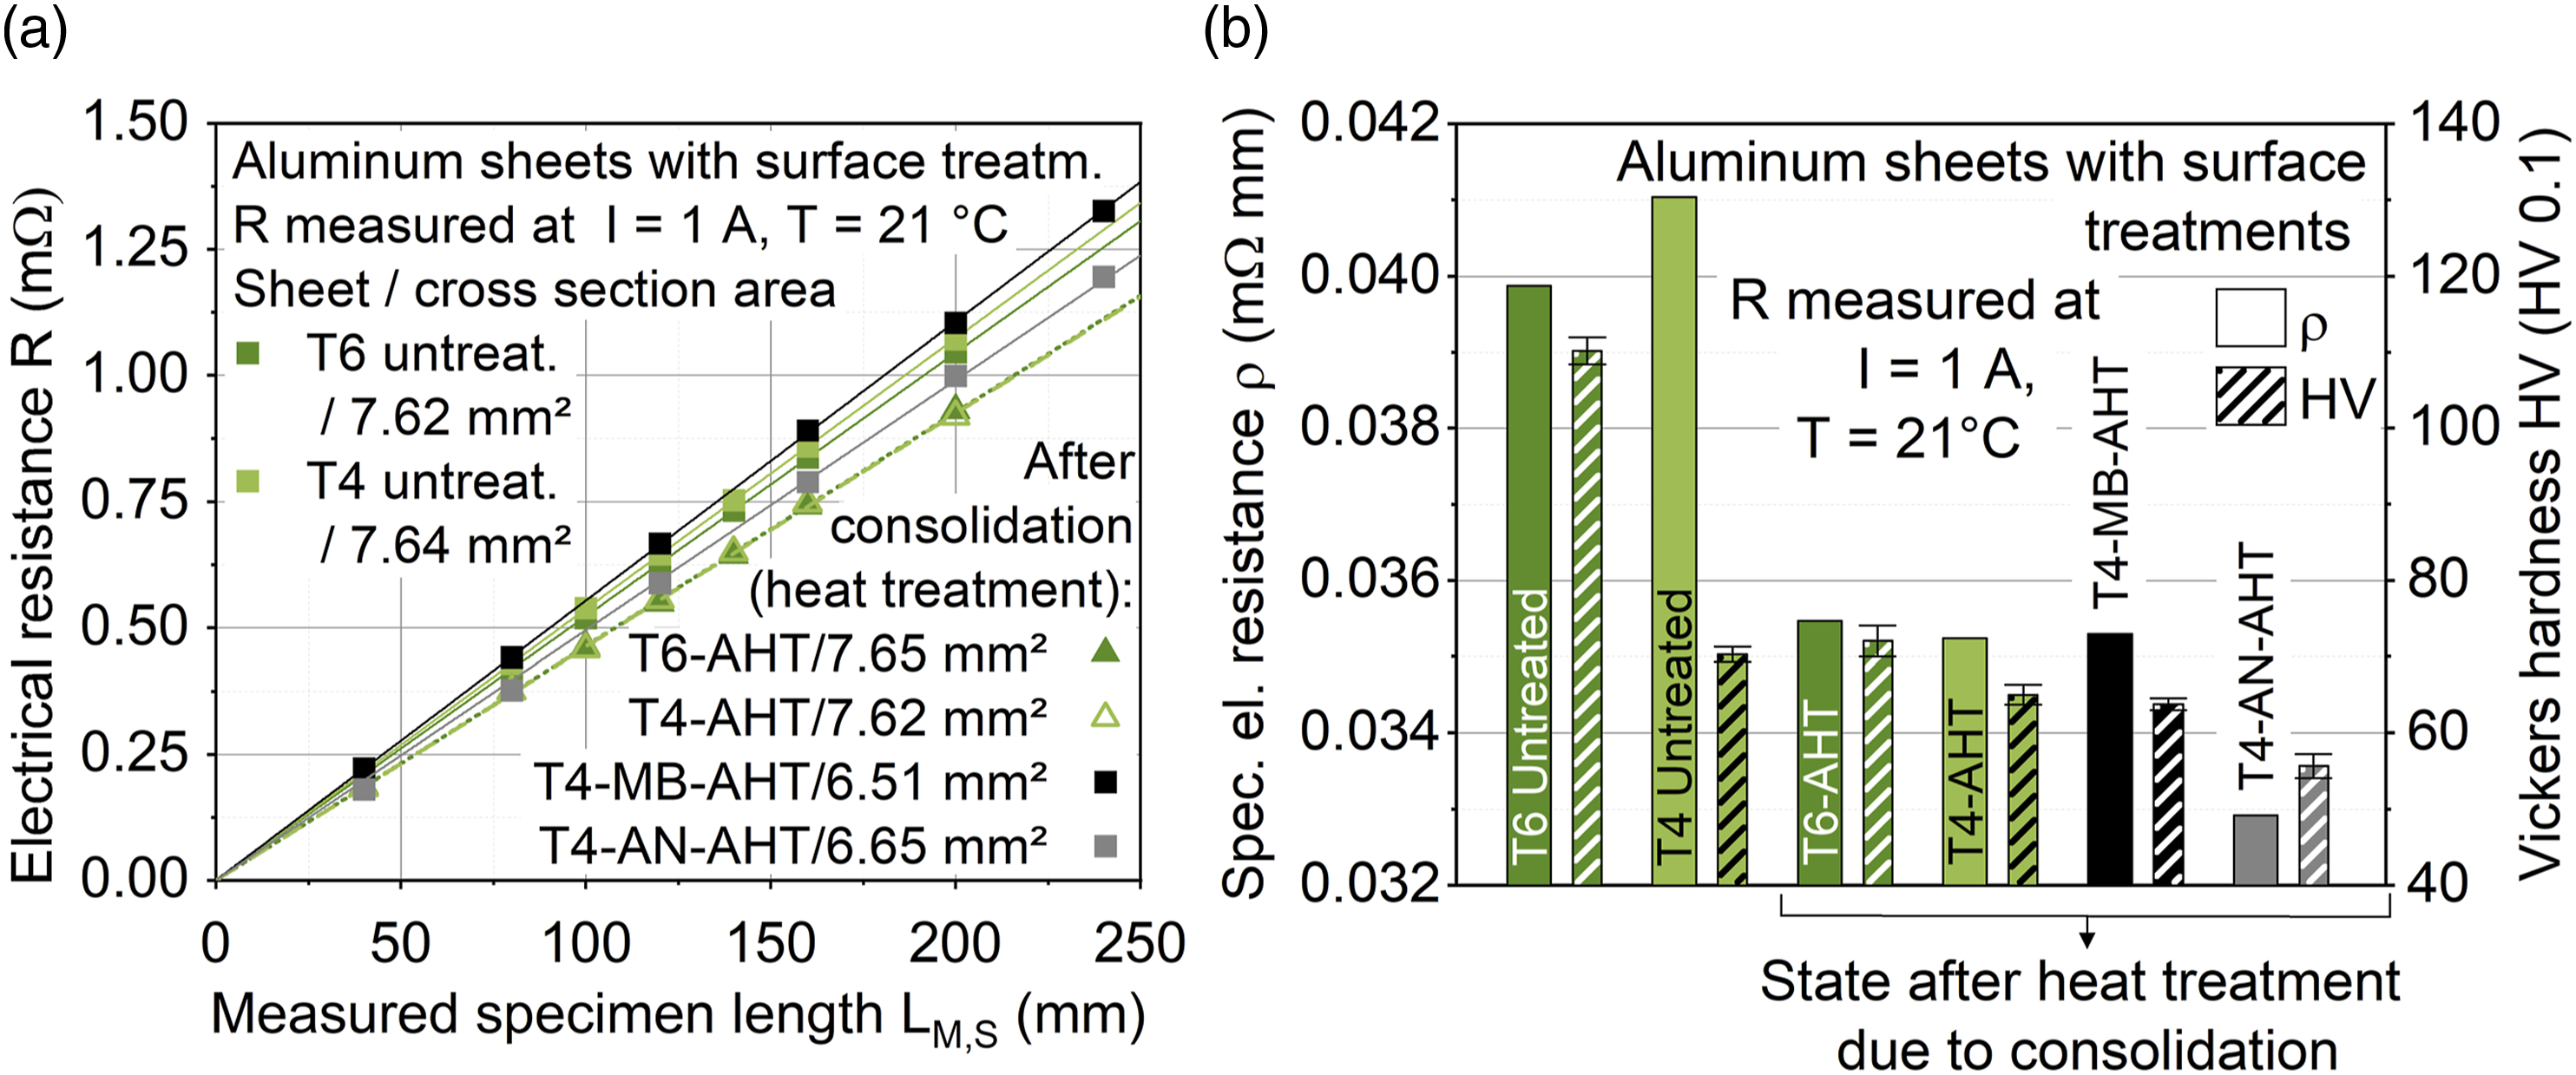
The electrical resistances of six different states of aluminum sheets were measured (Figure 7(a)) using the clamp setup visible in Figure 6(b). These include rolled sheets (T6 and T4 heat treatment) with untreated surface and identical sheets after heat treatment due to the consolidation process, in the following referred to as T6-AHT and T4-AHT. Moreover, mechanically blasted (T4-MB-AHT) and anodized (T4-AN-AHT) T4 sheets after heat treatment due to the consolidation process were measured for comparison regarding the surface treatment influence. For measurements on the anodized sheet, the anodized surface was removed locally in the measuring spot to ensure an electrically conductive connection. As shown in Figure 7(b) significant differences in specific electrical resistance are present: 0.041 mΩ mm for the untreated T4 sheet, while after heat treatment (due to the consolidation process induced softening) 0.0352 mΩ mm are present. The T6 sheet undergoes a similar reduction in specific resistance but decreases significantly in hardness. Therefore, there is no correlation between aluminum hardness and electrical resistance, which is why in future work also the microstructure, in terms of grain size and precipitations, needs to be considered. Mechanical blasting, applied to the T4 sheet before the consolidation process, shows similar values to T4-AHT, while anodizing, again applied before the consolidation process, shows lower electrical resistance.
Besides knowing the initial electrical resistance values of the FML configurations, also information about the fatigue damage-induced change in electrical resistance is necessary. Therefore, the influence of crack development was investigated. For the crack development in the T4-MB-AHT aluminum sheets, single cracks with a width of about 1.25 mm were introduced using incisions into the sheets consecutively and their influence on the change in electrical resistance was measured (Figure 8(a)). The change in electrical resistance is the same for each introduced crack. Also, the change of electrical resistance considering the total width reduction (WS) along the full length of the specimen, therefore cross-section (CS) reduction of the specimen, rather than just a partial reduction in CS area by a single crack, was determined using equation (1) and plotted to get an impression about the difference. The CS-related change in resistance follows a reciprocal function 1/x, as is known for the CS-related electrical resistance of a material. Compared to the investigations of
39
, which demonstrate a primarily linear relationship between crack length and change in resistance, the smaller-scaled specimens in this investigation show a reciprocal relationship. (a) Crack-induced change in electrical resistance in T4-MB-AHT aluminum sheet. Crack widths are about 1.25 mm. Theoretical changes in electrical resistance based on total cross-section (CS) reduction, utilizing specimen width reduction, are plotted for comparison. (b) Crack-induced change in resistance in T4-MB-AHT aluminum sheets with drill hole 5 mm (DH5) or double edge notch (DEN5). Crack widths are about 1.25 mm.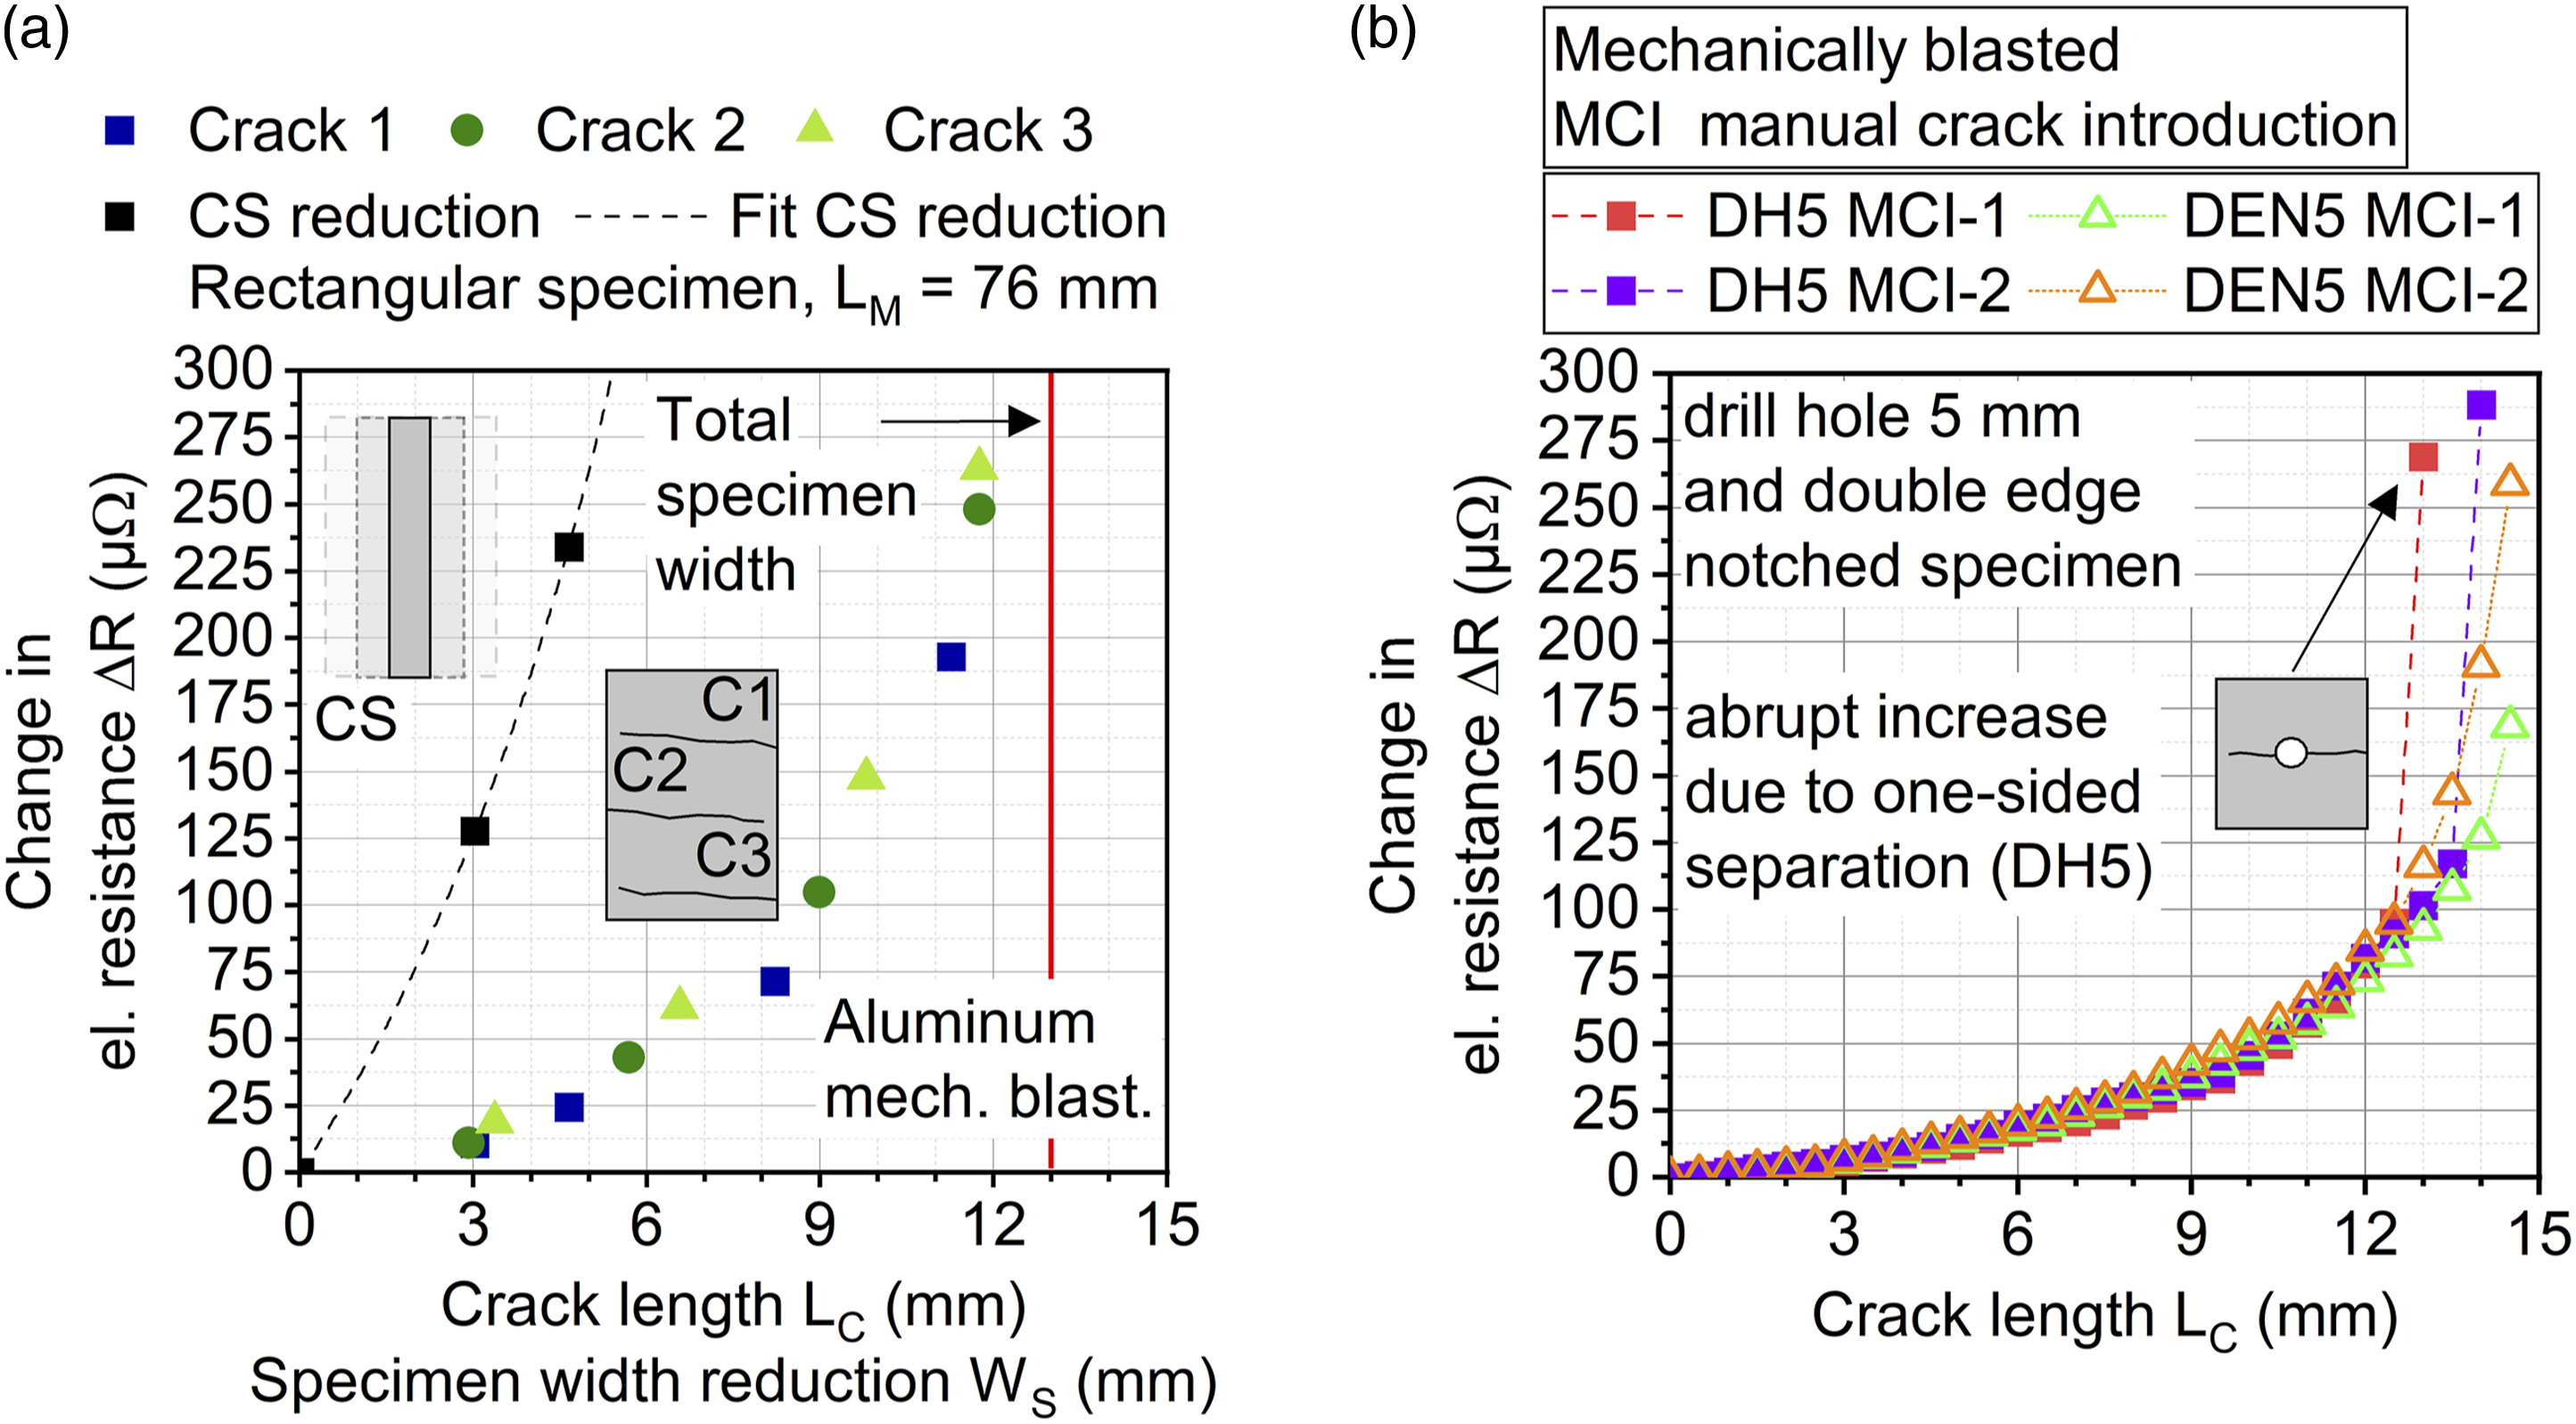
A single crack does not change the resistance nearly as much as the reduction of the whole specimen width along its length, but the resistance increases higher relative to an equivalent partial change in specimen width if looking at the specimen as a series connection of partial resistors. As highlighted in the graph a specimen width reduction from 13 mm to 8.35 mm along the whole specimen length leads to a change in electrical resistance of 234 µΩ, while the 4.65 mm crack introduced change was measured at 24 µΩ, around a 10th. Considering the measured specimen length (LM) of 76 mm and the introduced crack width of 1.25 mm, theoretically, 60 such cracks would be needed to achieve the same specimen width reduction along the length, but measurements show that the initiation of cracks has a higher impact. This points out that a simple estimation of CS-induced change in electrical resistance using basic electrical engineering circuit laws is not enough. For the fatigue tests, it can be stated that crack initiation manifests in the single digit μΩ range, continuing up to 300 µΩ for a single crack with 1 mm of specimen width left. This is confirmed by the investigations with the specified specimen geometries DH5 and DEN5, where also cracks were introduced manually symmetrically on both sides adjacent to the notch, replicating the crack growth from the fatigue experiments, and the according change in electrical resistance was recorded (Figure 8(b)). It becomes apparent, that the quantitative increase in resistance is similar between the specimen geometries DH5 and DEN5, as long as the cracks lead to similar cross-section reductions. If a one-sided separation occurs at DH5, an abrupt increase in electrical resistance occurs, which prevents a precise and reliable description of the condition of the sheet using the calibration approach stated in the introduction.
This abrupt increase is related to changes in the current distribution along the specimen width and length. Most published investigations on FML use specimens on a significantly larger scale compared to this study, which in combination with a symmetrical crack development is probably why this effect is not visible in the published results. Figures 9(a) and (b) represent the measured electrical current distribution for specimens without cracks, showing that the electrical current passes from its point of introduction primarily directly to the notched areas with the reduced cross-section, and only a fraction uses the left-over material volume. Therefore, simple theoretical calculations of the specimen’s electrical resistance based on Ohm’s law are not accurate and lead to deviations. This effect is amplified with the occurrence of cracks, which reduce the cross-section even further and lead to a narrower electrical current flow, as is visible in Figures 9(c) and (d). Following a one-sided separation of the aluminum sheet in DH5 (see Figure 9(e)), the electrical current flow shifts to one side, resulting in locally higher voltages and thus higher measured electrical resistances. This explains the visible abrupt increase in electrical resistance for DH5 in Figure 8(b). Change in electrical current distribution with crack development for the specimen geometries (a), (c), (e) DH5 and (b), (d) DEN5. The right axis for normalized electrical current (proportion of the electric current flowing through the location measured with regard to the specimen width) visible in (b), (d), is also valid for (a), (c), (e).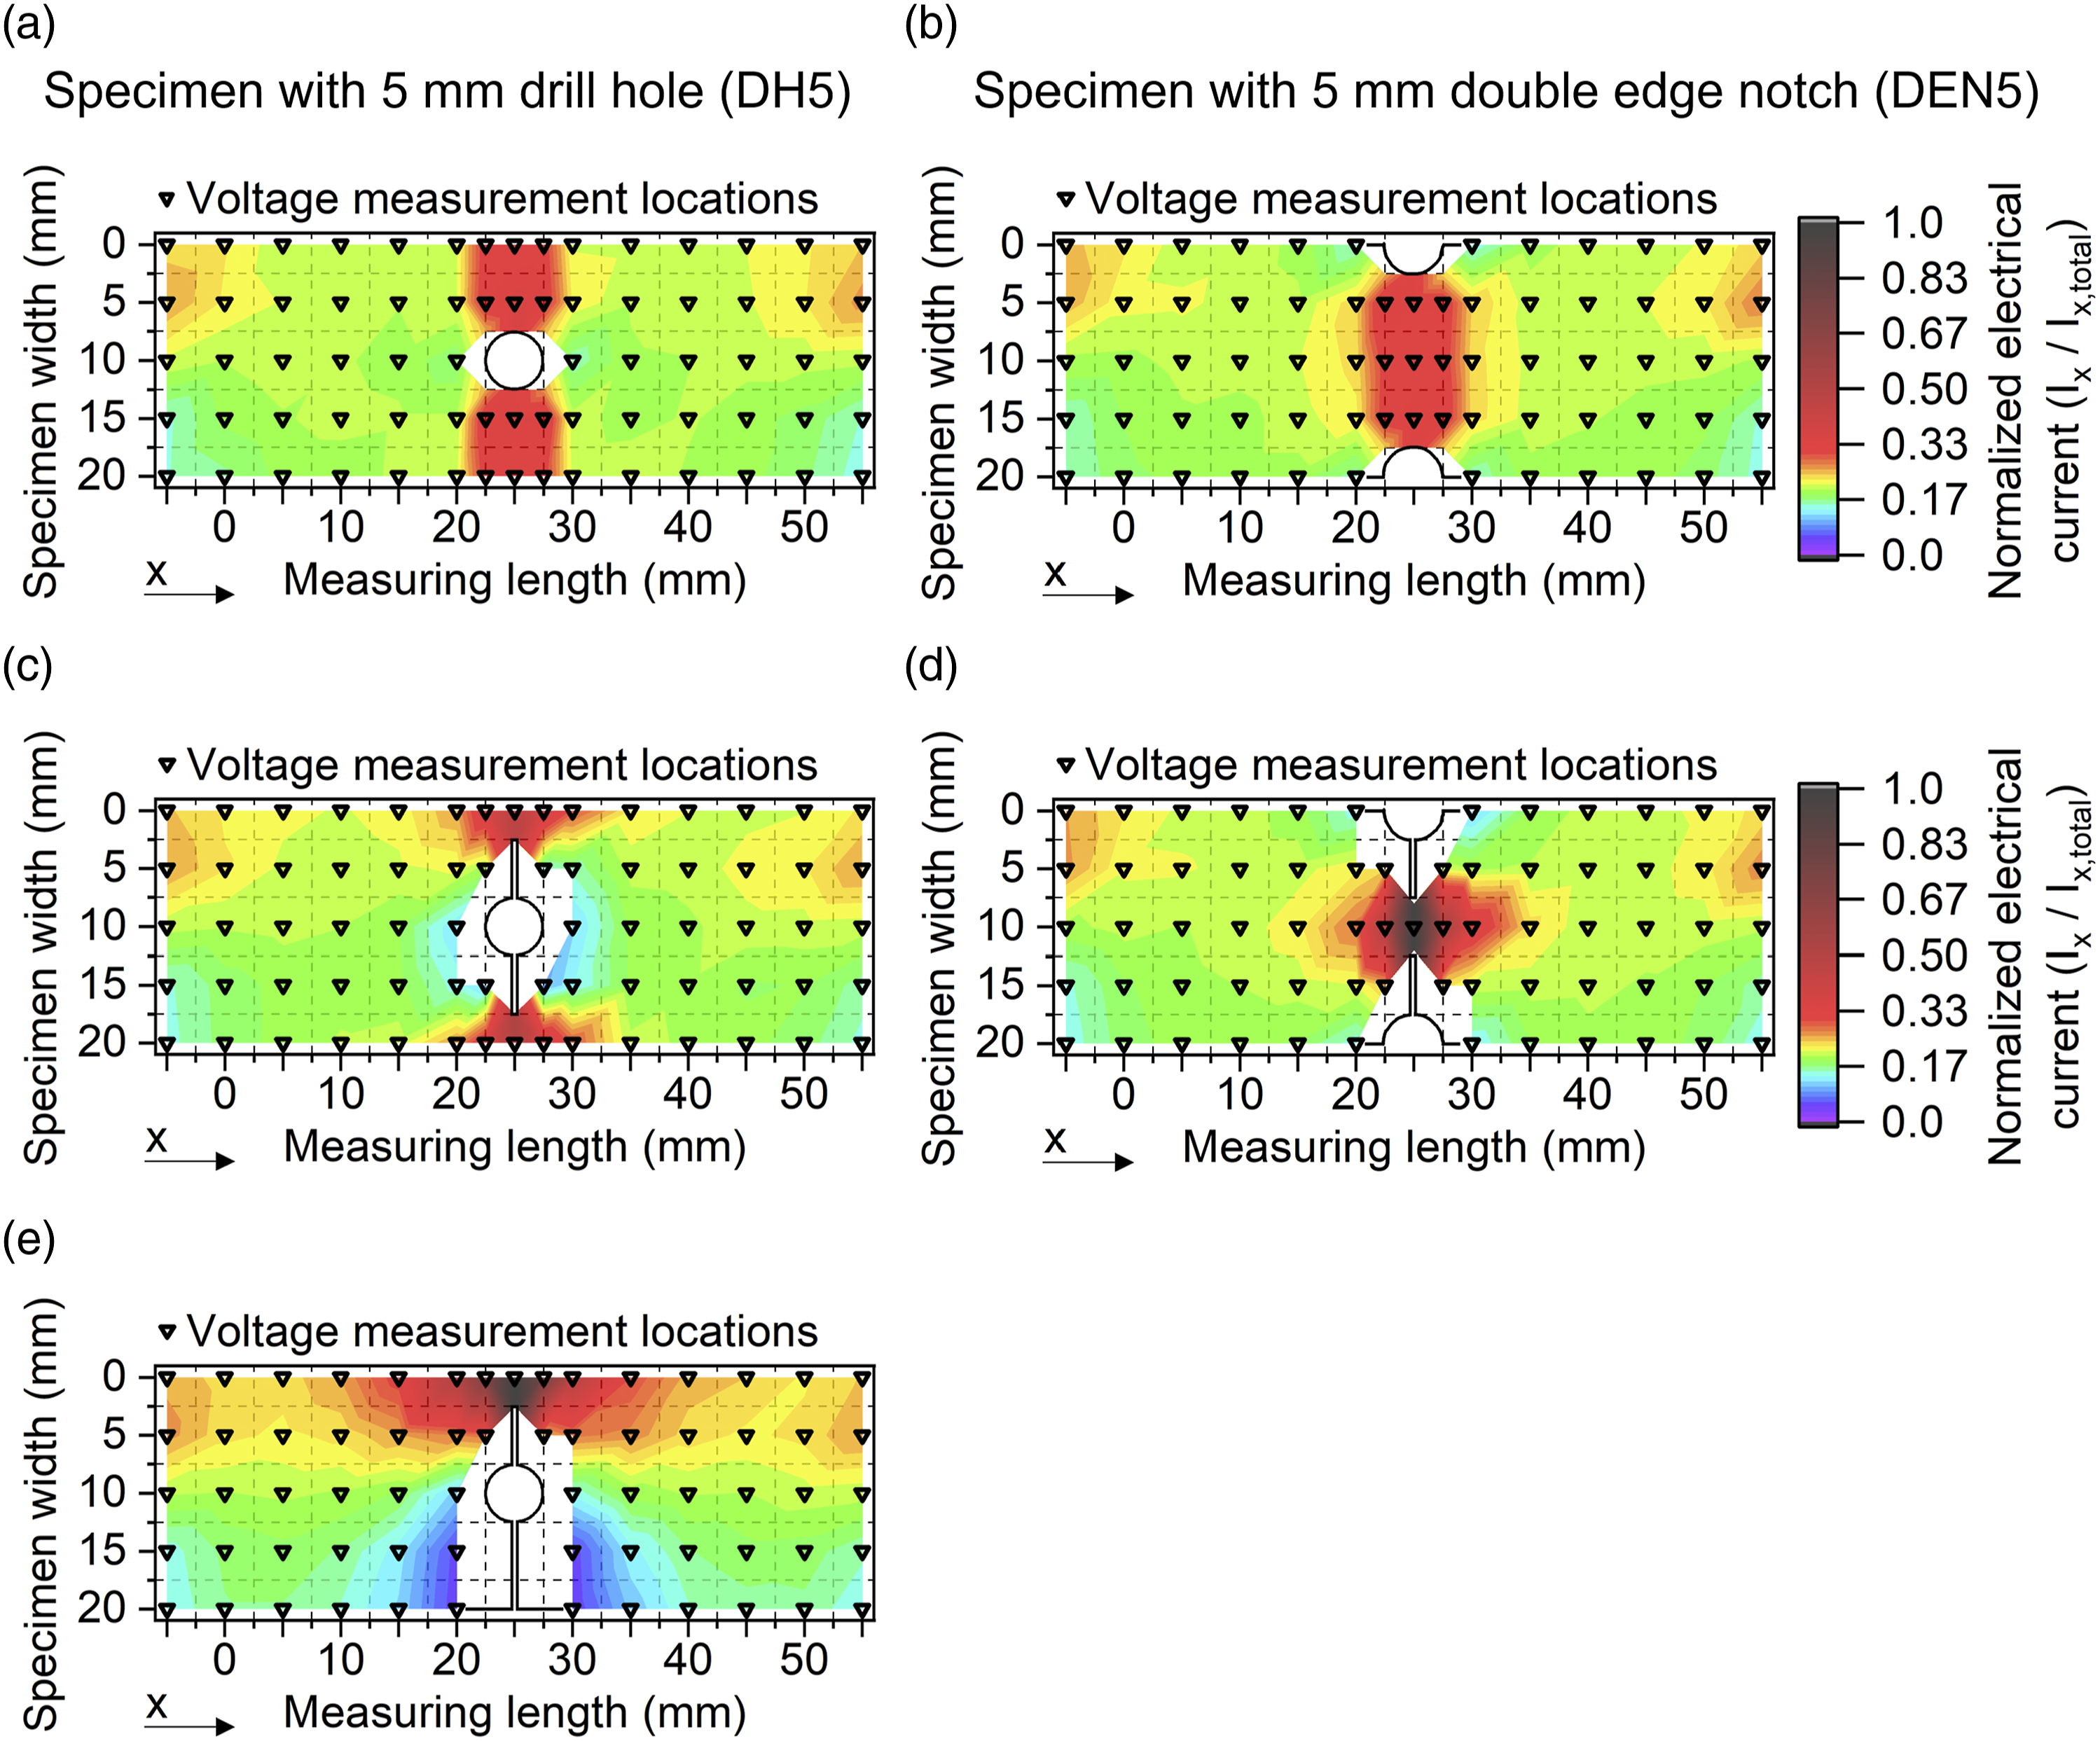
Besides the specimen geometry and crack development, the material temperature is also a relevant factor, since it has a measurable impact on the electrical resistance, as shown by equation (3) which is suitable for the temperature range investigated. (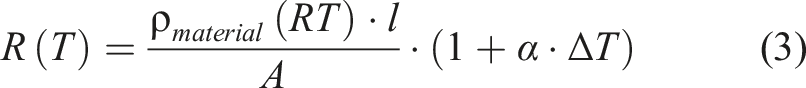
To determine the temperature coefficient, defined changes in temperature were applied to the aluminum. Figure 10(a) shows the direct correlation between material temperature and electrical resistance for an aluminum T4-MB-AHT sheet specimen, which can be plotted as a linear function shown in Figure 10(b). For the determined specific resistance of 0.035 mΩ mm the resulting temperature coefficient yields 0.004 1/K, which is in accordance with the literature.40,41 It becomes apparent that especially regarding crack initiation in the aluminum, which results in single digit μΩ changes in resistance, the temperature dependency needs to be considered, since for the investigated specimen geometry 1 K of change in temperature leads to about 1.1 µΩ change in resistance. Therefore, if a change in temperature during mechanical testing is inevitable, the observation of the change in temperature is essential to reflect on the damage related initiation and change in electrical resistance. Material-dependent relationship of temperature and electrical resistance. (a) Shows the change in electrical resistance for a T4-MB-AHT aluminum sheet at varying temperatures, while (b) shows the relationship as a linear function.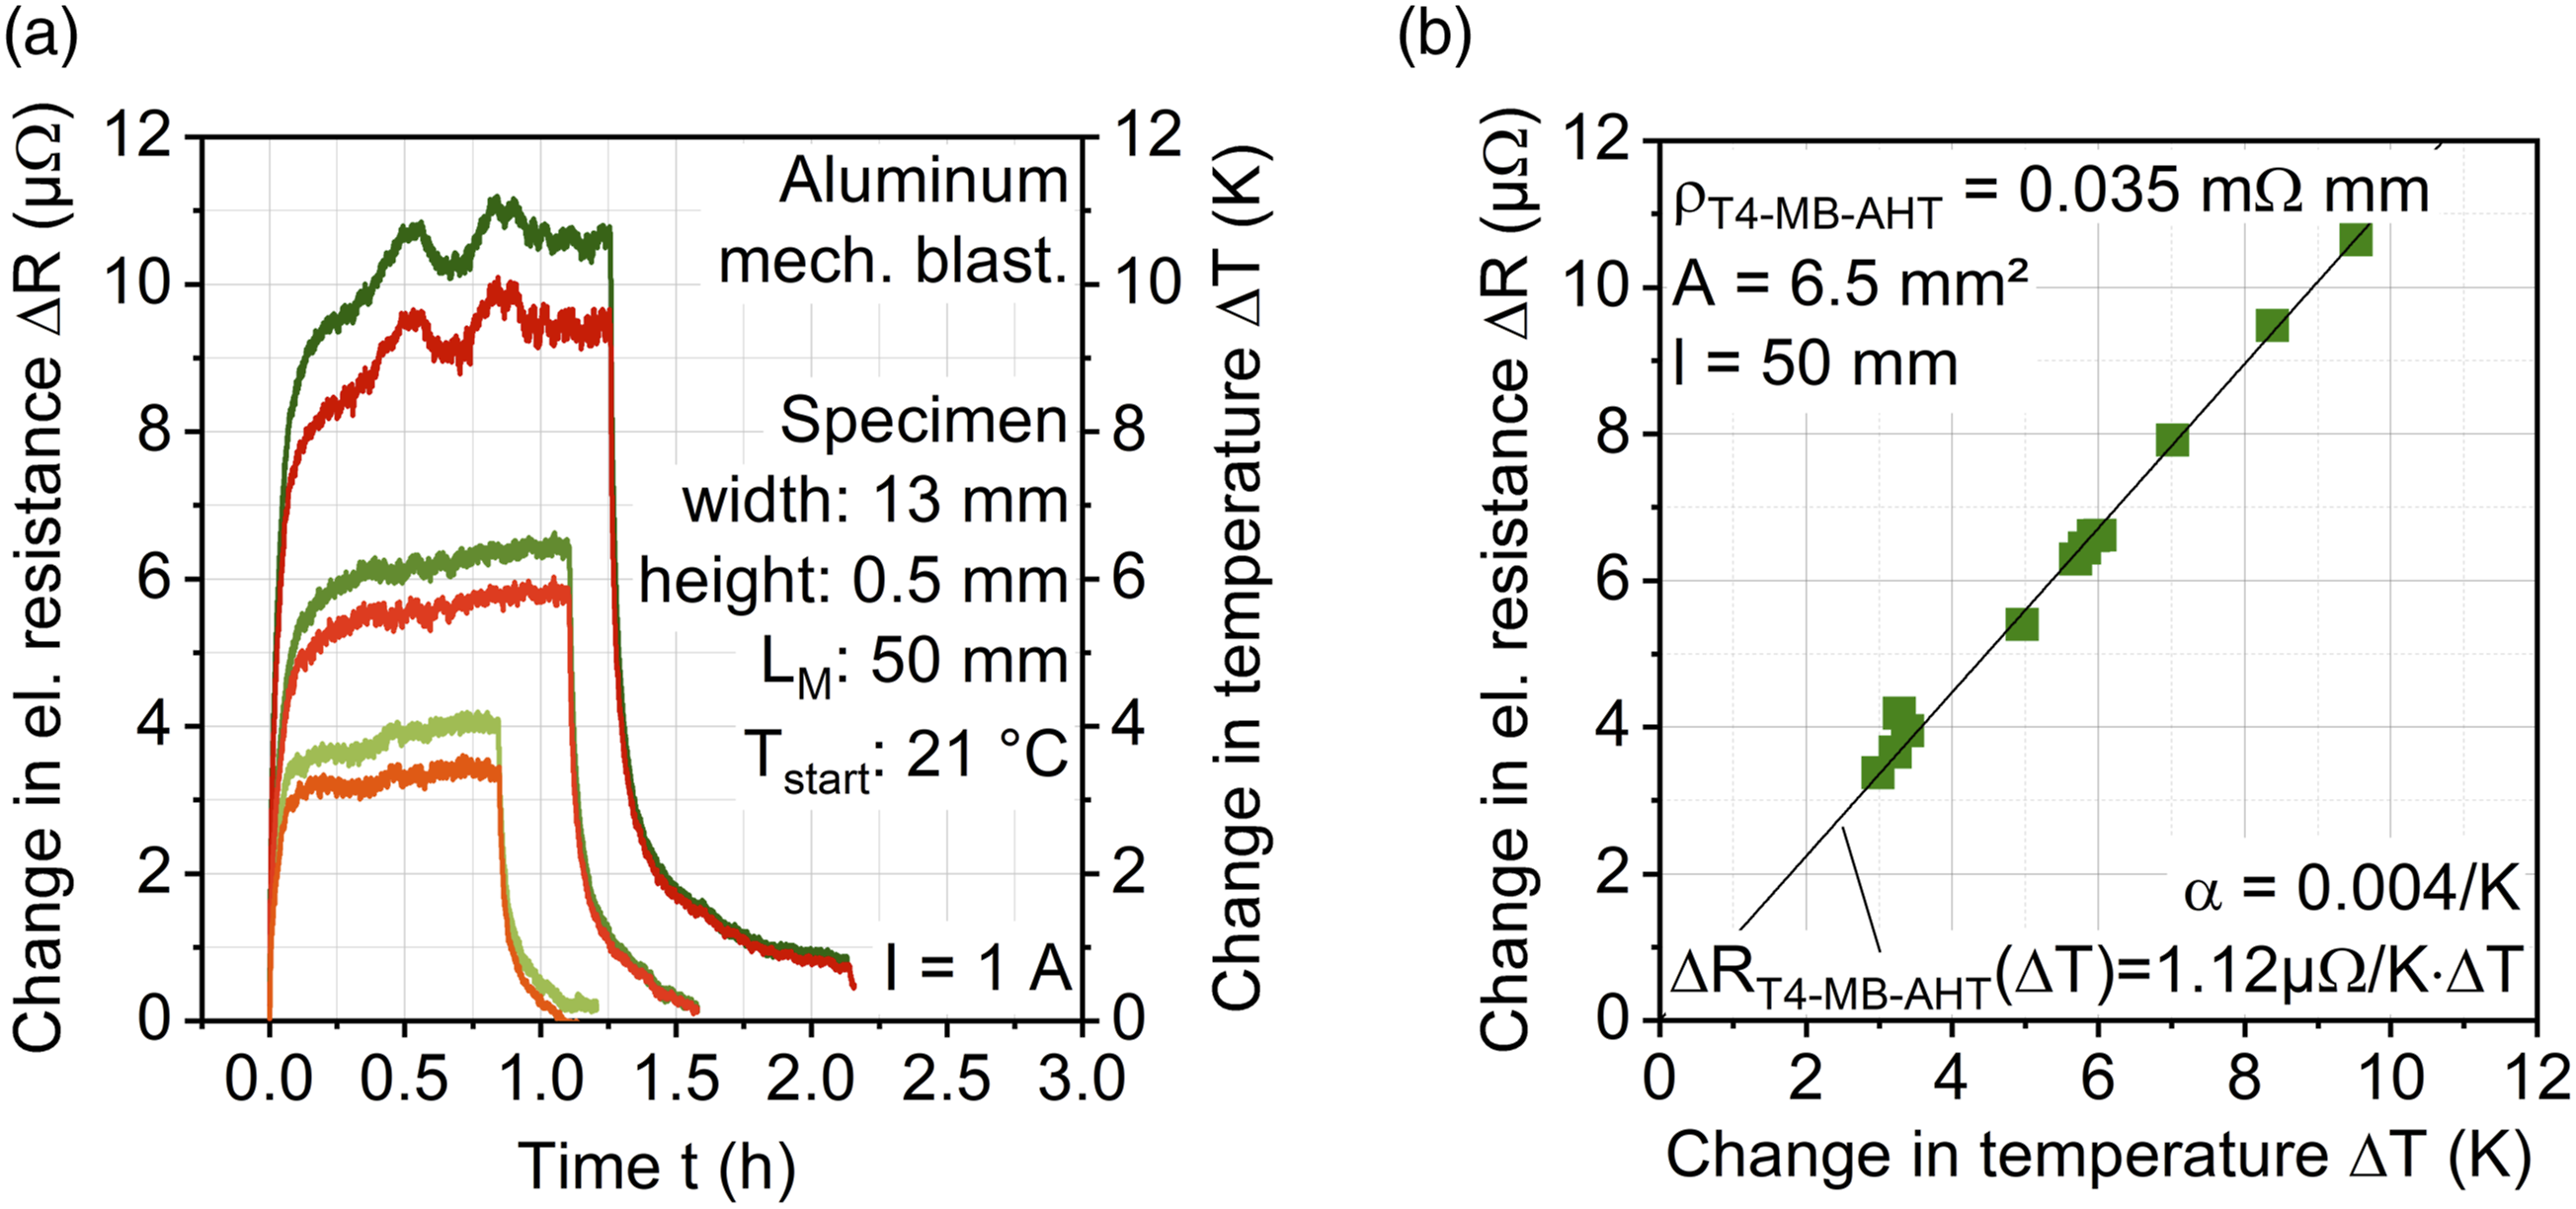
Also, the electrical current flowing through the material may induce a change in temperature. This is why a suitable current for the measurement needs to be determined. Hence tests were conducted where a defined electrical current was initiated into a T4-AHT aluminum sheet specimen to observe the change in temperature (see Figure 11(a)). Above an electrical current of 0.3 A first changes in temperature are detectable on the specimen surface, staying under 1 K even for 1.0 A. Since cracks form in the aluminum during fatigue loading, degrading the electrical conductivity of the specimen as shown in Figures 8 and 9, the extent to which this leads to a resistance-related increase in temperature was also investigated (Figure 11(b)). Up to 0.3 A, changes in temperature below 1 K are present for the investigated multiple cracked specimen from Figure 8(a). A current of 0.3 A is therefore considered for the fatigue investigations, since this does not lead to significant changes in temperature, even in the case of crack growth, in which the change in electrical resistance is dominated by the reduction in cross-section. Relationship of electrical current and change in aluminum surface temperature for an (a) intact and (b) crack introduced T4-MB-AHT aluminum sheet specimen. The right axes for temperature and electrical current, visible in (b), are also valid for (a).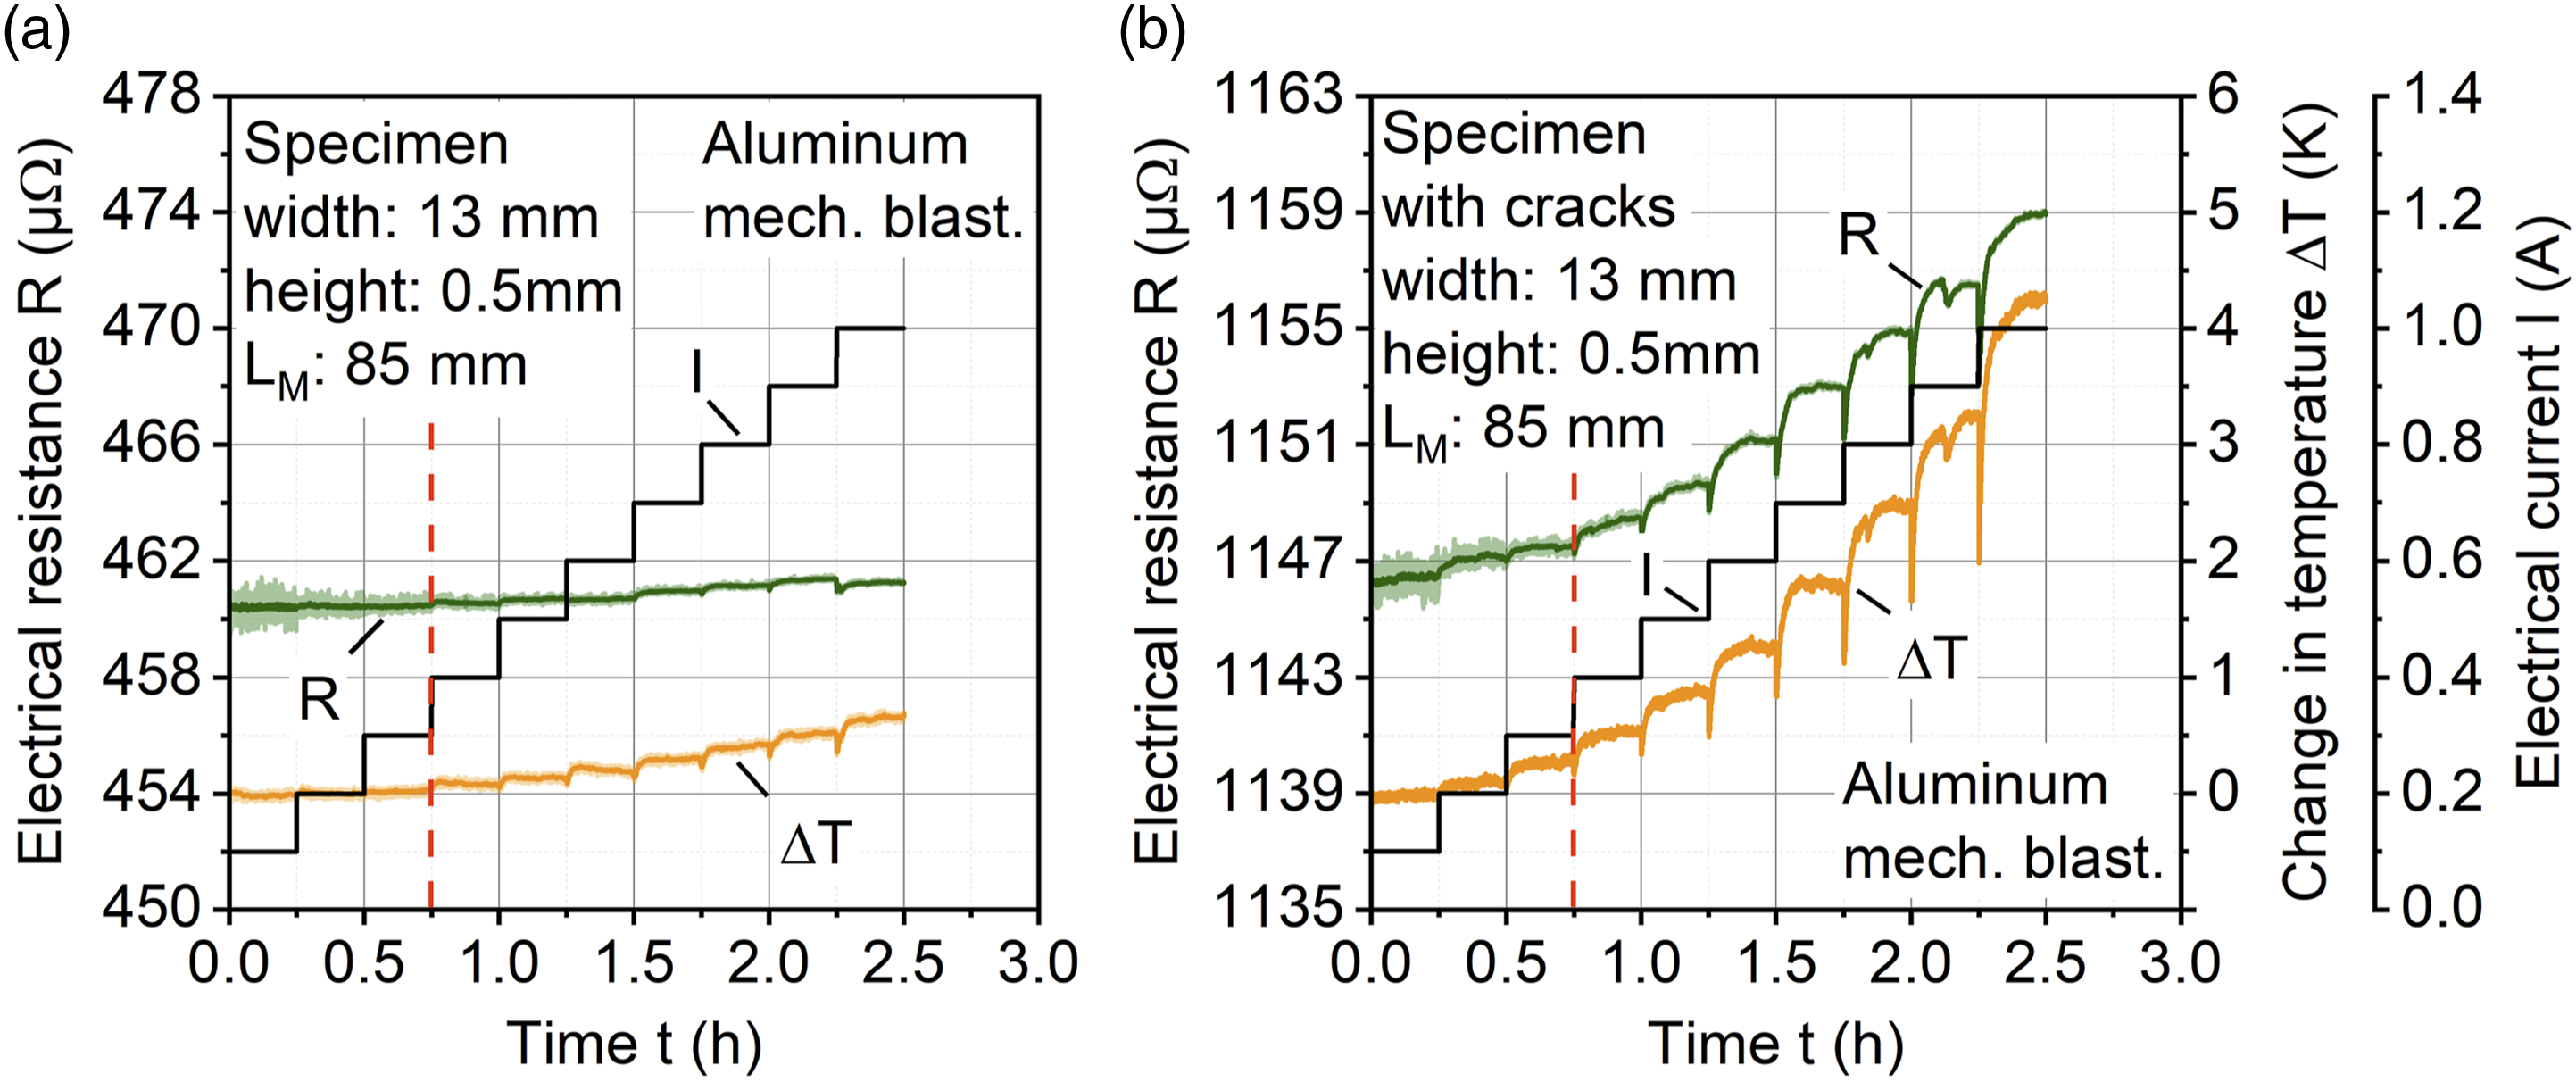
Electrical resistance composition of the aluminum sheet measurements
The simplified electrical circuits that result when the metal sheets are contacted with the two contacting variants presented in Figures 6(b) and (i) front and (ii) simultaneous front and rear aluminum sheet measurement, are shown in the following Figure 12. Primarily contacting variant (i) is investigated, while (ii) is investigated to explore feasibility. For the fatigue investigations, the distance between the voltage drop measurement clamps is 50 mm, while the current in- and outlet clamps are placed approximately 10 mm adjacent to those. Electrical circuits resulting from applied contacting variants, where the FML’s (i) front aluminum sheet is or (ii) the front and rear aluminum sheets are measured.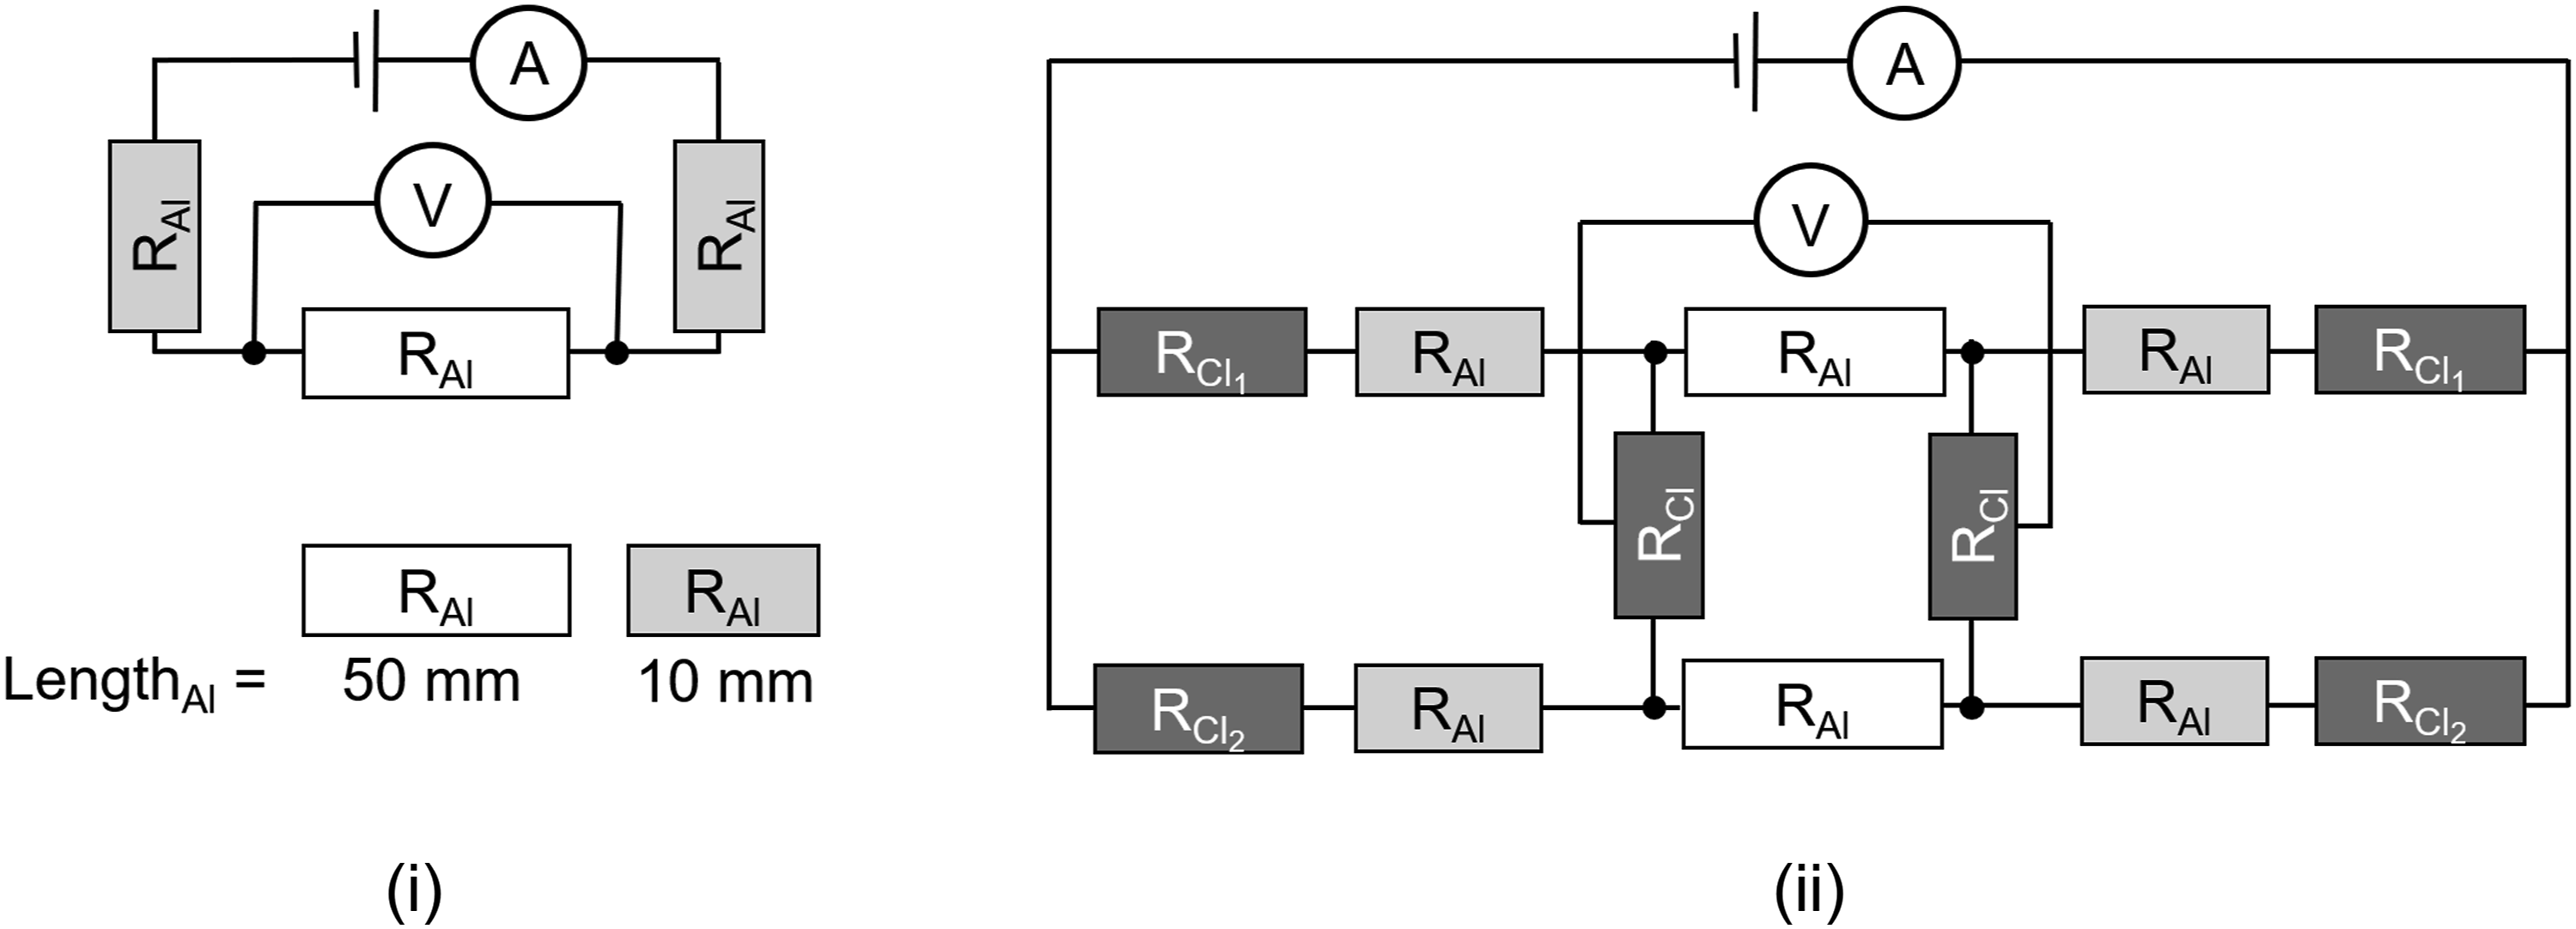
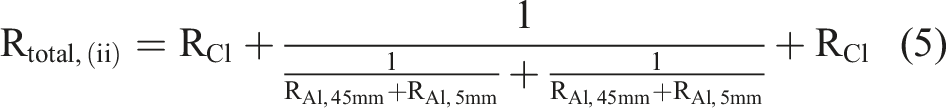
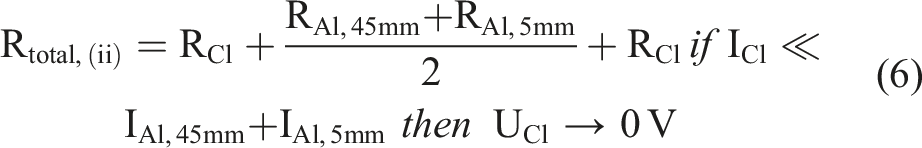
In the preliminary investigations, the following specific resistance values were determined: 0.0352 mΩ mm for T4-MB-AHT and 0.0329 mΩ mm for T4-AN-AHT. For the clamps, an electrical resistance of around 50 mΩ was measured during initial investigations. Using the following equations (4)–(6) and the specimen width of 20 mm the total electrical resistance measured resulting from the contacting variants can be estimated. For the electrical resistance of the aluminum, which is measured between the 50 mm displaced clamps (RAl,50mm), the notch-dependent reduction of specimen width (in this case from 20 to 15 mm) needs to be considered, thus they can be split in a simplified manner into two parts: RAl,50mm = RAl,45mm + RAl,5mm. Equation (4) represents the measured resistance using contacting variant (i) and (5), (6) contacting variant (ii). As long as the aluminum sheets are intact and have a significantly lower resistance than the clamps, equation (6) determines the measured electrical resistance, since the electrical current flowing through the voltage measurement clamps is negligible.
Condition monitoring using contacting variant (i) during fatigue load
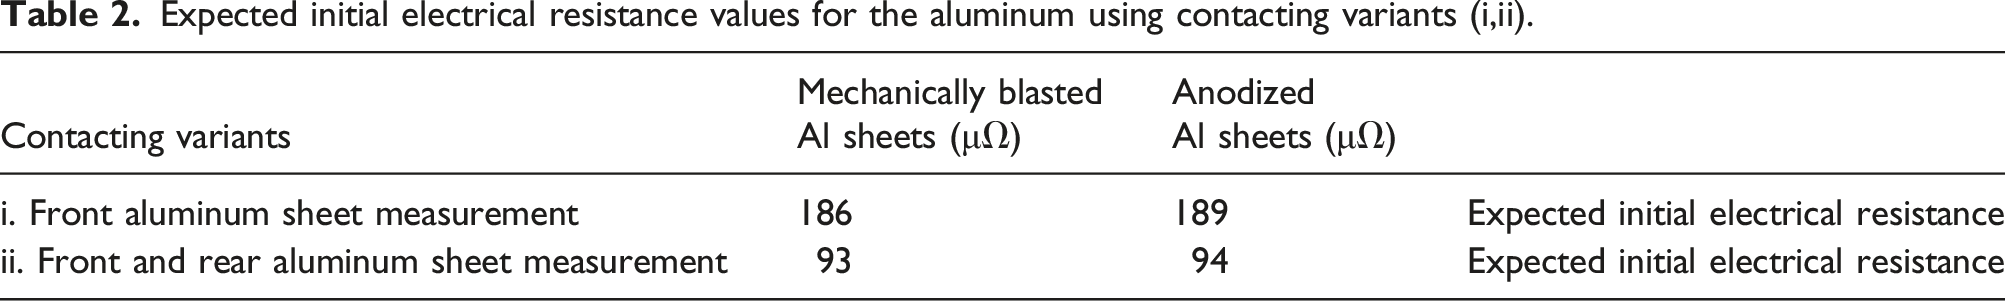
From the initial investigations regarding electrical current-based measurements the necessary knowledge about the boundary conditions for the electrical resistance measurements (temperature dependency, cross-section reduction, change in microstructure) for the fatigue test monitoring is gathered. Figure 13 shows the result of a CAT carried out on a 2/1 (GC) MB DH5 specimen, visualizing the development of electrical resistance, crack growth, change in dynamic stiffness, and temperature for condition monitoring. In this case, the electrical resistance was measured using contacting variant (i), meaning only the front aluminum sheet of the FML. Based on the above calculations and Table 2 an initial resistance of 186 µΩ was expected, while a resistance of about 200 µΩ was measured. This is attributed to the electrical current distribution demonstrated in Figure 9. As expected, a change in electrical resistance is recorded with the initiation of aluminum cracks, which simultaneously lead to stiffness decrease. Through DIC images the time of initial crack initiation can be verified. No change in temperature, which could affect the material-dependent electrical resistance, was recorded, showing that a suitable testing frequency was chosen for the applied load spectrum. Just like in the preliminary investigations regarding crack-induced resistance change in the aluminum, with crack development the electrical resistance increases, following a hyperbole function. With accelerated crack development just before the full tear (crack extension to the sheet borders) of the right side of the aluminum sheet, a steep increase is visible. At this point, a total width of around 3 mm of the conducting aluminum sheet remains and a total change in electrical resistance of around 75 µΩ is measured, consistent with the observations from Figure 8(b). In the following the crack length in the left side of the aluminum sheet increases, leading to an ultimate resistance increase at tearing. It should be noted that considering condition monitoring, the stiffness decrease indicates the time of crack initiation, but does not pinpoint other events, rather showing a continuous decrease, making the benefits of using suitable metrologies obvious. Constant amplitude test result for a 2/1 (GC) MB DH5 specimen, tested at a maximum stress of 100 MPa. Electrical resistance was measured using contacting variant (i). Selected states of crack growth are shown in the DIC deformation images.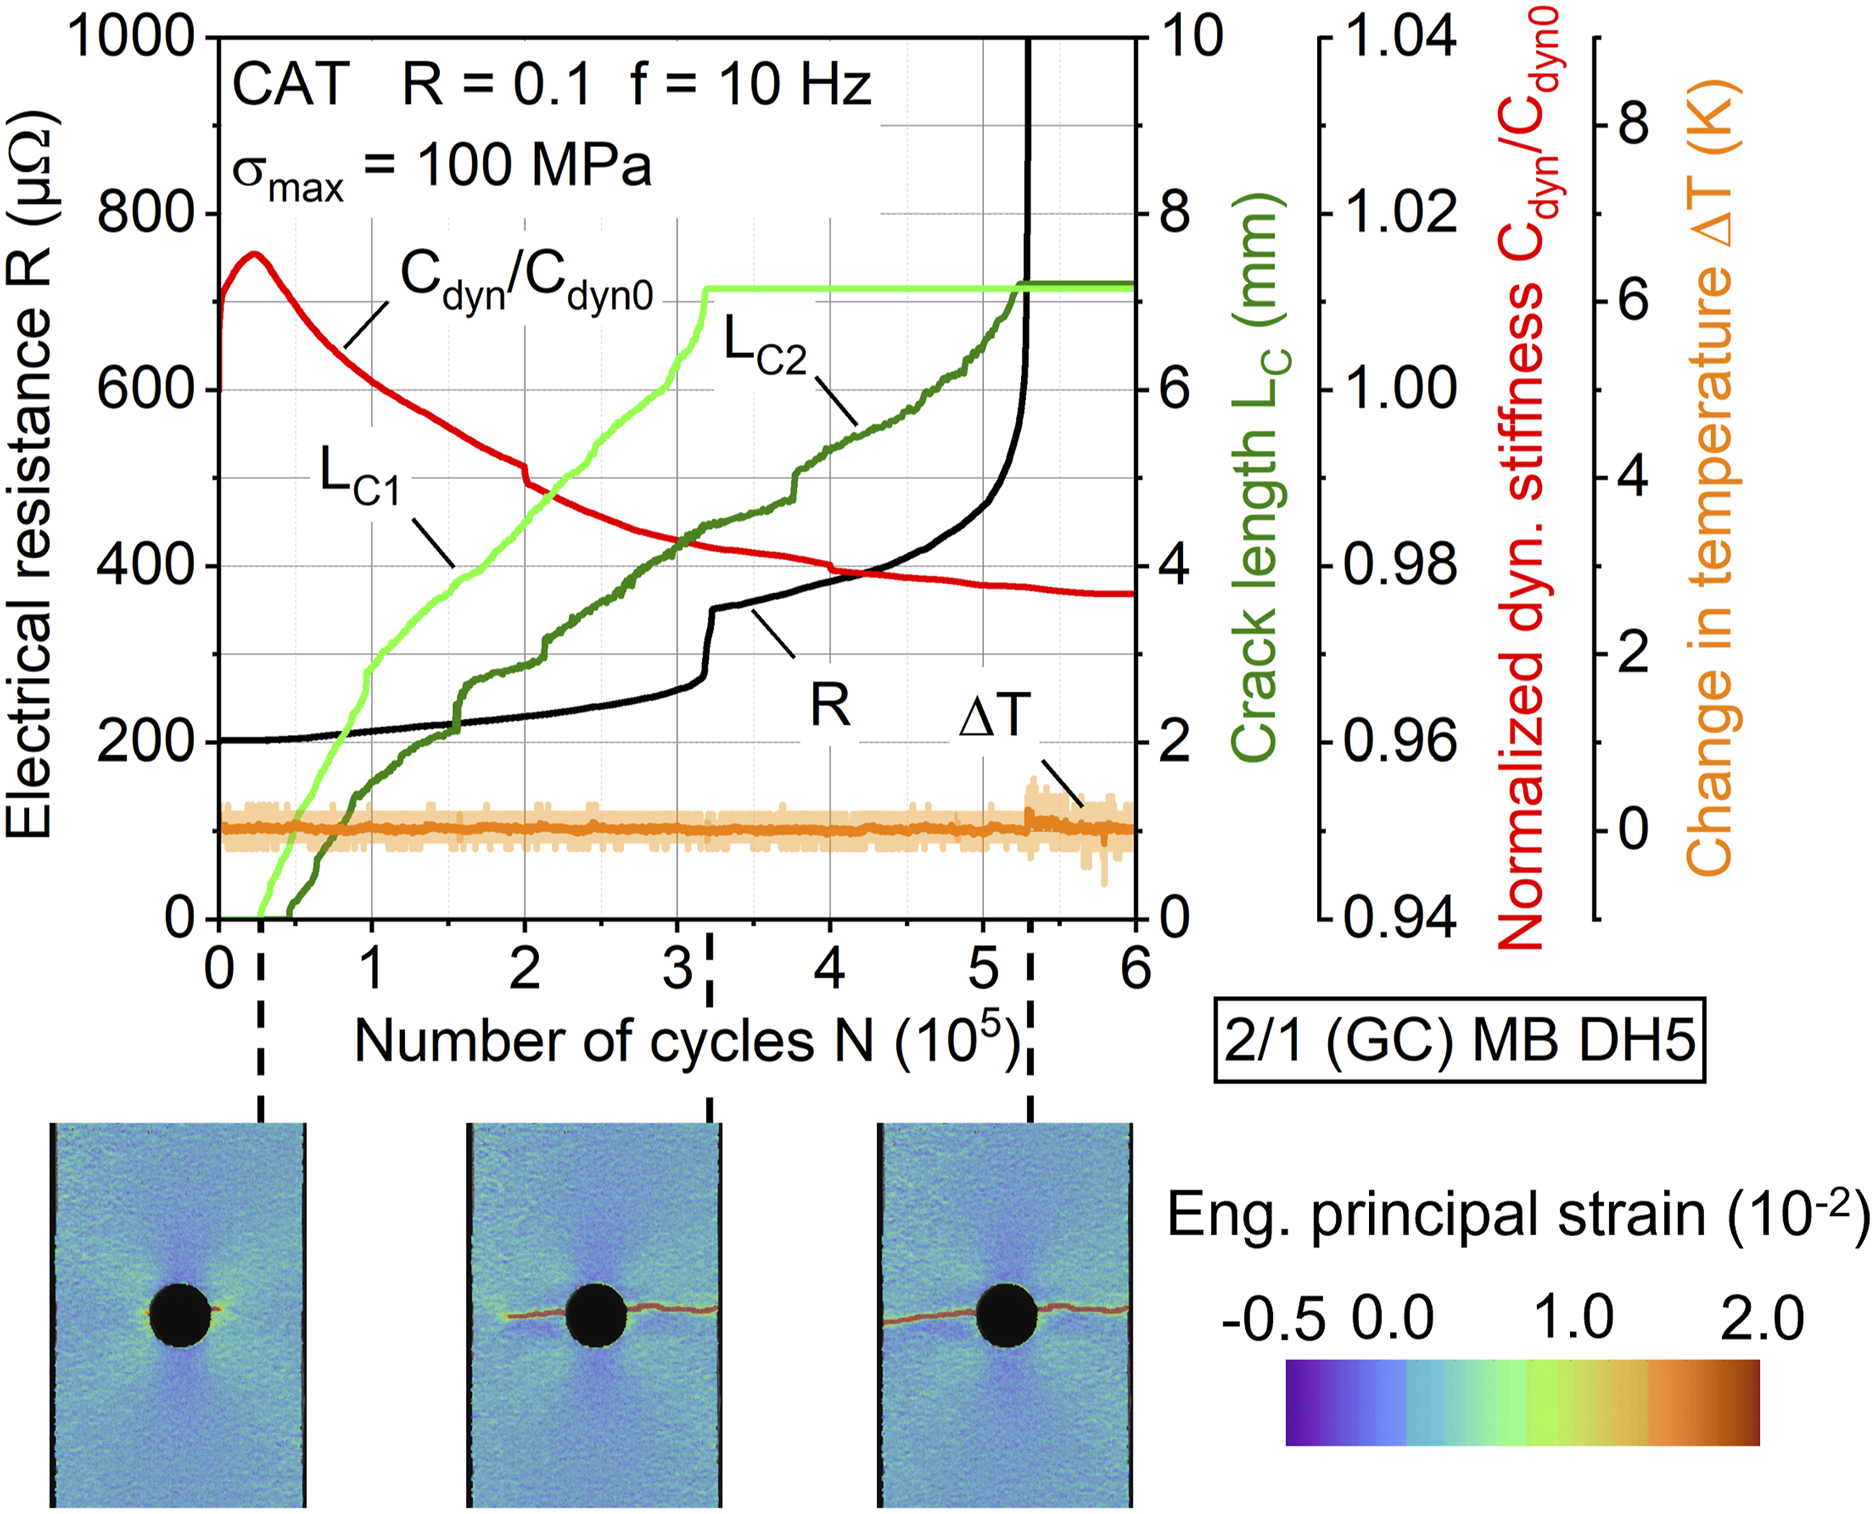
But the use of electrical resistance measurement for crack detection also has its limits. Looking at Figure 14 the electrical resistance development is visualized for CAT with 2/1 (GC) MB DH5 specimens at several maximum stress levels, again measured using contacting variant (i). Also, DIC deformation images are attached, showing the crack growth state just before the final steep resistance increase. With increasing load, the occurrence of cracks and therefore the induced change in electrical resistance changes. At maximum stresses including and above 150 MPa, multiple cracks initiate, leading to a different development in electrical resistance. This leads to the multiplication of the electrical resistance due to multiple parallel developing cracks (150 MPa) or a change in the appearance of its curve development (175 and 200 MPa). The definition of a limit value for the change in electrical resistance, until which the conductive capabilities of the FML remain, is possible and could exemplarily be defined as 300 µΩ. Electrical resistance measured during constant amplitude tests under varying maximum stresses for 2/1 (GC) MB DH5 specimens. Corresponding states of crack growth before the final steep resistance increase are shown in the DIC deformation images.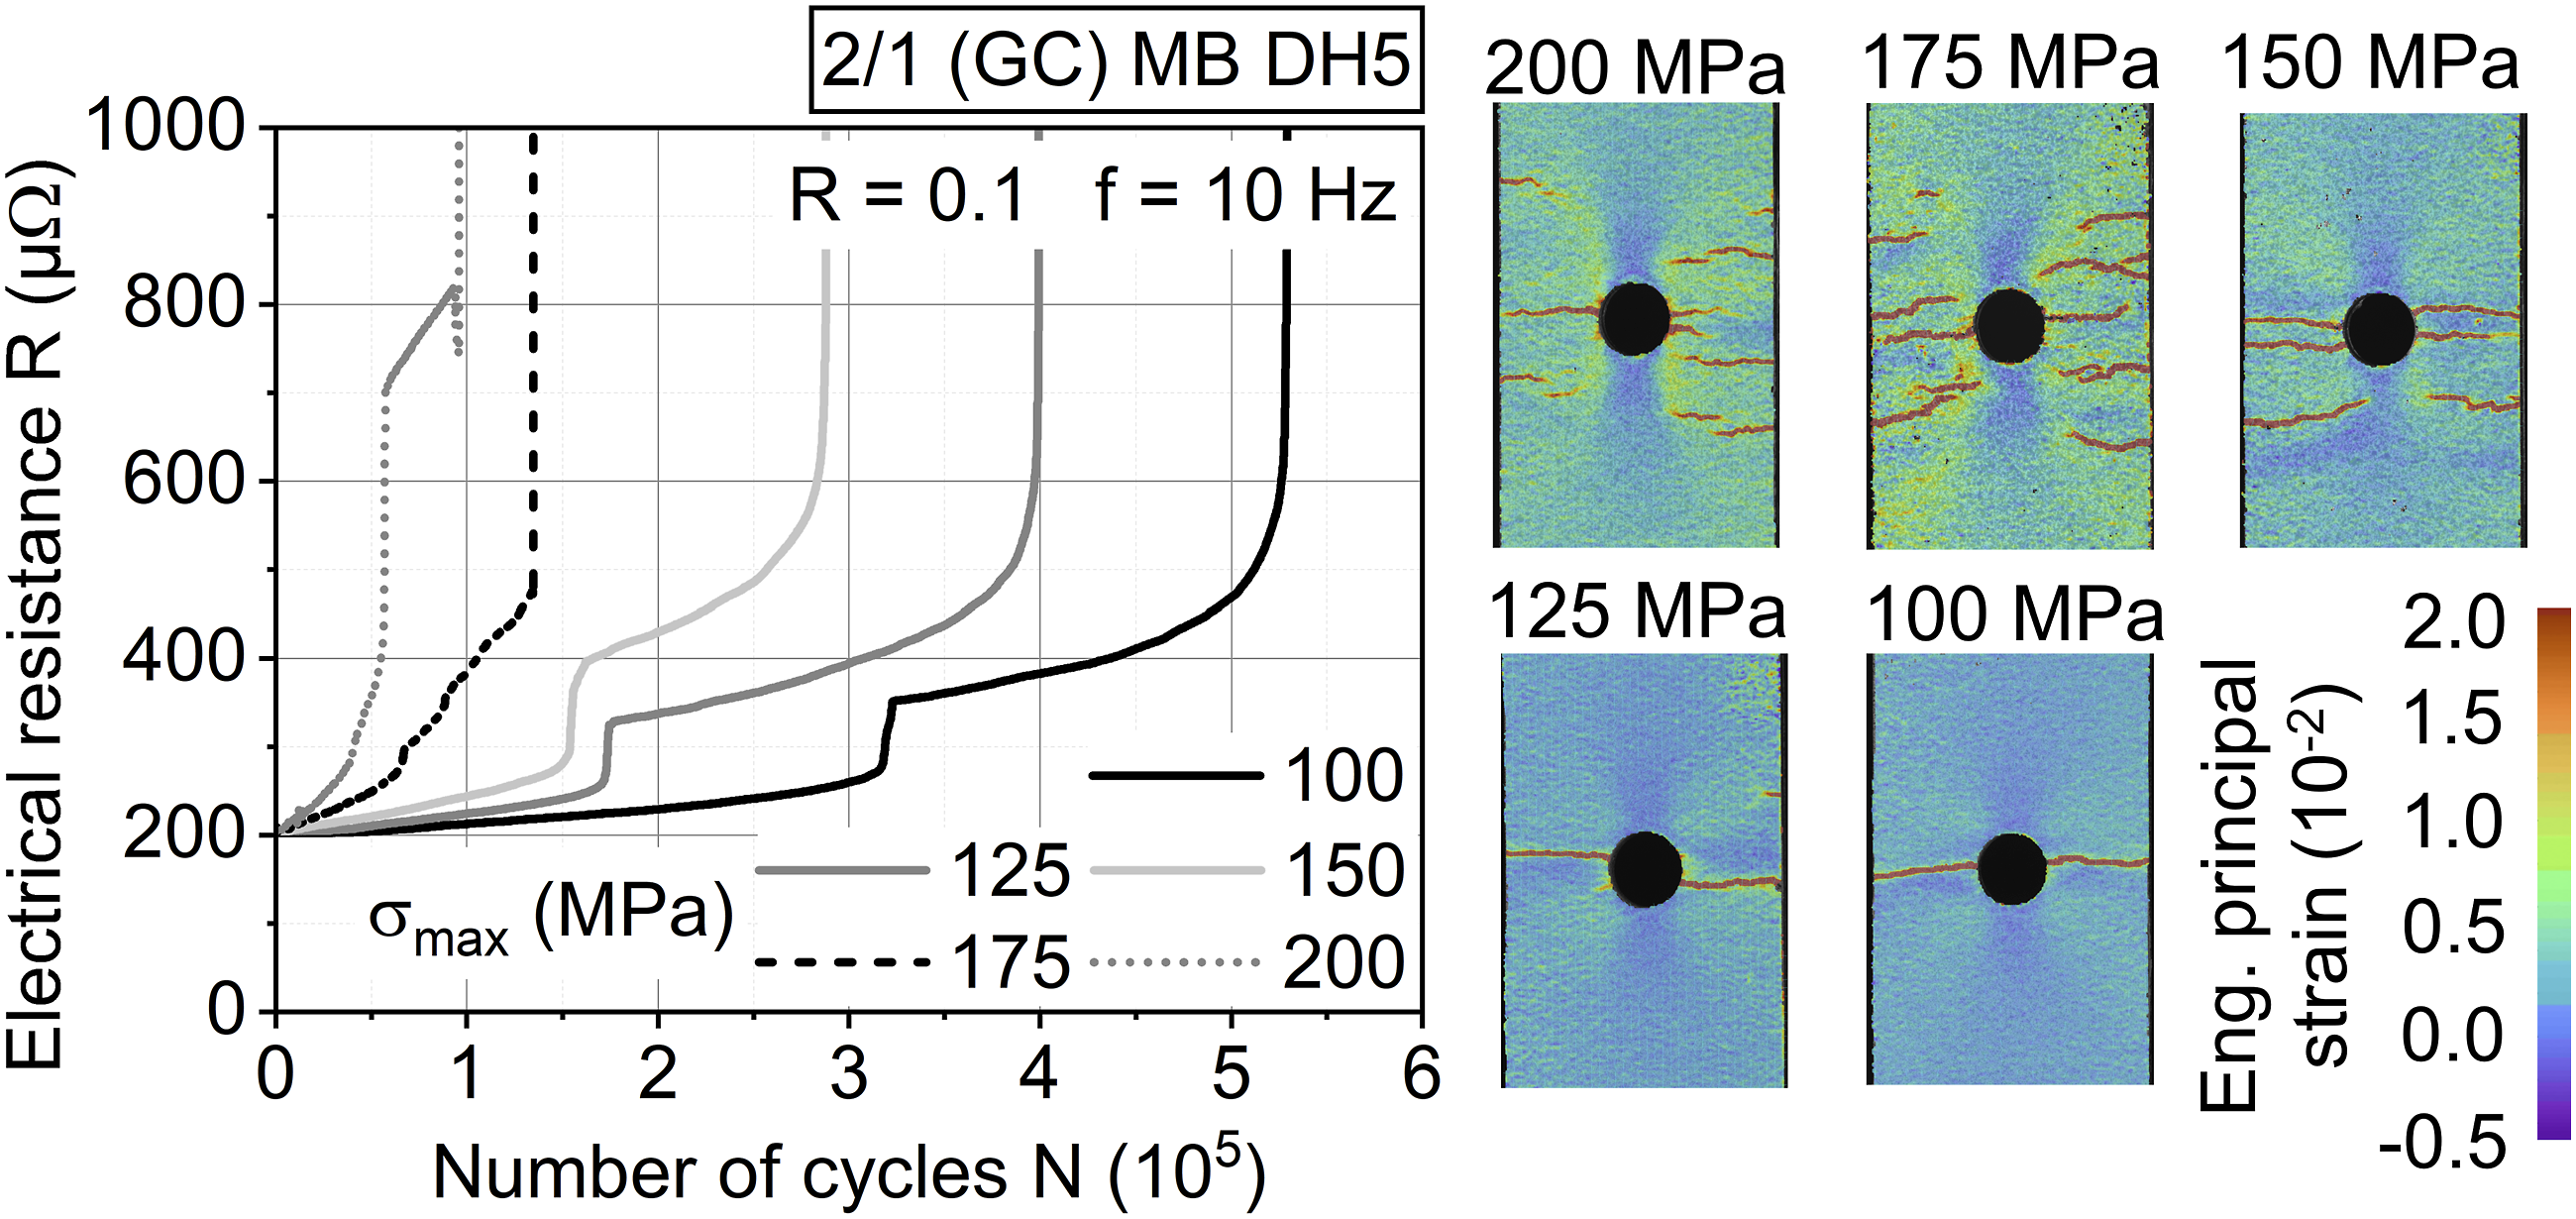
The change in electrical resistance dependent on the crack length measured during the CAT matches the results from the preliminary investigations with manually introduced cracks (Figure 15). Considering the results plasticization has negligible impact on the material’s change in electrical resistance, and therefore the monitoring of crack-related change in cross-section is sufficient. For the DEN5 specimens (Figure 15(b)) at lower maximum stresses (≤150 MPa) slightly lower increases in resistance values are measured compared to the manually introduced cracks, which are attributed to cracks not always developing symmetrically and in a straight line towards each other, therefore leaving a cross-section for the electrical current to pass through. Change in electrical resistance plotted over crack length, measured during constant amplitude tests on 2/1 (GC) MB DH5 (a) and DEN5 (b) specimens. Comparison curve for the manually introduced cracks, using incisions, embedded.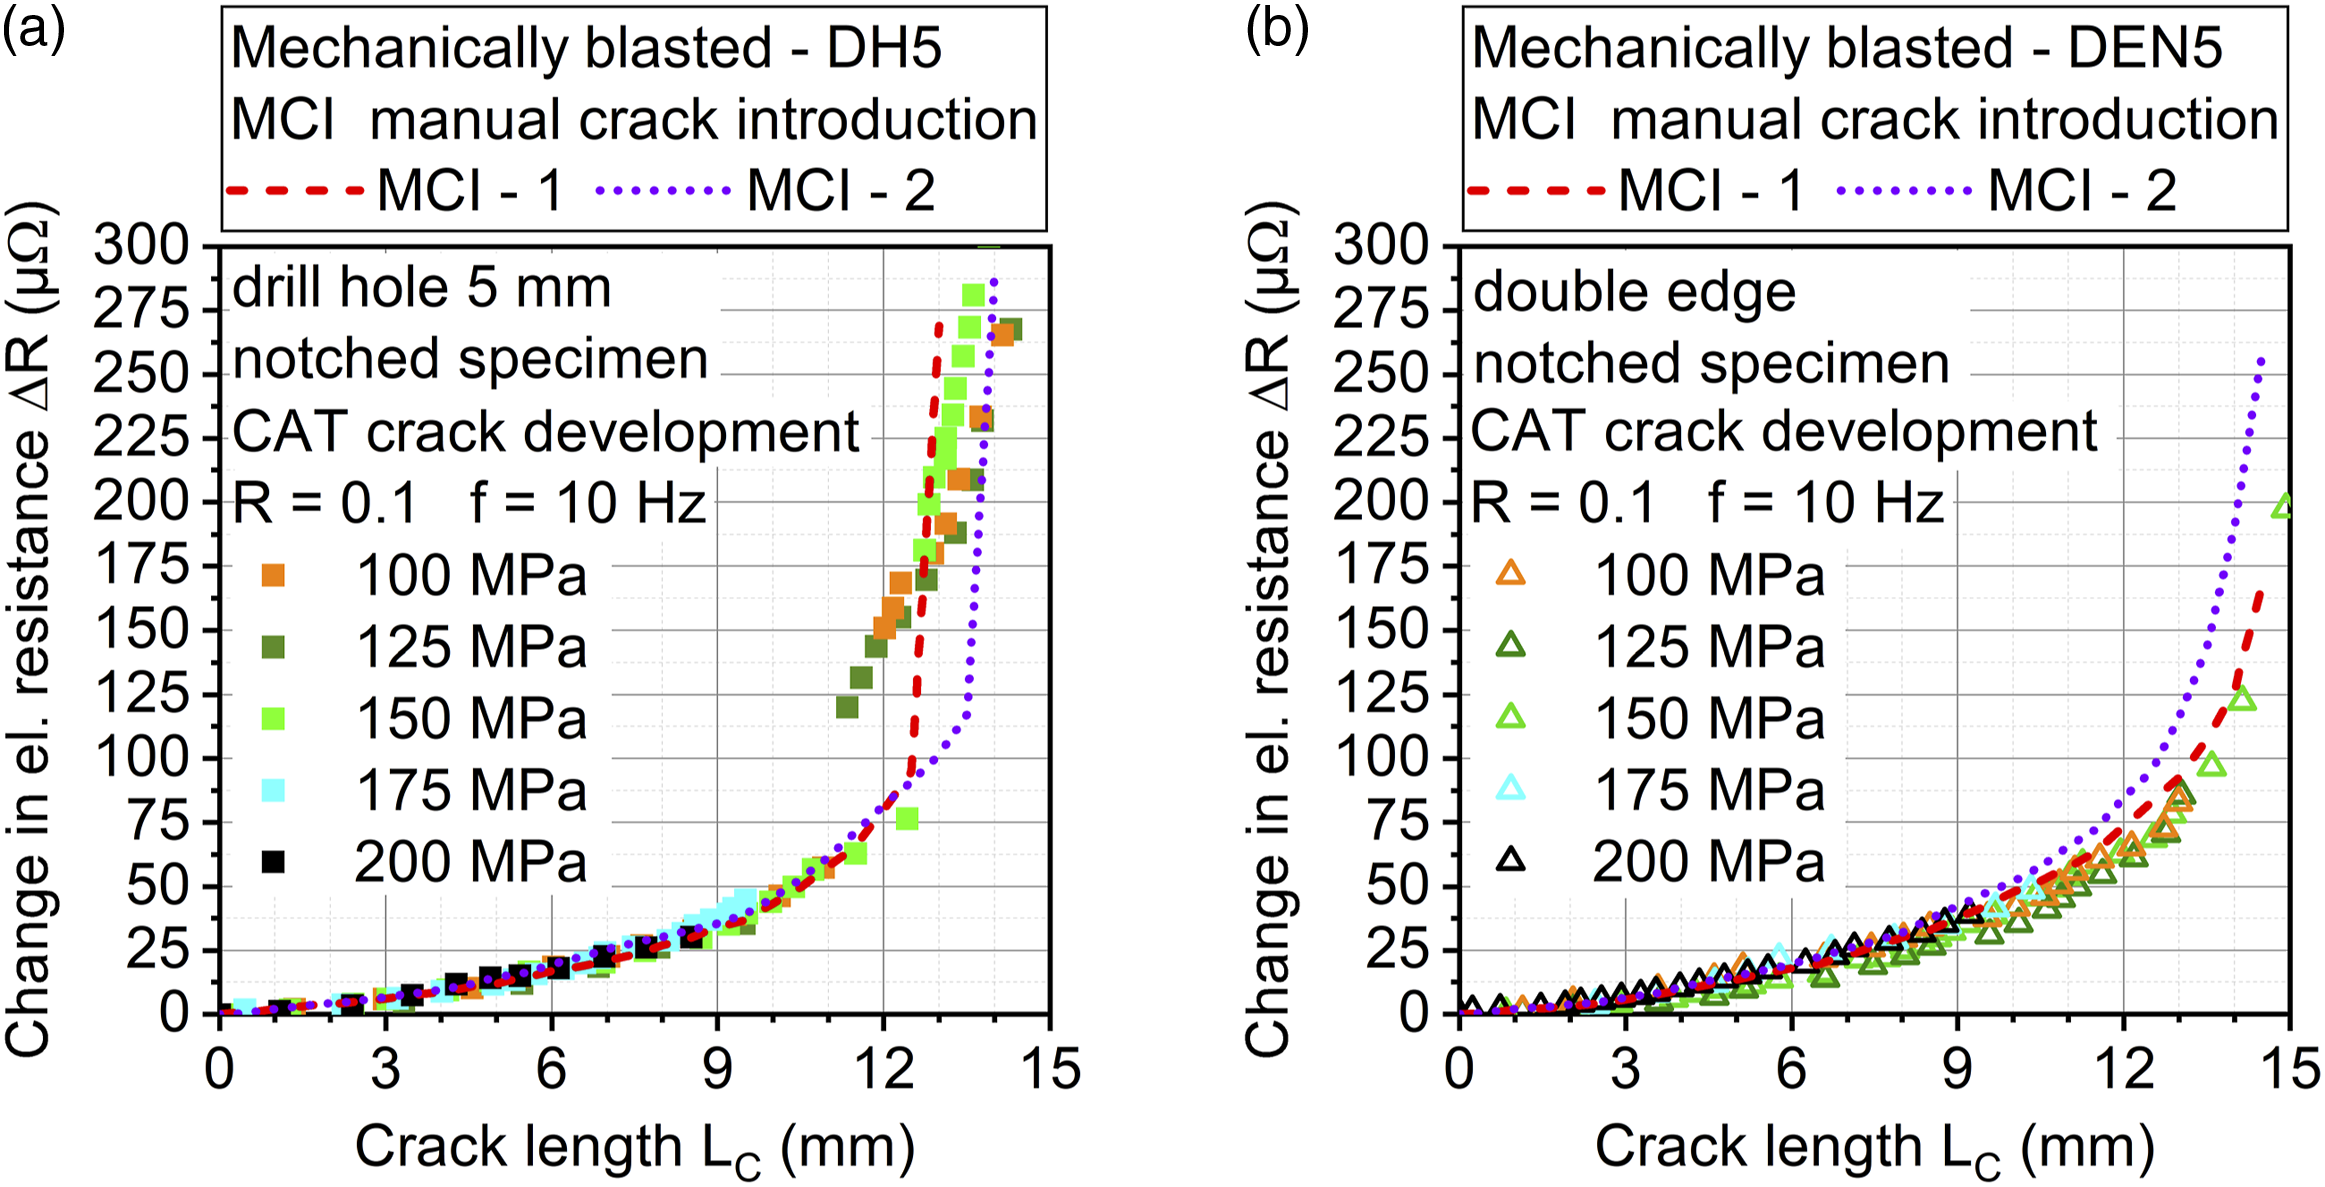
Condition monitoring using contacting variant (ii) during fatigue load
Since the above-used contacting variant (i) only considers the electrical resistance of the FML’s front aluminum sheet, the full assessment of the FML’s electrical conductivity capability as well as damage state is not possible. In the following Figure 16, the result of a CAT carried out on a 2/1 (GC) MB DH5 specimen using contacting variant (ii) is illustrated, showing the results in the same manner as in Figure 13, allowing for a direct comparison between contacting variants (i) and (ii). As with contacting variant (i) the initiation of cracks correlates with a decrease in dynamic stiffness and no significant changes in temperature are visible. The cracks at the notch initiate consecutively, starting in the front and then the rear aluminum sheet with similar and parallel development. All cracks follow the same degressive progress up to around 1.5 × 10⁵ cycles, followed by consecutive changes of the single crack developments to progressive progress. While the first tear occurs at 2.15 × 10⁵ cycles in the rear sheet, the fourth tear (now in the front sheet) occurs at 5.1 × 10⁵ cycles, with each of them visible in the measured electrical resistance. From the start of crack initiation up to the point before failure of the front aluminum sheet a change in resistance of around 130 µΩ is measured, which is significantly lower as in for contacting variant (i) and attributed to the parallel connection of the aluminum sheets using contacting variant (ii). After the failure of the rear aluminum sheet, an abrupt increase in measured electrical resistance occurs: The electrical current flowing on the rear side between the current in/out and the voltage measurement clamps is redirected through the voltage measurement clamps to the front and after passing the notched volume back to the rear again. The voltage dropping on the significantly higher resistive measurement clamps is the origin of the abrupt increase in measured electrical resistance. The abrupt increase is followed by a consistent change in electrical resistance, as was observed in the results related to Figure 8(b). Therefore, the monitoring of both aluminum sheets is possible using contacting variant (ii), but the measurement precision of the absolute change in resistance after aluminum sheet failure needs improvement. Constant amplitude test result for a 2/1 (GC) MB DH5 specimen, tested at a maximum stress of 125 MPa. Electrical resistance measured using contacting variant (ii). Selected states of crack growth are shown in the DIC deformation images.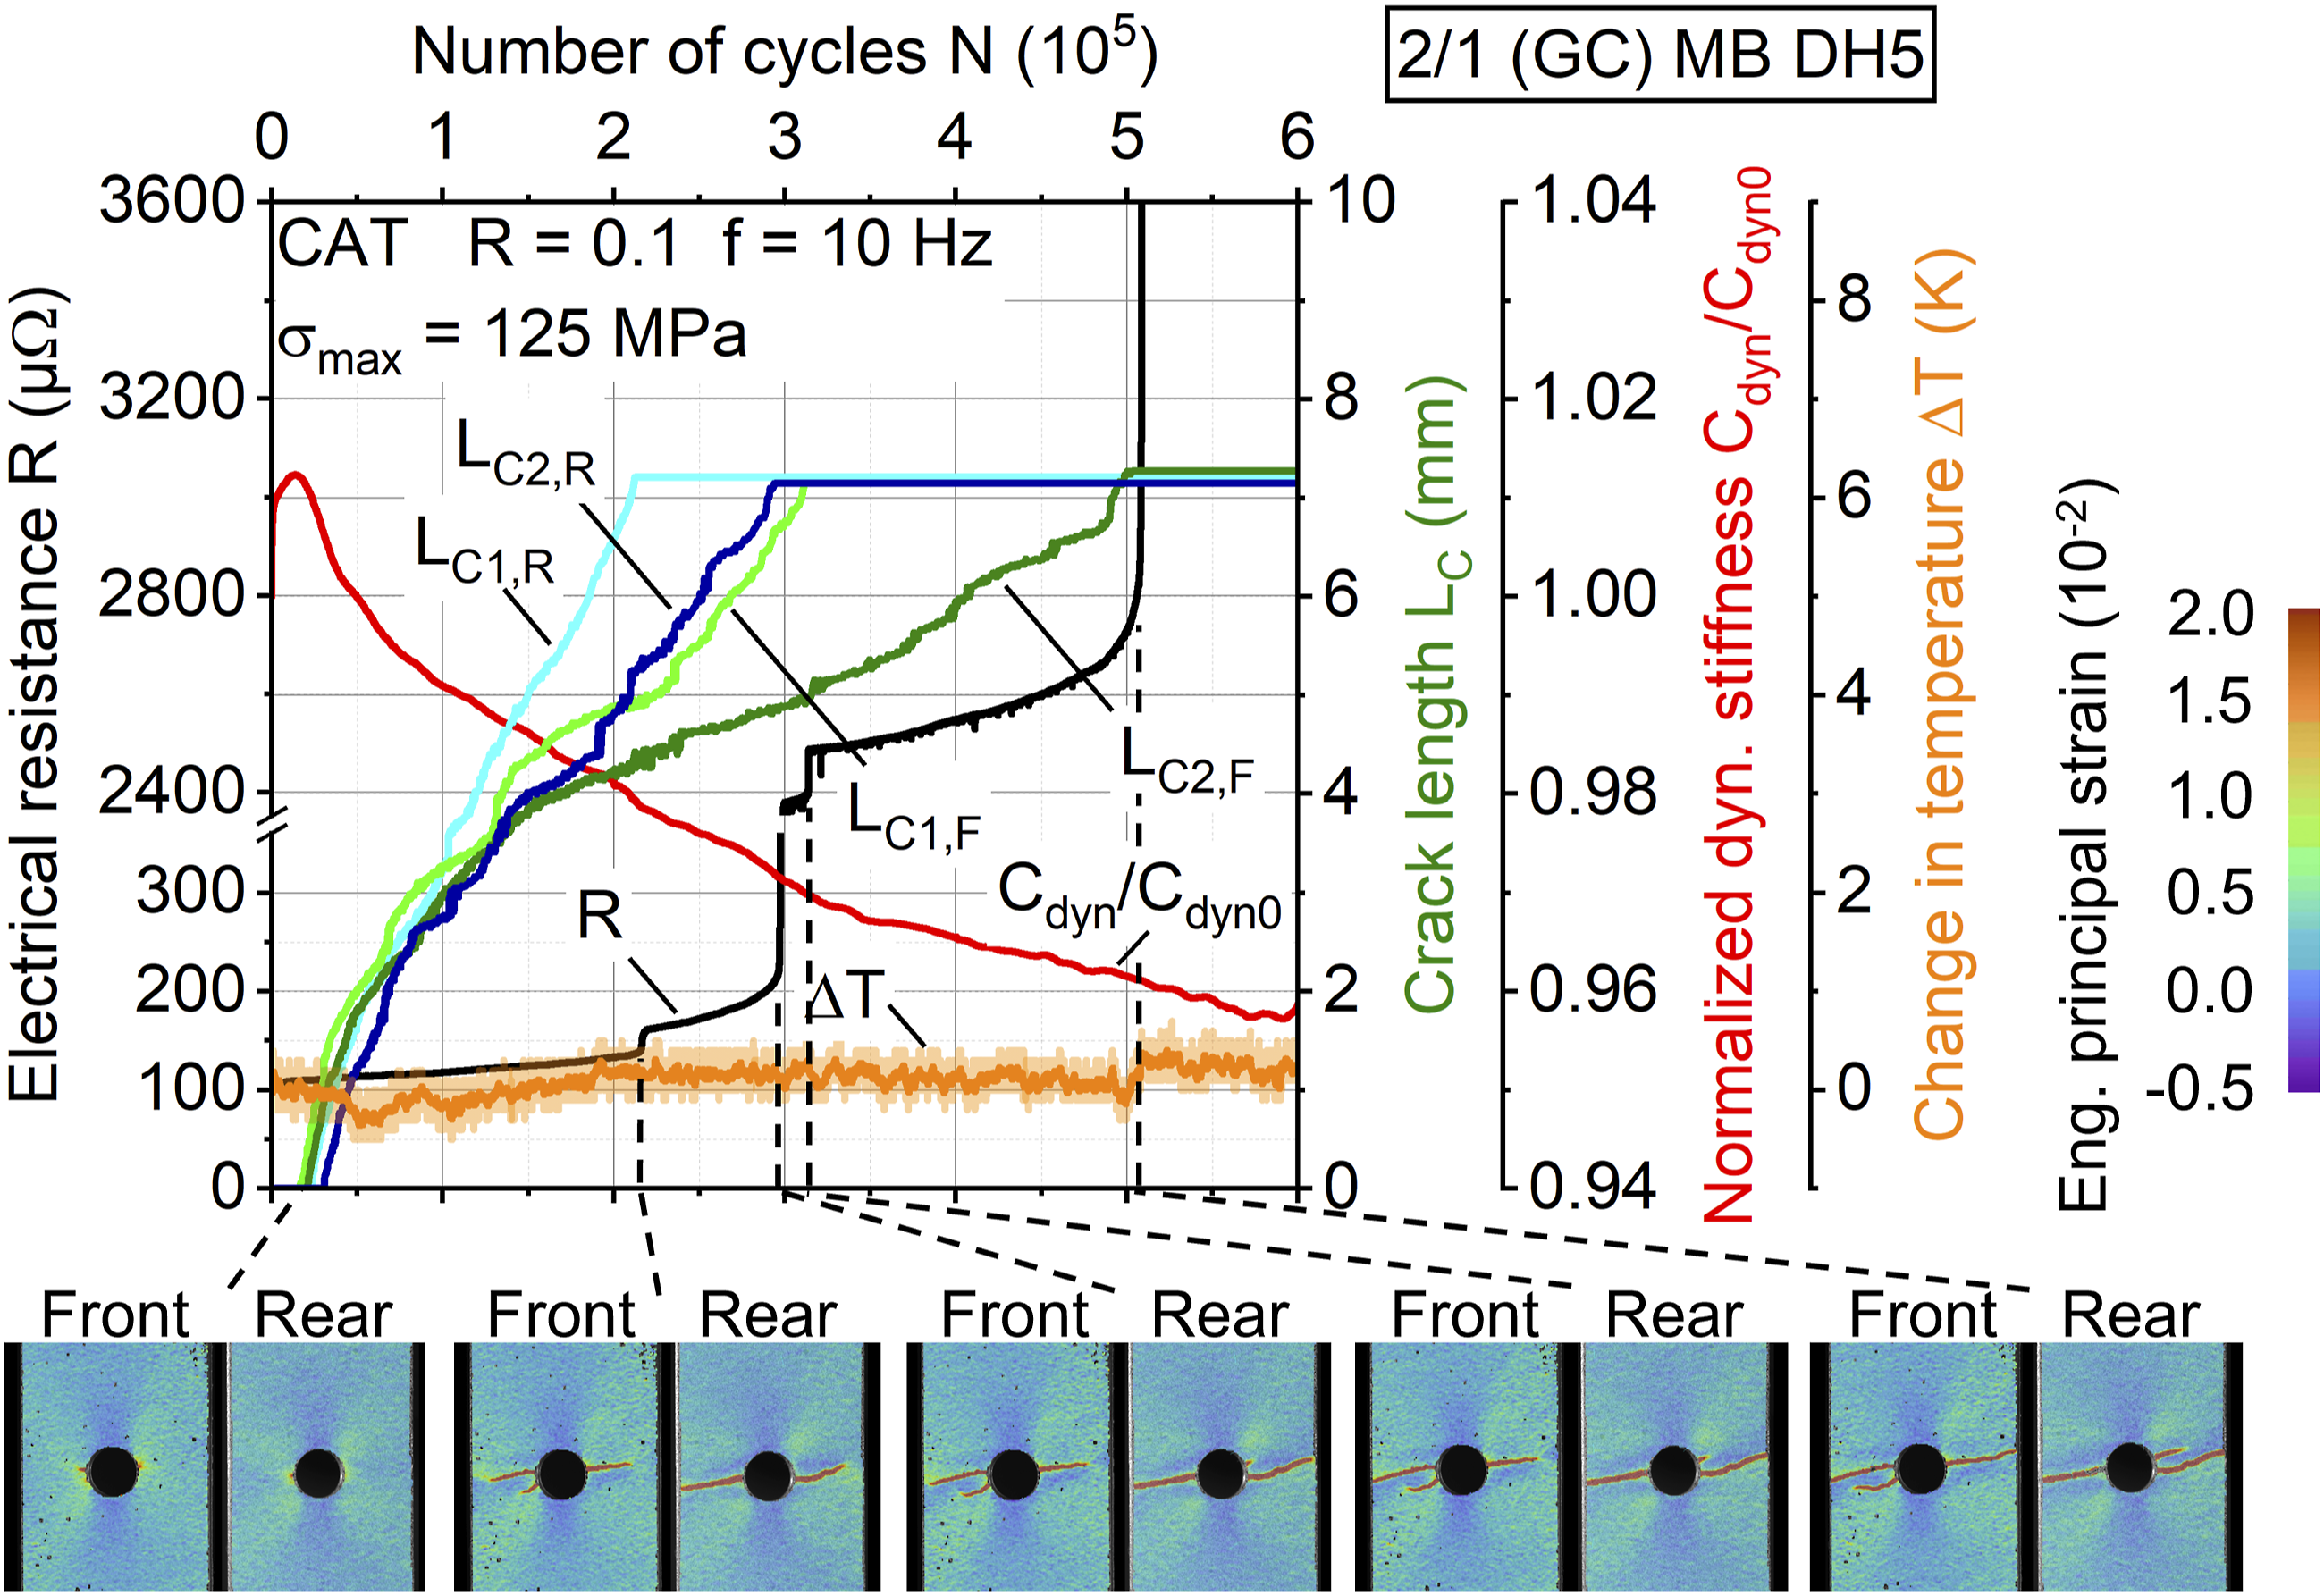
To conclude the monitoring possibilities of the laminate’s condition after the total tear of the aluminum sheets, the following CAT result of a 3/2 (GC) MB DH5 specimen using contacting variant (ii) (Figure 17) is discussed. Up to the point of the front and rear aluminum tear, the result is comparable to Figure 16. After this point, crack initiation and development continue in the aluminum sheets with ongoing load cycles (Figure 17, DIC images), as is evident through decreasing dynamic stiffness. Since the FML interfaces allow for distribution of the applied load over all laminate partners, even after aluminum sheet tear, the occurrence of further aluminum cracks appears rather than total delamination of the sheets, highlighting the good interface capabilities regarding stress transfer between the aluminum sheets and the FRP. Constant amplitude test result for a 3/2 (GC) MB DH5 specimen, tested at a maximum stress of 200 MPa. Electrical resistance measured using contacting variant (ii). Selected states of crack growth are shown in the DIC deformation images.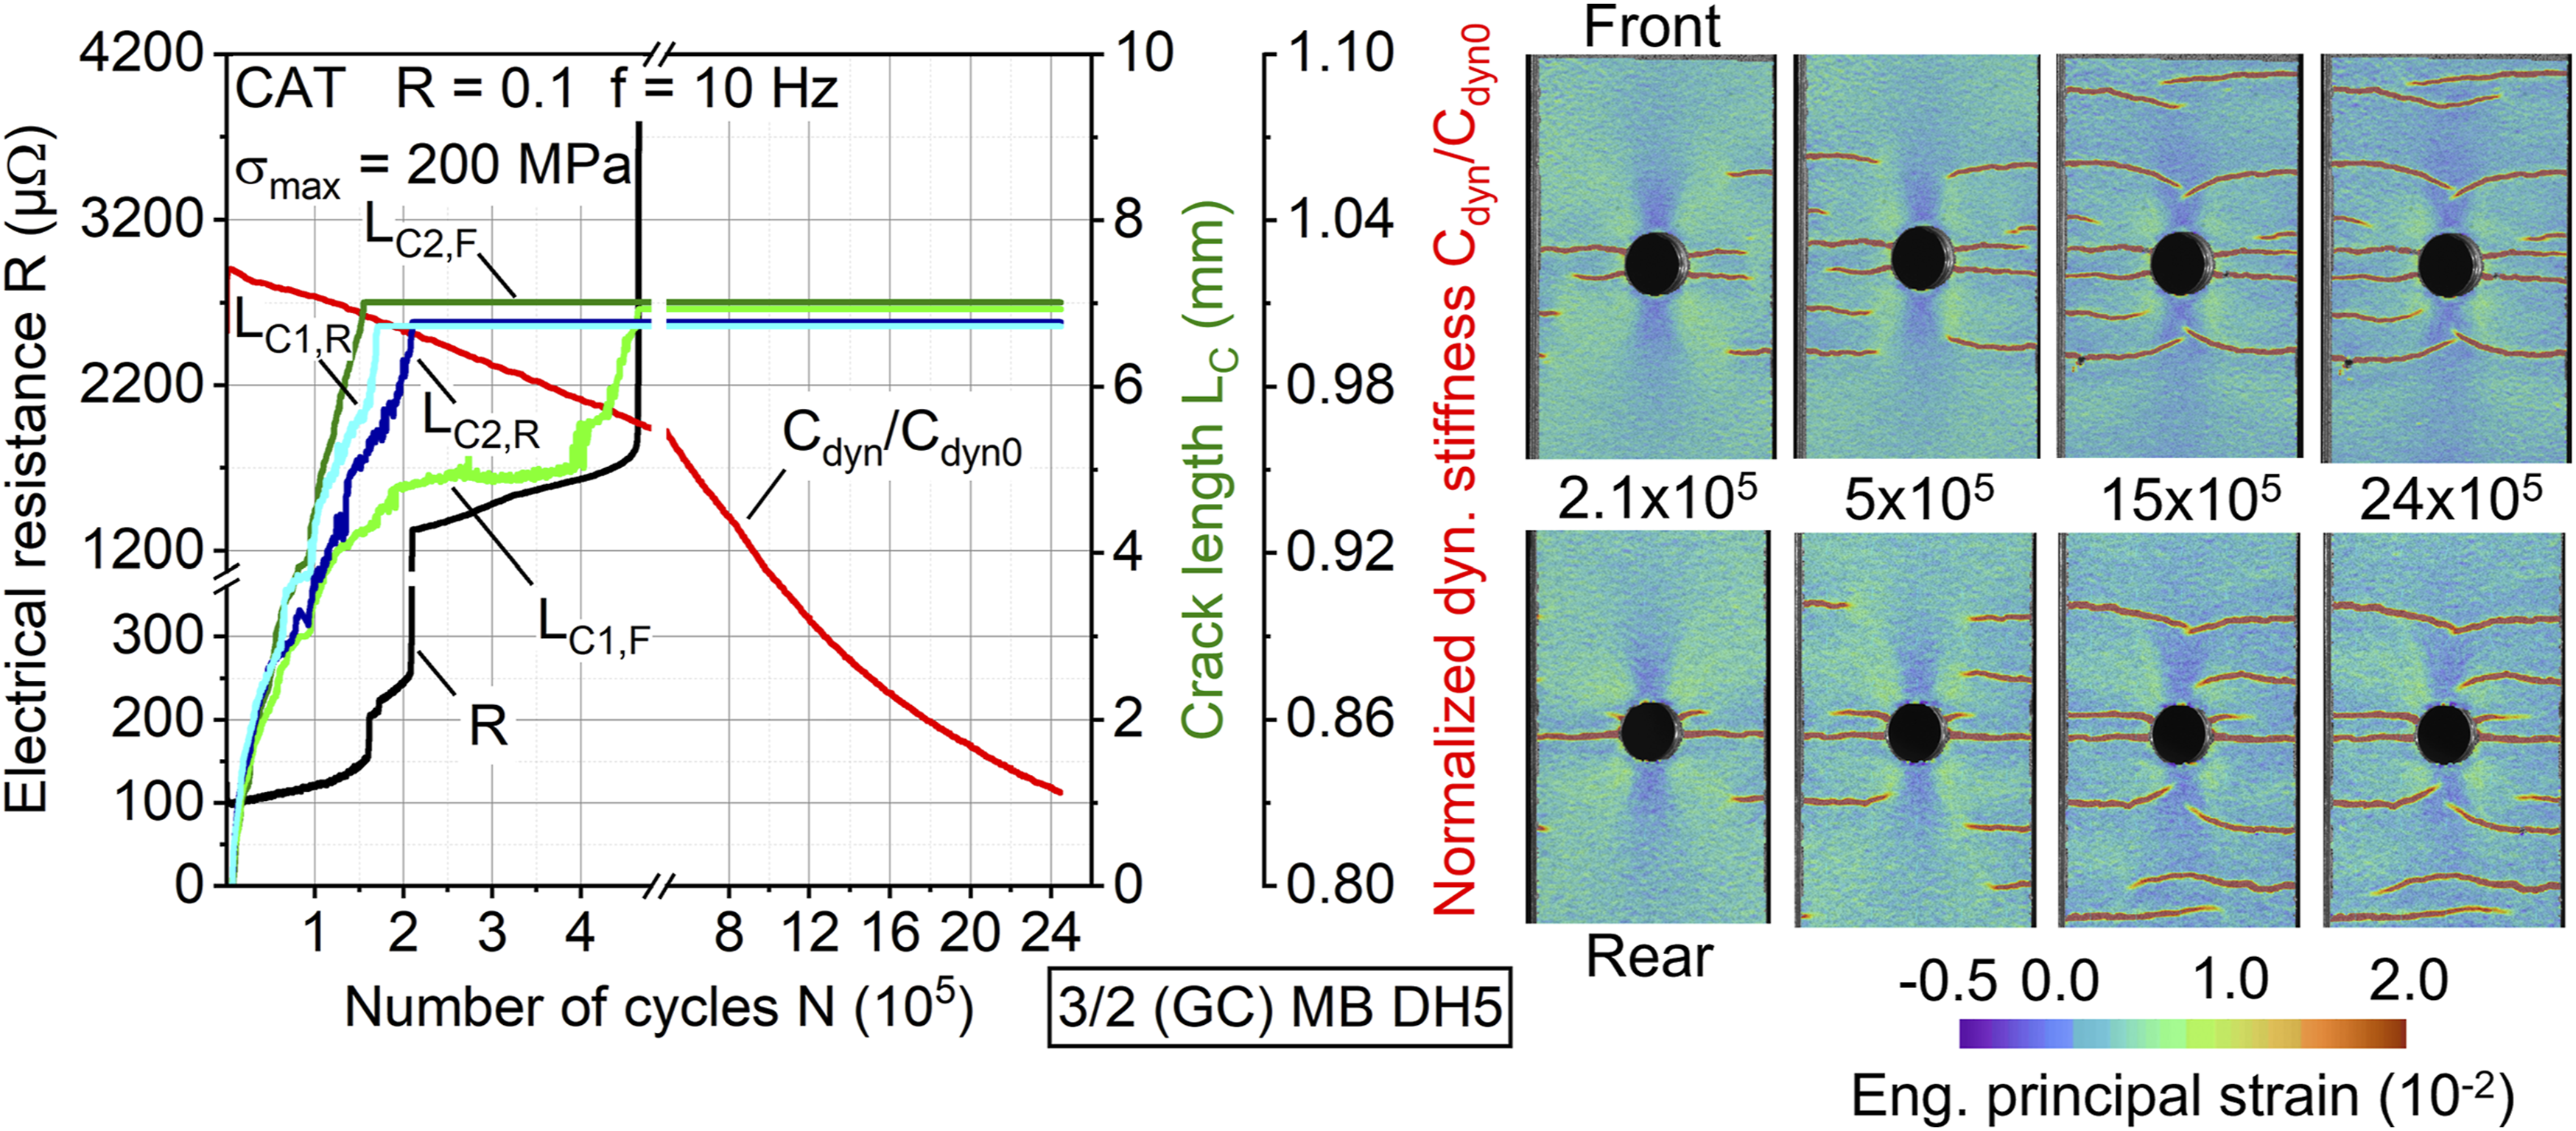
Considering the steeper decrease in stiffness after the aluminum front and rear sheet failure, it can be assumed that the central aluminum sheet cracks simultaneously or in the short term afterward. Figure 18 shows post-testing acquired CT image cross-sections of the aluminum sheets from the above-mentioned CAT specimen (maximum stress of 200 MPa) as well as a secondary specimen tested under maximum stress of 250 MPa. Overlays from the DIC images, where the maximum strain is displayed, were applied to the images to enable a comparison between the CT and DIC detected cracks, where a good accordance is present. The detected crack structure in the central aluminum sheet is comparable to the outer aluminum layers, which indicates that the crack development is similar in all aluminum layers and therefore the used methodology is applicable to the investigated structures. With regard to condition monitoring and lifetime prediction, precise investigation of the damage evolution should be possible using intermittent in situ CT testing methods
42
to determine the damage states at e.g., defined crack lengths. Computed tomography scan cross-section images of the constant amplitude tested 3/2 (GC) MB DH5 specimen’s (maximum stress of 200 MPa, after 24.5 × 10⁵ cycles, and 250 MPa after 24.6 × 10⁵ cycles) front, rear, and center aluminum sheets. DIC deformation images showing the maximum strain overlaid for front and rear to illustrate the detectability of the cracks.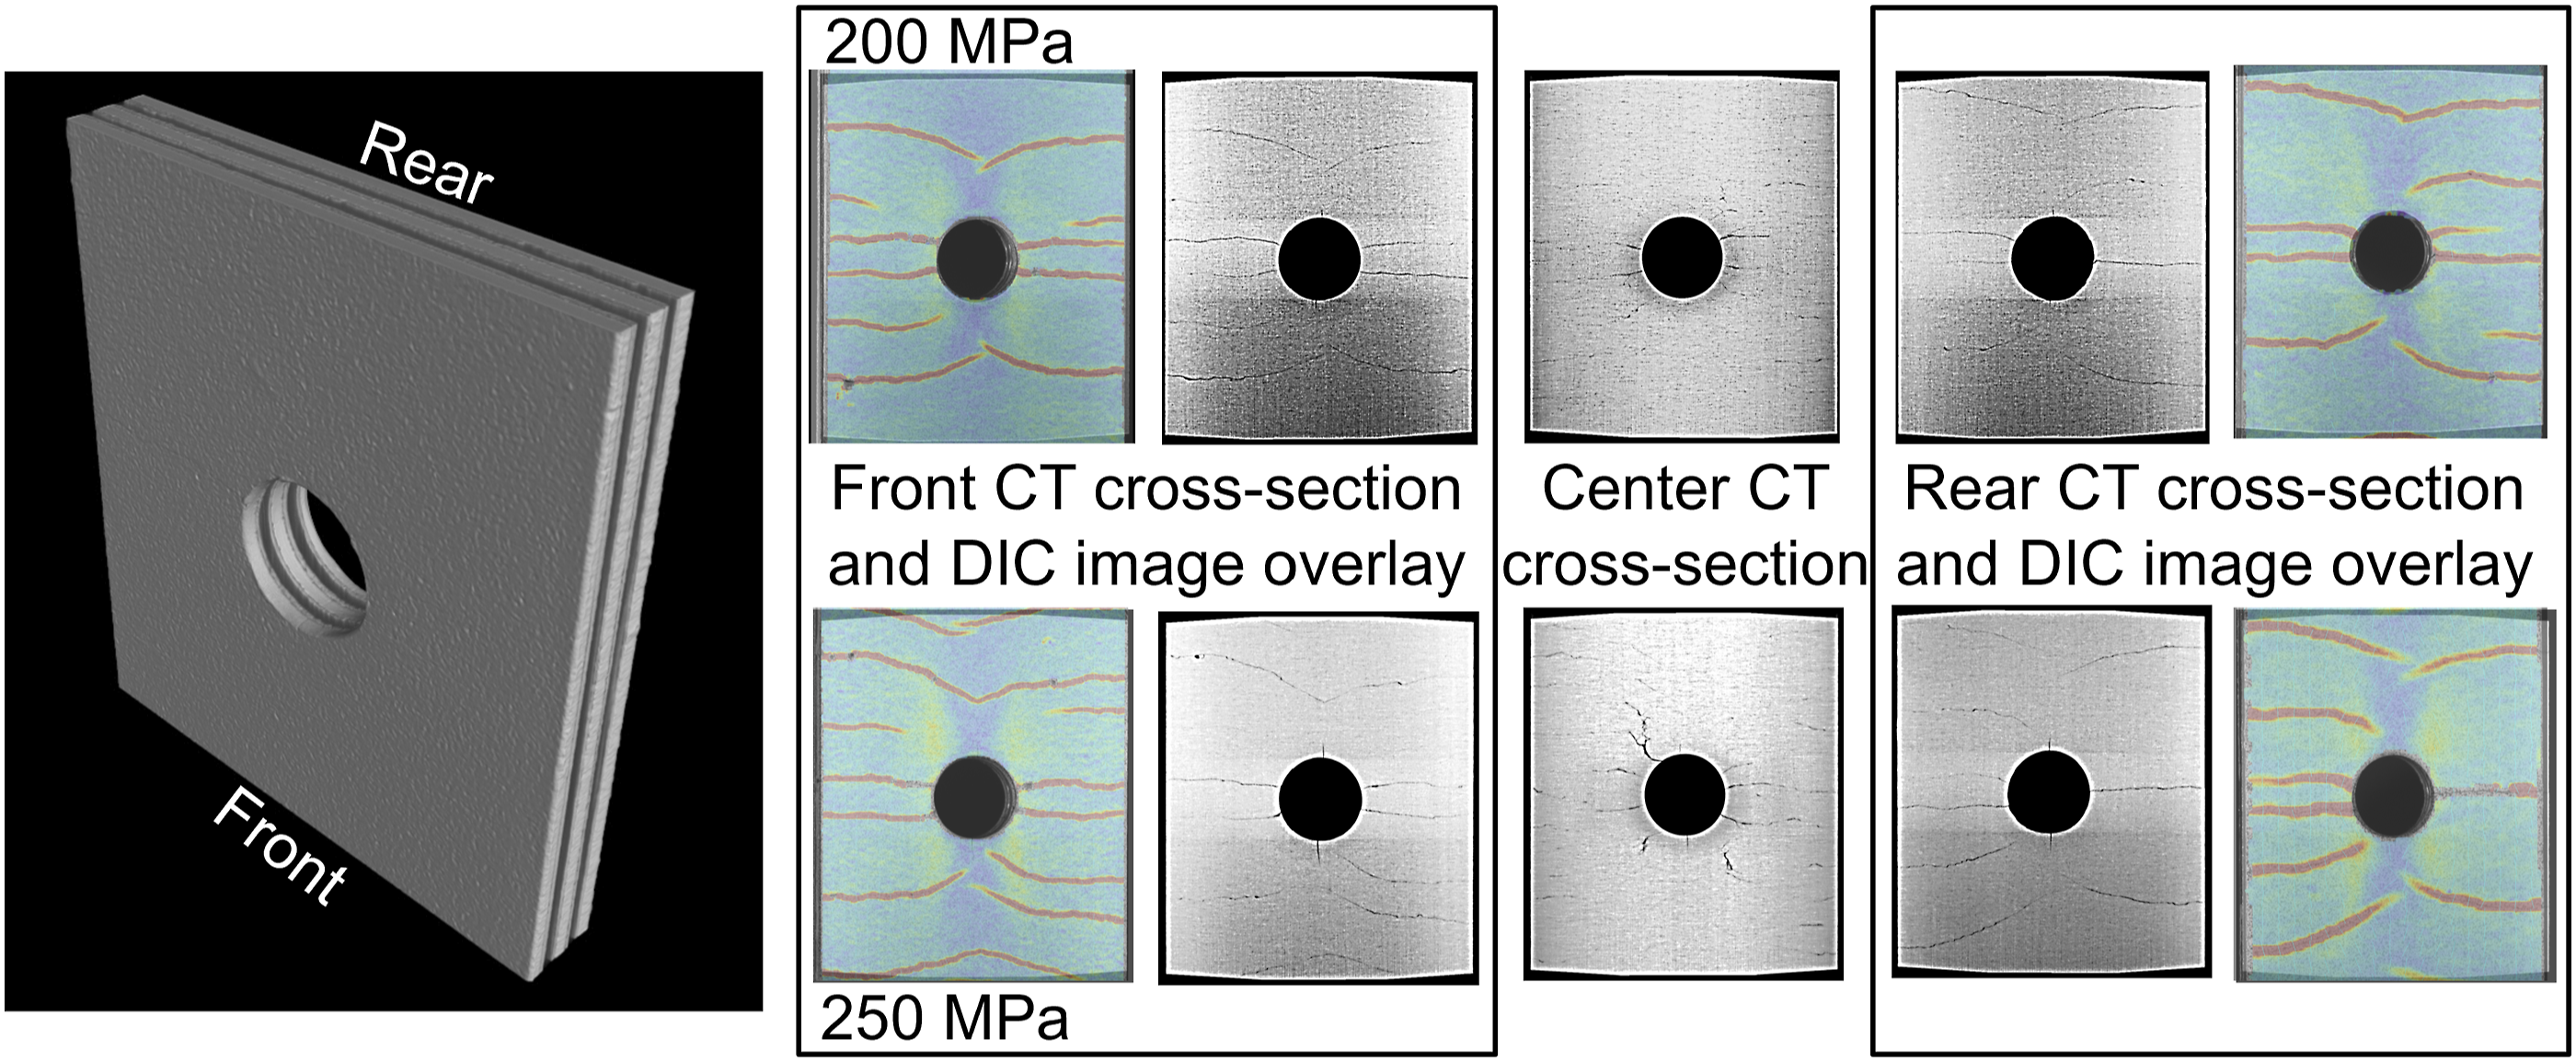
Applicability for different aluminum surface treatments and notch geometries
Aluminum surface treatments, like anodization, lead to an electrically isolated surface, impeding the electrical connection. Therefore, local removal of the oxide layer in the connection area is necessary to enable electrical conductivity to the measurement system. The local removal was executed by grinding the anodized layer, down to the aluminum. This did not impact the crack initiation results, since in all conducted fatigue tests the crack initiation took place in the area at and close to the notch geometry. As shown exemplarily in Figure 19 for contacting variant (i), the detectability of cracks in the front aluminum surface sheets for both materials is comparable, with anodized showing a longer duration in crack growth until the tear of the first of both sides. With anodization, a smoother crack appearance compared to MB is visible, similar to cracks in a ceramic material. The MB-treated aluminum sheets lead to an earlier onset of multiple crack initiations (Figure 19, DIC images), especially in the notch-affected area, which could be attributed to the overall higher roughness of the surface. As expected from the preliminary resistance measurements for MB and AN, the measured initial electrical resistance is comparable. Constant amplitude test results for 2/1 (GC) MB and AN DEN5 specimens, tested at maximum stress of 150 MPa. Electrical resistance measured using contacting variant (i). Selected states of crack growth are shown in the DIC deformation images.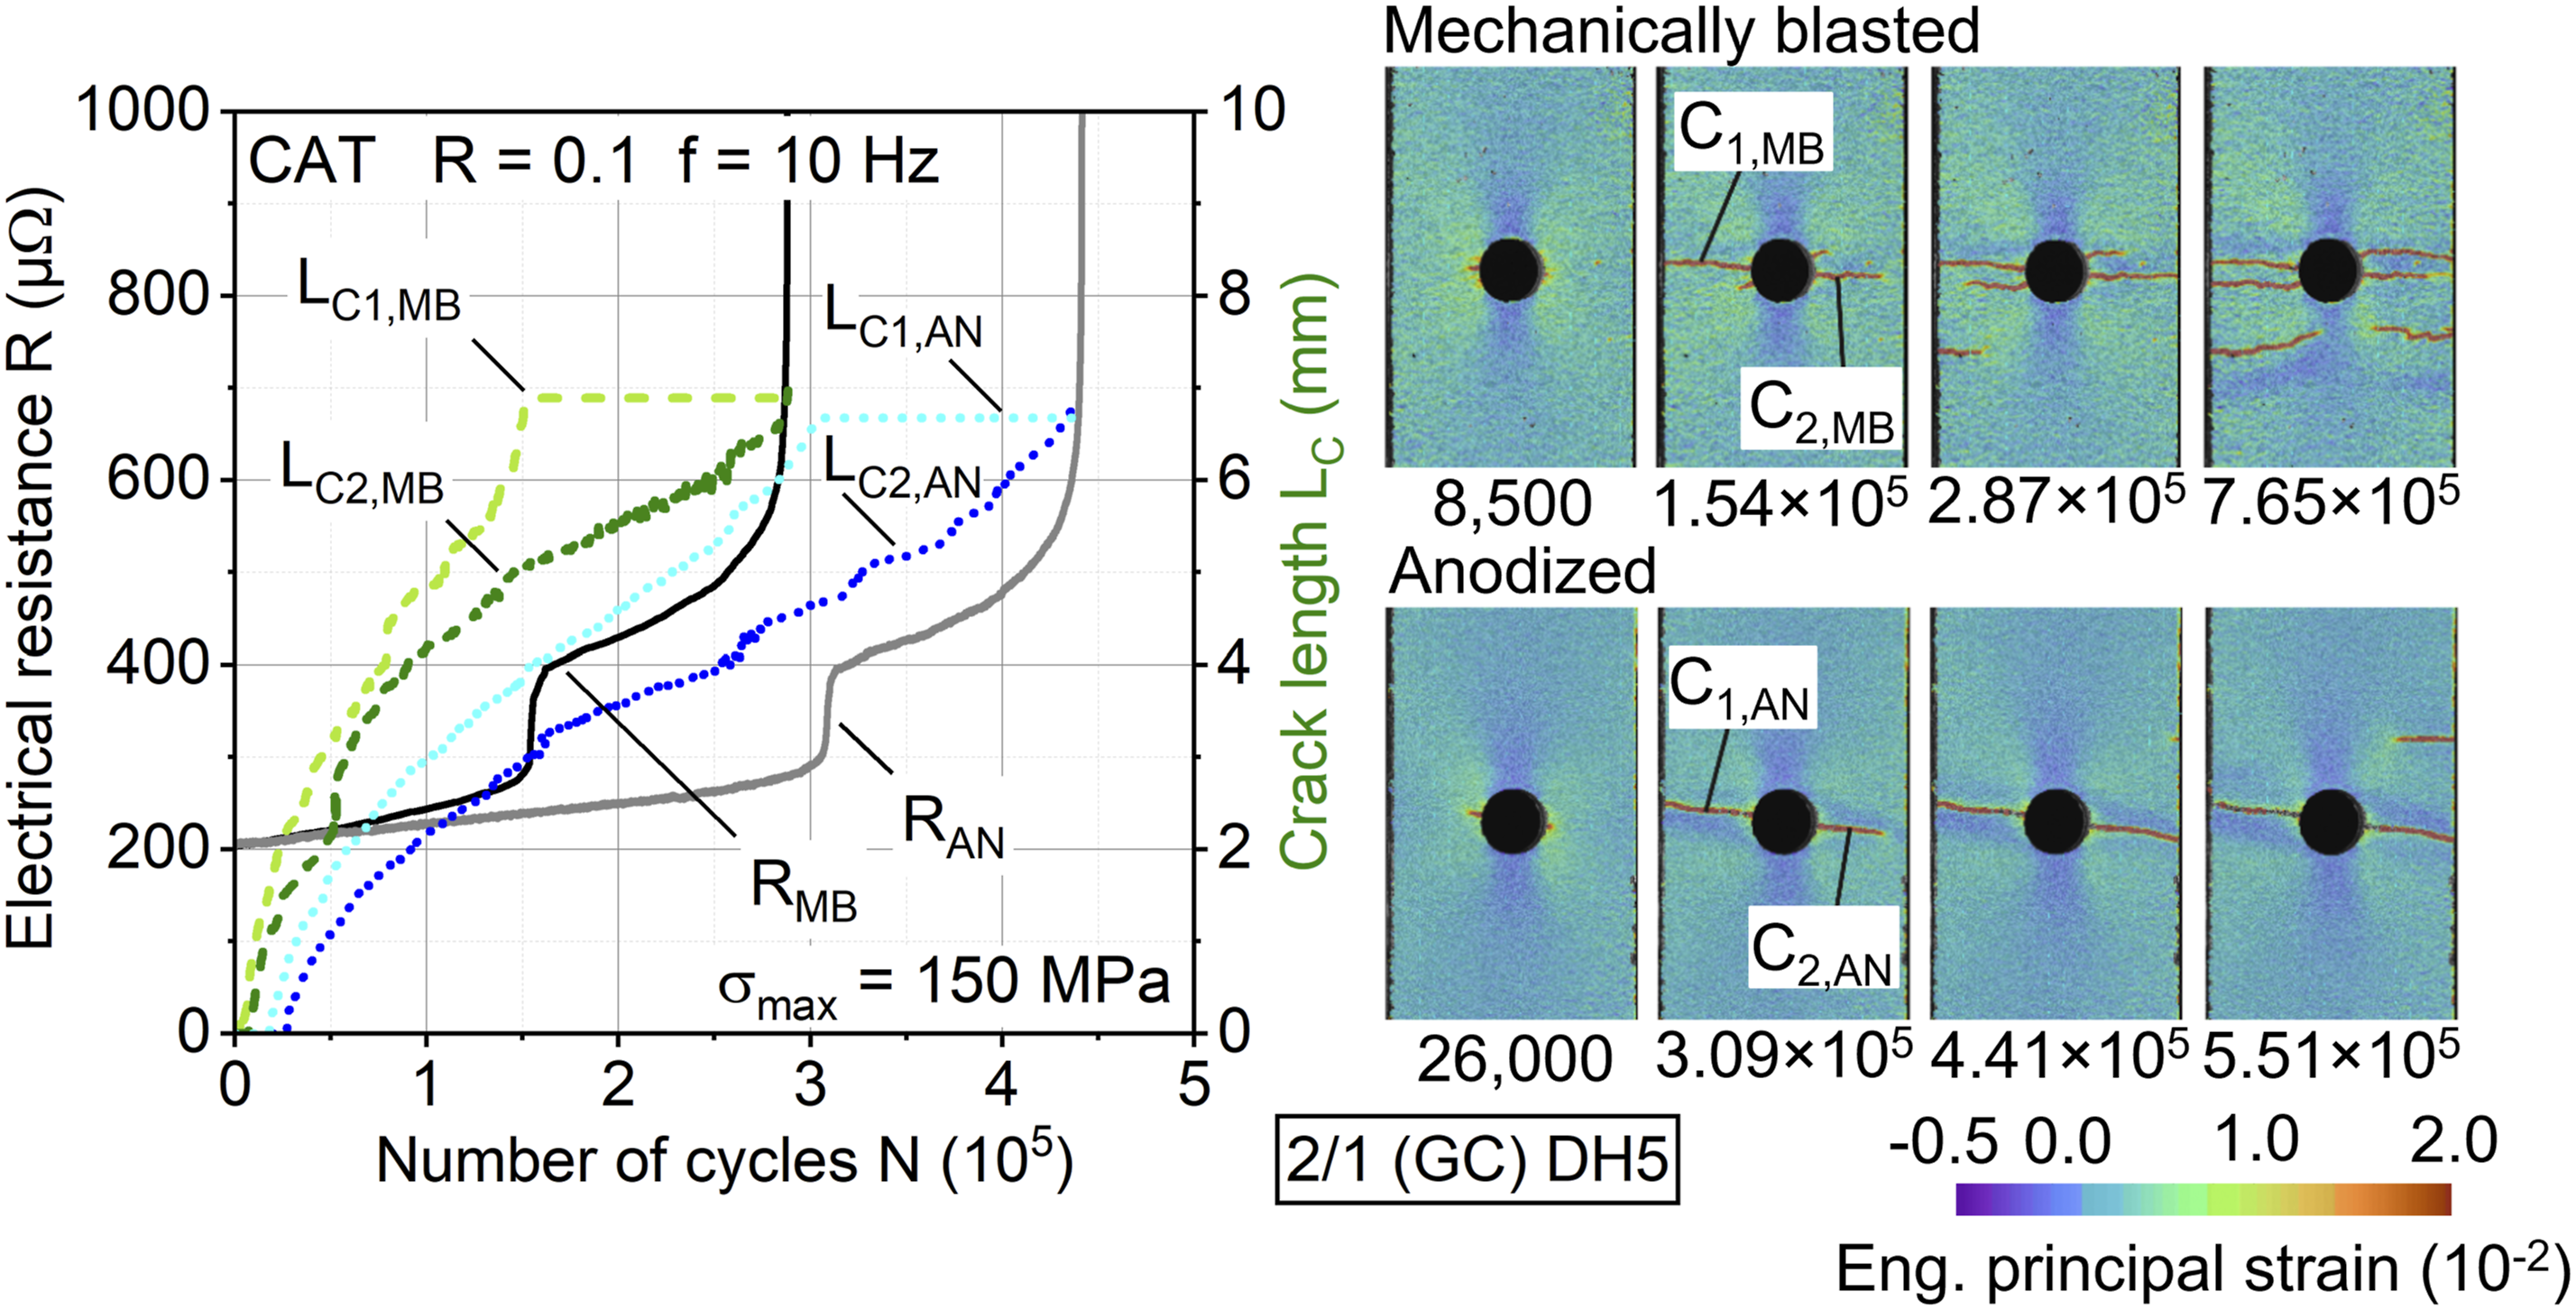
But also, the influence of notch geometry has to be taken into account when considering the applied measurement techniques, since it can affect the measurements immensely, which is illustrated in Figure 20. As far as cracks initiate and develop perpendicular to the applied load, the change in resistance is occurring as expected. When cracks pass each other, for example, due to lower maximum stress (here 100 instead of 150 MPa) where crack closure does not necessarily occur (which was observed for both MB as well as AN), the change in resistance takes a different course. This can especially be tricky when using a parallel connection variant like (ii) since the measured value does not indicate whether one side has torn or not. Constant amplitude test results for 2/1 (GC) MB and AN DEN5 specimens, tested at maximum stress of 150 and 100 MPa. Electrical resistance measured using contacting variant (i). Selected states of crack growth are shown in the DIC deformation images.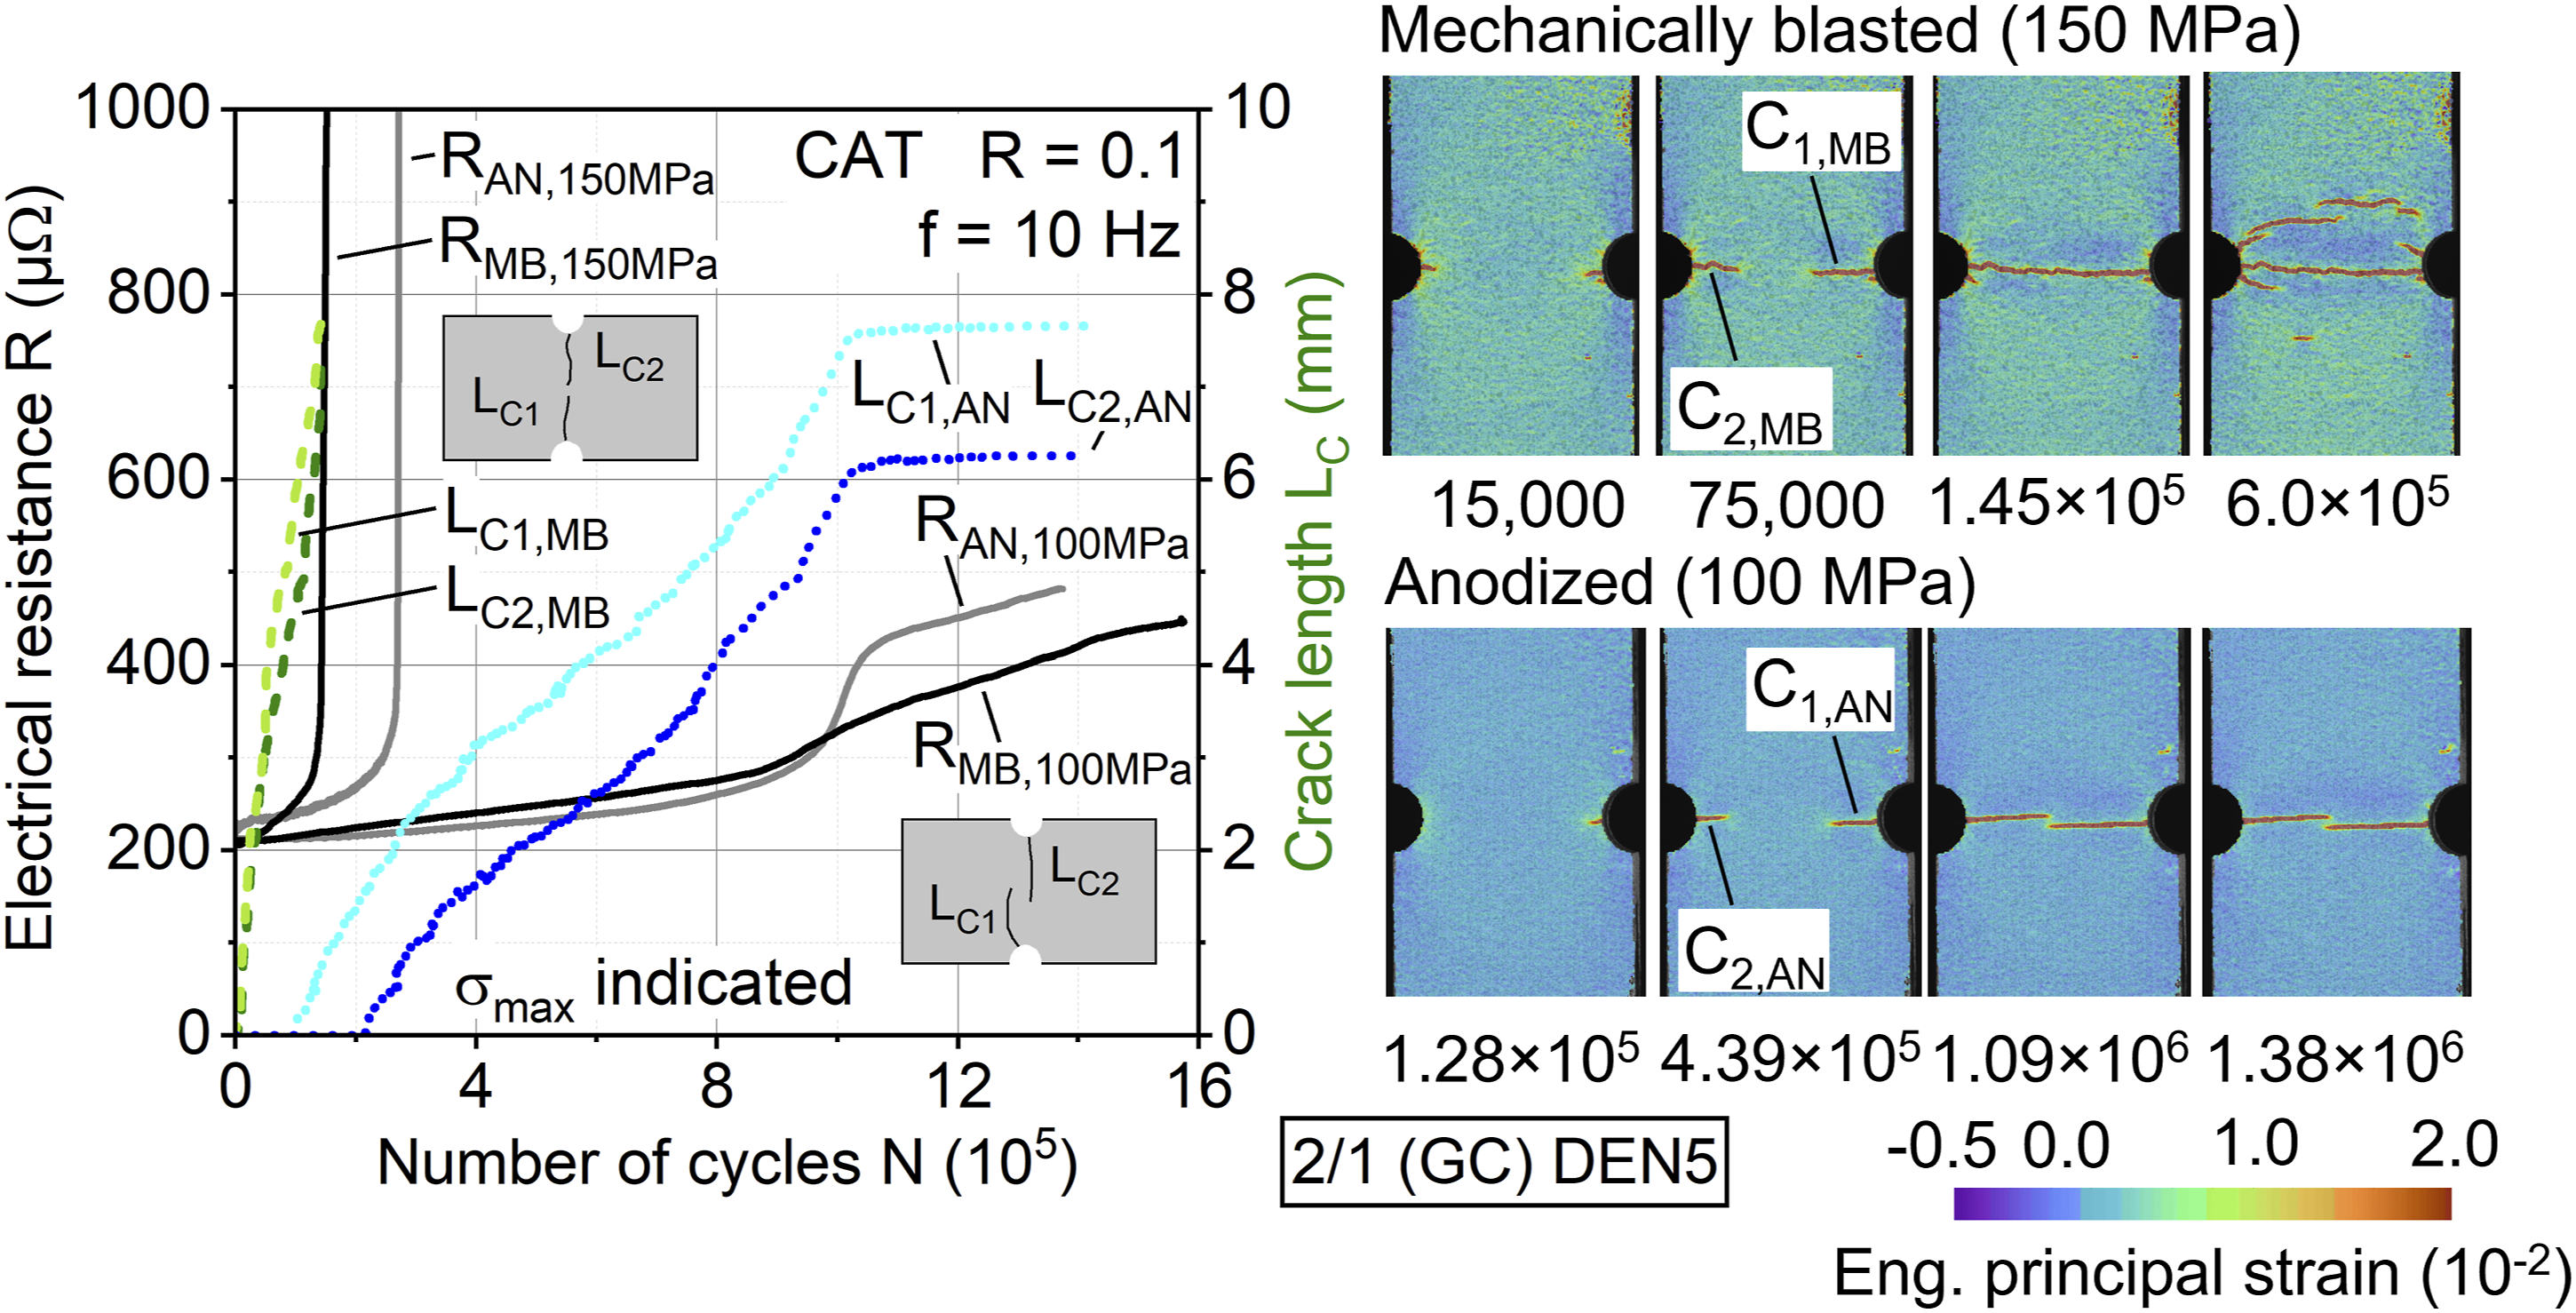
The following results regarding crack initiation time and fatigue life until total tear of the aluminum sheets, illustrated for the FML configurations 2/1 (GC) and 3/2 (GC) with MB-treated aluminum sheets, were determined for both notch geometries using electrical resistance measurement and DIC (Figure 21). In addition, exemplary data points for an MB-treated aluminum sheet with a DH5 notch are embedded for comparison of its standalone performance to the FML. The fatigue test on the aluminum sheet was executed strain-controlled at strains related to the occurring strains in the FML at equivalent applied maximum stress to ensure comparability. Crack initiation time and lifetime until total tear of the aluminum sheets for the hybrid FML 2/1 (GC) and 3/2 (GC) with MB-treated aluminum sheets and notch geometries DH5 (a) and DEN5 (b). Exemplary data points for an MB-treated aluminum sheet with DH5 notch embedded for comparison. Top graph legends of (a) and (b) are valid for both.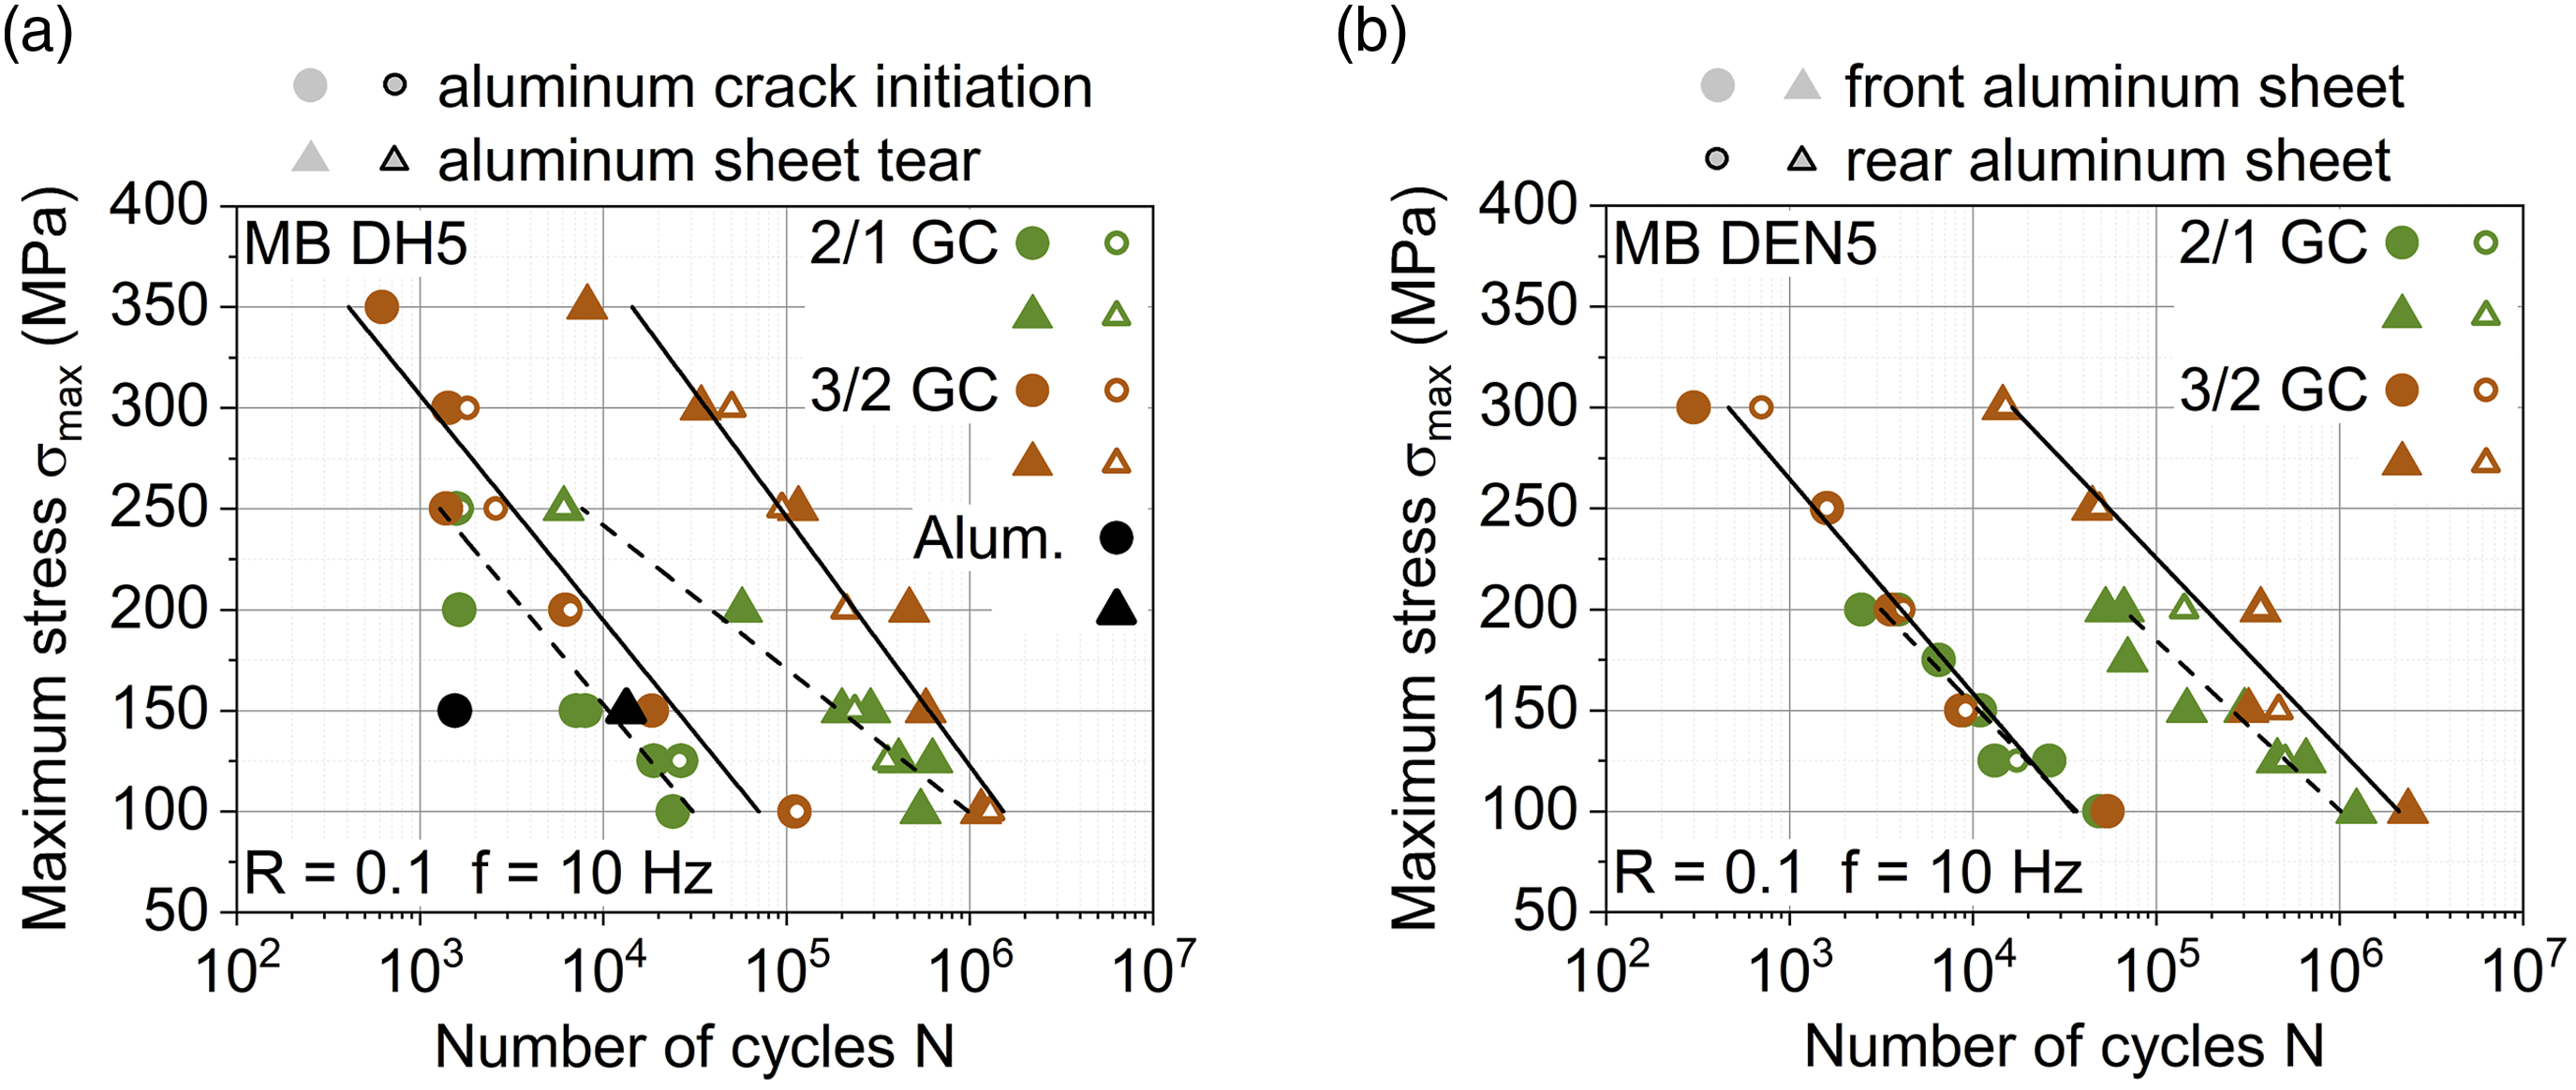
The shown data contains results from measurements using contacting variants (i) and (ii). For detection of first crack initiation, the dynamic stiffness decrease and electrical resistance increase are more viable due to DIC analysis limitations. These include spray pattern quality, especially at the edges as well as its software recognizability, leading to possible errors regarding detection precision. Monitoring of the crack growth, on the other hand, is more precise using DIC analysis, since it enables observation of any local crack formation, rather than the total, which especially for DEN5 is superior and needed to determine when the aluminum cracks reach or surpass each other. If they surpass each other, the number of cycles at the time of surpassing is recorded as the time of the tear. The lifetimes until crack initiation and tear of the aluminum sheets are shown as circles and triangles in Figure 21. In general, this thermoplastic-based laminate proves its validity for fatigue applications, when considering the difference in performance to the standalone aluminum sheet, at, e.g., an applied maximum stress of 150 MPa. The laminate significantly slows down crack development in the aluminum and also allows loads to be applied above the tensile strength of the investigated aluminum (approx. 190 MPa). The lifetime of the FML until aluminum crack initiation is within a 10% window of the lifetime until the tearing of the sheet across the investigated loads, enabling a sufficient timeframe for condition monitoring. Correlating to the ultimate fatigue lifetime of the total laminate 36 , the tear of the aluminum sheets occurs in general later for 3/2 (GC) MB than for 2/1 (GC) MB, leading to the conclusion of a higher aluminum lifetime with less MVF. This is contradictory to the observations of 15 on aluminum/GFRP-based laminates with similar configurations, where at higher loads the 2/1 configuration yields later aluminum tear than 3/2.
The tear of the outer aluminum sheets can occur non-simultaneously, even if in close succession, as is shown by the filled and unfilled data points. While12,26 have shown that the inner layers of FML can show a later crack development, this is new for the outer layers. Here, production-related, different residual stress states in the sheets and resulting interfacial residual stress are assumed to be the cause, which is an aspect to be investigated in-depth in future investigations. Considering the notch geometries, 3/2 (GC) MB seems to be more affected by DEN5, since the crack initiation, as well as the tear of the aluminum sheets, is reduced especially at higher loads compared to DH5.
Considering also the crack growth rate, shown exemplarily for 2/1 (GC) MB with DH5 (circles) or DEN5 (triangles) in Figure 22, the achieved performance can compete with established thermoset-based laminates.4,11,27 For maximum stresses below 150 MPa the crack growth rate significantly decreases, showing also predominantly continuous reduction of crack growth rate along the crack length. Again, compared to a monolithic aluminum sheet (blue filled in dots), the evolution of decreasing crack growth rate is superior and suitable for monitored long-term usage. DIC measured crack growth rate for hybrid FML 2/1 (GC) with MB-treated aluminum sheets and notch geometries DH5 and DEN5. For comparison exemplary data points of an MB-treated aluminum sheet with a DH5 notch are embedded. Data points plotted were measured until multiple cracks develop in a hybrid FML or before the total failure of a standalone aluminum sheet. (a) Linear, and (b) logarithmic scaling of crack growth rate.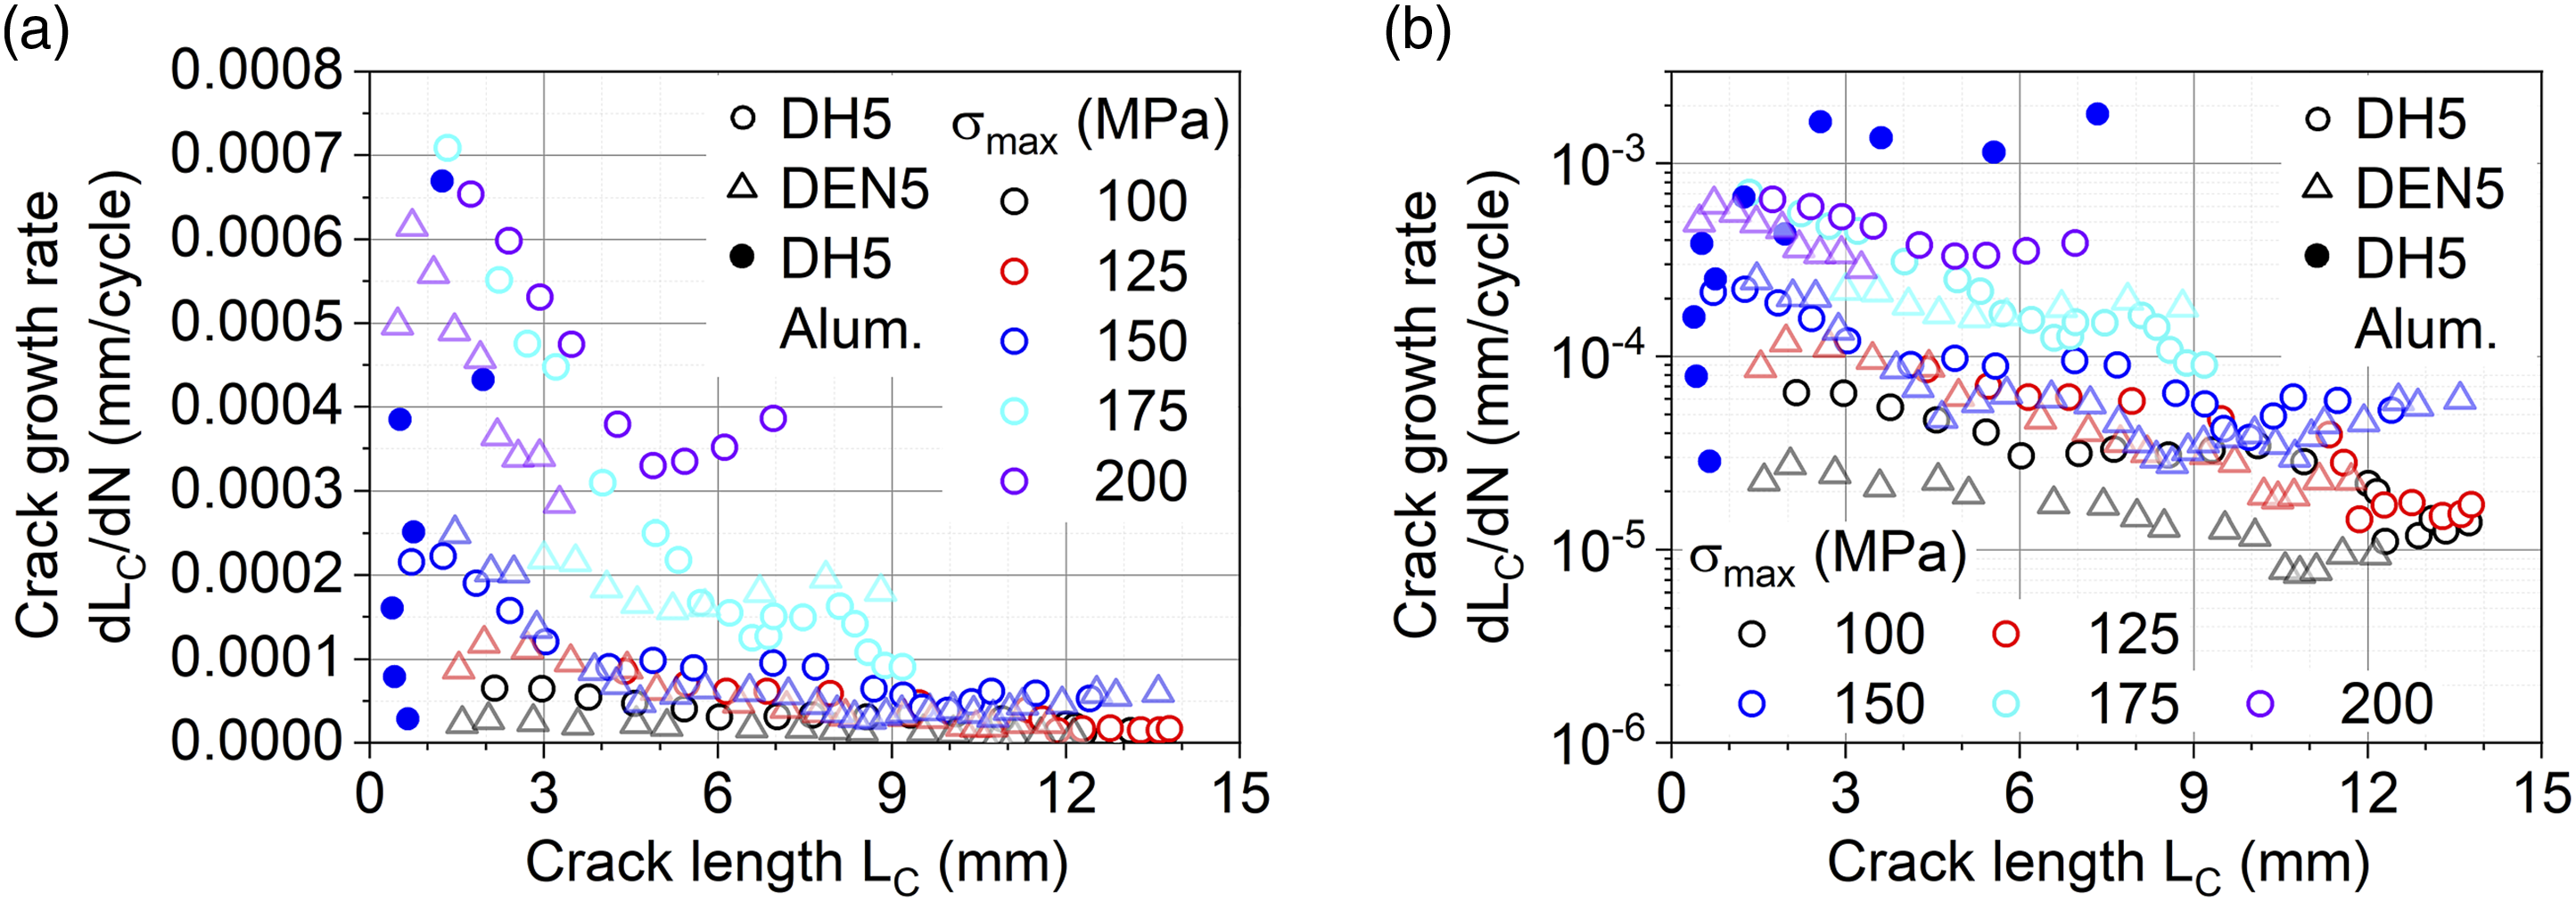
Conclusions and outlook
In this study, the applicability of electrical resistance and optical deformation measurement for condition monitoring of notched thermoplastic-based hybrid fiber metal laminates made of aluminum alloy AA6082-T4 and unidirectional GFRP and CFRP was evaluated.
At first, the general electrical resistance behavior of the aluminum sheets was evaluated in terms of crack-induced cross-section reduction and temperature dependency, on which basis expected changes in electrical resistance were identified. Cross-section reduction proved to have the most significant impact, while the change in temperature should be avoided to detect crack initiations properly, e.g. using testing frequency adjustment. The crack development and therefore cross-section reduction needs to be taken into account since it changes the distribution of the electrical current and therefore measured electrical resistance.
The condition monitoring investigations during fatigue testing were conducted using two different contacting variants, which were used for electrical resistance measurement of only a single (front) aluminum sheet or simultaneously the front and rear aluminum sheet. Using the single aluminum sheet measurement results comparable to investigations within the state of the art were observed, as long as cracks develop as intended by the notch. Deviations from known developments regarding the electrical resistance measurements emerged, when partial aluminum sheet separation occurred, which led to changed distributions of the electrical current within the measured volume and therefore changed voltage drop. Also, higher levels of mechanical loads on the specimens, which led to multiple crack initiations, impacted the change in electrical resistance significantly. Nevertheless, the digital image correlation acquired crack lengths were correlated to the change in electrical resistance, showing that monitoring of the aluminum sheet condition solely via electrical resistance measurement is possible under consideration of the above-mentioned phenomena. In terms of multiple sheet measurement (e.g. front and rear aluminum sheets) this is not the case for laminates where the crack propagation of all aluminum sheets is not completely simultaneous but occurs with a delay, since deviations can occur due to the simultaneous measurement of both sheets. Then the combined use of electrical resistance measurement and digital image correlation is ideal, complementing each other for precise detection of crack initiation and tear through the electrical resistance measurement, as well as reliable monitoring of crack evolution through DIC. Therefore, electrical resistance measurement and digital image correlation highly improve the condition monitoring compared to the sole recording of e.g. stiffness. Although the latter pinpoints at the time of the first crack initiation, there is no possibility of judgment about the actual laminates state in terms of crack evolution without the former mentioned.
For the two investigated notch geometries differences and limits in terms of monitorability as well as the impact on fatigue life of the aluminum sheets were determined. In principle, crack initiation and evolution are similar for both notch geometries, but for the applied double-edge notches cracks tend to pass each other, rather than connect. This leads to a different development of change in resistance and impedes monitorability with only electrical resistance measurement, limiting its use, while DIC on the other hand detects the cracks and displacement between them accurately. With regard to crack initiation time and fatigue life until the total tear of the aluminum sheets, it was found, that aluminum crack initiation is within a 10% window of the lifetime until the tearing of the sheet. The investigated 2/1 configuration with lower MVF performed better all in all but was affected more by the double-edge notch than the 3/2 configuration. The thermoplastic-based hybrid fiber metal laminate in general proved its validity for fatigue applications, enabling higher lifetimes at higher loads compared to monolithic aluminum and competing with established thermoset-based laminates in terms of crack growth rate.
Concerning future investigations, the monitoring of the carbon fibers after the failure of the aluminum sheets could be a promising option for condition monitoring of the whole laminate over its total fatigue life. Moreover, the application of individual current and voltage measurements for the aluminum sheets is needed to validate the achieved results and possibly reveal improvable aspects regarding the used contacting variants in this paper. In terms of the thermoplastic-based hybrid fiber metal laminate’s mechanical capabilities, decreasing the aluminum crack growth rate, e.g. through post-stretching and utilizing the elastic polyamide properties in the interface, as well as the crack growth under low and high ambient temperature and humidity are valuable aspects to be approached.
Footnotes
Acknowledgments
The authors would like to acknowledge Martin Risthaus from Evonic for providing surface treatment and Marco Fischer for supporting the experimental tests in Chemnitz.
Declaration of conflicting interests
The author(s) declared no potential conflicts of interest with respect to the research, authorship, and/or publication of this article.
Funding
The author(s) disclosed receipt of the following financial support for the research, authorship, and/or publication of this article: This work was supported by the German Research Foundation (Deutsche Forschungsgemeinschaft, DFG) within the research project “Mechanism-correlated characterization of the deformation and damage behavior of thermoplastic-based fiber metal laminates for property-oriented process development” (project no. 414332488).