
Abstract
For predicting the strain rate dependent failure of short fiber reinforced plastics (SFRP) a two-phase simulation model is developed using the finite element method and comparing the results to microscopic specimen tests for uniaxial tension under quasi-static (0.007/s) and dynamic loads (250/s). Experimentally the failure behavior of SFRP is observed to be strain rate dependent. The global strain at failure and the absorbed energy increase with strain rate. Moreover, locally an influence of the strain rate on the amount of material involved in the deformation can be observed. The suggested model can represent these effects accurately. Also, the present micro-mechanical effects and their influence on the strain distribution are investigated by unit cell simulations. Thereby the material model of the fibers, the matrix, and the boundary layer are varied respectively. These reveal the important role of strain rate dependent decohesion leading to a correct representation of the plastically deformed volume. Consequently, the distortion energy density is evaluated and is found to be constant at failure for all strain rates.
Introduction
For many years the application of fiber reinforced plastics is experiencing a continuous growth in industrial areas like automotive, railway and aviation. This is due to its great lightweight properties and manufacturing flexibility.1,2 Its superior energy absorption in relation to the weight has a major impact on its increasing role in safety relevant components in particular.3,4 As the prediction of material failure is vital in these industries in the designing process numerical simulation is established as an invaluable tool. But up to now for short fiber reinforced plastics (SFRP) neither are the underlying microscopic mechanism leading to failure understood nor can these mechanisms be modeled. This will be shown in the subsequent paragraphs followed by a description of recent microscopic experiment on SFRP which were the main motivation for this paper.
This study is focused on injection molded components with glass fiber reinforced polypropylene containing a fiber mass fraction of 30% (PP-GF30). But the presented results can be transferred to other short fiber reinforced plastics (SFRP) with similar decohesion behavior, as discussed below. Their mechanical behavior is strongly driven by the fiber orientation, 5 and density, 6 which varies locally based on flow conditions in the molding process.7–9 The elasticity and plasticity show a distinct anisotropy and are dependent on the applied strain rate.10–14 Furthermore, a significant influence of the stress state can be observed on deformation and failure alike.12,15–19
To predict the linear and nonlinear material stress response to applied deformations, finite element method (FEM) simulations on representative unit cells is a highly efficient solution for non-homogeneous material like SFRP and has proven to be accurate and predictive.20,21 It is not only possible to model the effective stiffness in dependence of fiber length, orientation, and volume density,22–27 but also plasticity properties for the composite as yield strength and flow curves can be calculated with such a numerical approach.28,29 Signally Bourgogne et al. 30 found for Polyphenylene Sulfide with 40% of short glass fibers (PPS GF40) a deviation in the matrix behavior of their unit cell simulation with the experiments and adjusted it by including fiber matrix decohesion, but only for quasi-static loading.
While the cited studies represent the advances in modeling the deformation over the last years, predicting the failure is still a major challenge, especially as underlying microscopic interactions must be understood and captured in a predictive finite element model. 4 Fliegener et al. 31 present a FE model for SFRP including an elasto-plastic model for the matrix, fiber-matrix decohesion and brittle fiber failure, predicting the quasi-static failure accurately. But no strain rate effects are considered. Okabe et al. 32 simulated unit cells modeling the strain rate dependent failure of composites with different fiber lengths but restricted to a uni-directional fiber distribution. And notably the models did not include any boundary layer behavior to account for decohesion between fiber and matrix. This exemplary list reveals a gap in the literature for unit cell-modeling of the strain rate dependent failure of SFRP with misaligned fibers.
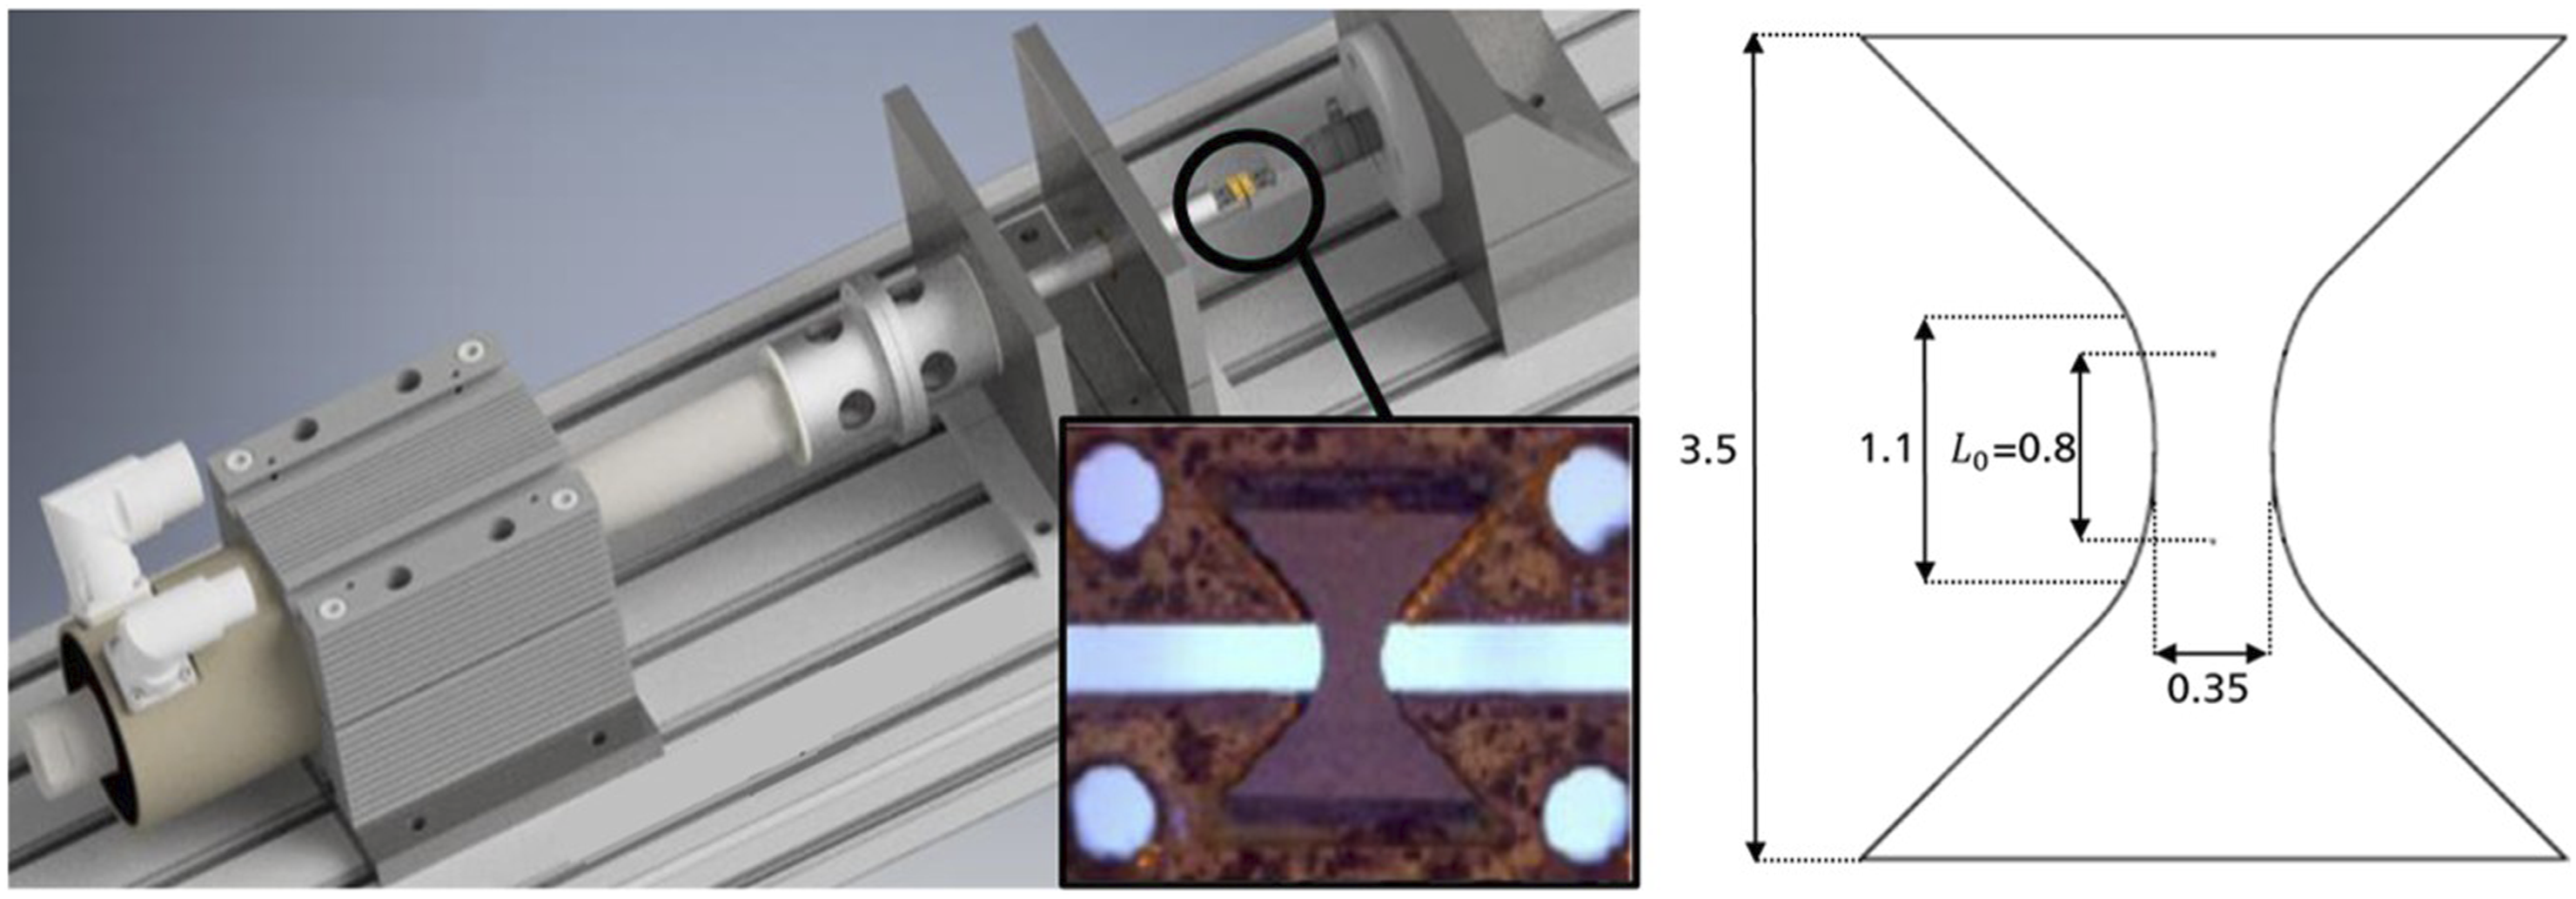
It is well known that the energy absorption until failure of SFRP increases with higher strain rates.33–36 The distortion energy The test setup for the micro specimens (left) and the dimension of the specimen in mm (right) with a thickness of 0.35mm.
37
With this uniaxial tension test on microscopic specimens, it was possible to show that the deformed material volume of PP-GF30 depends on the strain rate analogically to the energy absorption.
39
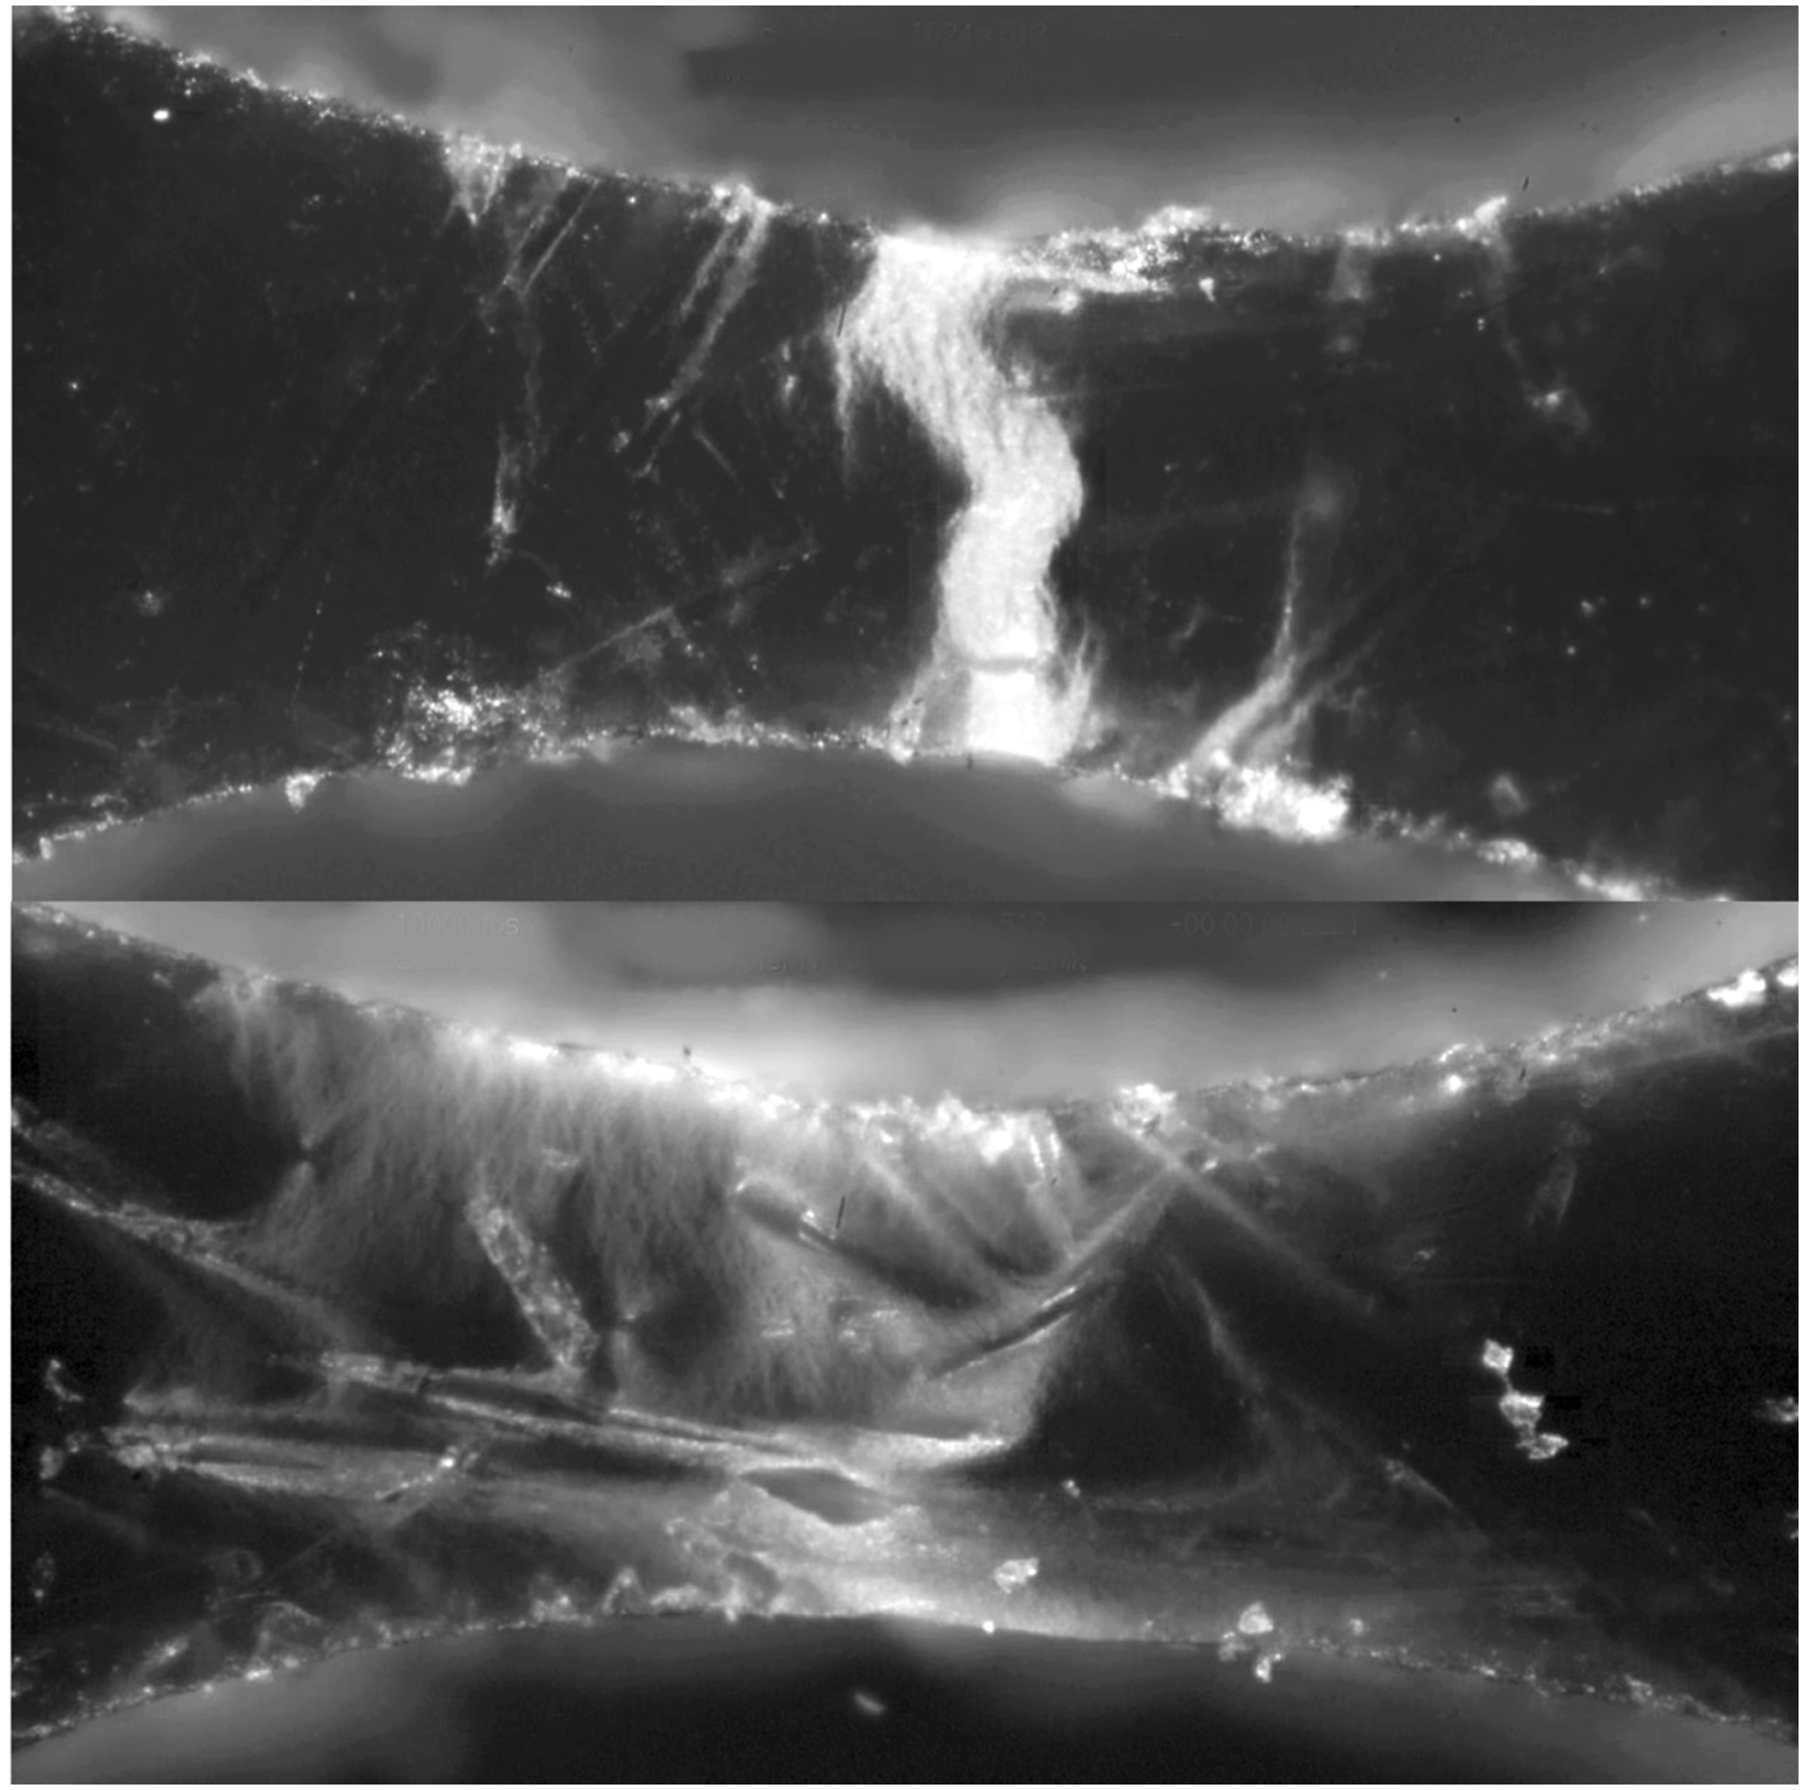
As the light microscope pictures in Figure 2 show, the amount of deformed material appearing brighter is less distributed under quasi-static than dynamic deformation. Deformed SFRP (PP-GF30) micro specimens of length, width, and height of 1.1 mm, 0.35 mm and 0.35 mm with an applied strain rate of 0.007/s (above) and 250/s (below).
39
This points towards a constant ratio between energy absorption and the deformed volume
By investigations of the strain rate dependent distribution of strain on non-reinforced polypropylene compared with PP-GF30, it was possible to prove that this is not a feature of polypropylene (PP), but the strain rate dependent deformed volume only accrues in the composite. 33
Still, to reproduce the characteristic strain dependent deformed volume and analyze the distortion energy density, first the micro mechanics leading to this behavior needs to be understood. Therefore, on reduced representative volume element simulations the influence of several micro mechanical effects on the deformed volume shall be tested discussing the modeling of the fiber, the matrix, and the boundary layer. Hereby a model capable of reproducing the characteristic strain dependent deformed volume is created.
This model is validated by simulations of micro specimens based on their real fiber orientation. On these the hypothesis of a strain rate independent distortion energy density can be validated.
Excursion on continuums mechanics
Like most finite element software LS DYNA is based on the theory of continuums mechanics. As this is a wide field here only the basic concepts shell be mentioned. For more details see.40–42 The deformation or strain


For all following simulations the initial conditions can be summarized to no initial velocities and no initial eigenstrains at all material points

The unit cell simulations are models with periodic boundary conditions as described below, resulting in no undefined boundaries. In the micro specimen simulations, a displacement on the left and right boundary surfaces is specified with


Methods for 2 fiber unit cells
The geometry of the representative volume element is designed in such a way that its complexity and volume are kept as small as possible to minimize the numeric expense and maximize the mesh accuracy, while the deformation behavior between the fibers should still be captured by the model. The fibers can be approximated by cylinders with good accuracy. Even though in CT-scans one can find that long fibers are often bent, here it is assumed, that this has no significant impact on the strain rate dependency and can therefore be neglected.
To keep the volume of the unit cell small, it is necessary for long fibers to restrict the study to aligned fibers. But as discussed above, the fiber distribution has a strong impact on the deformation and failure of SFRP, and therefore this represents a significant assumption. Hence the transferability of the model to misaligned fibers must be validated. This is done by simulating the experiment on micro specimens with real fiber orientations.
Lastly, the aligned fibers can be positioned with different overlap as shown in Figure 3. To generate the most representative model possible extreme cases should be avoided as no overlap or complete overlap. Thus, a medium overlap of 1/4 of the fiber length on both sides is chosen. Positioning of aligned fibers with no (1), complete (2) and medium overlap (3).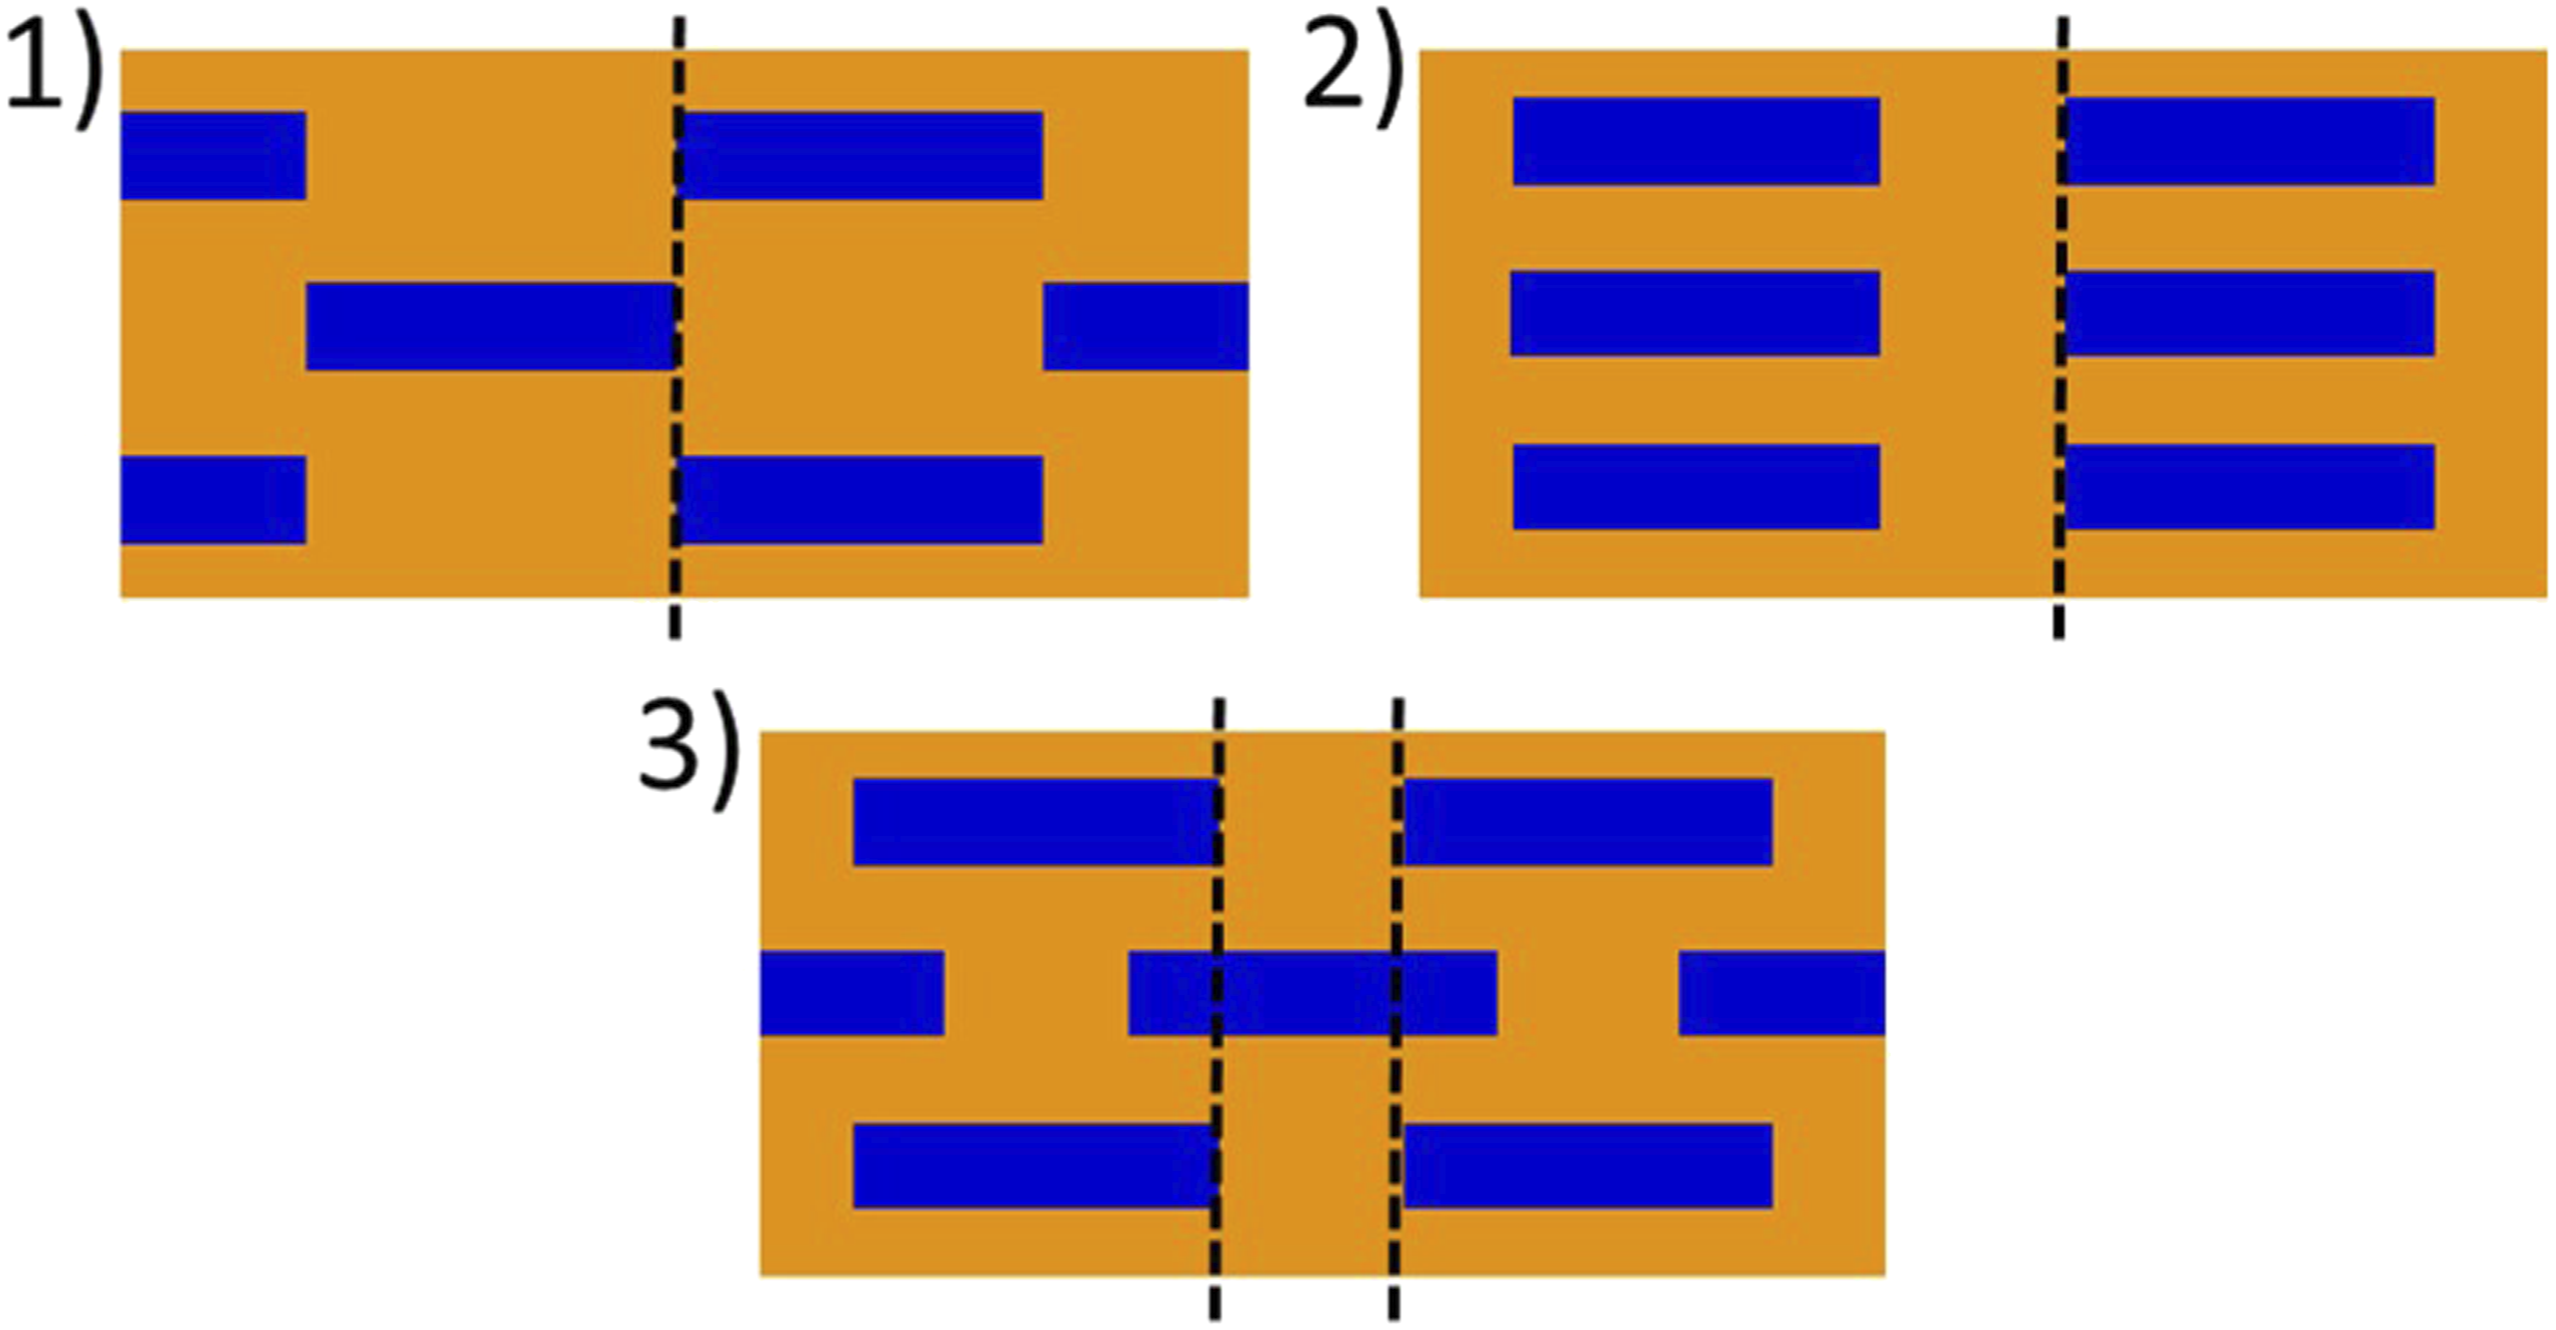
This leads to a unit cell of one central fiber and 1/4 of the four nearest fibers repeating itself in all directions. The fiber geometry and density was based on previously performed characterization of the material.
39
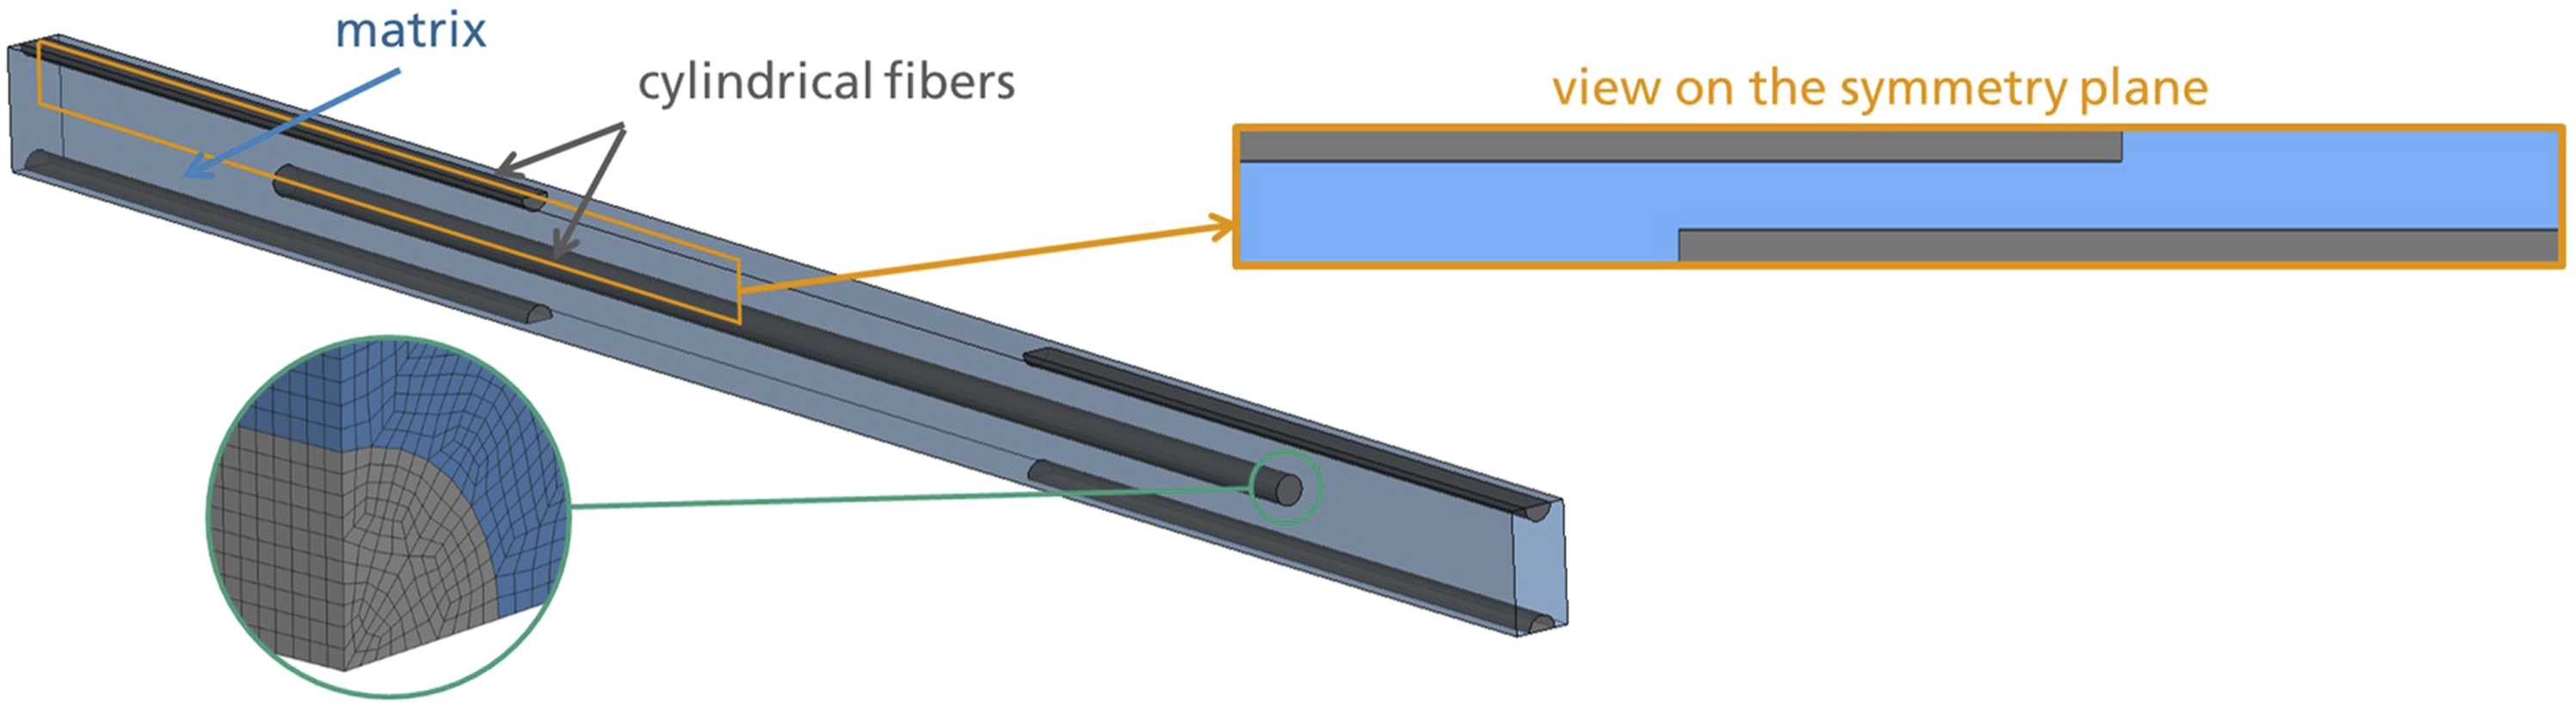
Thereby a fiber length of 2 mm and a fiber volume fraction of 12% was estimated from an ashing as shown in Figure 4. The fiber radius of 0.01 mm was determined by CT-scans. With this the horizontal fiber spacing can be calculated as 0.022 mm. Fibers and matrix were meshed with hexahedral elements with an average edge length of 0.5 μm, resulting in a geometry with about 45 million elements as displayed in Figure 5. The full unit cell was simulated with periodic boundary conditions. But as the unit cell is symmetric, for the purpose of analyzing the results only a quarter of the symmetry plane has to be considered. Therefore, the following results are displayed restricted to 1/4 of the symmetry plane as shown in Figure 5. A fully integrated element formulation was chosen with 8 integration point for each hexahedral element and without rotational degree of freedom of the nodes. Fiber length distribution in the PP-GF30 based on ashing.
39
The geometry of the representative volume element including a central fiber and 1/4 of four adjacent fibers as well as the matrix material meshed with hexahedral elements. Resulting stress fields can be considered on 1/4 of the symmetry plane.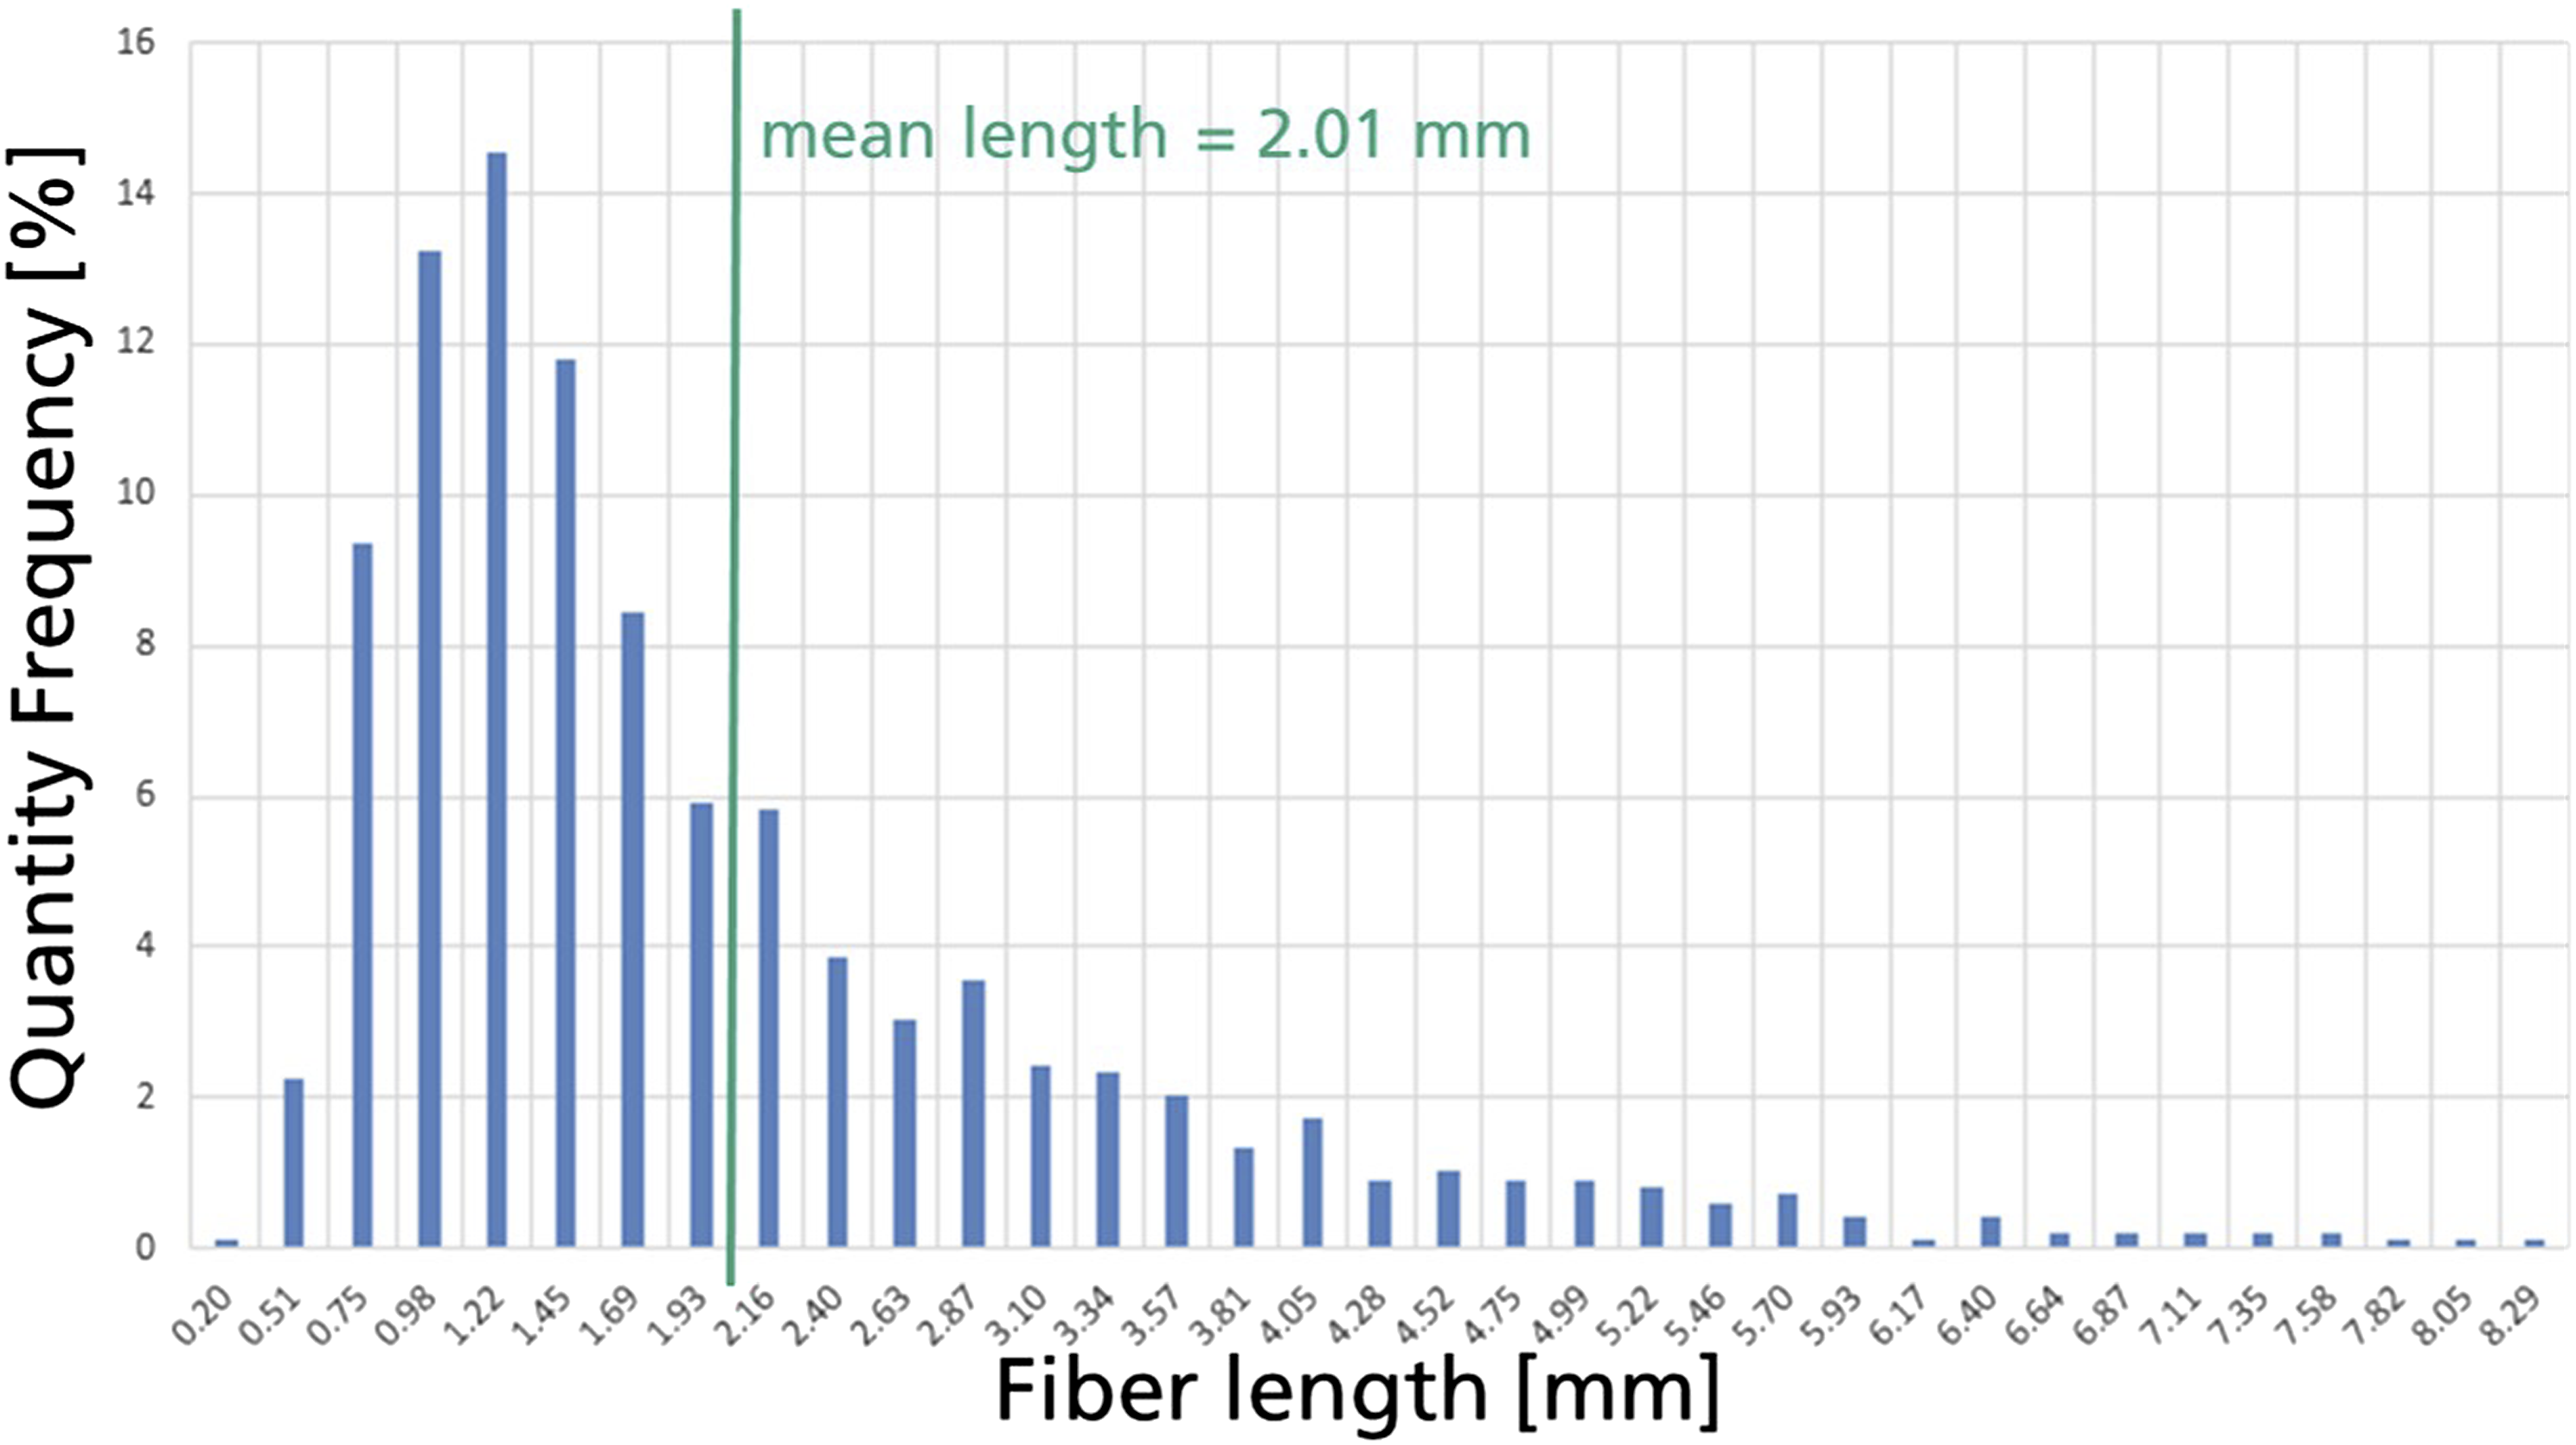
The polypropylene matrix was represented with the standard model for polymers in the FEM solver LS DYNA “Semi Analytical Model for Simulation of Polymer” (SAMP), comprising a linear elasticity and a strain rate dependent plasticity based on the von Mises stress with different flow curves for different stress triaxialities and an associated flow rule.
43
At first no failure was implemented, analyzing the deformation before fracture. The material parameters were determined on experiments from Lienhard.
33
and Sommer et al.
39
(see Figure 6).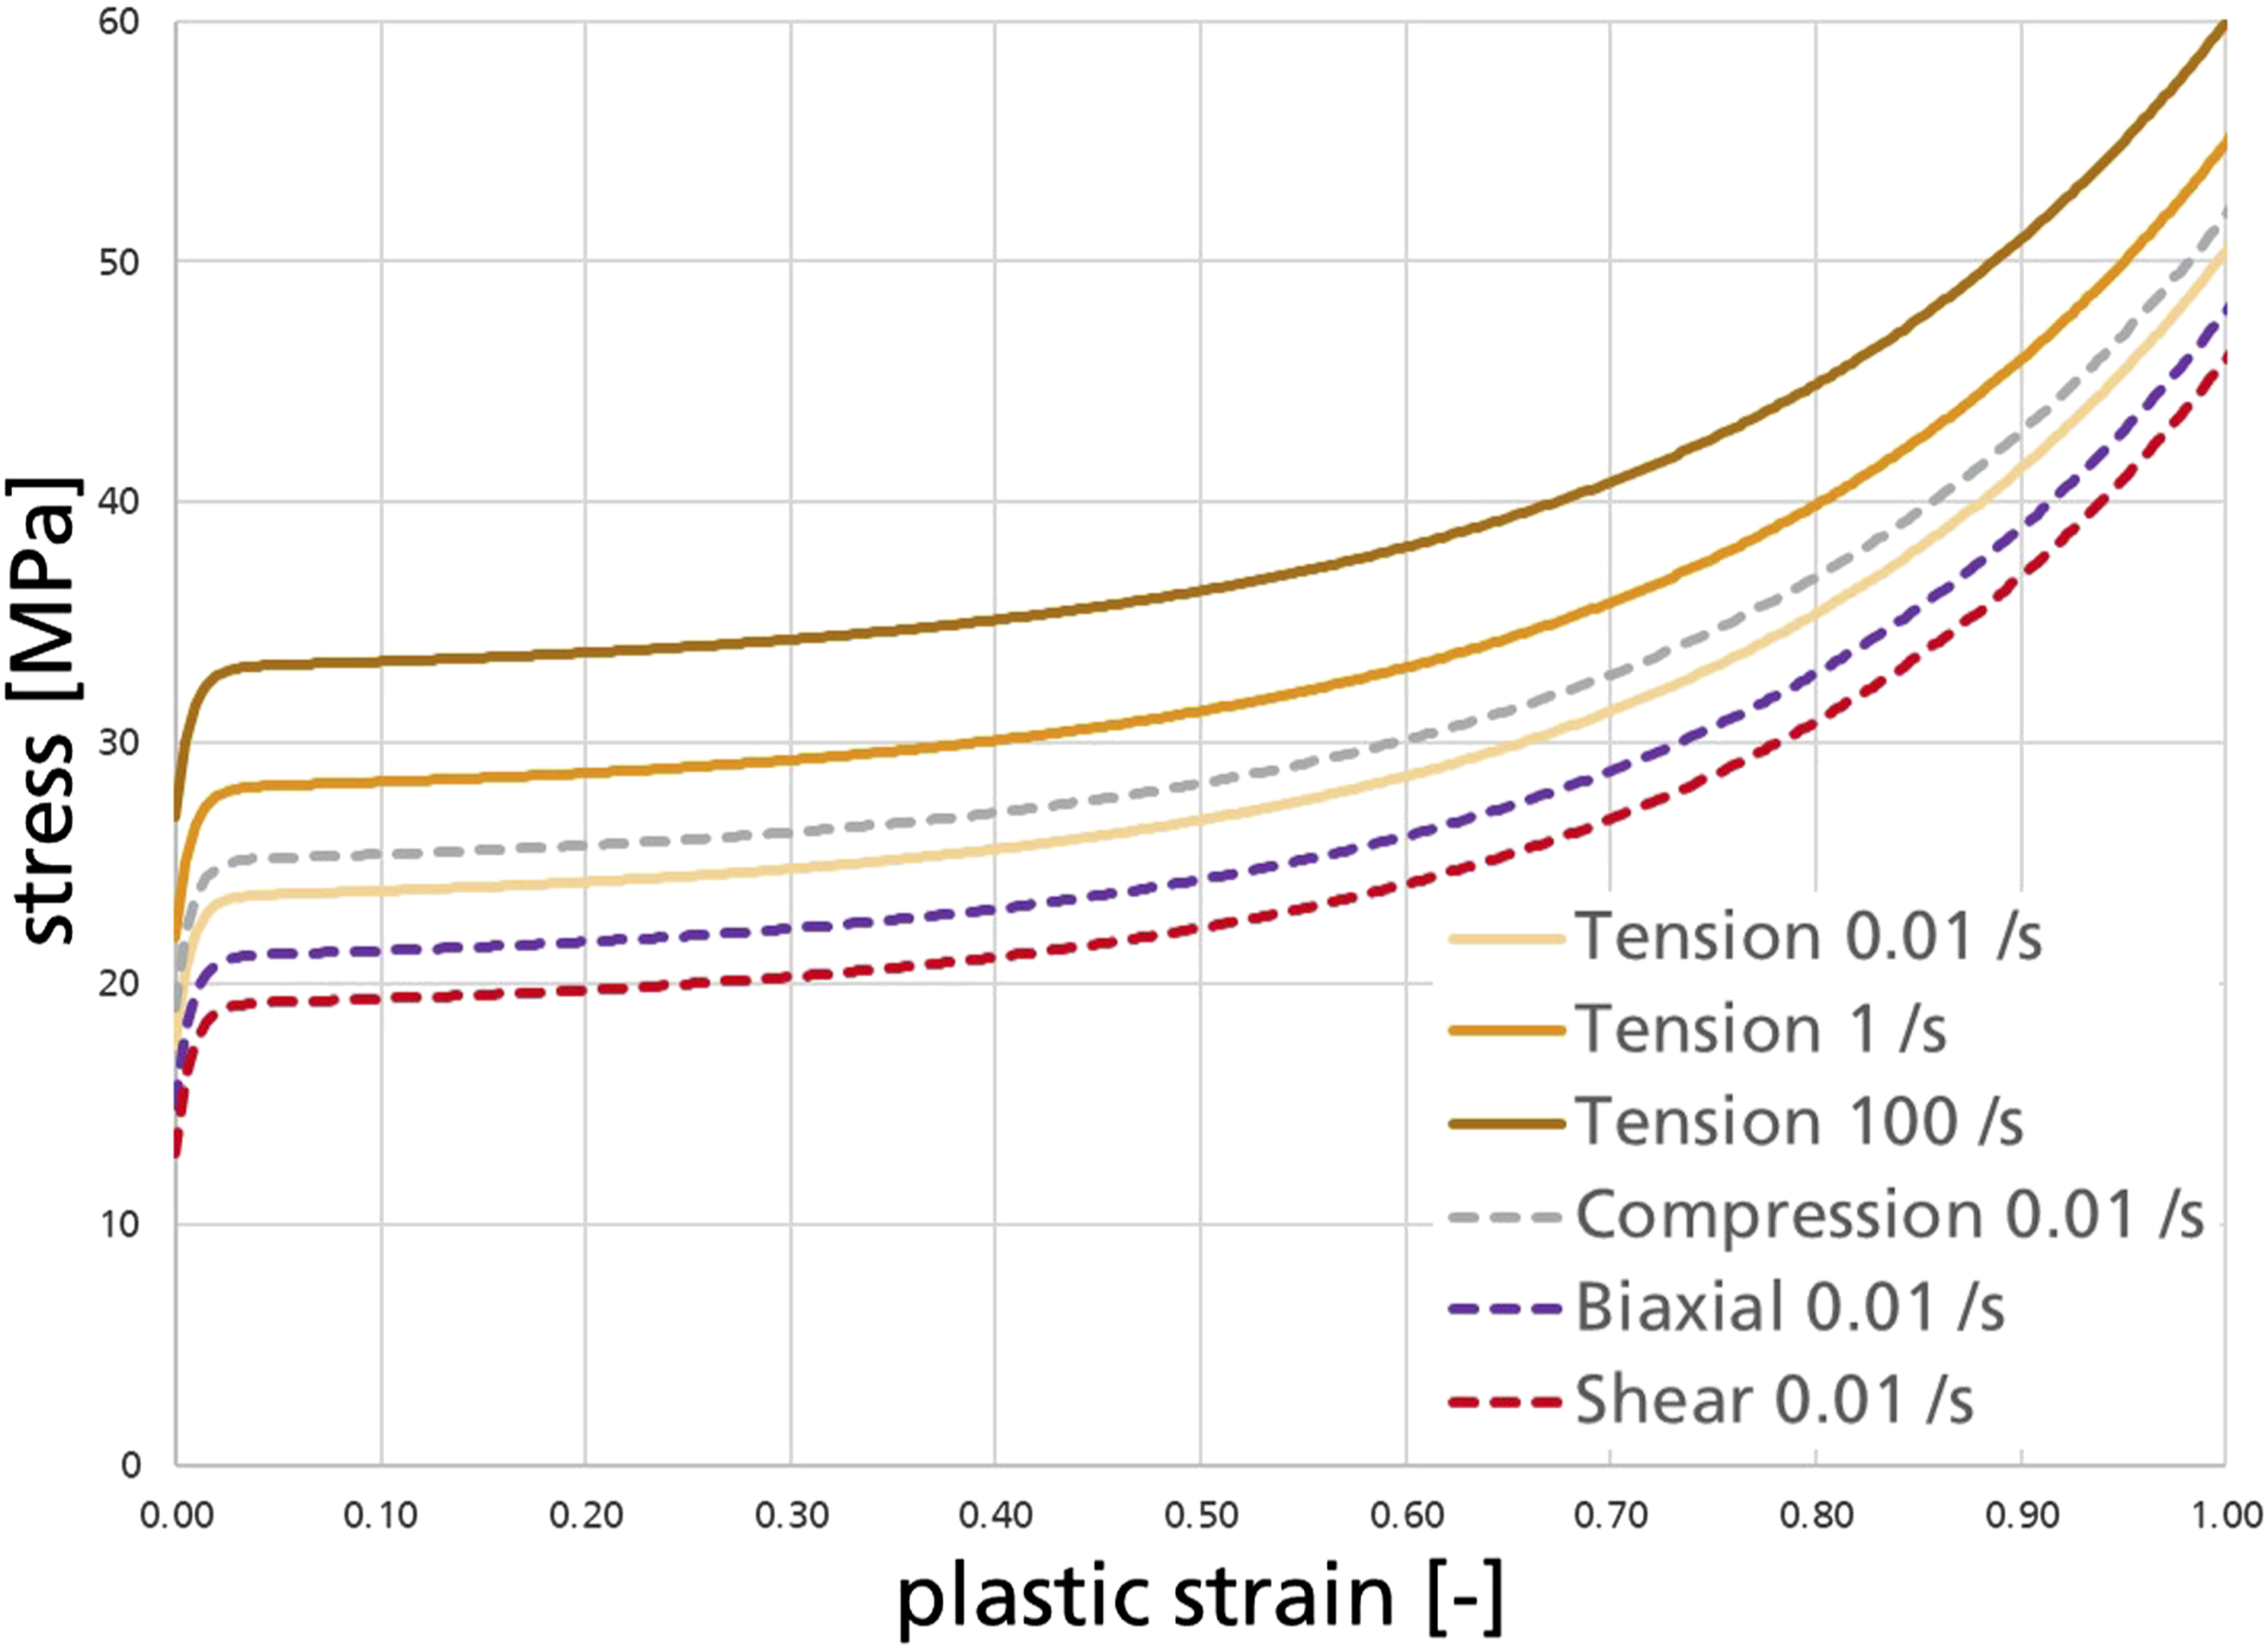
In the beginning, the glass was assumed to be strain rate independent linear elastic with material parameters from manufacturer information (E-modulus = 73 GPa, Poisson’s ratio = 0.23, density = 2.6 g/cm3). As a baseline a perfect interface between matrix and fibers is assumed, and they are modeled with sharing nodes.
The boundary conditions are chosen to be periodic, as it was shown that this yields the most accurate homogenization properties in general. 44 This was achieved by connecting nodes on opposite sides with *CONSTRAINED_MULTIPLE_GLOBAL in LS DYNA. Unit cell simulations with uniform displacement boundaries were tested as well and differed slightly but generated qualitatively the same results as periodic boundary conditions. The deformations were applied with the same strain rates as in the micro-specimen experiments, 0.007/s, and 250/s, until a total strain of 0.03 and 0.05 in fiber direction was reached respectively.
Simulation study of micromechanics
To identify the necessary micro-mechanical effects to reproduce the strain rate dependent deformed volume, a series of unit cell simulation of SFRP are performed using the software LS DYNA with the version R11.1. Thereby the material models of the components and their bounding are varied with respect to their influence on the strain distribution in the matrix.
As a reference the unit cells were simulated without any additional effects, modelling the glass and polypropylene with the models and boundary conditions described above. As displayed in Figure 7 (1) the plastic strain distribution on a quarter of the symmetry plane at the end of the deformation is very similar for applied quasi-static and dynamic strain rates. Different amounts of deformed material as experimentally observed (see Figure 2) does not occur numerically with this model. Therefore, it is concluded, that a micro-mechanical effect responsible for this behavior, is not yet implemented in the model. The plastic strain distribution on a quarter of the symmetry plane between the fibers at the end of two sets of unit cell simulations each with quasi-static (above) and dynamic loading (below). (1) without any additional micro-mechanical effect and (2) with visco-elastic glass fibers.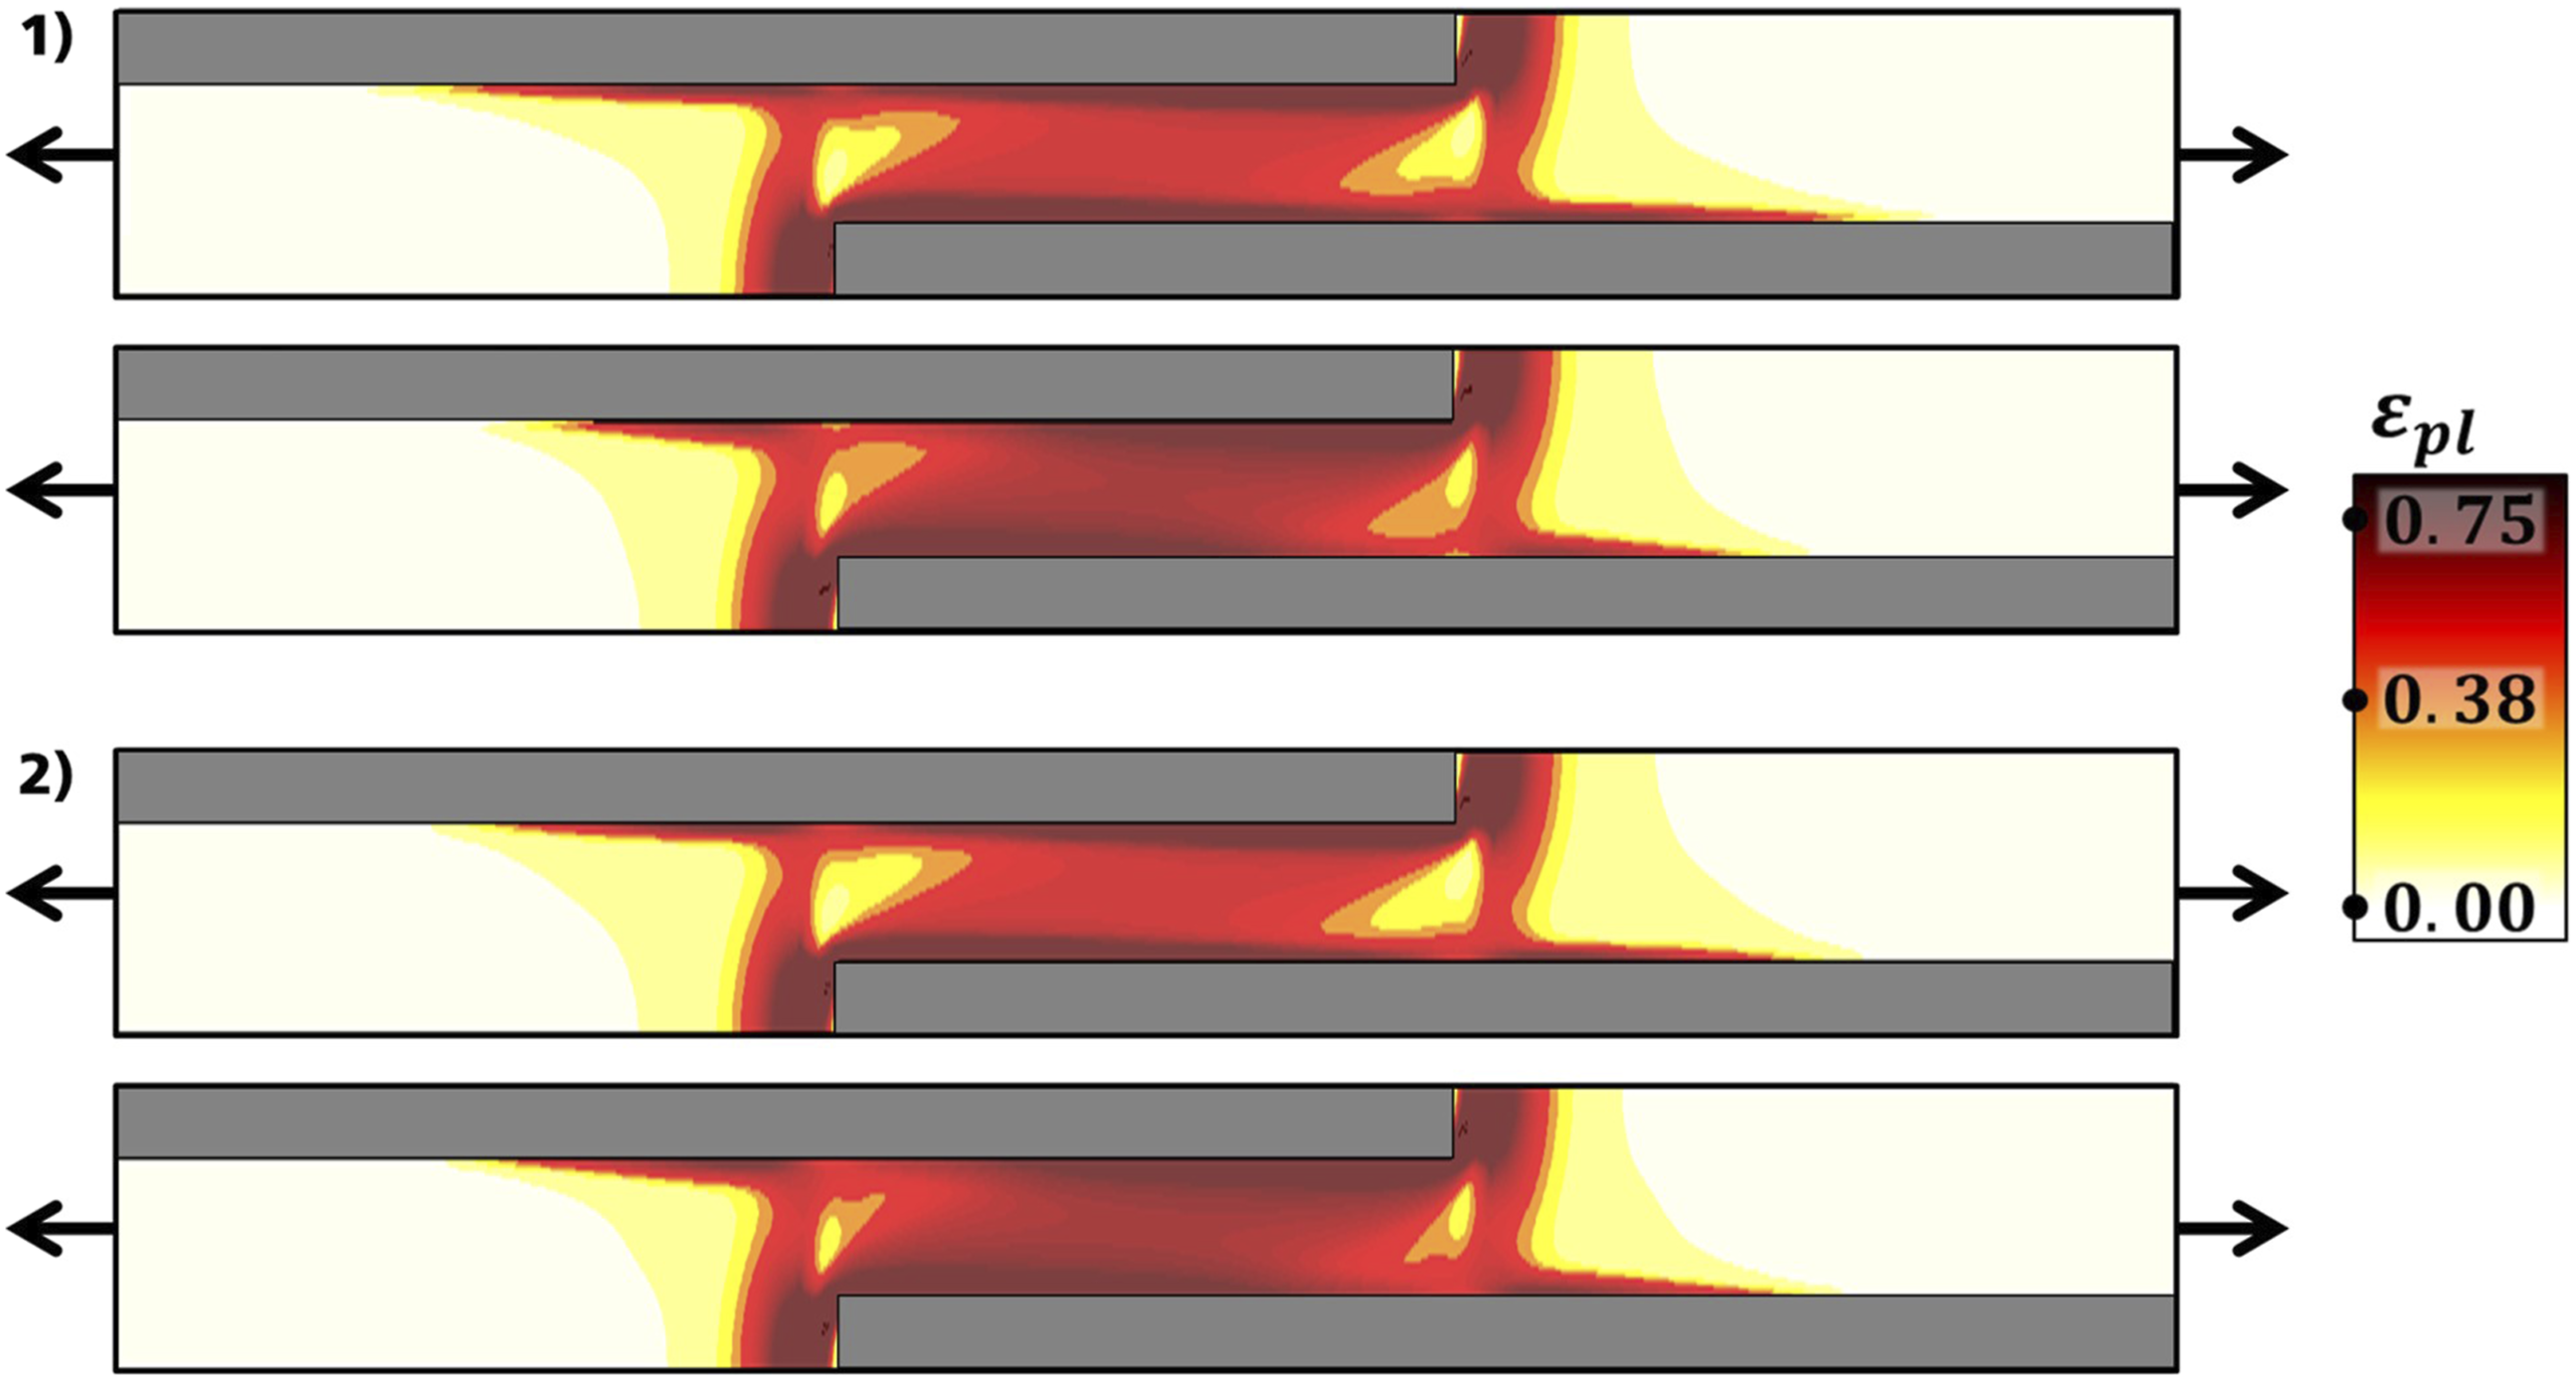
Firstly, the modelling of the glass fibers is investigated. Analyzing the stresses present in the fibers one discovers that the failure stresses of 1.1 GPa (quasi-static) and 1.9 GPa (dynamic) based on experiments performed by Arao et al. 45 are not reached in this simplified geometry. Thus, an implementation of a failure model for glass has no effect.
But Zhang et al. 46 have proven the visco-elastic nature of glass fibers in their work, even if the influence of the strain rate is weak. To demonstrate the effect on the plastic strain distribution the nominative E-modulus for the glass fibers of 73 GPa was lowered to 60 GPa for the quasi-static deformation and raised to 85 GPa for the dynamic deformation.
Even though, these changes overestimate the measured effect, the simulations produce plastic strain distributions with no qualitative difference to the reference simulations (see Figure 7 (2)). The stiffness difference of glass and polypropylene is too strong for the visco-elasticity to have a significant effect.
Secondly the material model for the matrix was investigated. The elastic parameter of polypropylene is analyzed at different strain rates with a high accuracy.47,48 Further considerations are needed for reinforced polypropylene as its crystallization behaves differently in the presence of fibers. 49
It’s further possible with analytic homogenization methods to connect these material constants to the elastic parameters of the composite, predicting the overall stiffness accurately.50,51 Even though a zone close to the fibers is known to have a lower stiffness, 52 these analytic calculations demonstrate that its influence is small.
For the plastic behavior this is much more difficult. There are mathematical models to homogenize the nonlinear properties, but often these analytic approaches must be adjusted to fit the experimental results. 53 Because of this there is still an uncertainty how the properties of PP after the injection molding as part of the composite differ to non-reinforced polypropylene.
The experimental characterization of the matrix between the fibers is very challenging; therefore, the plastic behavior is analyzed for the composite by reverse engineering. 20 different flow curves were simulated ranging from ideal plasticity to pure elasticity. But with none of these variations it was possible to reproduce the experimentally observed strain rate dependent deformed volume. As an example, the result of a quasi-static simulation with a softer matrix is displayed in Figure 8. Here polypropylene is more susceptible to plastic flow at lower stresses. This leads to a deformation with plastic strain focused close to the fibers. Even though this represents a localization it would lead to a fiber pull out and not the desired deformation. But the result of this deformation highlights the importance of the fiber-matrix boundary layer, which will be analyzed next. The distribution of plastic strain on a quarter of the symmetry plane simulated with softer plastic flow applying quasi-static strain rates.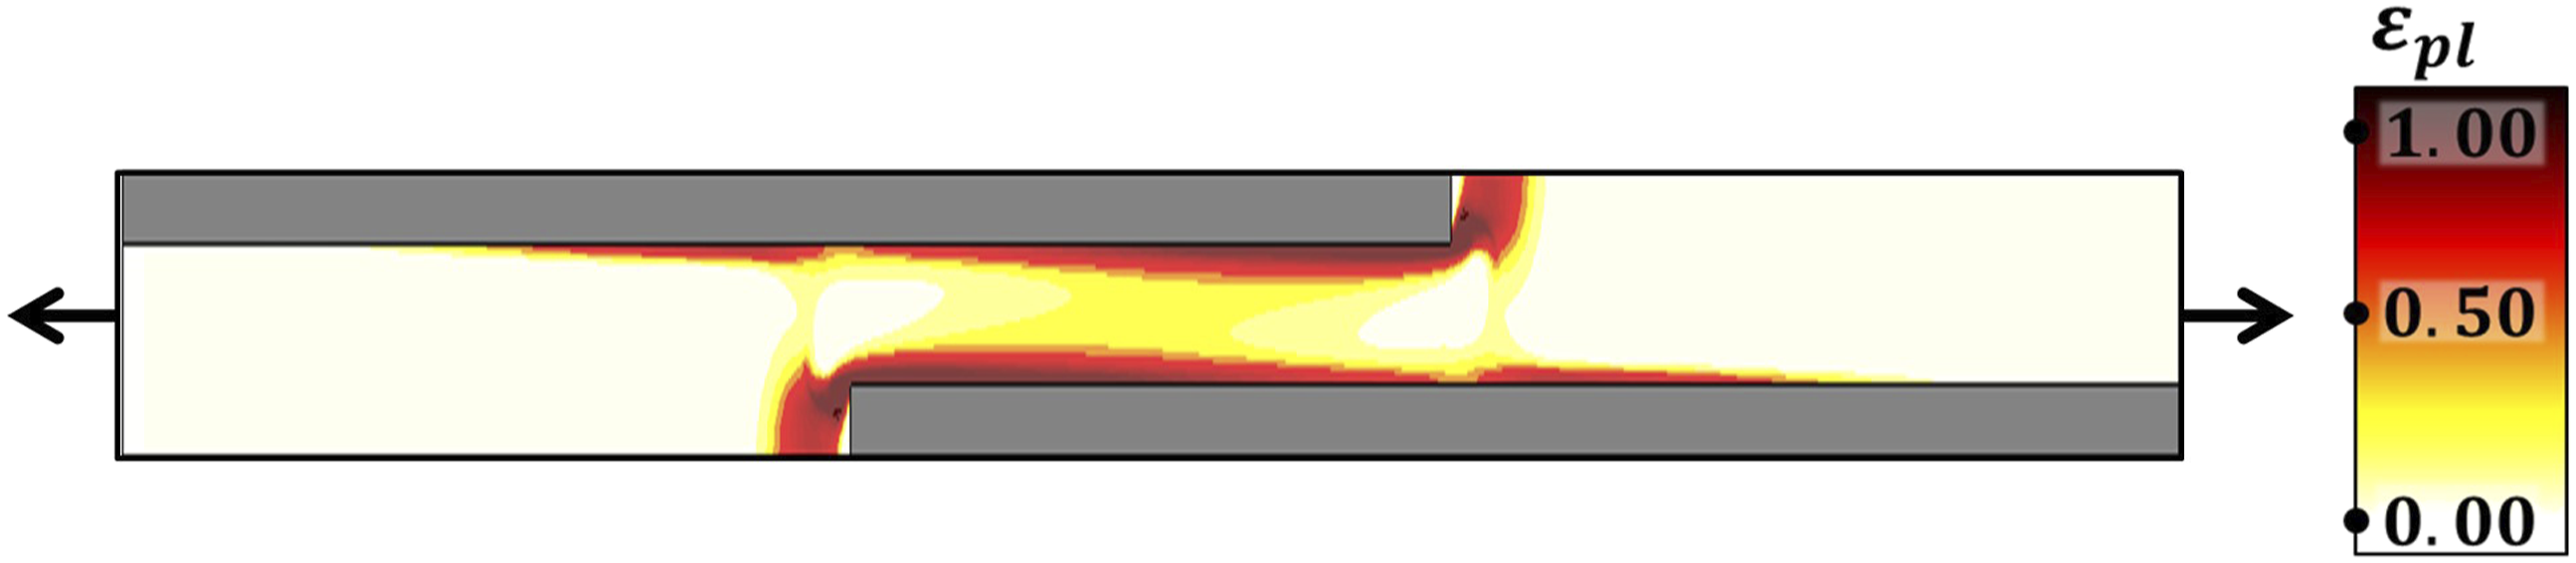
With these simulations one cannot rule out the effect of a crystallization-based variation of the plastic behavior of polypropylene. But it is not possible to reproduce the strain rate dependent deformed volume and therefore this effect is not included in the following simulations to provide the simplest model possible.
Thirdly, the boundary layer is investigated enabling delamination of the fiber and the matrix. As widely established in literature.54–57 the adhesive behavior is strain rate dependent and critical stresses are about 38 MPa quasi-statically and 75 MPa at 250/s. Hereby the value at low velocities is well established, whereas the dynamic value has not been characterized directly. The experimentally acquired critical stress of 65 MPa at 40/s for glass and epoxy-amin can give a guideline for a lower limit. 56 While Zhang et al. 57 established with 85 MPa at 10 11 /s an upper limit using molecular dynamic simulations. This results in an uncertainty of about 10 MPa and here applied critical decohesion stress at high strain rates must therefore be regarded with care.
The failure of the boundary layer is implemented using a so called tied-break-contact in LS DYNA enabling nodes to separate if a certain normal or shear stress is reached. Hereby, again the simplest possible model is chosen to describe the microscopic mechanism without a gap opening before delamination and depicting brittle failure. The critical stresses established above are used (38 MPa quasi-statically, 75 MPa at 250/s).
The quasi-static unit cell simulations predict a debonding starting at the fiber ends and a subsequent localization of the strain in a small region between the fibers (Figure 9). While the critical stress is not reached in the dynamic case no detaching occurs, which leads to the same behavior as in the reference simulation. Unit cell simulations including strain rate dependent decohesion yield a localization of plastic strain with quasi-static strain rates (above) and a wide strain distribution with high strain rate (below).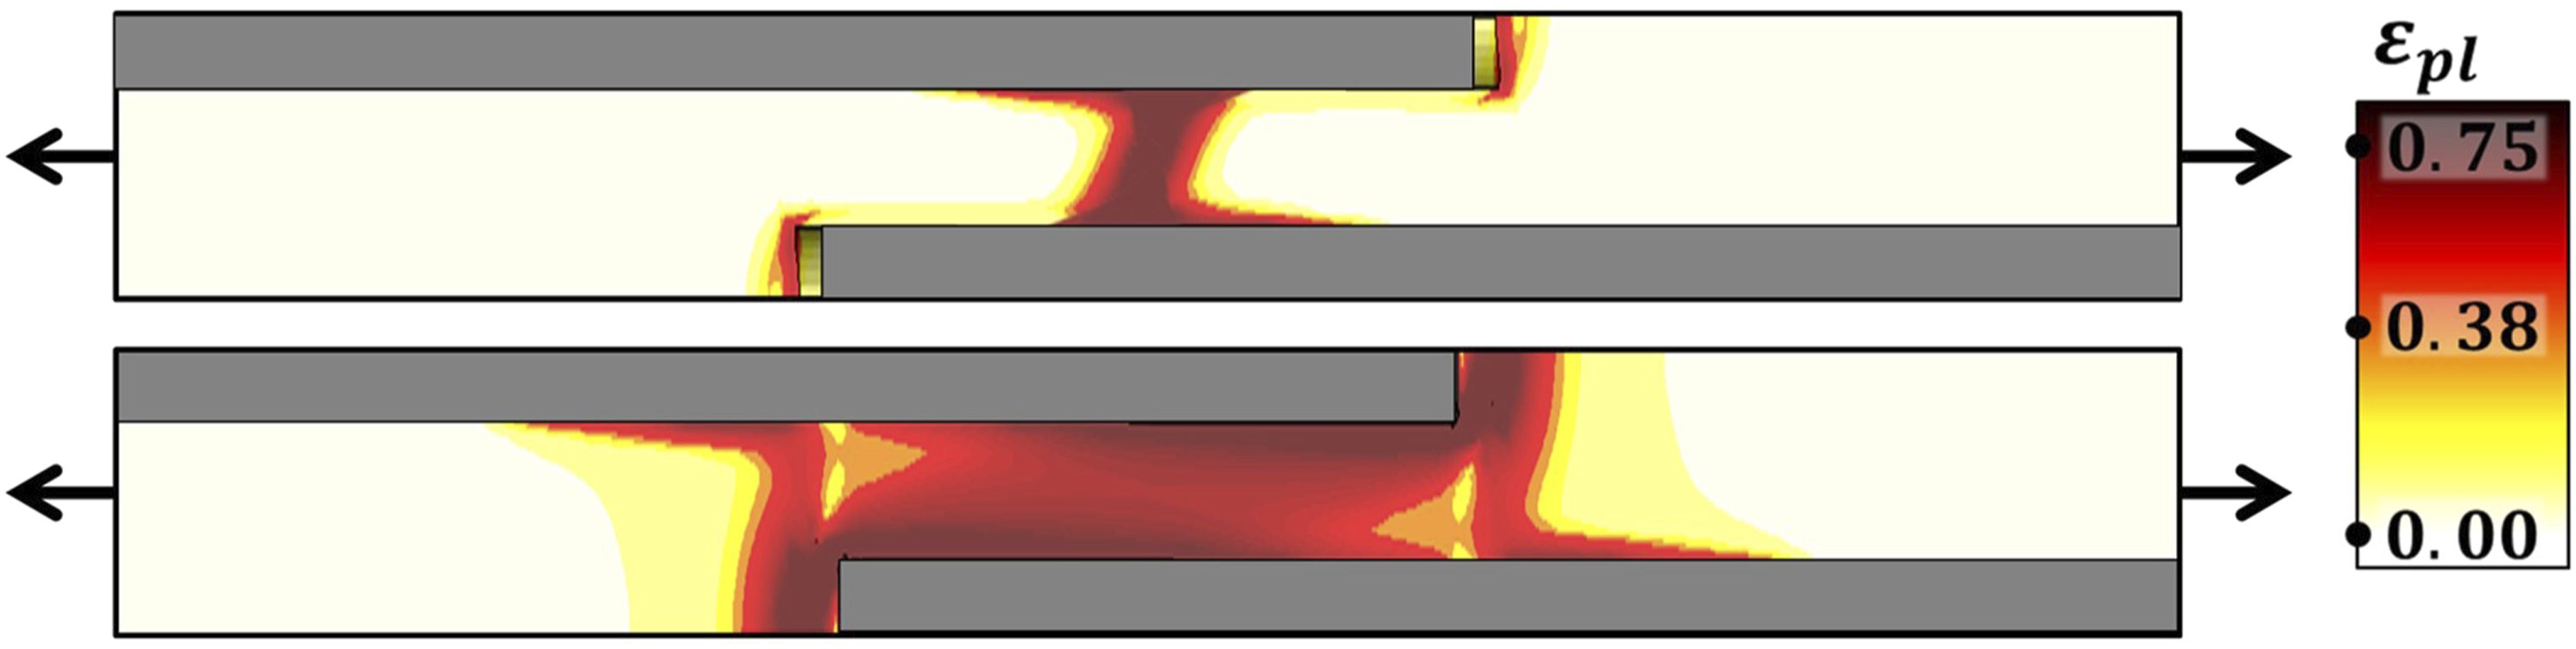
From these results it can be concluded that the strain rate dependent delamination is critical for modelling the failure of SFRP. A model able of reproducing the strain rate dependent deformed volume was established based on unit cell simulations with simplified geometries. In the following this model is validated on simulations with real fiber orientations and compared to the performed experiments.
Methods for real specimen simulations
In the previous study before testing the micro-specimen, a CT-scan was done at Fraunhofer ITWM with a resolution of about 2.6 μm and 150 x 1150 x 1250 voxel. With the in-house software MAVI (Modular Algorithms for Volume Images) the fibers and the matrix were separated by a global gray value threshold.
39
To create a geometry with smooth surfaces a python program was written. It approximated the 300 fibers with cylinders and at least one polypropylene element between them, avoiding touching fibers. The geometry was meshed with seven million elements of an average edge length of 5 μm (see Figure 10). The deformation was applied by homogeneous displacement on the nodes at the ends of the specimen modelling the clamming in the experiment. The generation of a FEM geometry (below) based on a fiber distribution by CT-scan (above, left) by approximating the fibers with cylinders (above, right).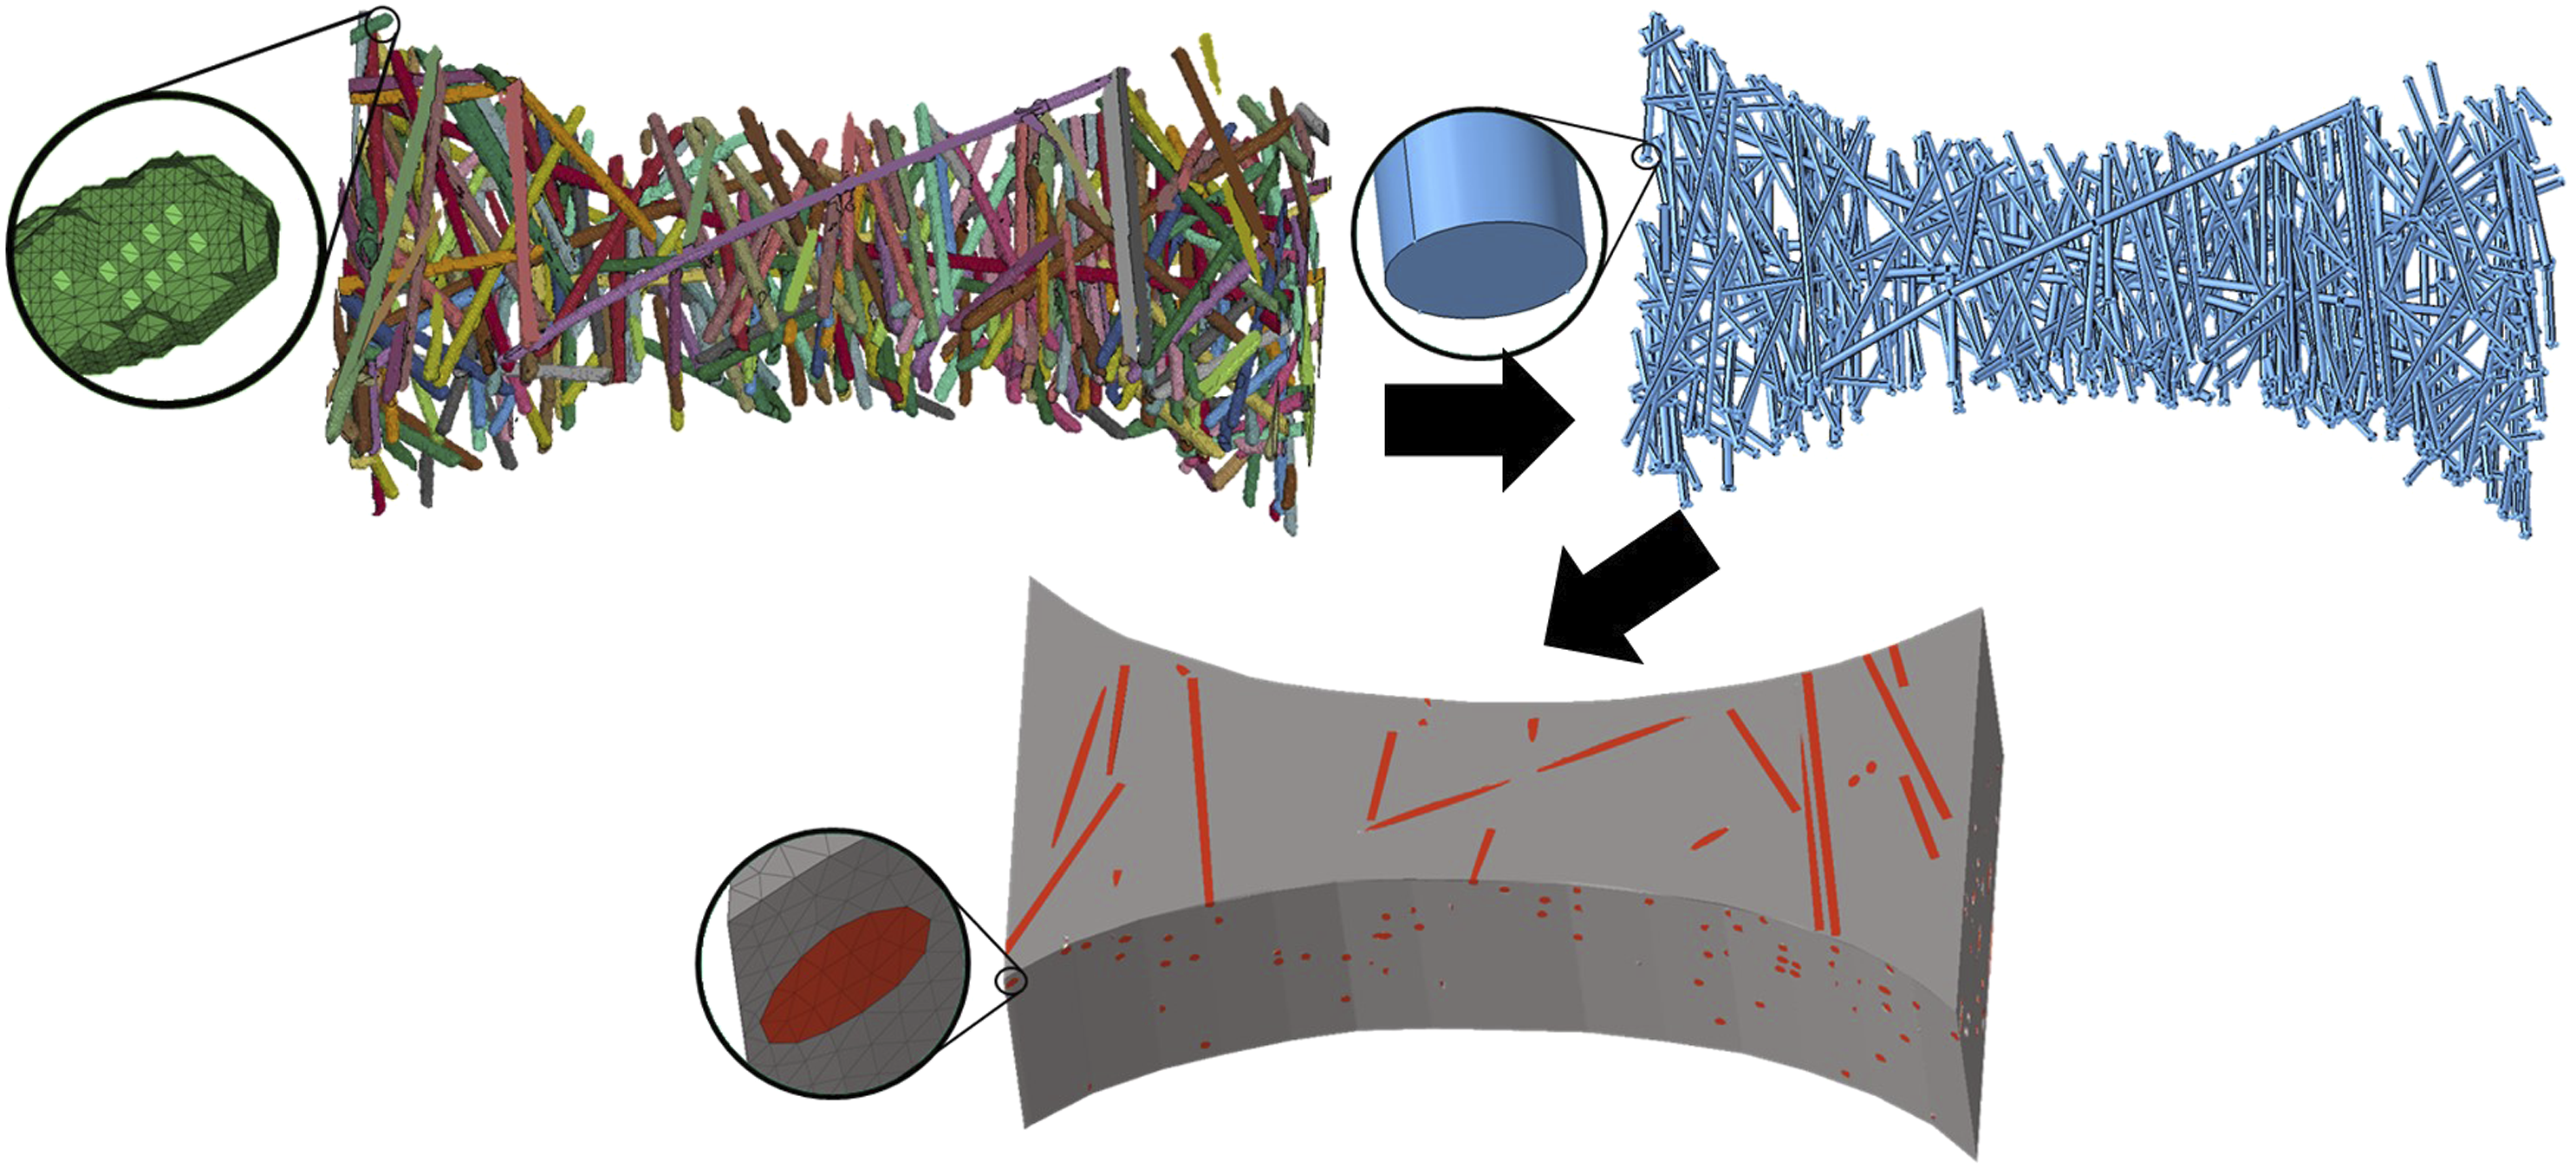
The same material models were applied as above for glass and polypropylene, including the adhesive zone modeled by 2D elements enabling strain rate dependent delamination. Additionally, a deformation based failure model for the matrix was implemented using the GISSMO-model.
58
implemented in *MAT_ADD_EROSION in LS DYNA. In the model the accumulated damage variable is driven by plastic strain weighted by the critical failure strain until a critical value of 1 is reached and the element fails and is deleted. The critical failure strain can be specified in dependence of the stress triaxiality and the strain rate. The material parameters are again based on literature data.33,39 (see Figure 11).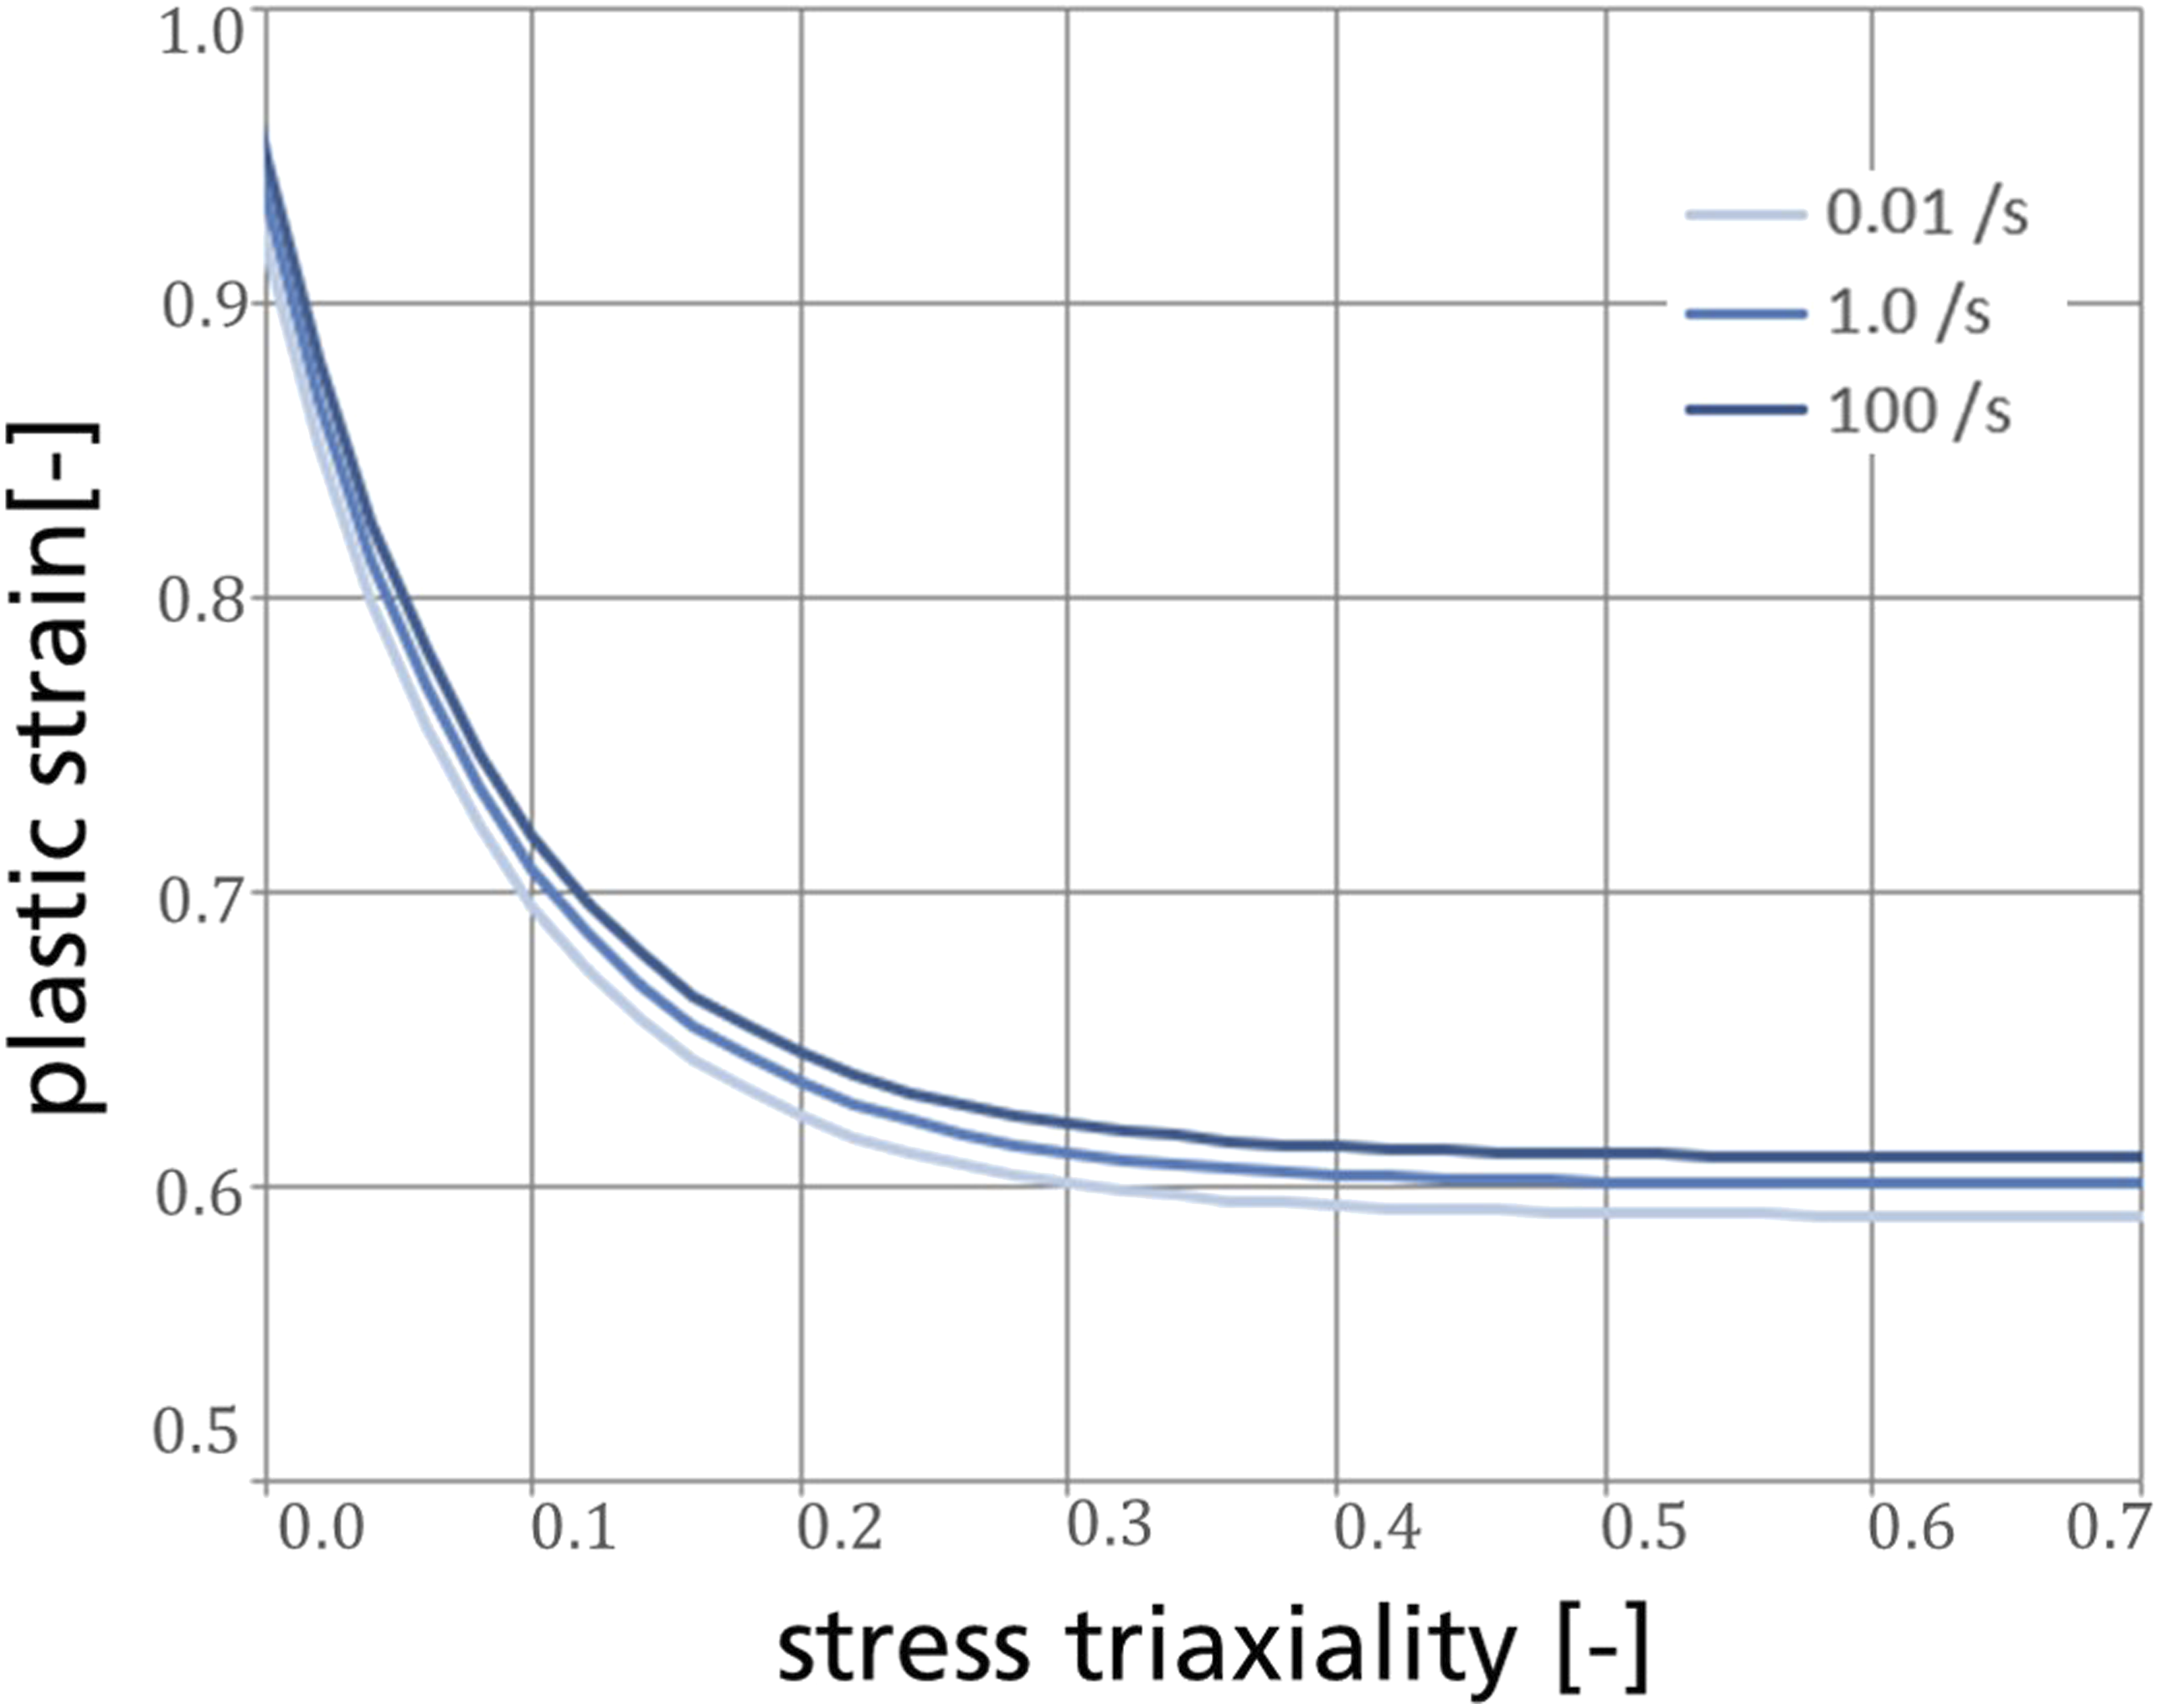
Qualitative results of quasi-static and dynamic failure
With a geometry representing the real fiber distribution, the testing of the microscopic specimens was simulated with applied strain rates of 0.007/s and 250/s to verify the established model and predict the characteristic behavior of SFRP of a strain rate dependent deformed volume. Comparing the simulated plastic strain distribution to the experiments in Figure 12, one finds them in good agreement. With a lower strain rate the deformation localizes in the middle of the specimen just as observed in the experiment. The resulting deformation distributed in micro specimens with quasi-static load at 17.5 s (above) and dynamic load at 0.0015 s (below) by the numerical model (right) in comparison with the experimental findings (left).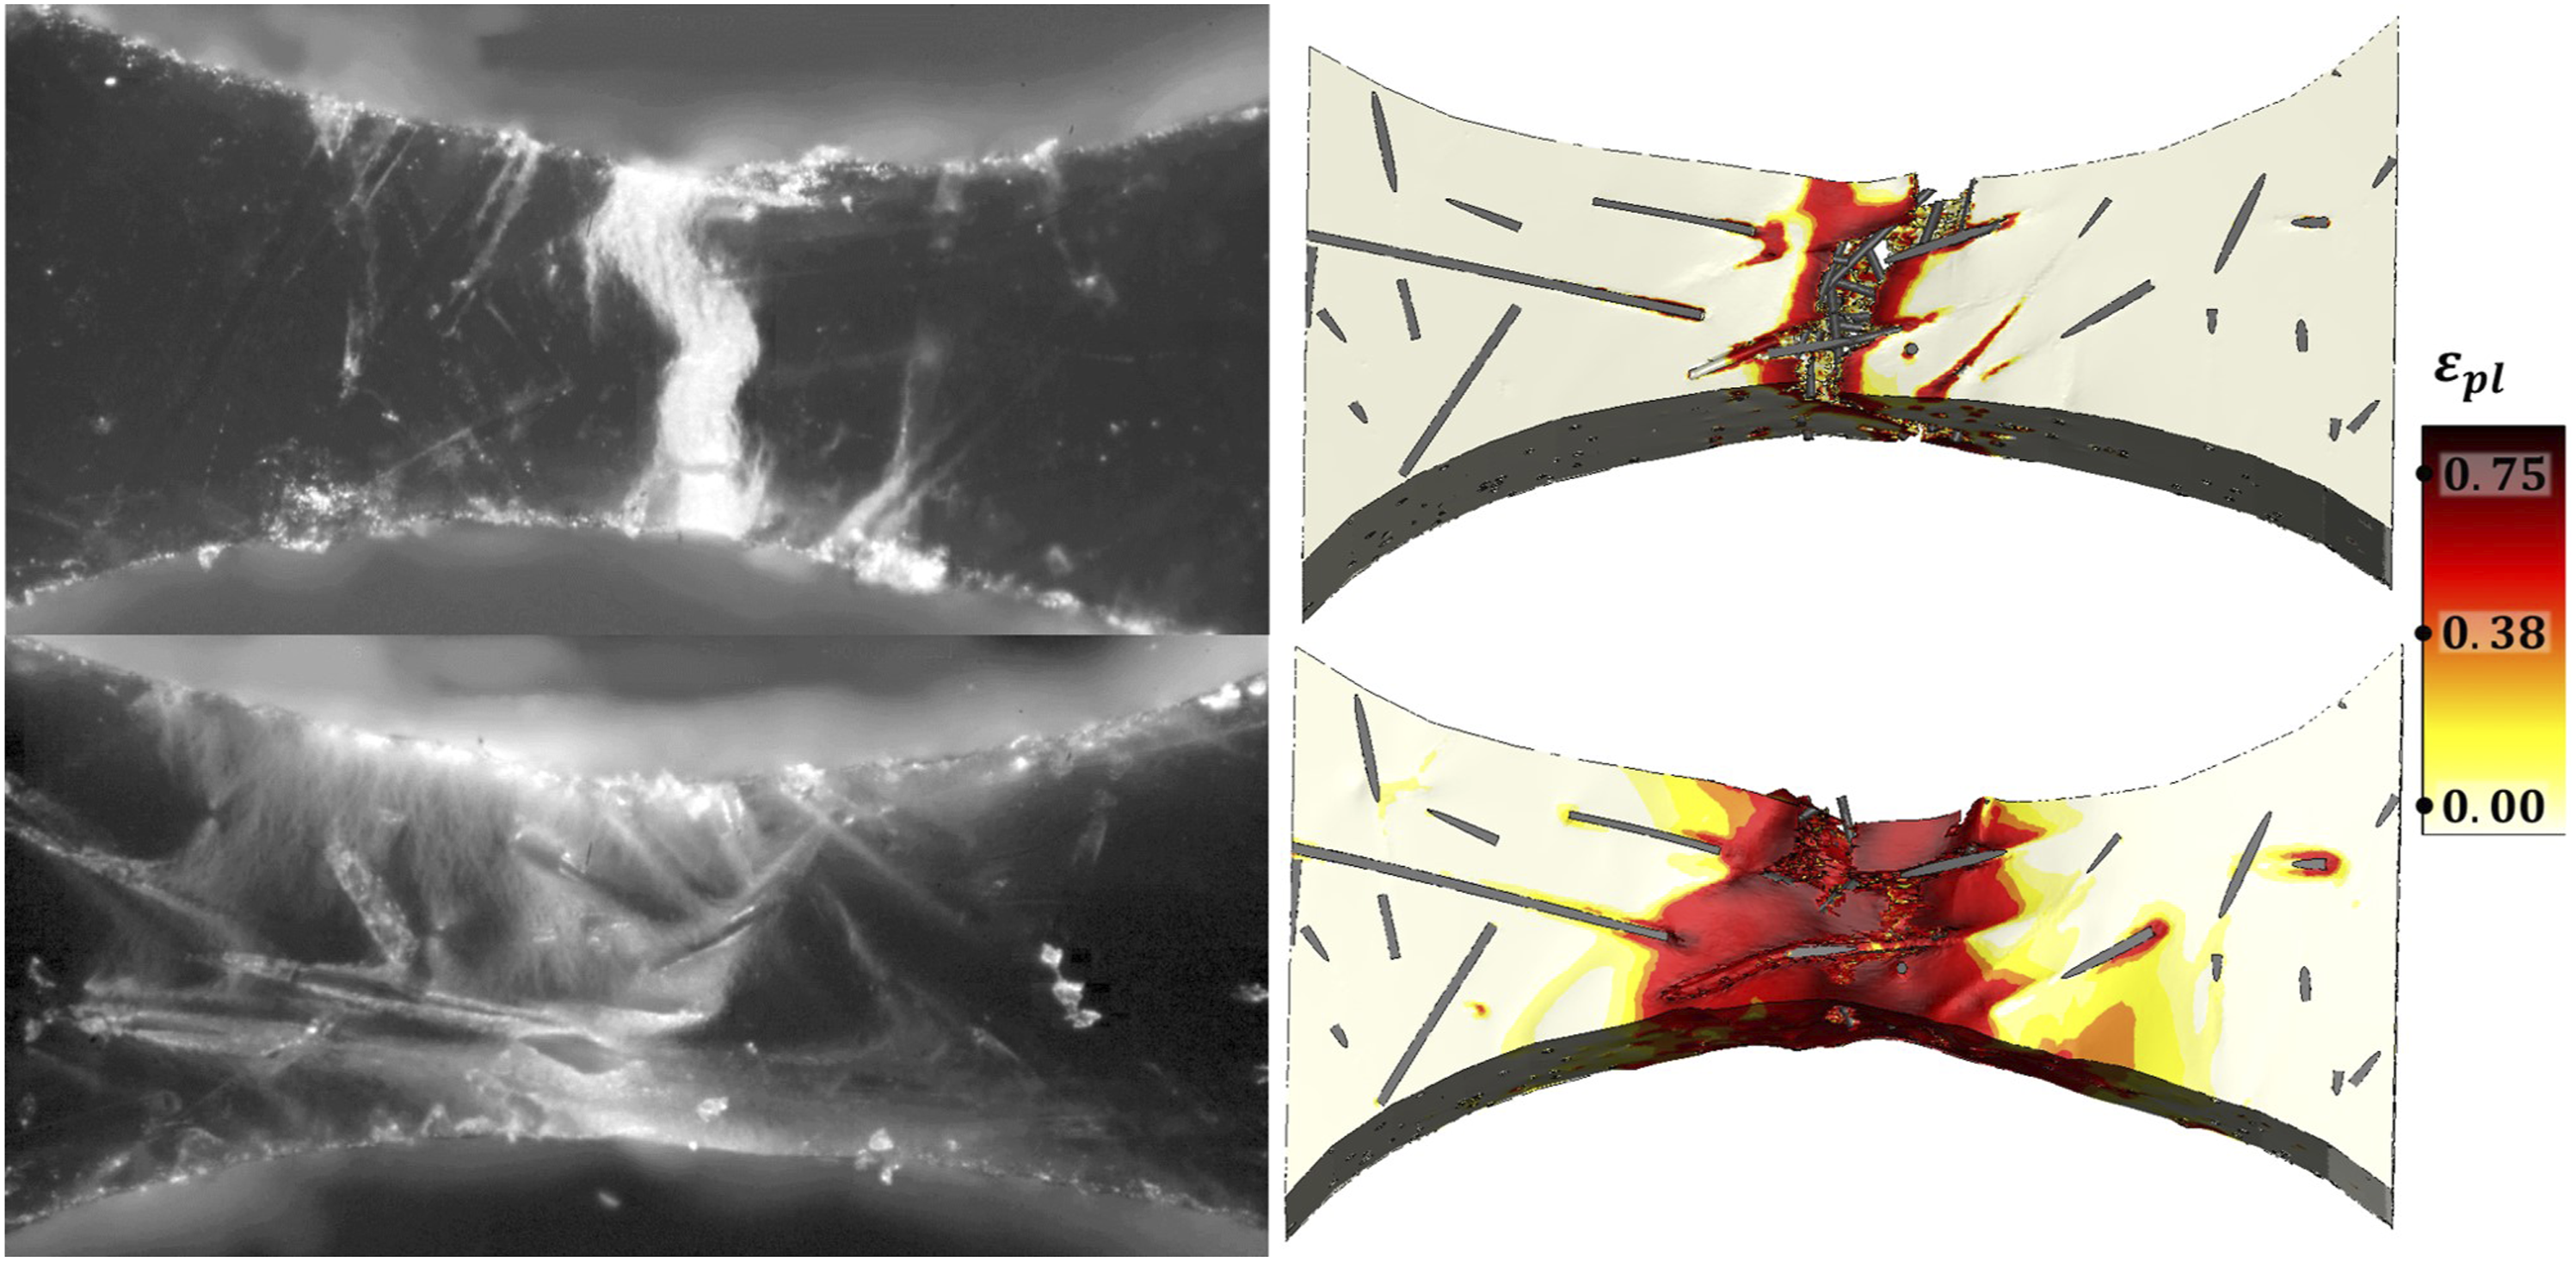
The deformation is distributed over a larger area with high strain rates, in reality as well as predicted by the model. Numerically about twice as much volume is irreversibly deformed as with a quasi-static load. In the experiment the distribution is even wider. The uncertainty of the exact dynamic delamination behavior mentioned above might cause this as a higher critical decohesion stress could lead to a stronger spreading of the deformation due to the fibers.
Figure 13 shows the simulated force over time and the plastic strain distribution is compared with the experiment at five times throughout the test. The comparison with the experimental force-curves is discussed in the next chapter. It stands out that even after the maximal force is reached at 12.5 s very little plastic deformation is observed. In the simulation one finds decohesion, while this is not observable in the experiment. At 17.5 s in the simulation and the experiment small zones of large deformations appear, which extend over the width of the specimen. After the force plateau the plastic strain accumulates at a confined volume, numerically and in the experiment alike, until the crack spans over the whole specimen and the force reaches zero again at about 35 s. Model prediction of the quasi-static force over time of the micro-specimen-test with the deformation development compared with the experiment at the same time steps.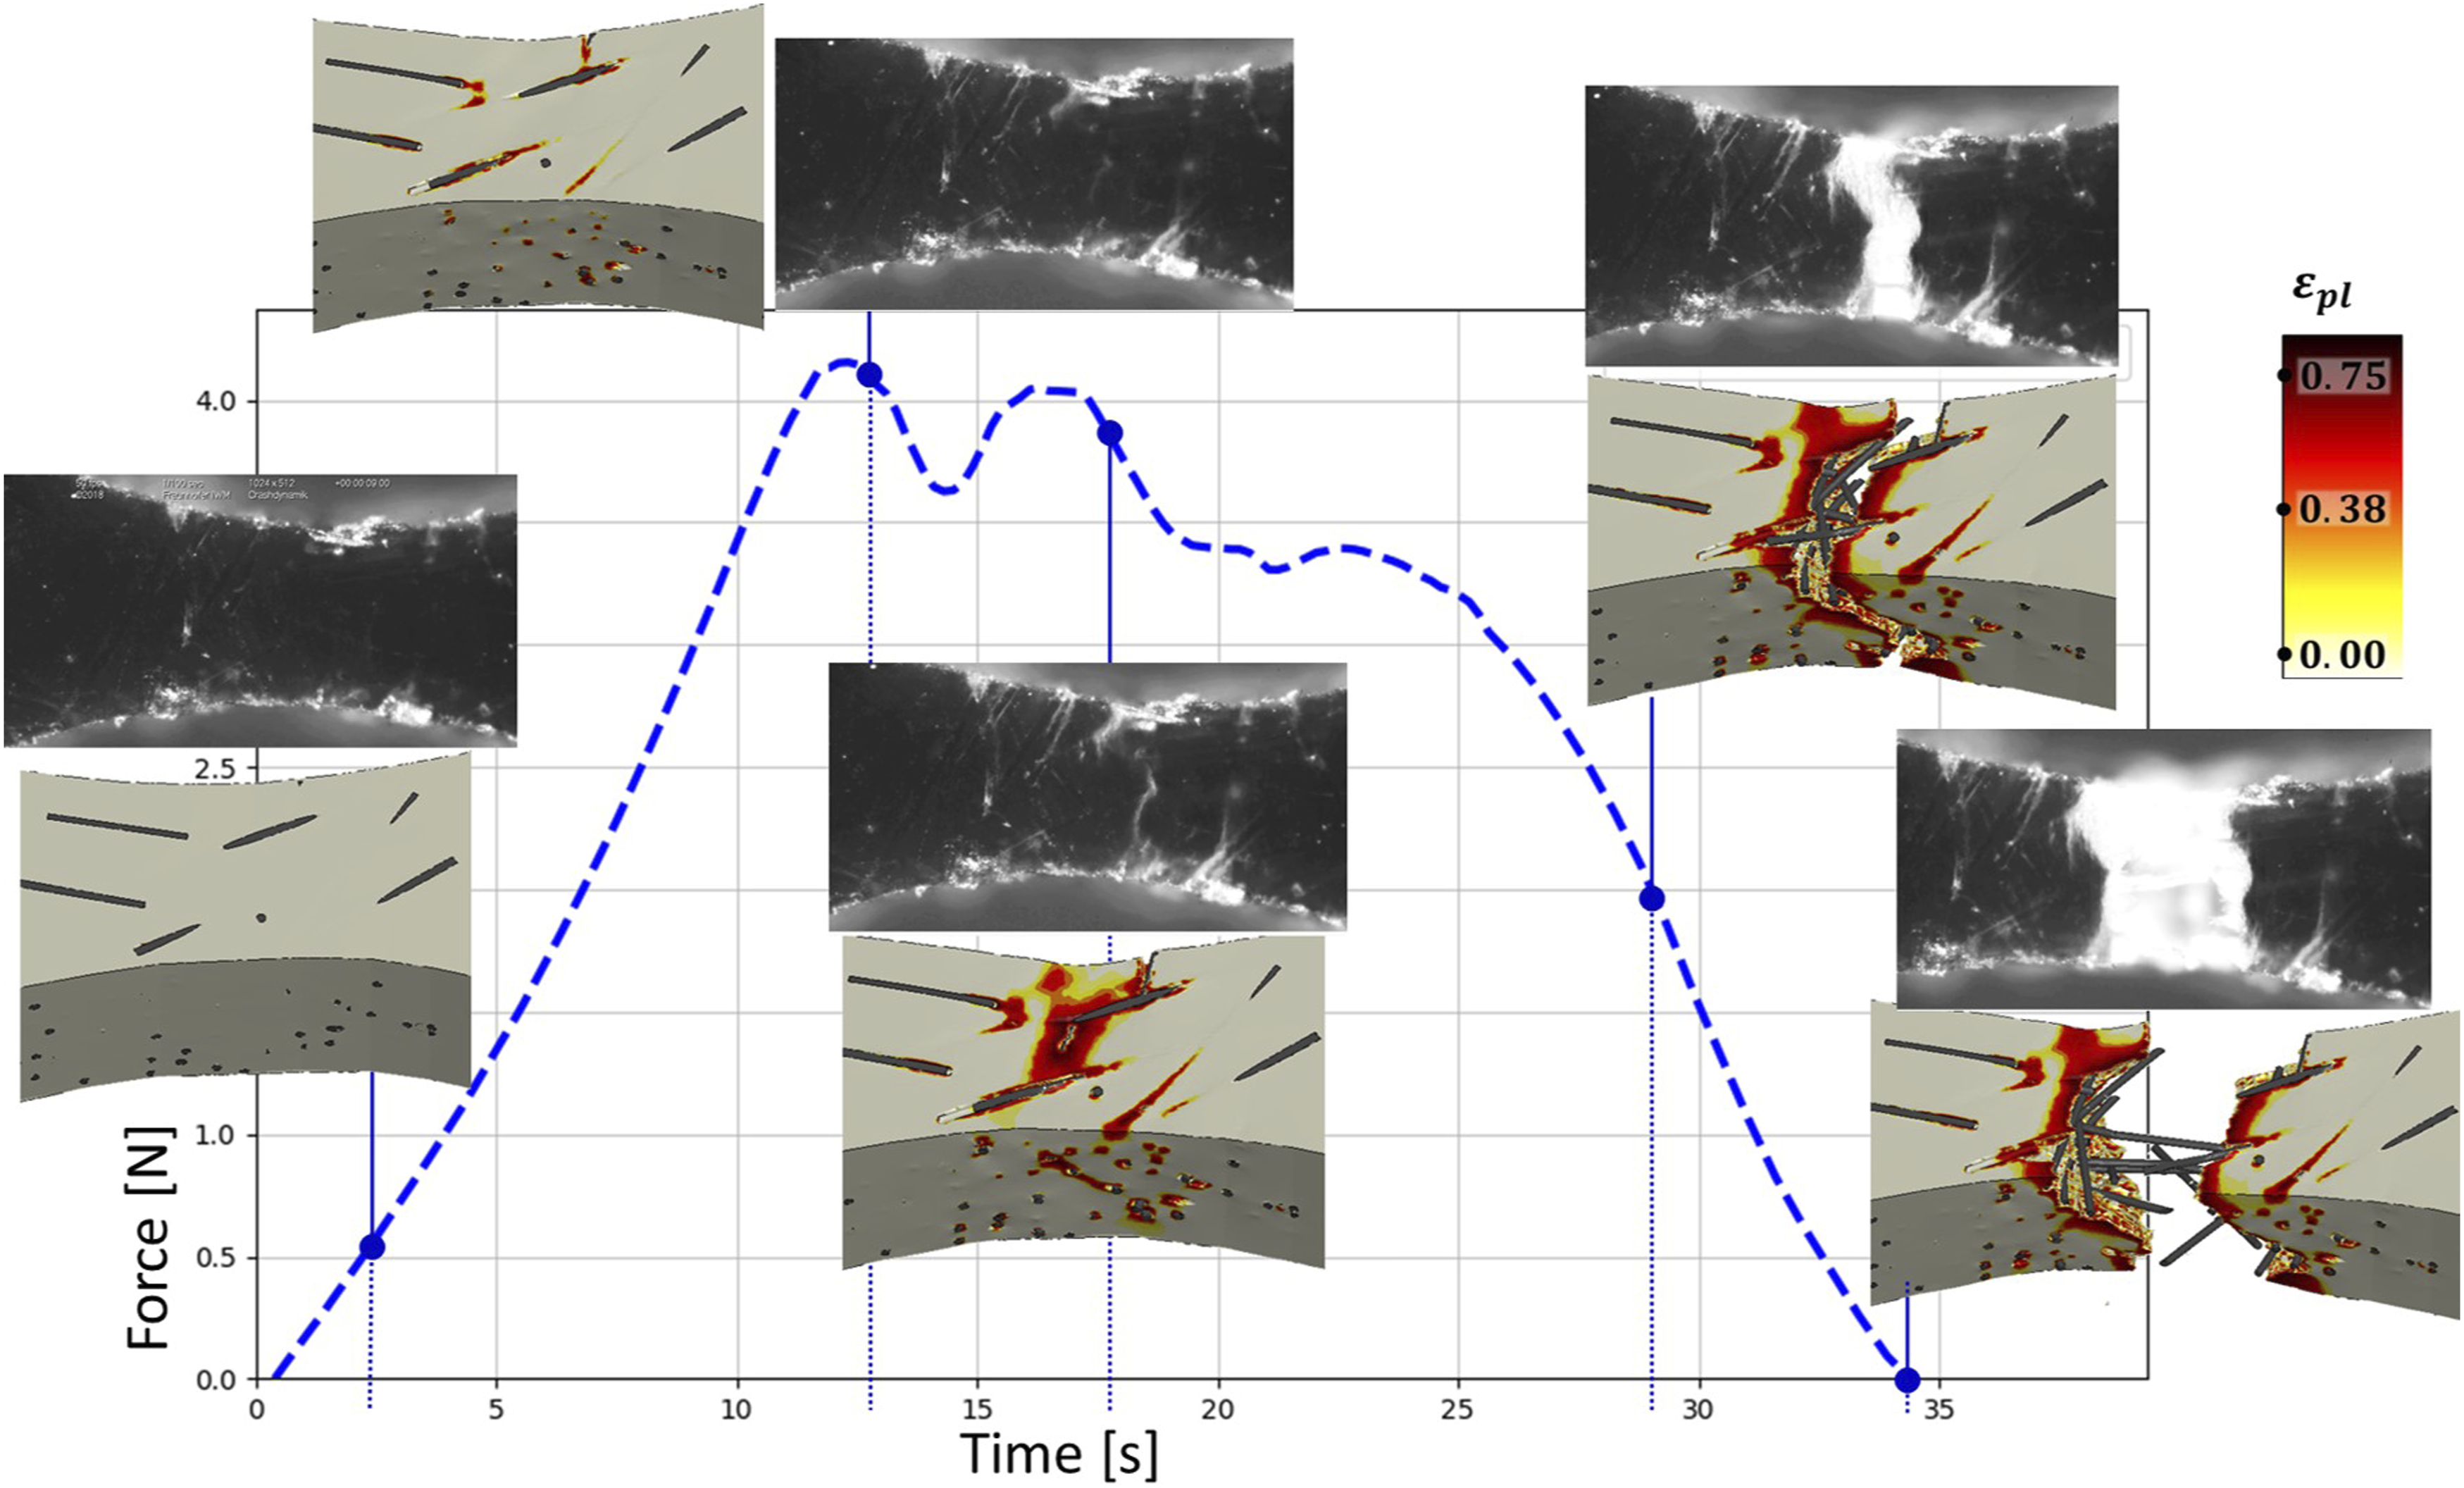
The dynamic loading is displayed analogously in Figure 14. Here at the maximal force at 0.0005 s a significant irreversible strain has occurred. This is even more pronounced in the experiment than numerically. In the simulation some fibers in the middle of the specimen are at this point detached from the matrix. But after a force drop at 0.0009 s the material is still able to carry a high load. In a large part of the specimen the plastic strain grows until the force decades continuously at 0.0018 s. The simulated development of the plastic strain applying a dynamic load compared with the dynamic experiment and assigned to the points in the force vs time graph.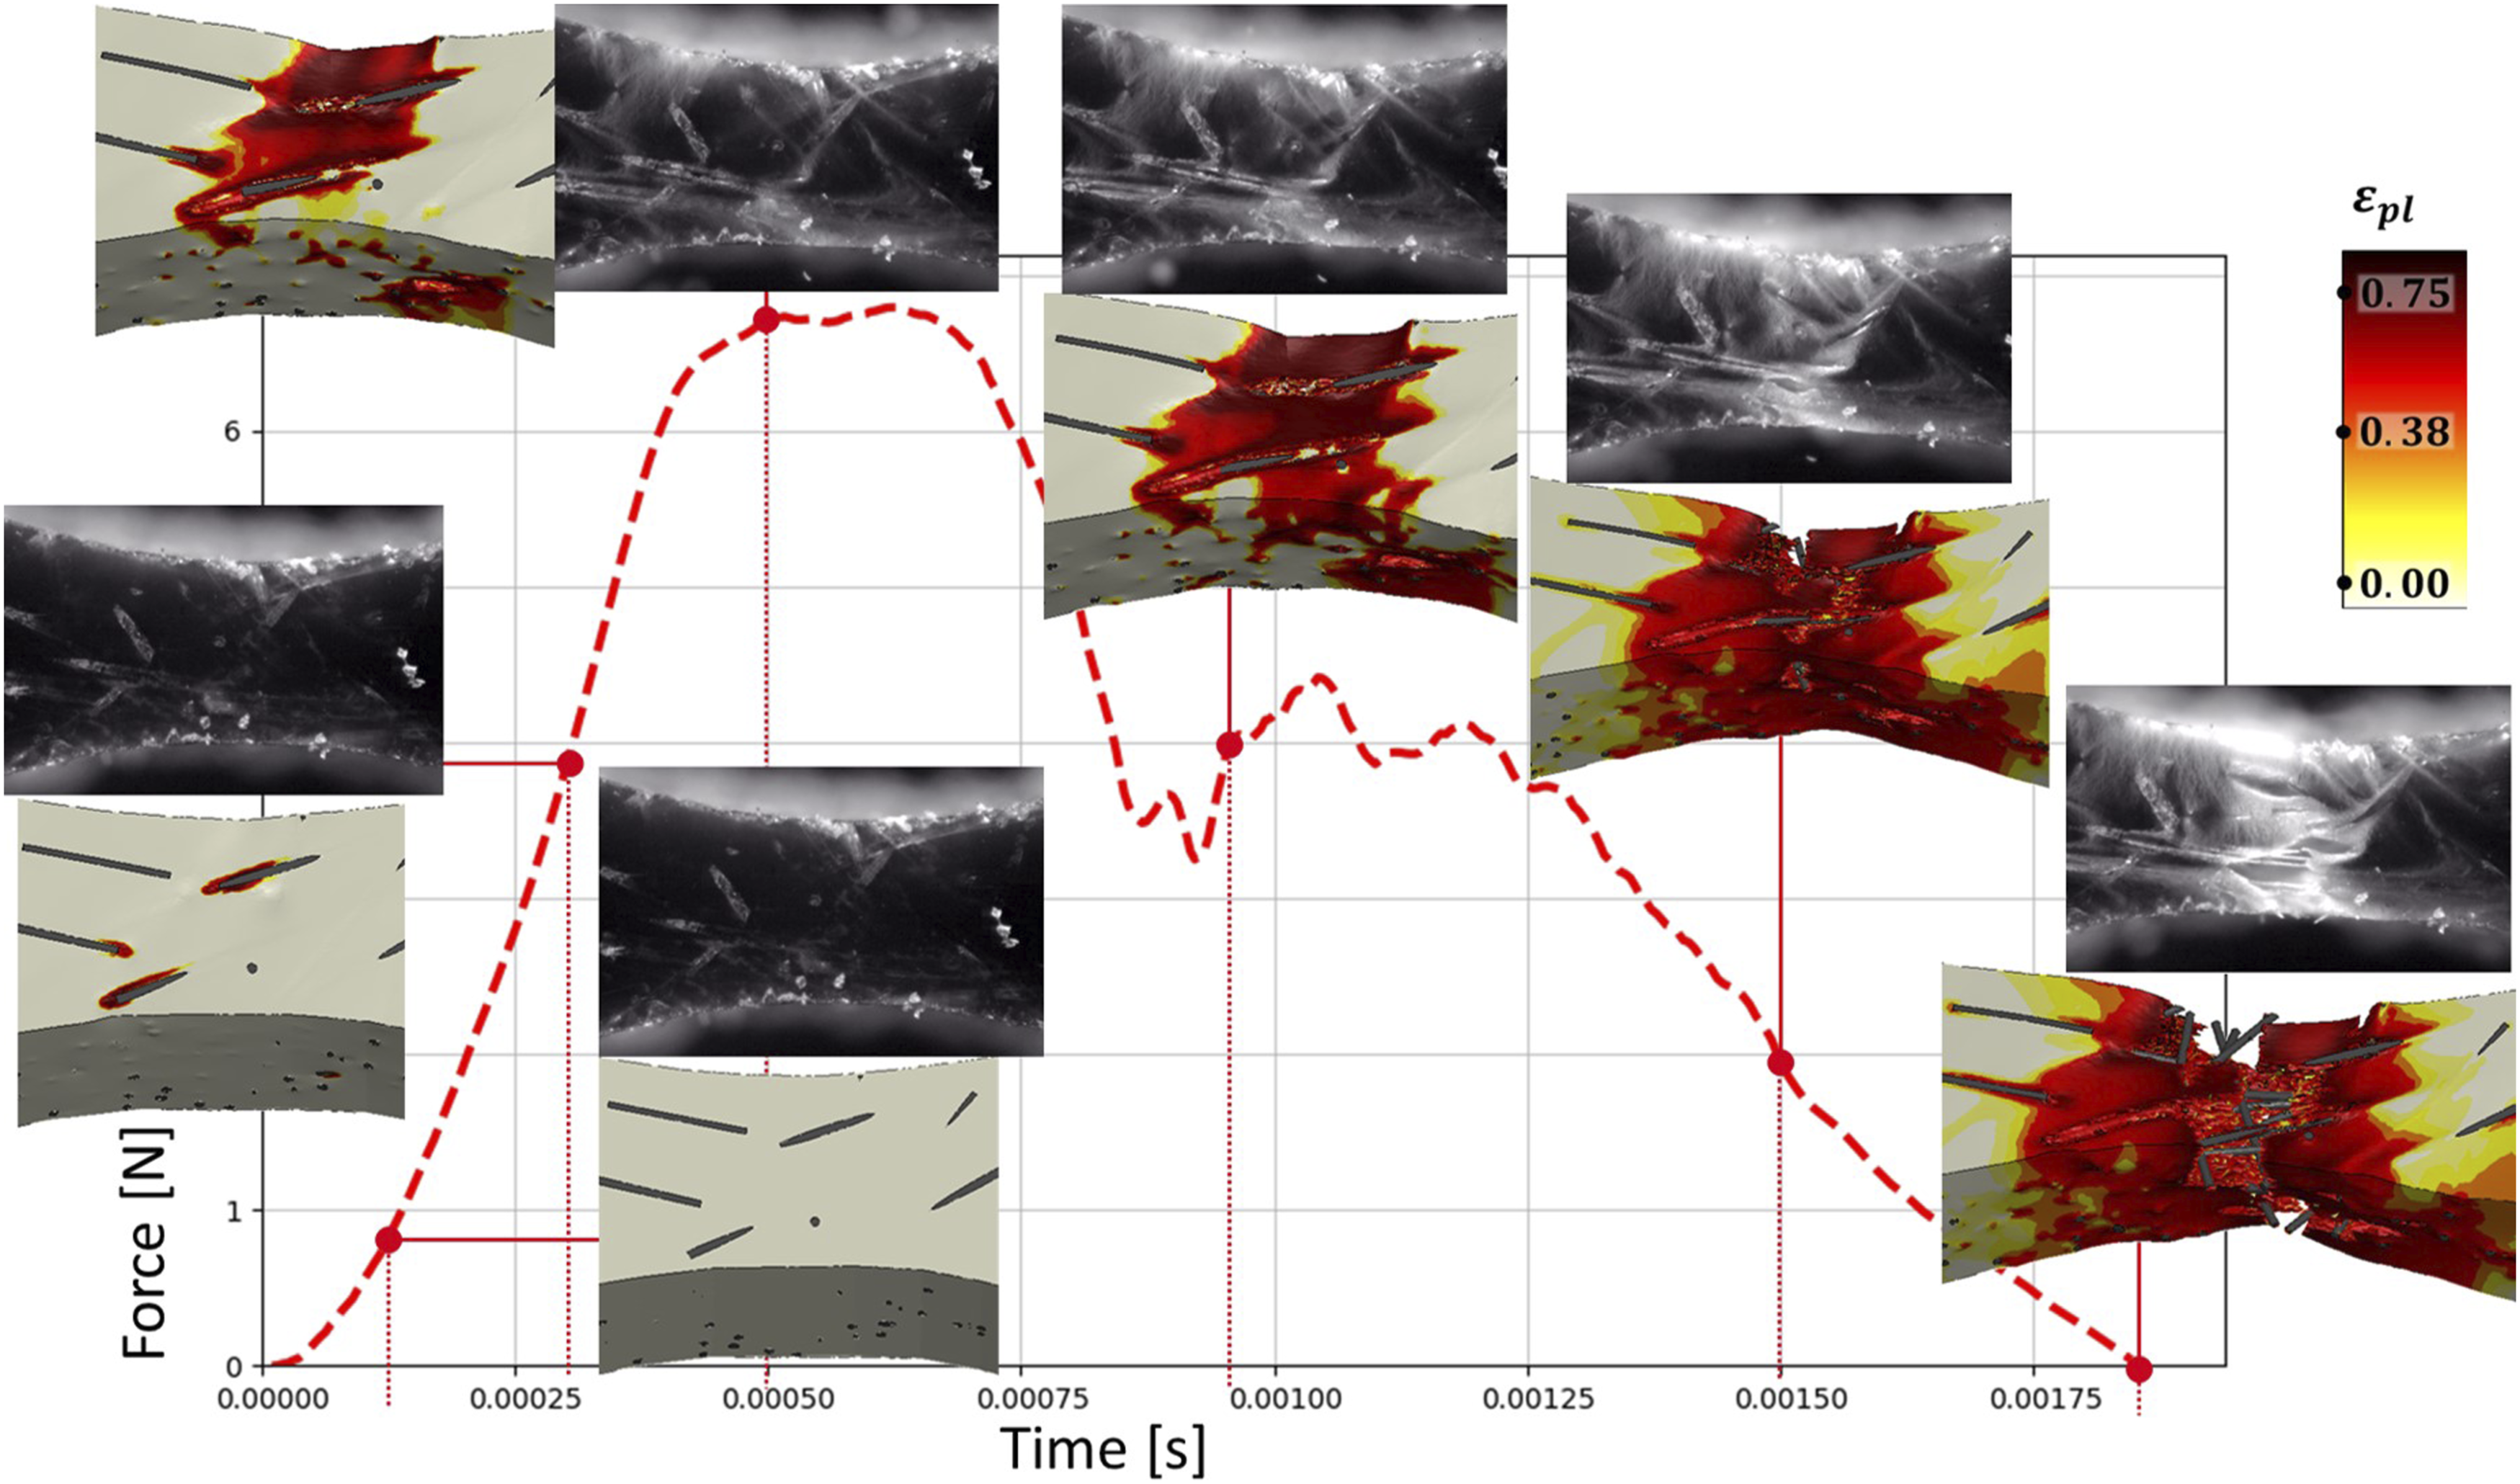
At fibers on the specimen surface (see Figure 15) the micromechanical behavior can be observed. Quasi-statically the deformation is strongly localized near the fiber and delamination occurs early. In contrast dynamically the cohesive zone only fails at the end of the fiber and the distortion is transferred by the fiber into larger regions of the matrix. The simulated mechanical behavior close to a fiber at the surface of the specimen with early detachment quasi-statically (above) and little detachment with dynamic strain rates but a transfer of the strain instead (below).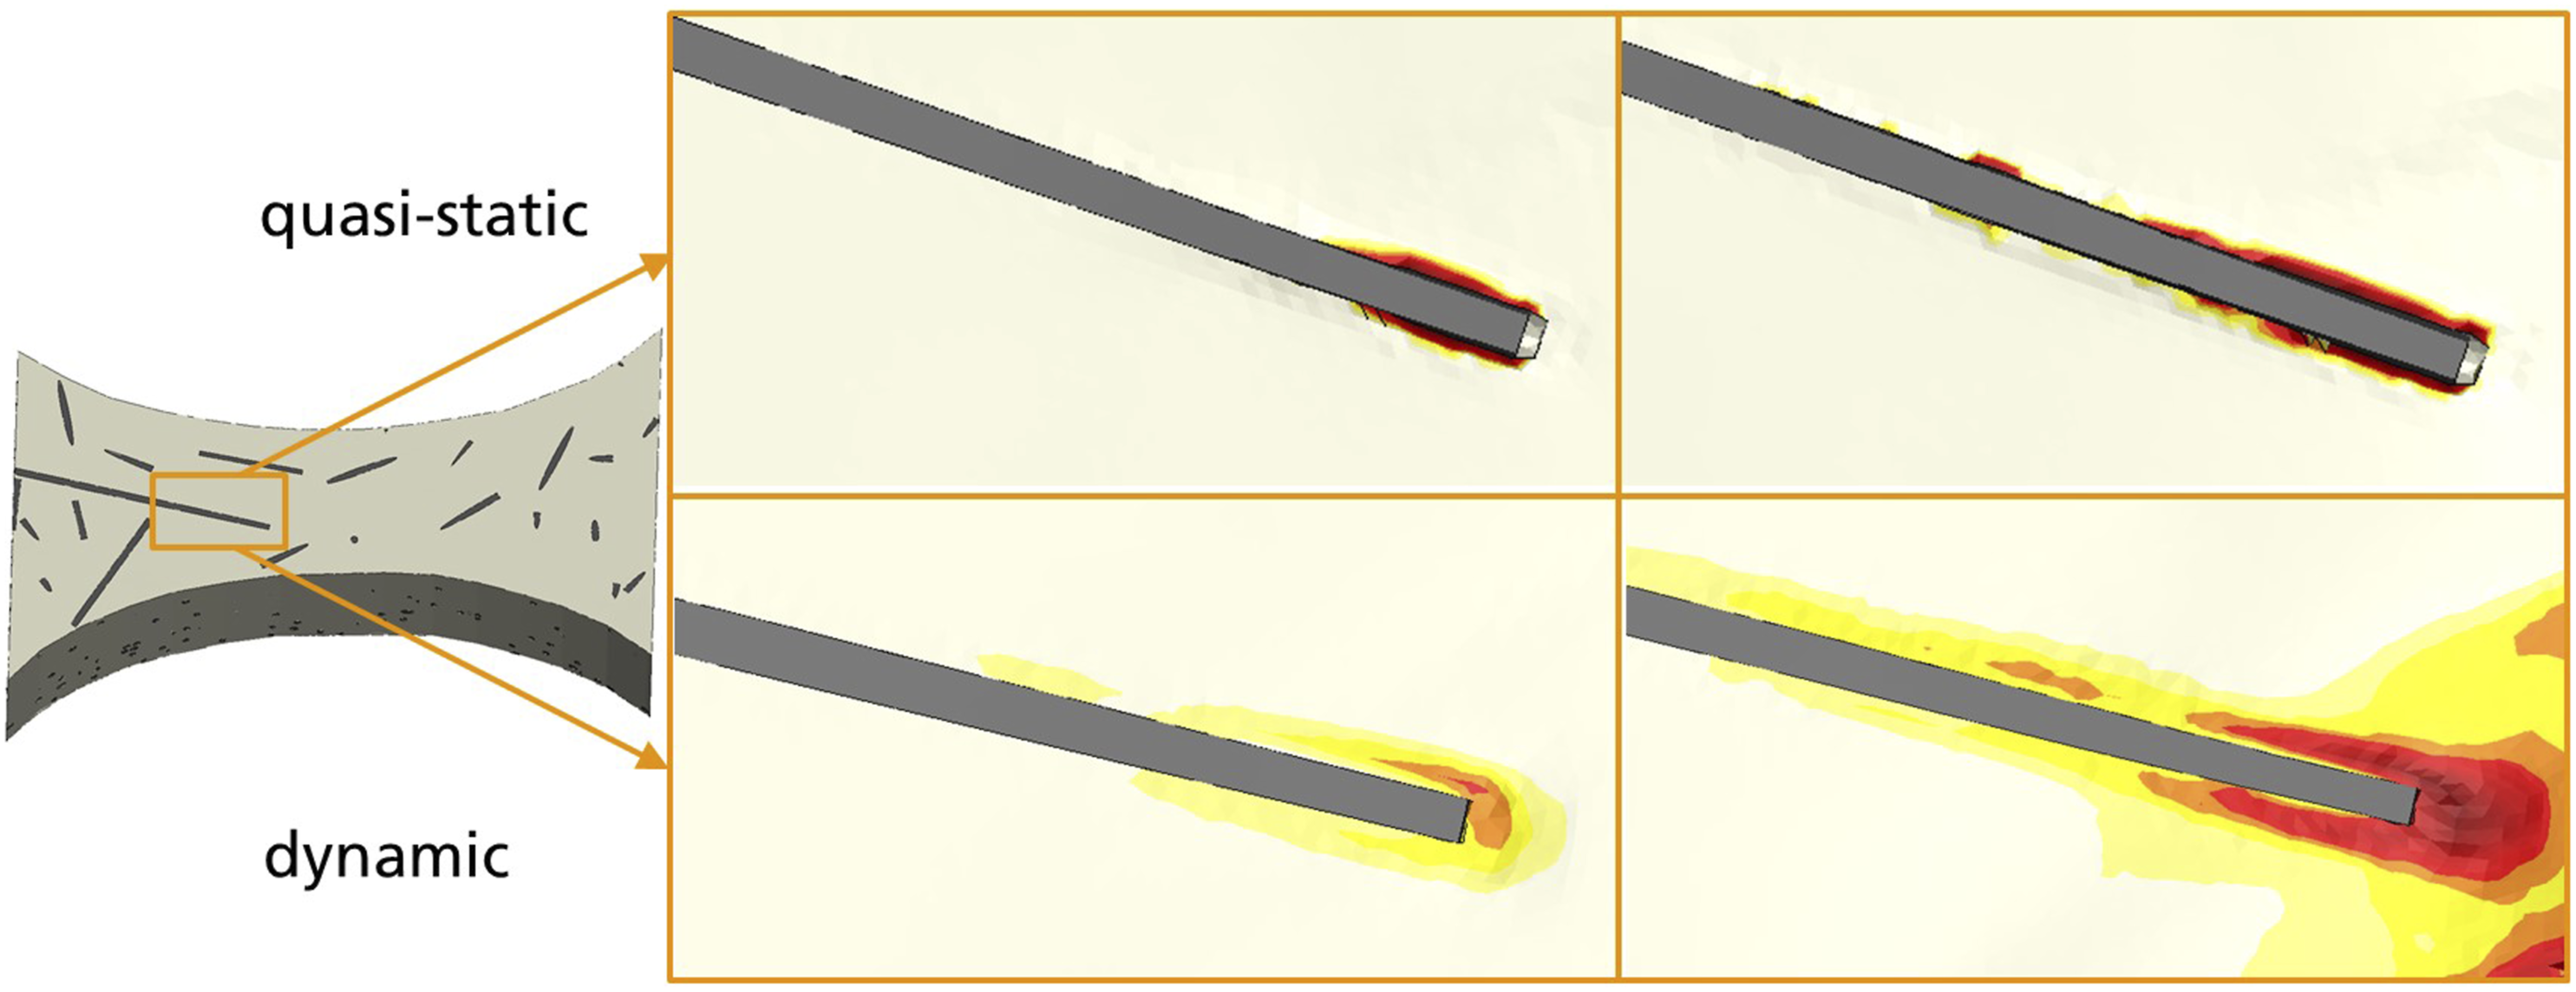
In Figure 16 (upper) a pulled-out fiber after the simulated specimen test can be seen. With a slow load the model predicts all polypropylene to be removed. On the contrary, when applying large strain rates residuals can be found on the fibers, because the boundary layer fails later, and the crack propagates through the matrix. This effect can also be observed on real specimens with a scanning electron microscope on the fracture surface (Figure 16, lower), which again demonstrates the predictive nature of the model. The fiber pull-out simulated (above) and compared with experimental electron microscope scans (below) with little to no residuals on the fiber at quasi-static test (left) and remaining polypropylene dynamically (right).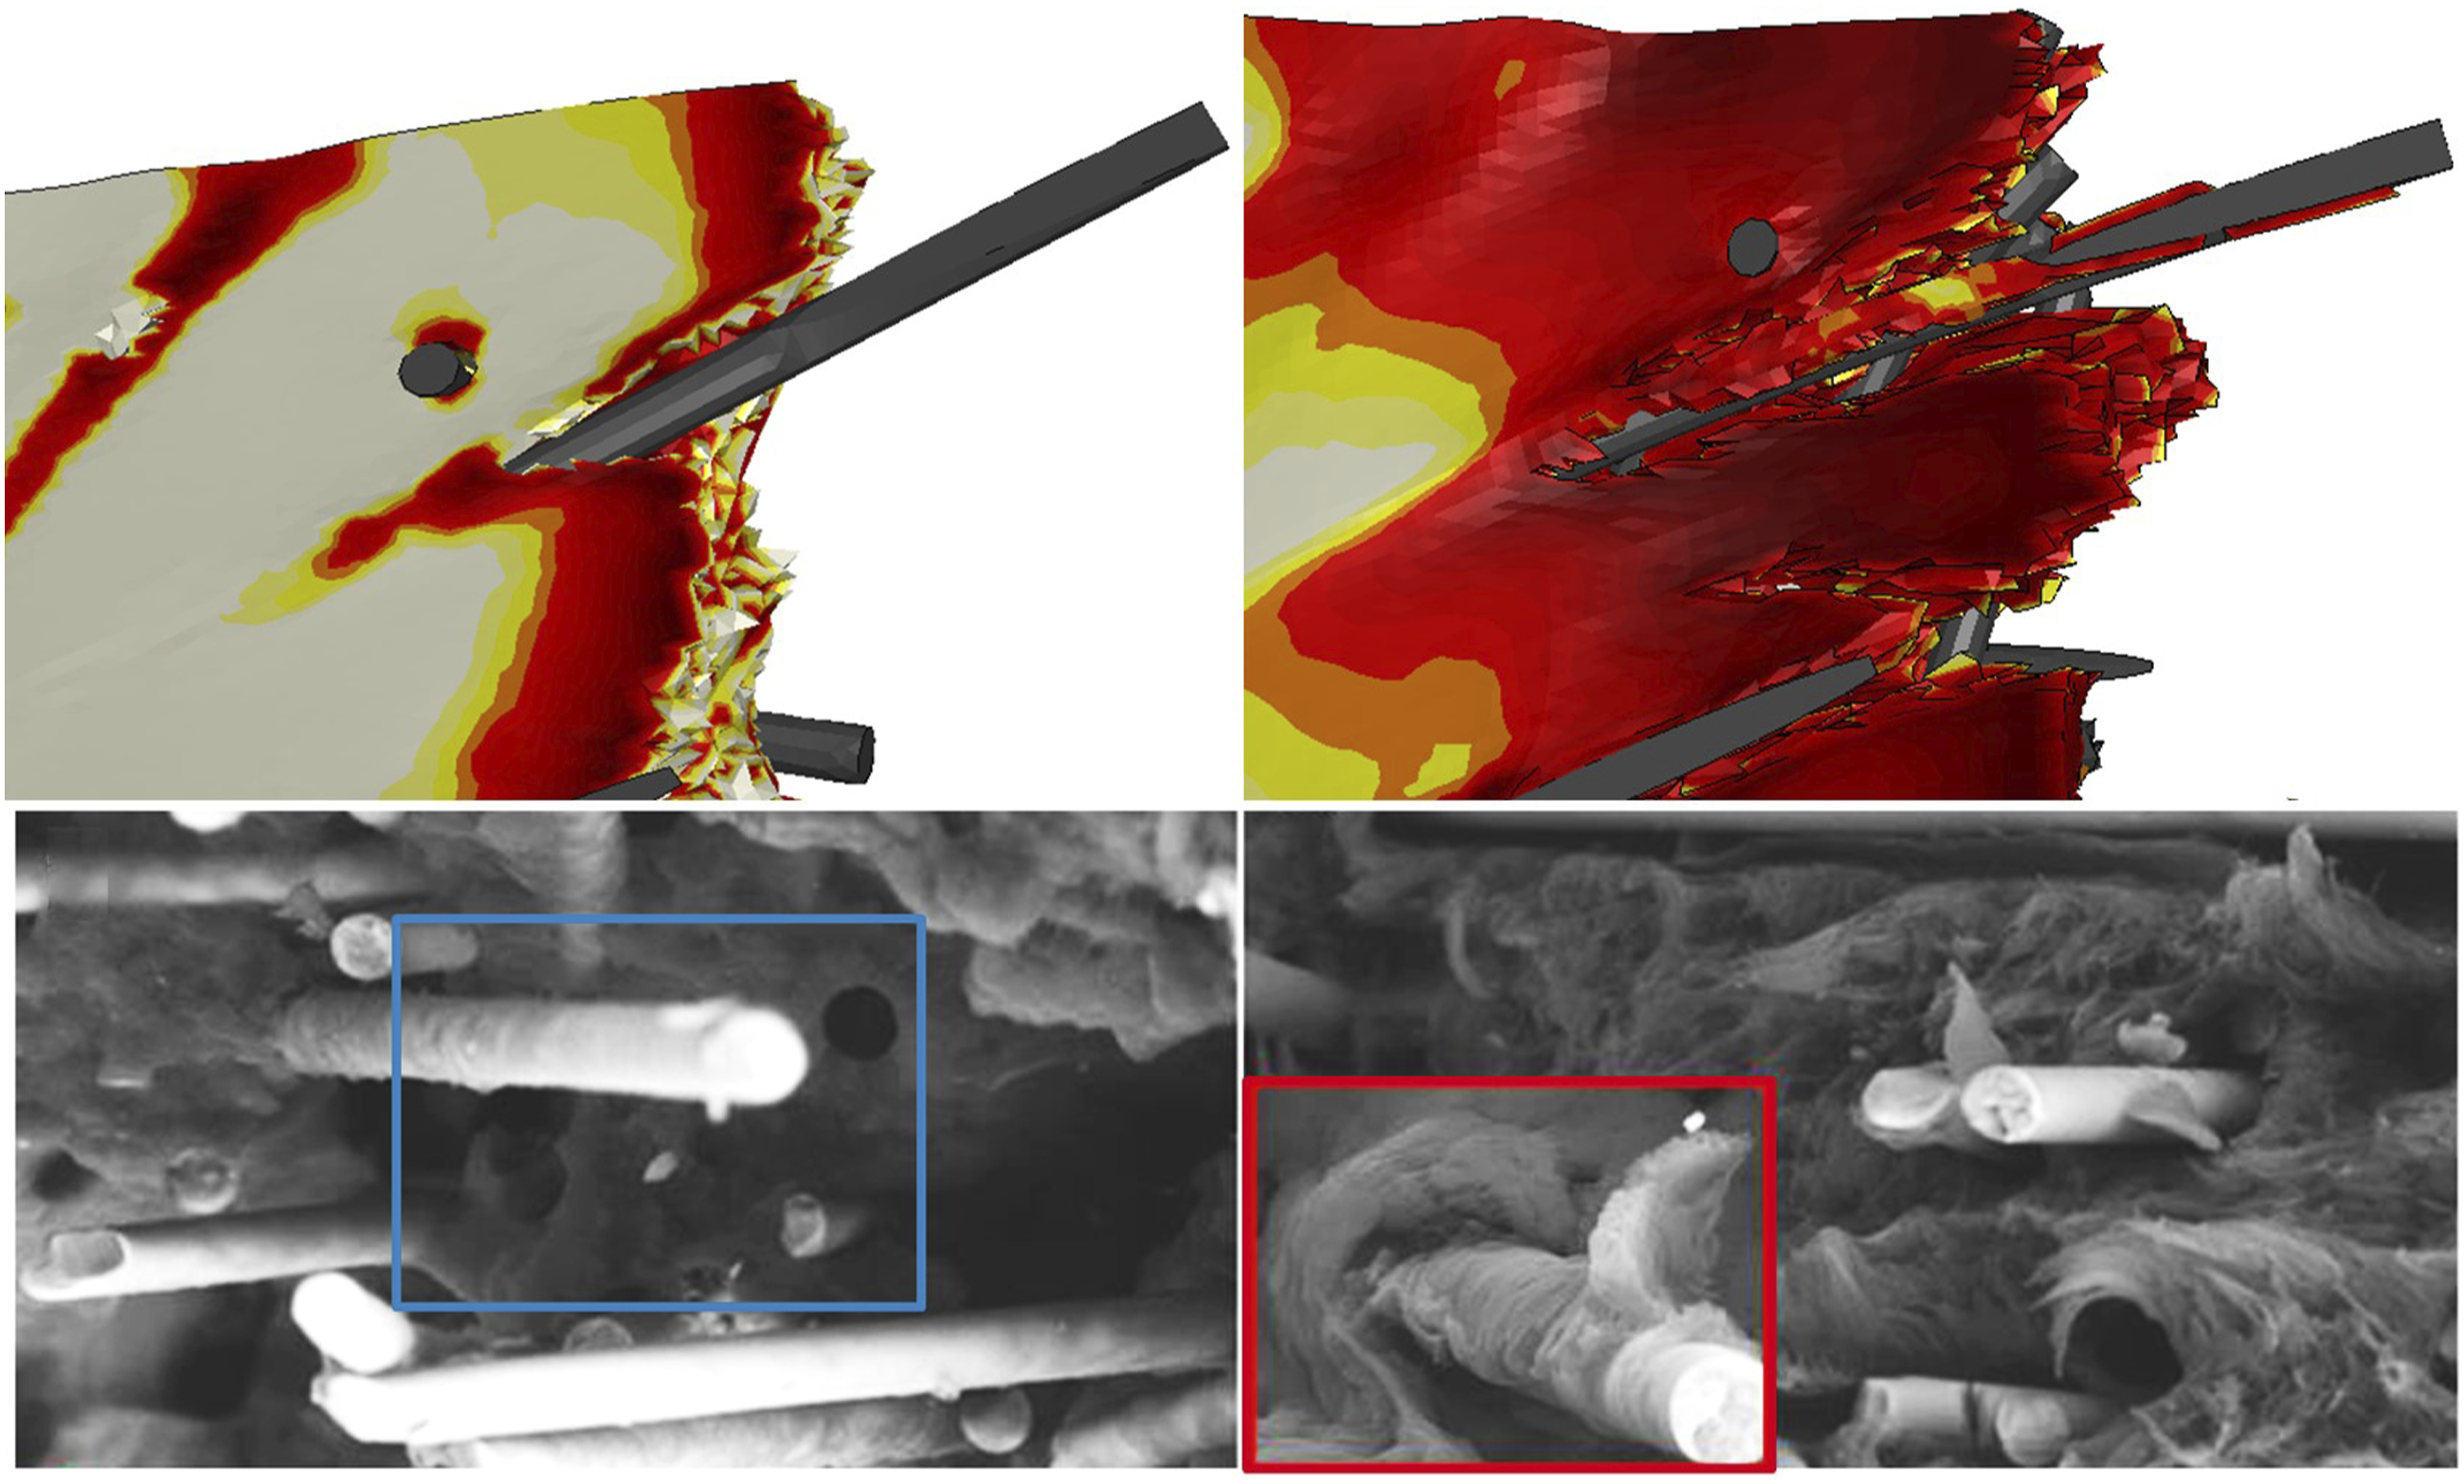
Quantitative results of dynamic failure
After analyzing the strain distribution in the specimen, in the following the global material behavior shall be discussed to further verify the model’s accuracy. In Figure 17 the simulative and experimental forces at both strain rates are given versus the time (left) and versus the global deformation (right). The simulated global forces over time (left) and global displayed (right) by dashed lines in comparison with the experimental curves by solid lines.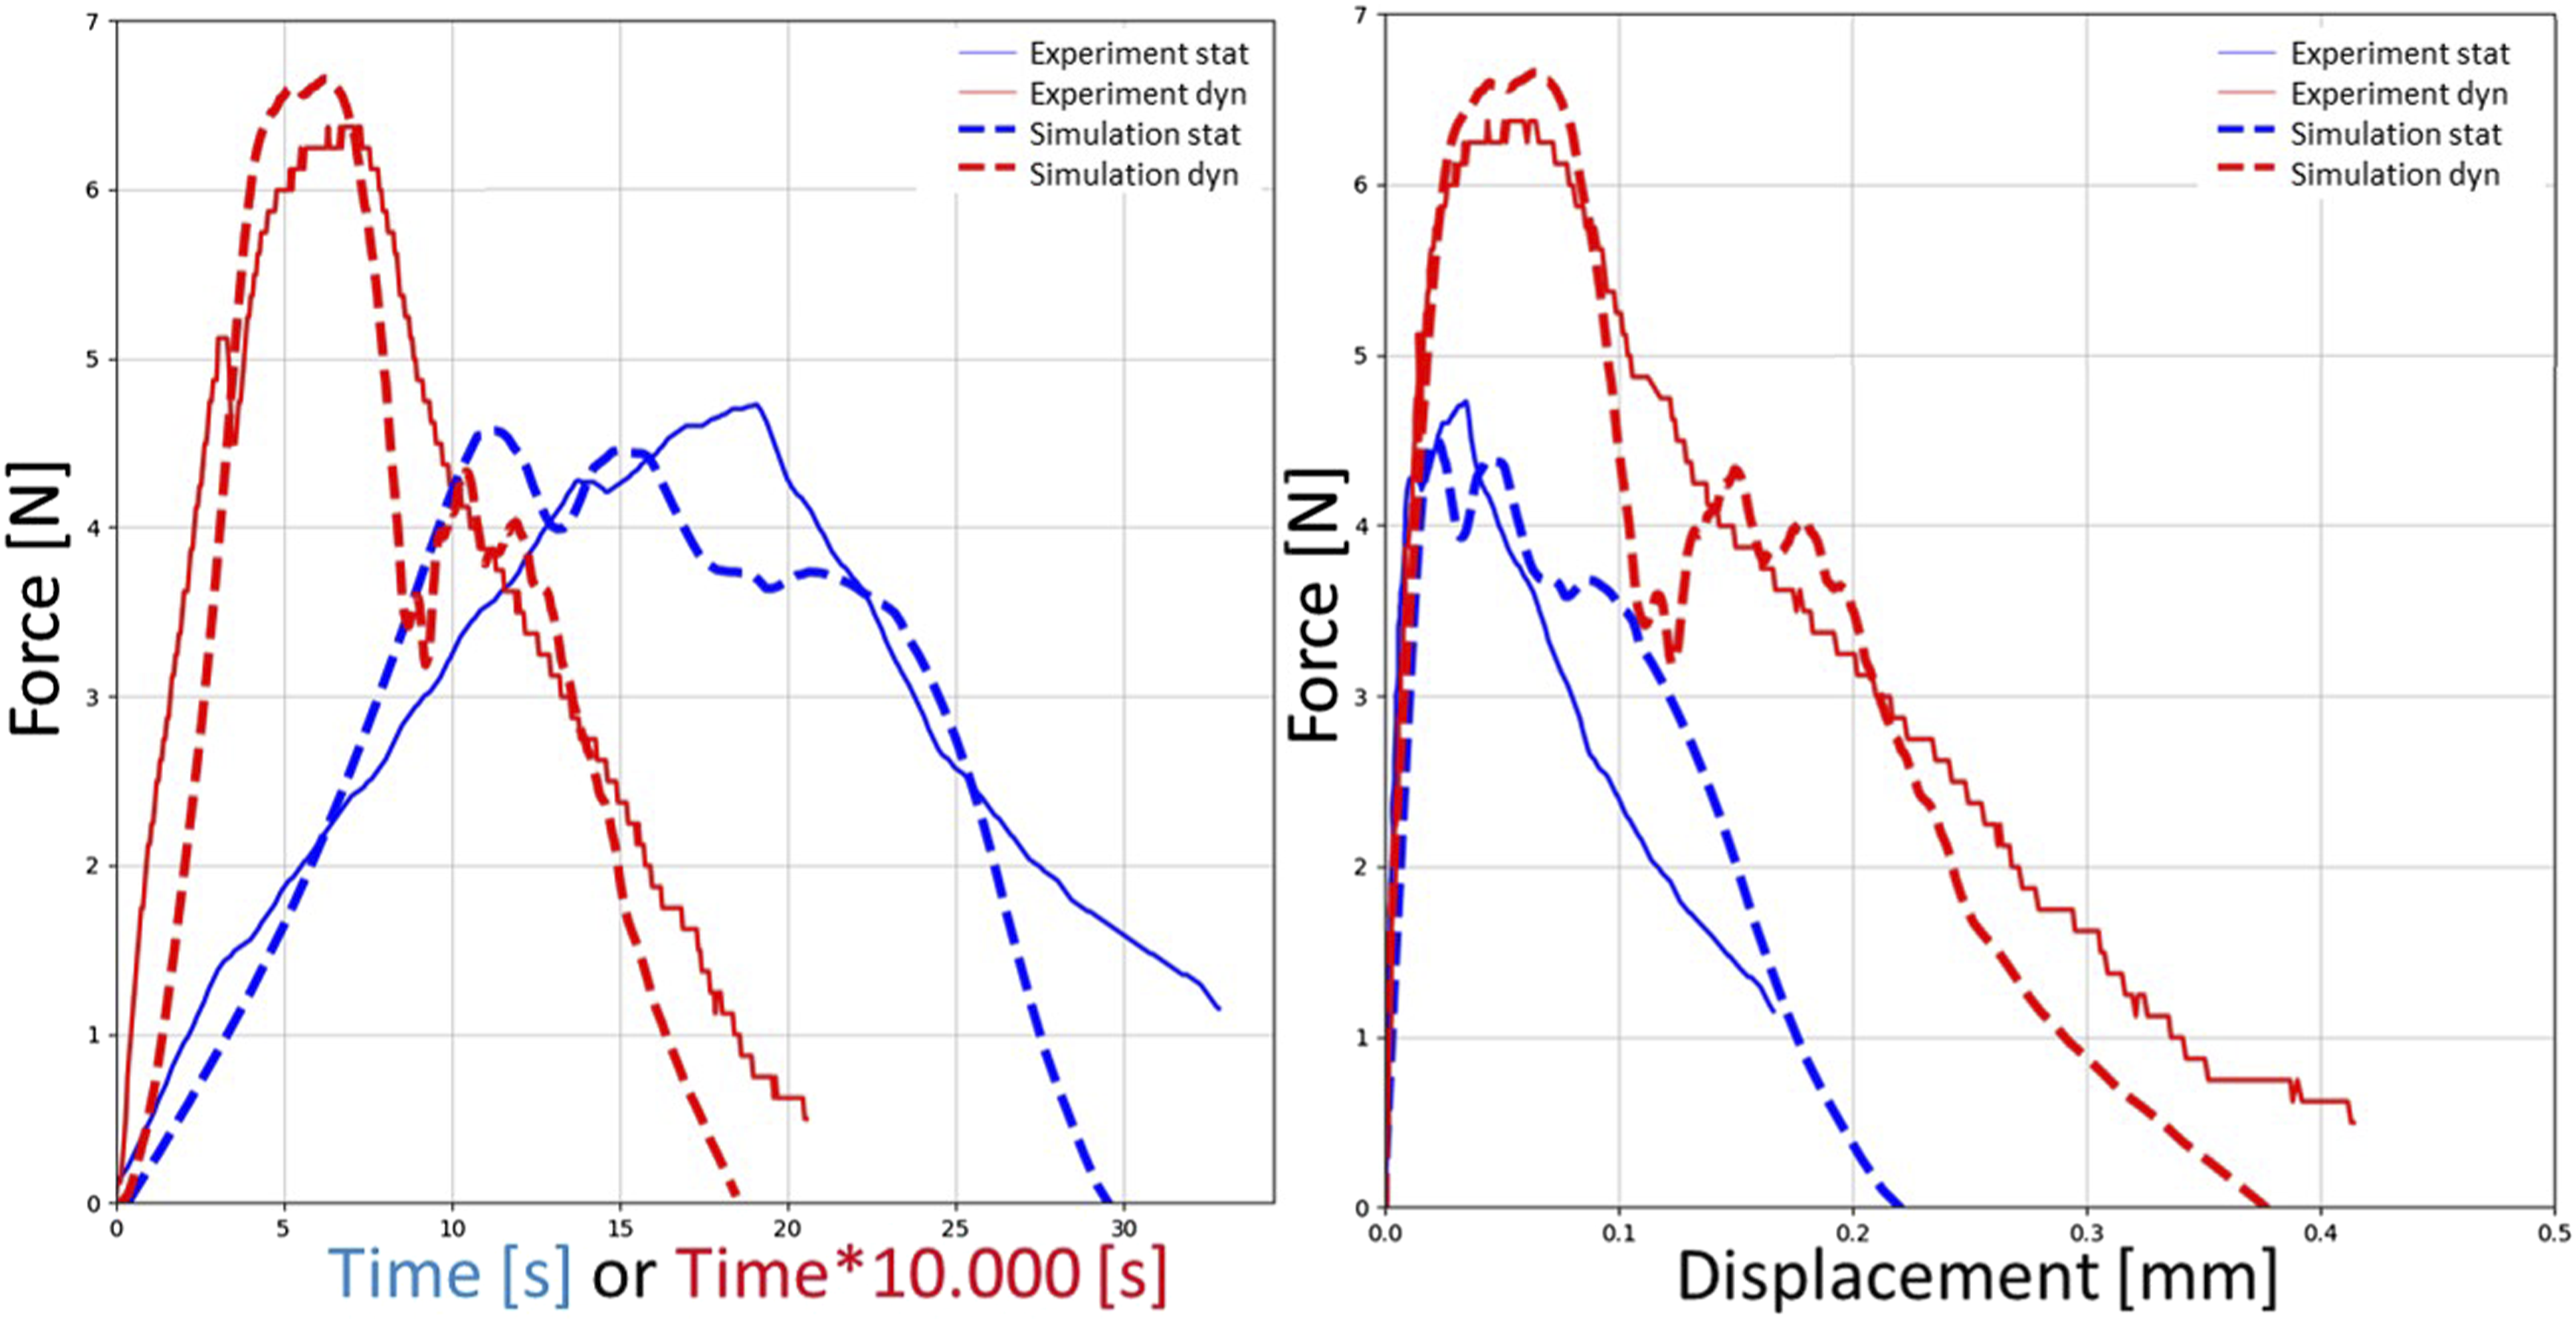
The main deviation between the numerical prediction and the experimental findings shows up in the quasi-static force–time curves. While with the simulation model a continuous rise until the maximal force is predicted, the experimental graphs have different gradients throughout, suggesting earlier micro-cracks and local failure. The applied deformation velocity stays constant until the maximal force in the experiment and simulations likewise. In the numerical model local stress peaks homogenized due to a finite mesh resolution. Hence delamination occurs later.
Analyzing the force–displacement curves, it can be seen the initial stiffness, the maximal force, and the displacement at complete failure match for both strain rates. The correct prediction of the strain rate dependency further validates the established modelling method. Especially its transferability to real fiber distributions.
The force drop is predicted slightly too rapid and the friction during the fiber pull-out is here underestimated. As failure occurs in the matrix the elements are deleted, which leads to less contact between the components. This difference could be reduced using a damage model with a coupling between stress and damage and an increase in the failure strain. Thereby, the failure would still occur but could be modeled to be not as rapid.
Lastly, the hypothesis from the introduction of a strain rate independent distortion energy density at failure shall be examined. Integrating the force–displacement curves the distortion energy is calculated (see Figure 18). It is dynamically about twice as high as quasi-statically, which is similar to the ratio of deformed volume, as discussed before. The numerical (dashed lines) and experimental (solid lines) distortion energy (left) and the distortion energy density (right) over the global displacement.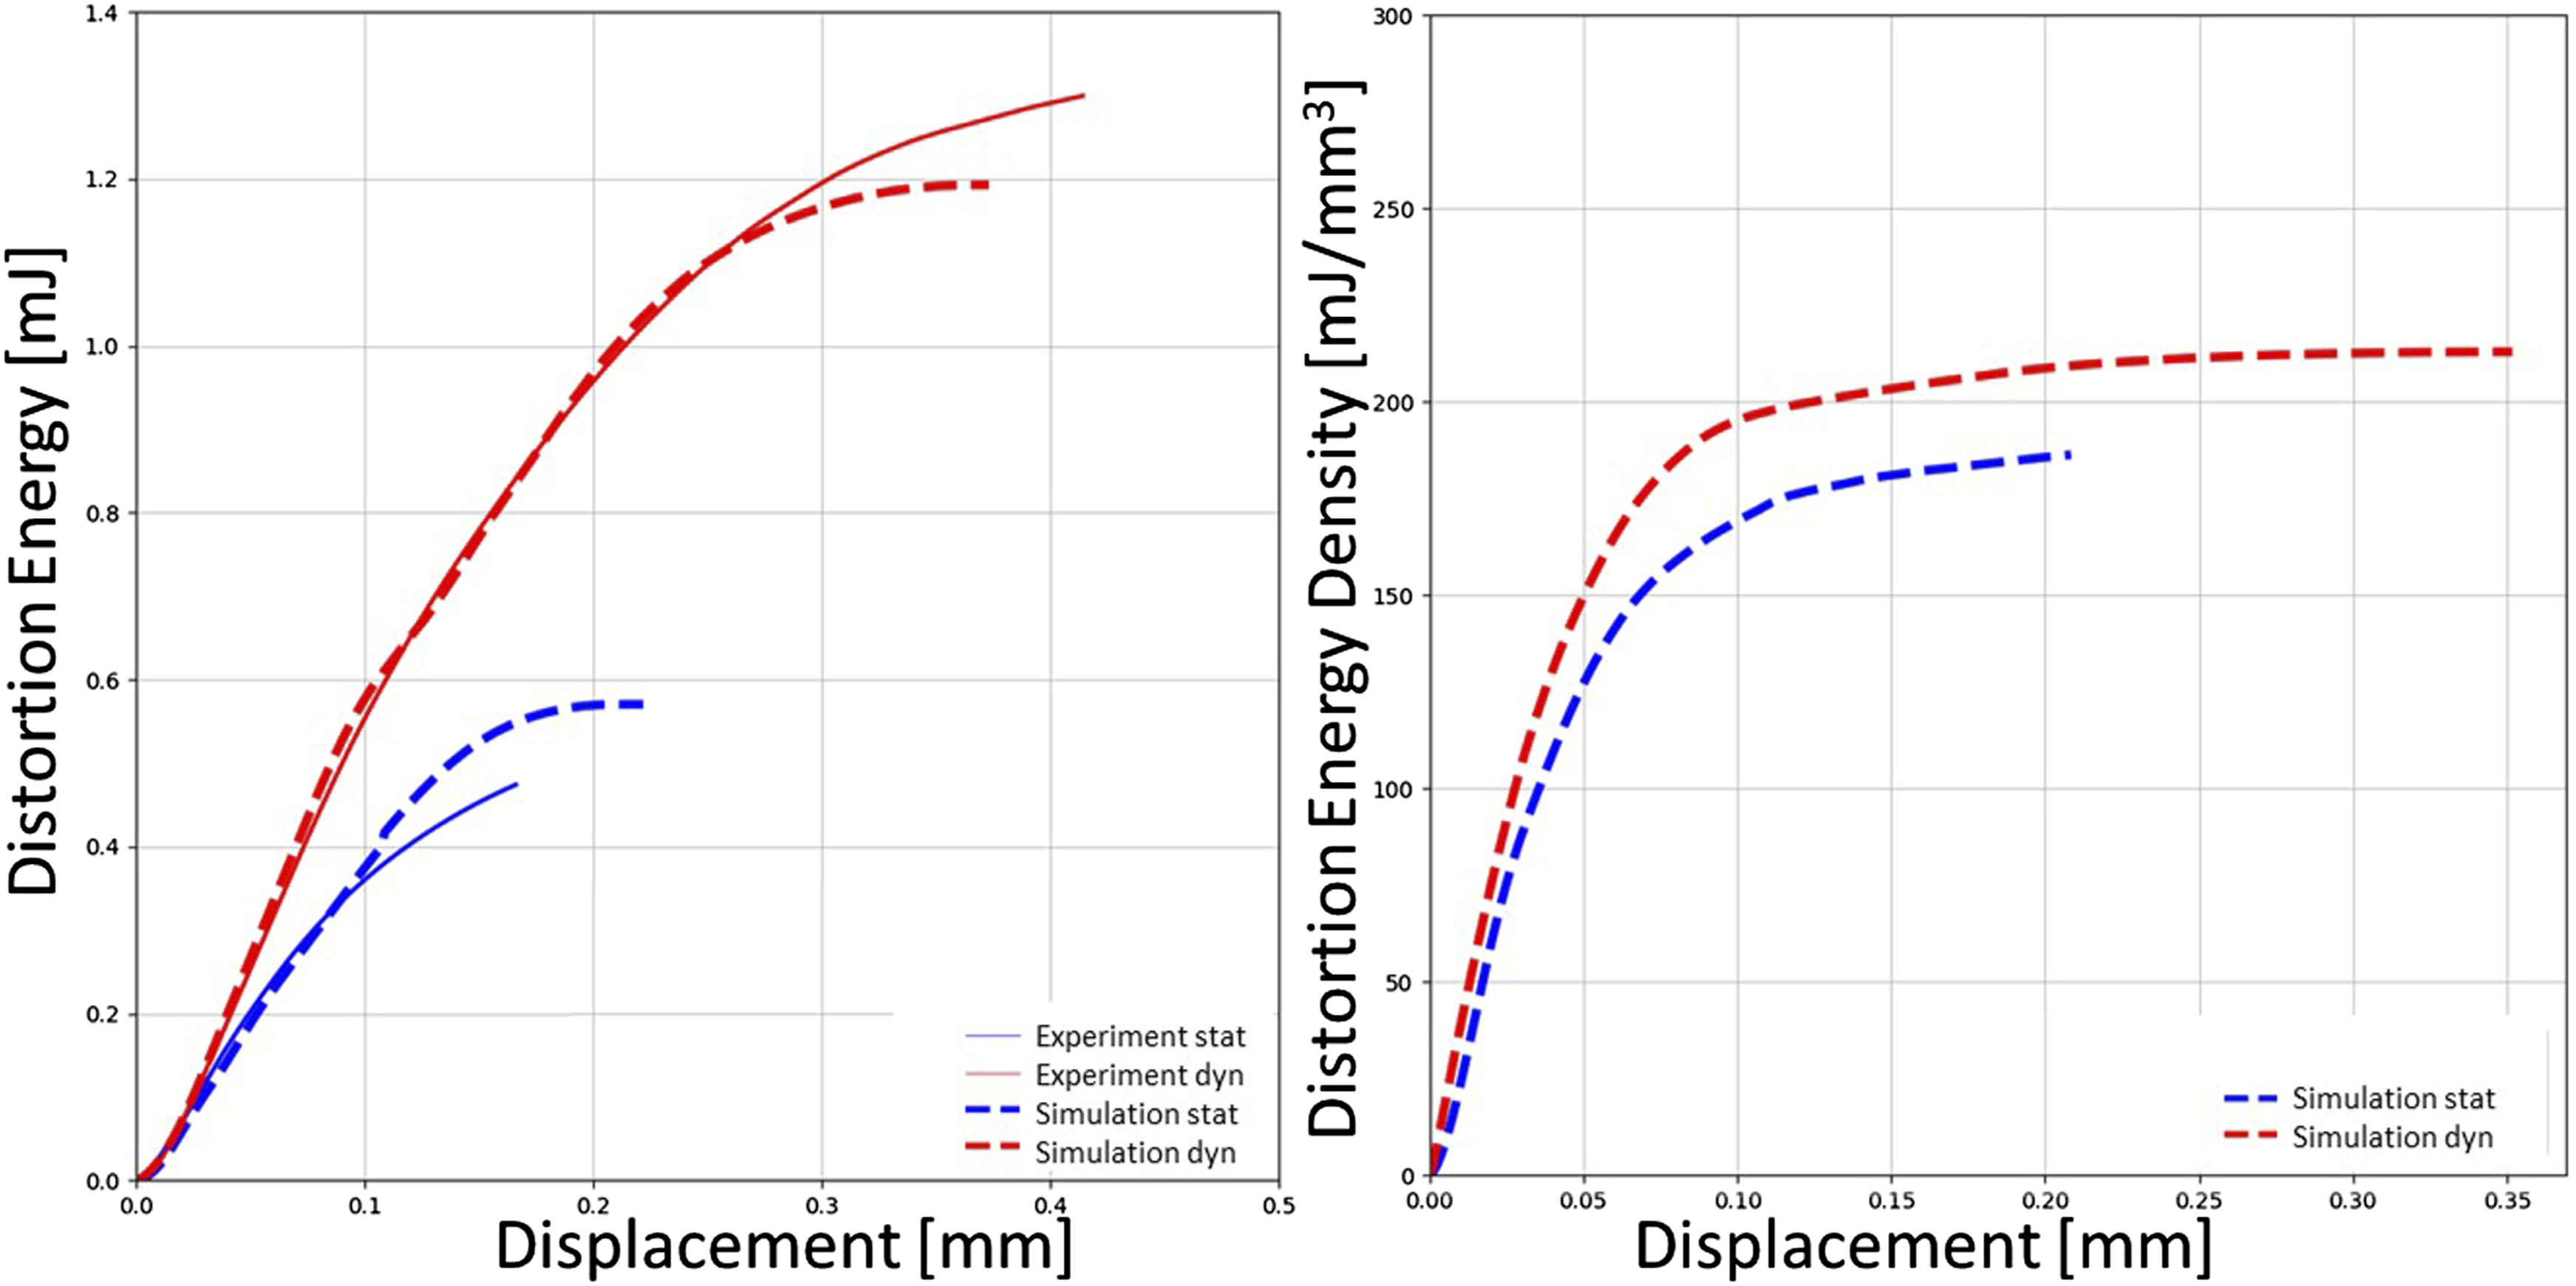
The simulated energies are then normalized to the plastically deformed volume determined from the volume of elements with a plastic strain. This indeed yields comparable distortion energy densities of 186 mJ/mm3 quasi-statically and 213 mJ/mm3 dynamically at failure. The slightly higher value for high strain rates can be traced back to the numerically underestimated deformed volume discussed above. Thus, these calculations substantiate the hypothesis and highlight the possible applications of the established model.
Discussion and outlook
A numerical material model for SFRP was developed, predicting accurately the experimentally observed strain rate dependent distribution of deformation throughout the specimen and the global strain dependent failure. It was possible to match the test results on micro-specimens with material models, which were fitted on characterization experiments of the components from literature.
Representative volume element simulations have been studied to analyze the micro-mechanical effects. It has been shown that it is not possible to recreate the strain rate dependent deformed volume by modelling the matrix with a strain rate dependency, while assuming ideal or strain rate independent adhesion.
Furthermore, neither applying visco-elasticity for the glass fibers, nor varying the plastic flow of polypropylene due to crystallization did yield this behavior. Only by implementing a strain rate dependent decohesion between fiber and matrix did result in a localization of the deformation with a quasi-static load and still a wide strain distribution with a dynamic load. One can conclude that the strain rate dependent interface behavior plays a major role in the microscopic failure mechanism of SFRPs and is the driving force of the strain rate dependent deformed volume.
The findings are validated by simulation of micro-specimen tests with the real fiber distribution. Thereby, numerical and experimental results are in good agreement quasi-statically. The model slightly underestimates the strain rate effect and produces dynamically a strain distribution not as widely distributed as in the experiments. This might have its origin in the lack of a precise value of the dynamical delamination in literature. Performing fiber push-out or pull-out test at high strain rates, though not easy to execute, would remove this obstacle.
With the established model the distortion energy density could be analyzed, integrating the force over displacement, and normalizing it on the current deformed volume. The present results indicate that the distortion energy density is independent of the strain rate. But this is only tested on two distinct strain rates and should be verified at intermediate velocities.
Additionally, it must be noted that the failure is studied here merely under uniaxial tension. In tests by Lienhard. 33 the strain rate dependent deformed volume is observed under shear deformation as well. But different stress states might lead to different distortion energy densities. This effect is not yet studied well enough for a conclusion.
As the presented failure model and the resulting strain rate dependent deformed volume is based purely on the micro-mechanism of strain rate dependent decohesion, it is reasonable to assume its occurrence in any SFRP with boundary layers of the same behavior. But for fiber-matrix combinations with other decohesion properties this might not be the case. Thus, the transferability to other materials must be considered individually.
Yet the presented results suggest the distortion energy density to be an accurate quantity to predict the failure of SFRP. This quantity could be incorporated into a homogenized material model, with very few parameters, enabling a highly efficient method for simulation larger injection molded parts. For this the composite failure model would need to approximate the deformation distribution and consider strain rate dependent delamination. But this would be subject of a future paper.
Footnotes
Declaration of Conflicting Interests
The author(s) declared no potential conflicts of interest with respect to the research, authorship, and/or publication of this article.
Funding
The author(s) disclosed receipt of the following financial support for the research, authorship, and/or publication of this article: This work has been funded by the AiF program of the BMWi for collaborative industrial research (grant no. IGF-No. 20418 N), a research association for vehicle engineering (Forschungvereinigung Automobiltechnik e. V. (FAT), Behrenstrasse 35, 10117 Berlin). The author(s) received no financial support for the research, authorship, and/or publication of this article.