
Abstract
A failure model for SFRP for FEM simulations is developed to describe the strain rate dependency, the influence of the local fiber orientation and of the stress state on the failure behavior. The material is considered as a continuum while internally calculating the micro-mechanics analytically. The described micro-mechanics are based on experimental observations and on analyzation with numerical studies. In particular the strain rate dependent delamination of fibers and matrix is incorporated in the model. The distortion energy density is defined as the driving value for failure and estimated by the model. This is achieved with the analytic solution by Eshelby for the stress field in the matrix and by introducing an additional phase for the plasticly deformed volume. The validation on characterization specimens as well as component test demonstrates that the influence of strain rate, fiber orientation, and stress state on the failure behavior can be described with only one material parameter, the critical distortion energy density.
Introduction
The importance of short fiber reinforced plastics (SFRPs) and their modelling in regards of crash safety has undergone a great increase in the last years in the automotive and aviation sector on account of lightweight aspects and cost efficiency.1,2 A major hurdle for an increased application even in safety relevant structures is that the prediction of its behavior is complex due to the anisotropy and its dependency on the local fiber orientation, the strain rate, and the stress state. In Figure 1 this is demonstrated by characterization experiments on PP-GF30 displaying the anisotropy, and the influence of the strain rate and the stress state. The experiments were performed by Sun et al.,
3
Sommer et al.
4
and Lienhard.
5
The experimentally observed deformation and failure behavior of glass fiber reinforced polypropylene at different strain rates for uniaxial tensile test in fiber direction and transverse to the fiber direction, shear tests and a punch test for biaxial tension.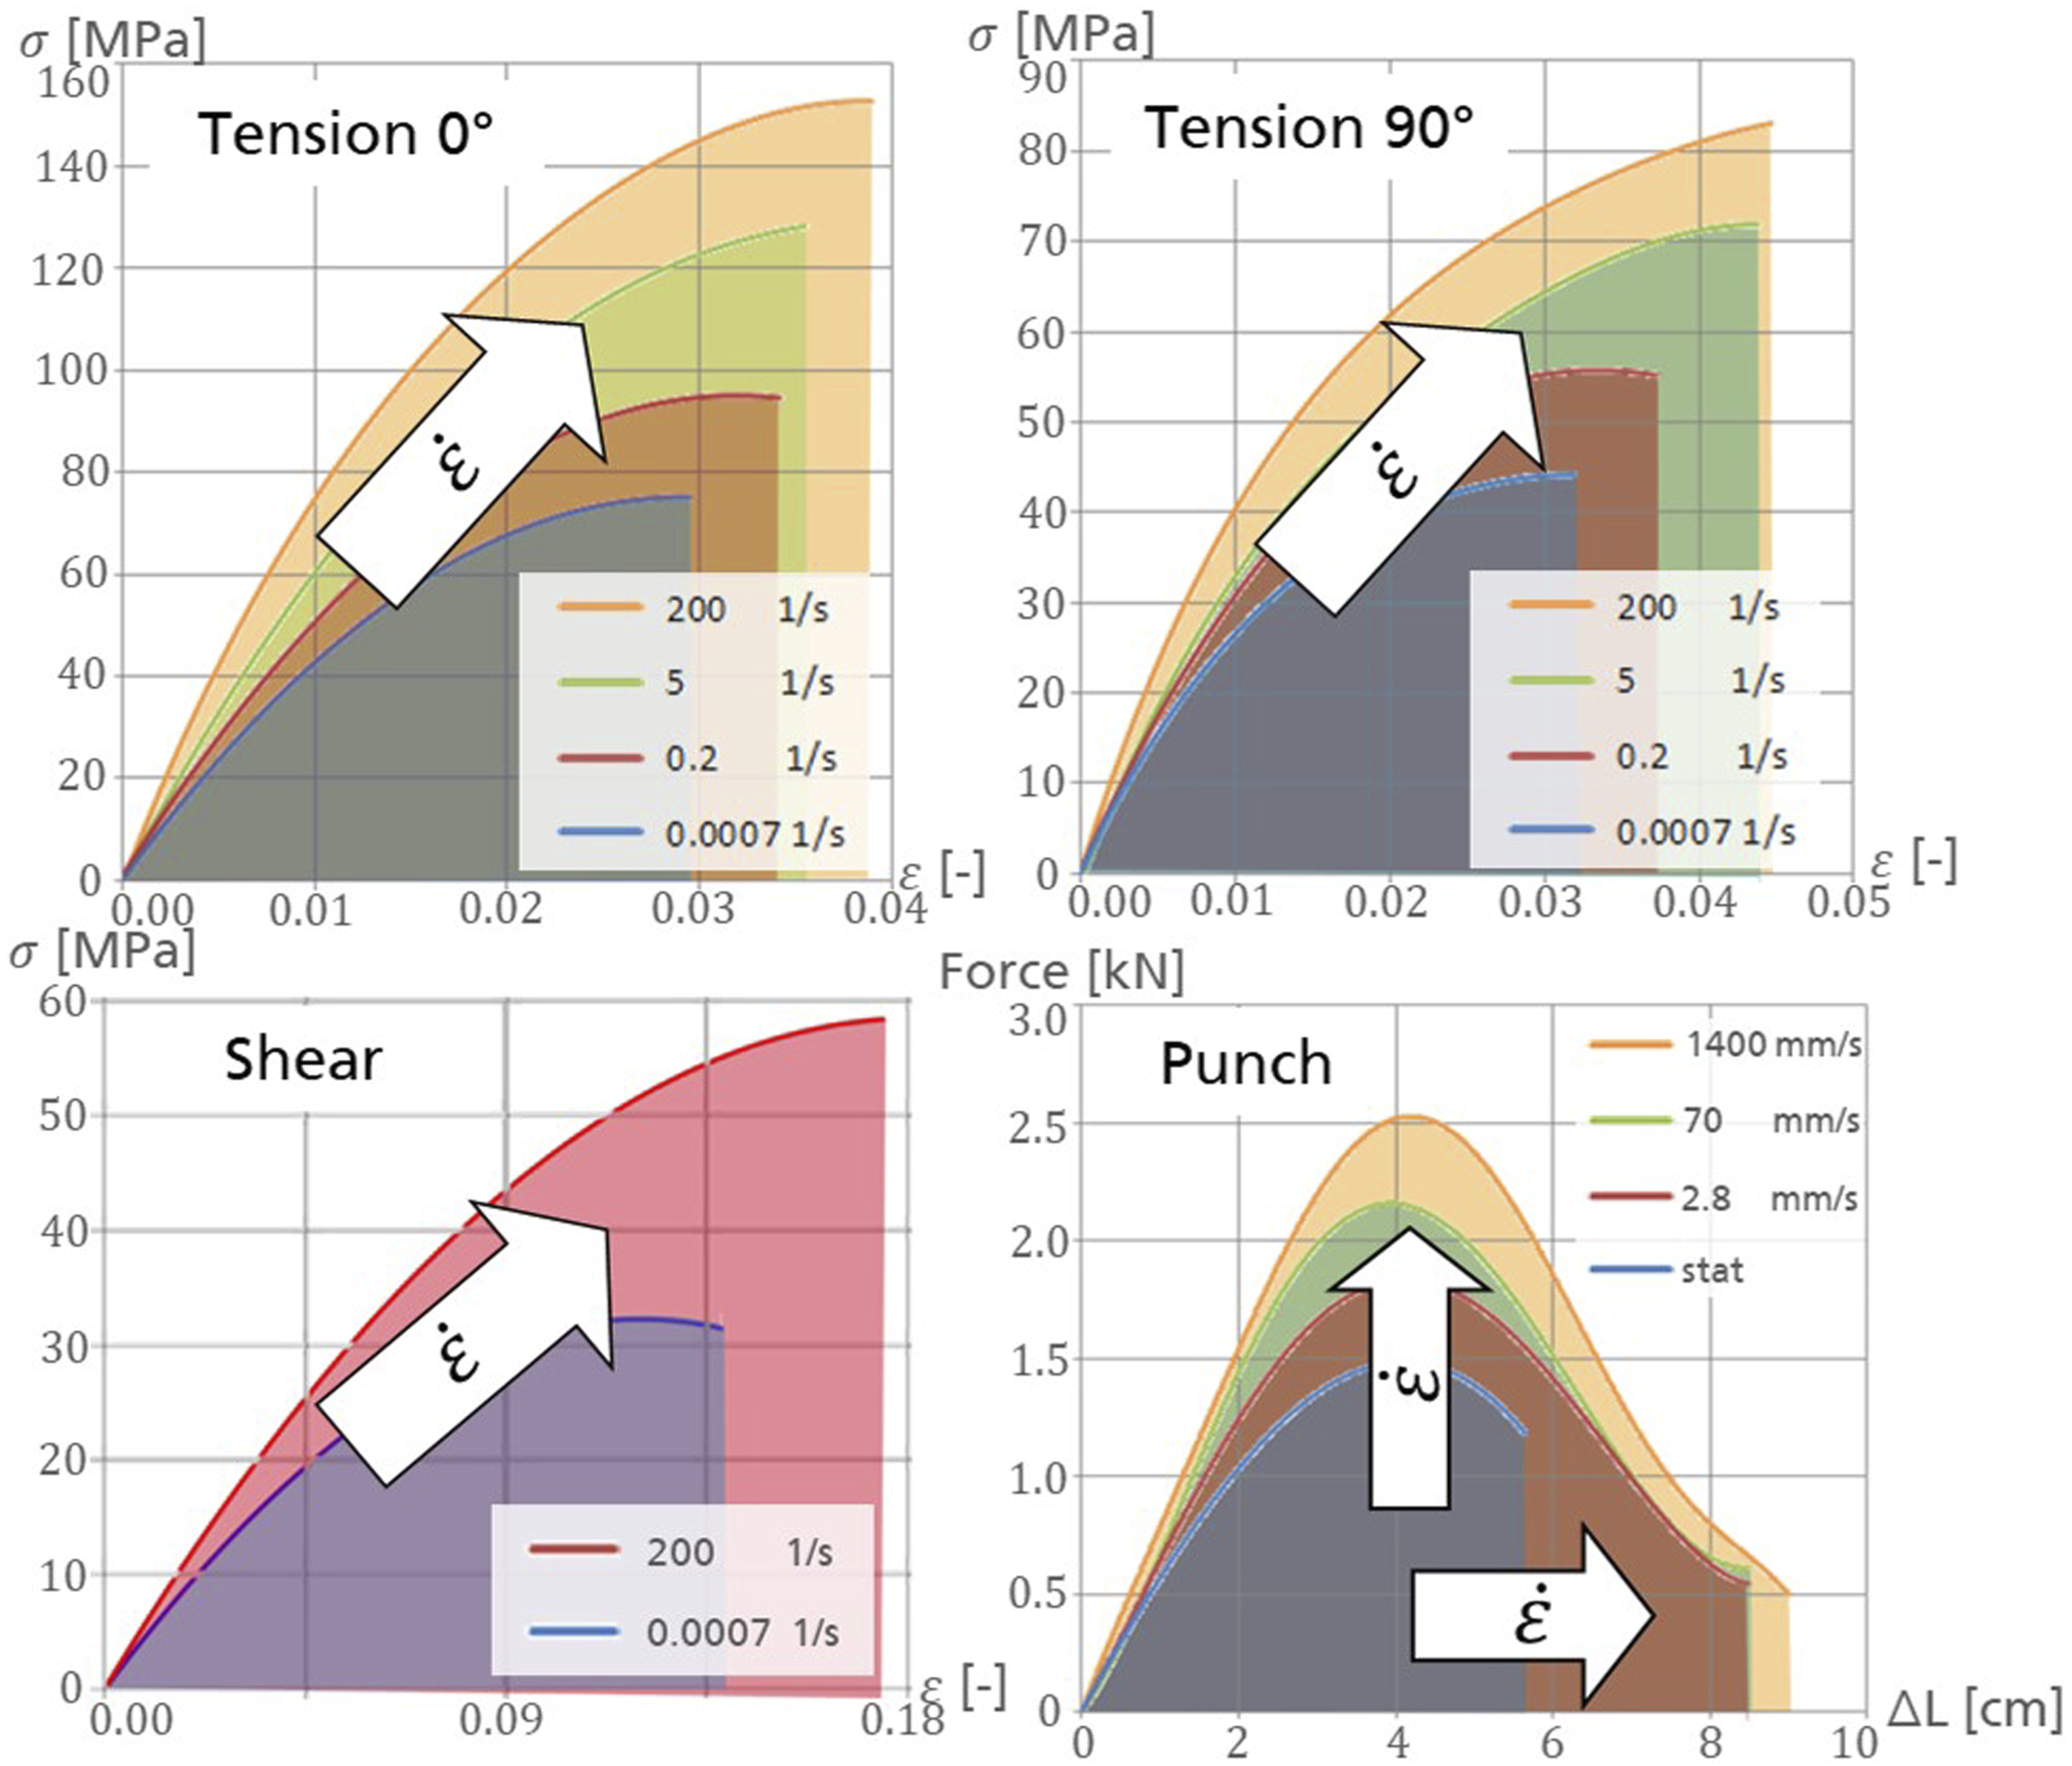
The individual representation of the fibers and the matrix material is numerically expensive for finite element simulations of larger crash scenarios. Hence, SFRP is often described as a continuum while only using the local fiber orientation as internal parameters.
Recently, advances have been made in modelling the deformation behavior of SFRP. For example, the model presented by Schulenberg et al. 6 is capable of describing the reversible and irreversible deformation with their dependency on strain rate and the stress state while also considering the effect of the fiber orientation. Wherein homogenization methods are used, and the fiber orientation serves as weights for establishing the anisotropy. The model by Reithofer et al. 7 applies the mean field theory of Mori and Tanaka and an incremental flow rule for the matrix material. Both approaches are efficient and flexible for predicting the deformation of SFRP. But for failure a phenomenological approach is chosen defining a separate parameter set for each possible situation (strain rate, stress state, and fiber orientation). Therefore, many parameters are needed which in turn results in high experimental expenses.
On the other hand, much effort has been made to find accurate failure models that are based on the underlying physics. A common approach is to calculate analytically the damage of the matrix in each time increment. Thereby the fibers are often split in unidirectional groups.8–10 As will be discussed below, the fiber-matrix delamination plays an important role in the failure mechanics. To consider this, models have been developed for small cracks on fiber ends 11 or by adding a third phase for the cracks. 12 Other approaches13–15 based on the work of Qu 16 with an imperfect attachment between fiber and matrix allow a displacement on the surface and use a subsequent homogenization.
Although the listed models can predict the failure of SFRP within specific boundaries, there is still no model capable of describing its dependency of the strain rate or additional influences as the stress state and the fiber orientation. Such a model is developed and validated in this paper.
Material and mechanics
The here presented failure model is developed on the example of a glass fiber reinforced polypropylene with 30% fiber volume fraction (PP-GF30), a fiber diameter of 19 μm and a nominal length of 2 mm. A transfer to others short fiber reinforced thermoplastics is in principle possible.
To have a physically accurate basis the significant micro-mechanics must be described in a failure model. An apparent mechanic is the strain rate dependency of each component of the composite. Glass fibers deform linear elastically with a neglectable strain rate effect on the stiffness. 17 They fail rapidly and can be describe as brittle whereby the failure strain is higher for dynamic loads. 18
Pure polypropylene however deforms nonlinear early in a loading and can accumulate large irreversible deformations and is therefore usually described with plastic flow theory. This plasticity shows a significant strain rate effect just as the failure strains.19,20 It is yet unknown how exactly the presence of fibers change the behavior of polypropylene, in terms of change of crystallinity. Wang and Liu 21 detected a different nucleation rate close to carbon fibers. Zhao et al. 22 were able to prove the existence of a 200–300 nm thick layer close to the fiber with a lower hardness. Though with analytic homogenization methods and applying the E modulus of not reinforced polypropylene one can predict the composite stiffness correctly and therefore show that this layer is neglectable. The nonlinear behavior cannot be analyzed in this way and is experimentally very challenging to characterize due to the small distance between the fibers. Consequently, in the following the behavior of the matrix material is assumed to be the same as the not reinforced polypropylene.
Equally as important is the interaction of the components and specifically the delamination. 1992 Kander and Siegmann 23 have discovered, that the delamination of glass fibers and polypropylene is strain rate dependent. Even before that the quasi-static detaching was characterized, 24 and more recently some tests were performed at higher strain rates.25,26 The experiments prove the influence of the strain rate on delamination with higher critical stresses at higher strain rates.
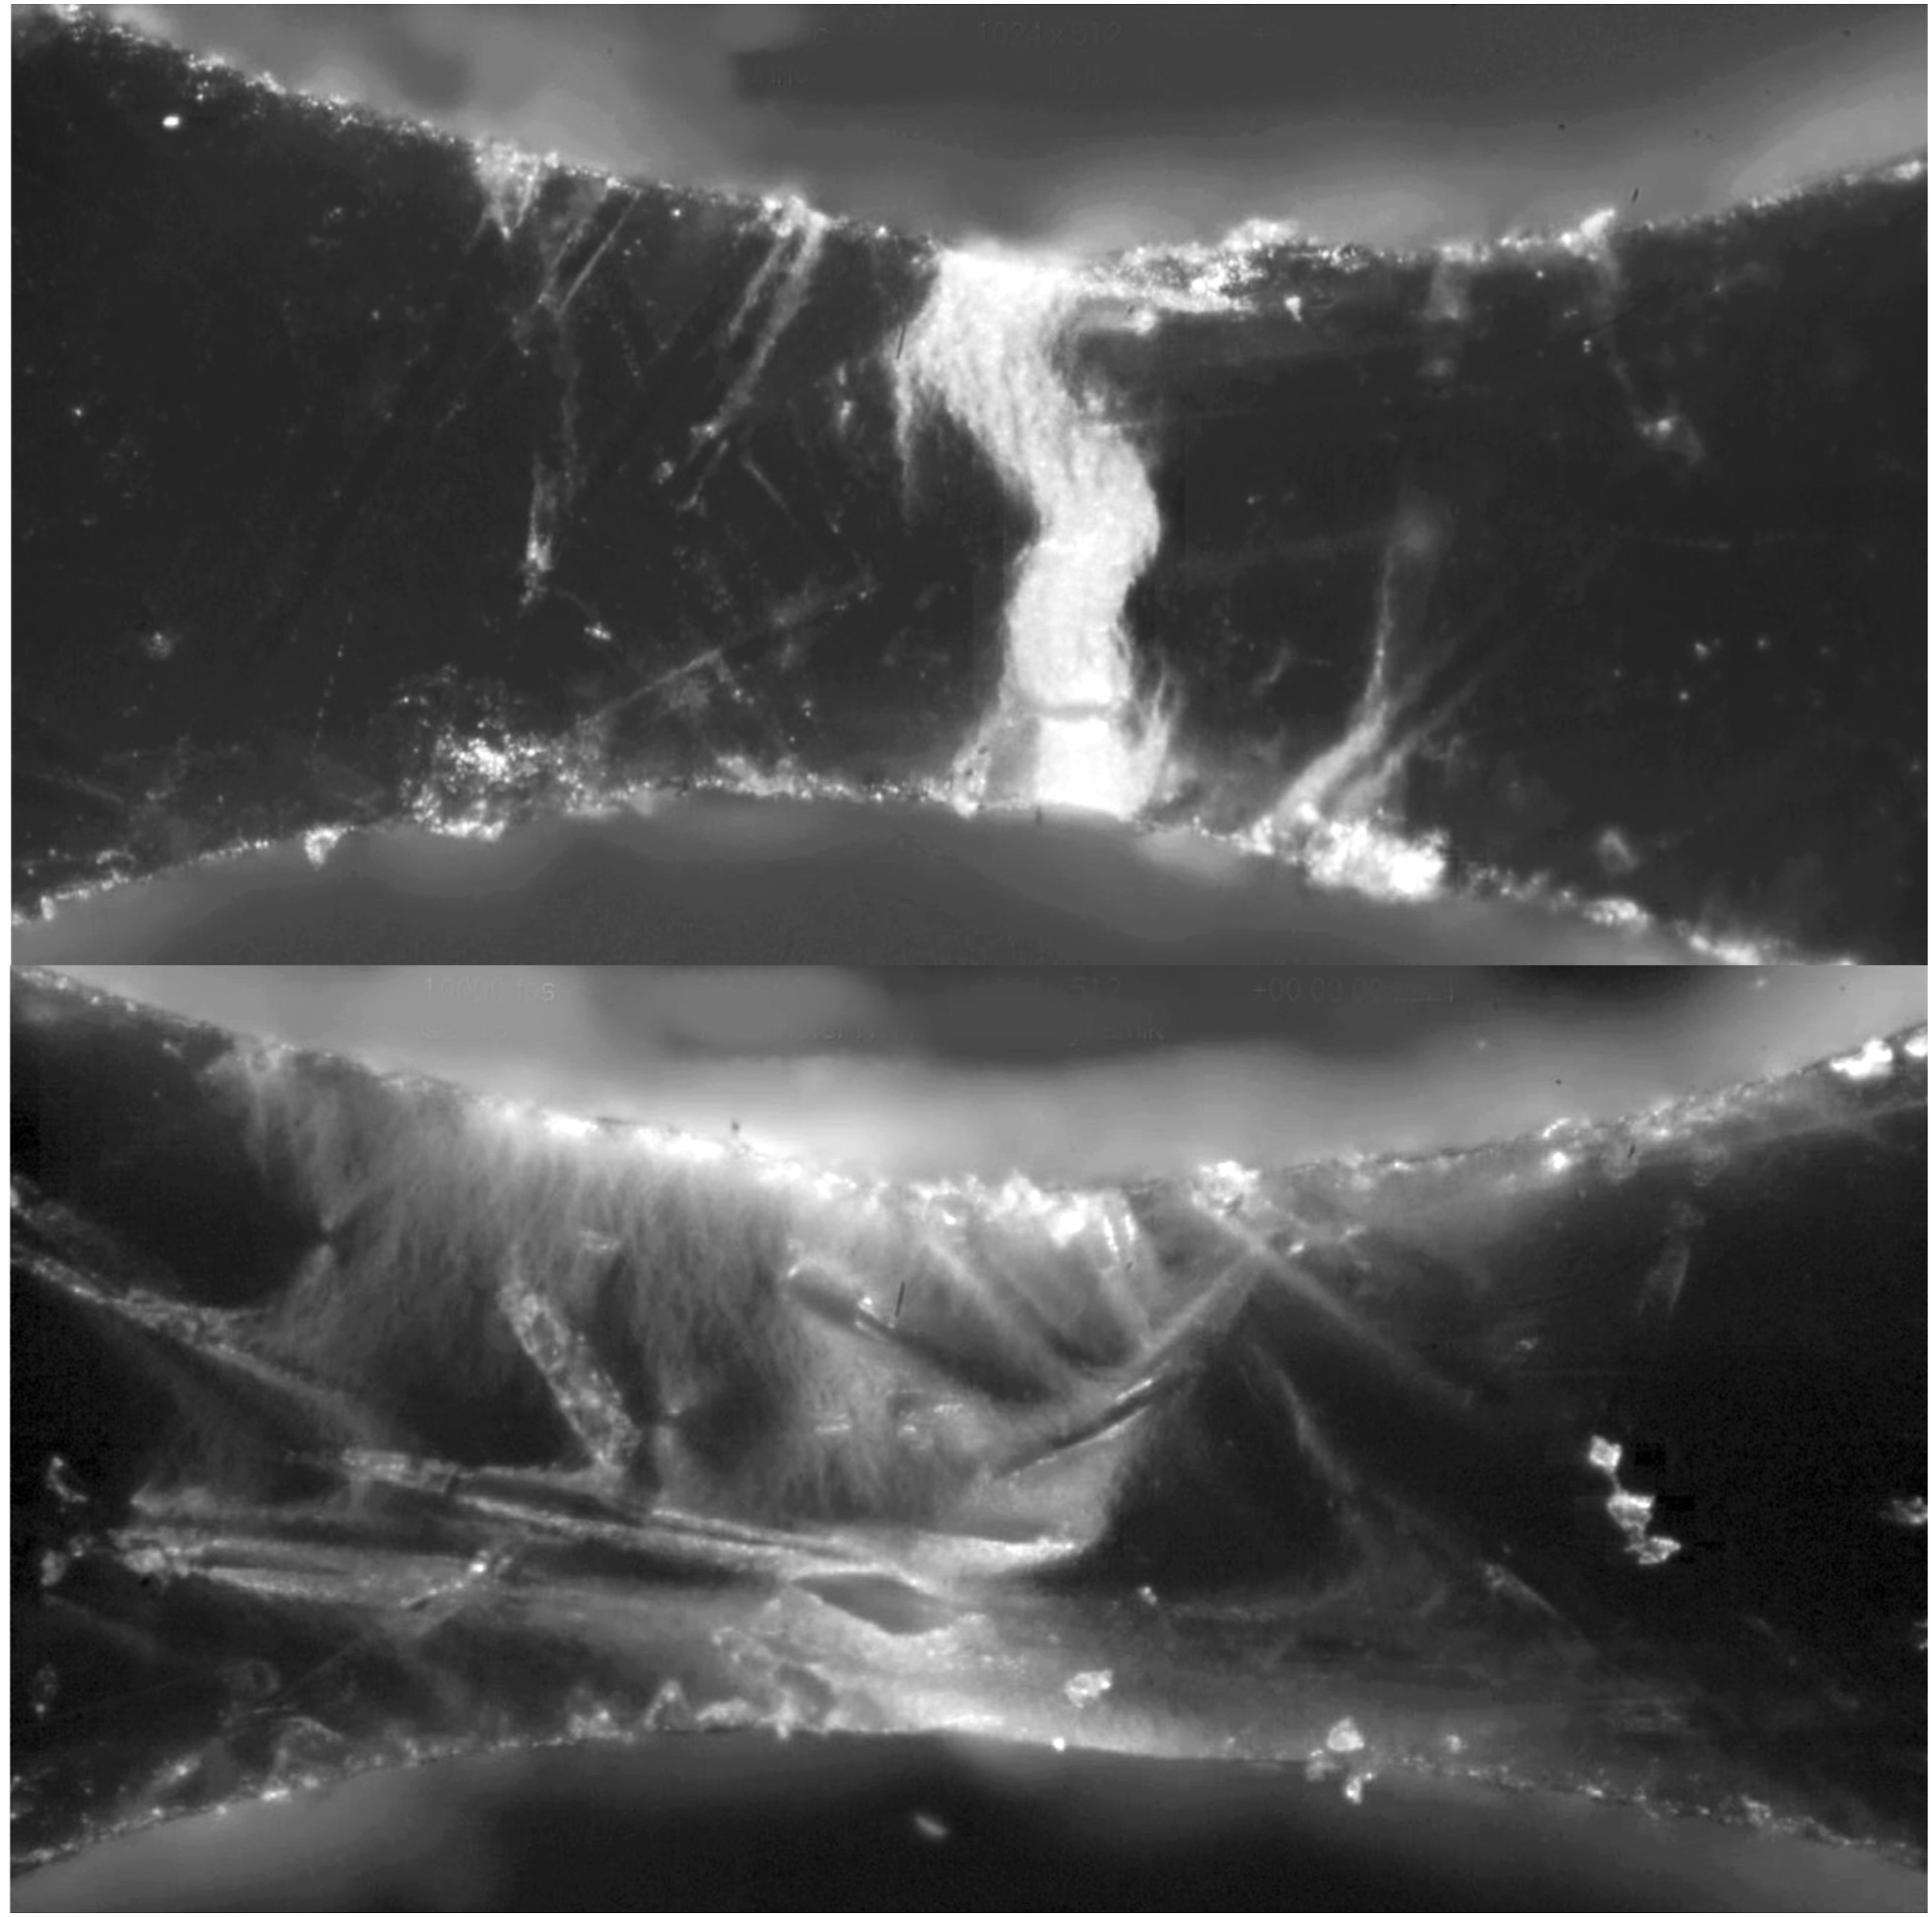
As one can observe in the macroscopic experiments on PP-GF30 (Figure 1) the failure stress and strain increases with increasing strain rates. This holds for both loading direction in respect to the fiber orientation (tension in 0° and 90°) as well as for all applied stress states (uniaxial tension, shear, and biaxial tension). In other words, the absorbed energy until failure, the distortion energy
increases with higher strain rates, where In the SFRP micro specimens just before failure the deformed material appears brighter. Strain rate of 0.0007/s (above) and 250/s (below) were applied.
27
Furthermore, this hypothesis was recently validated by Schweiger et al.
28
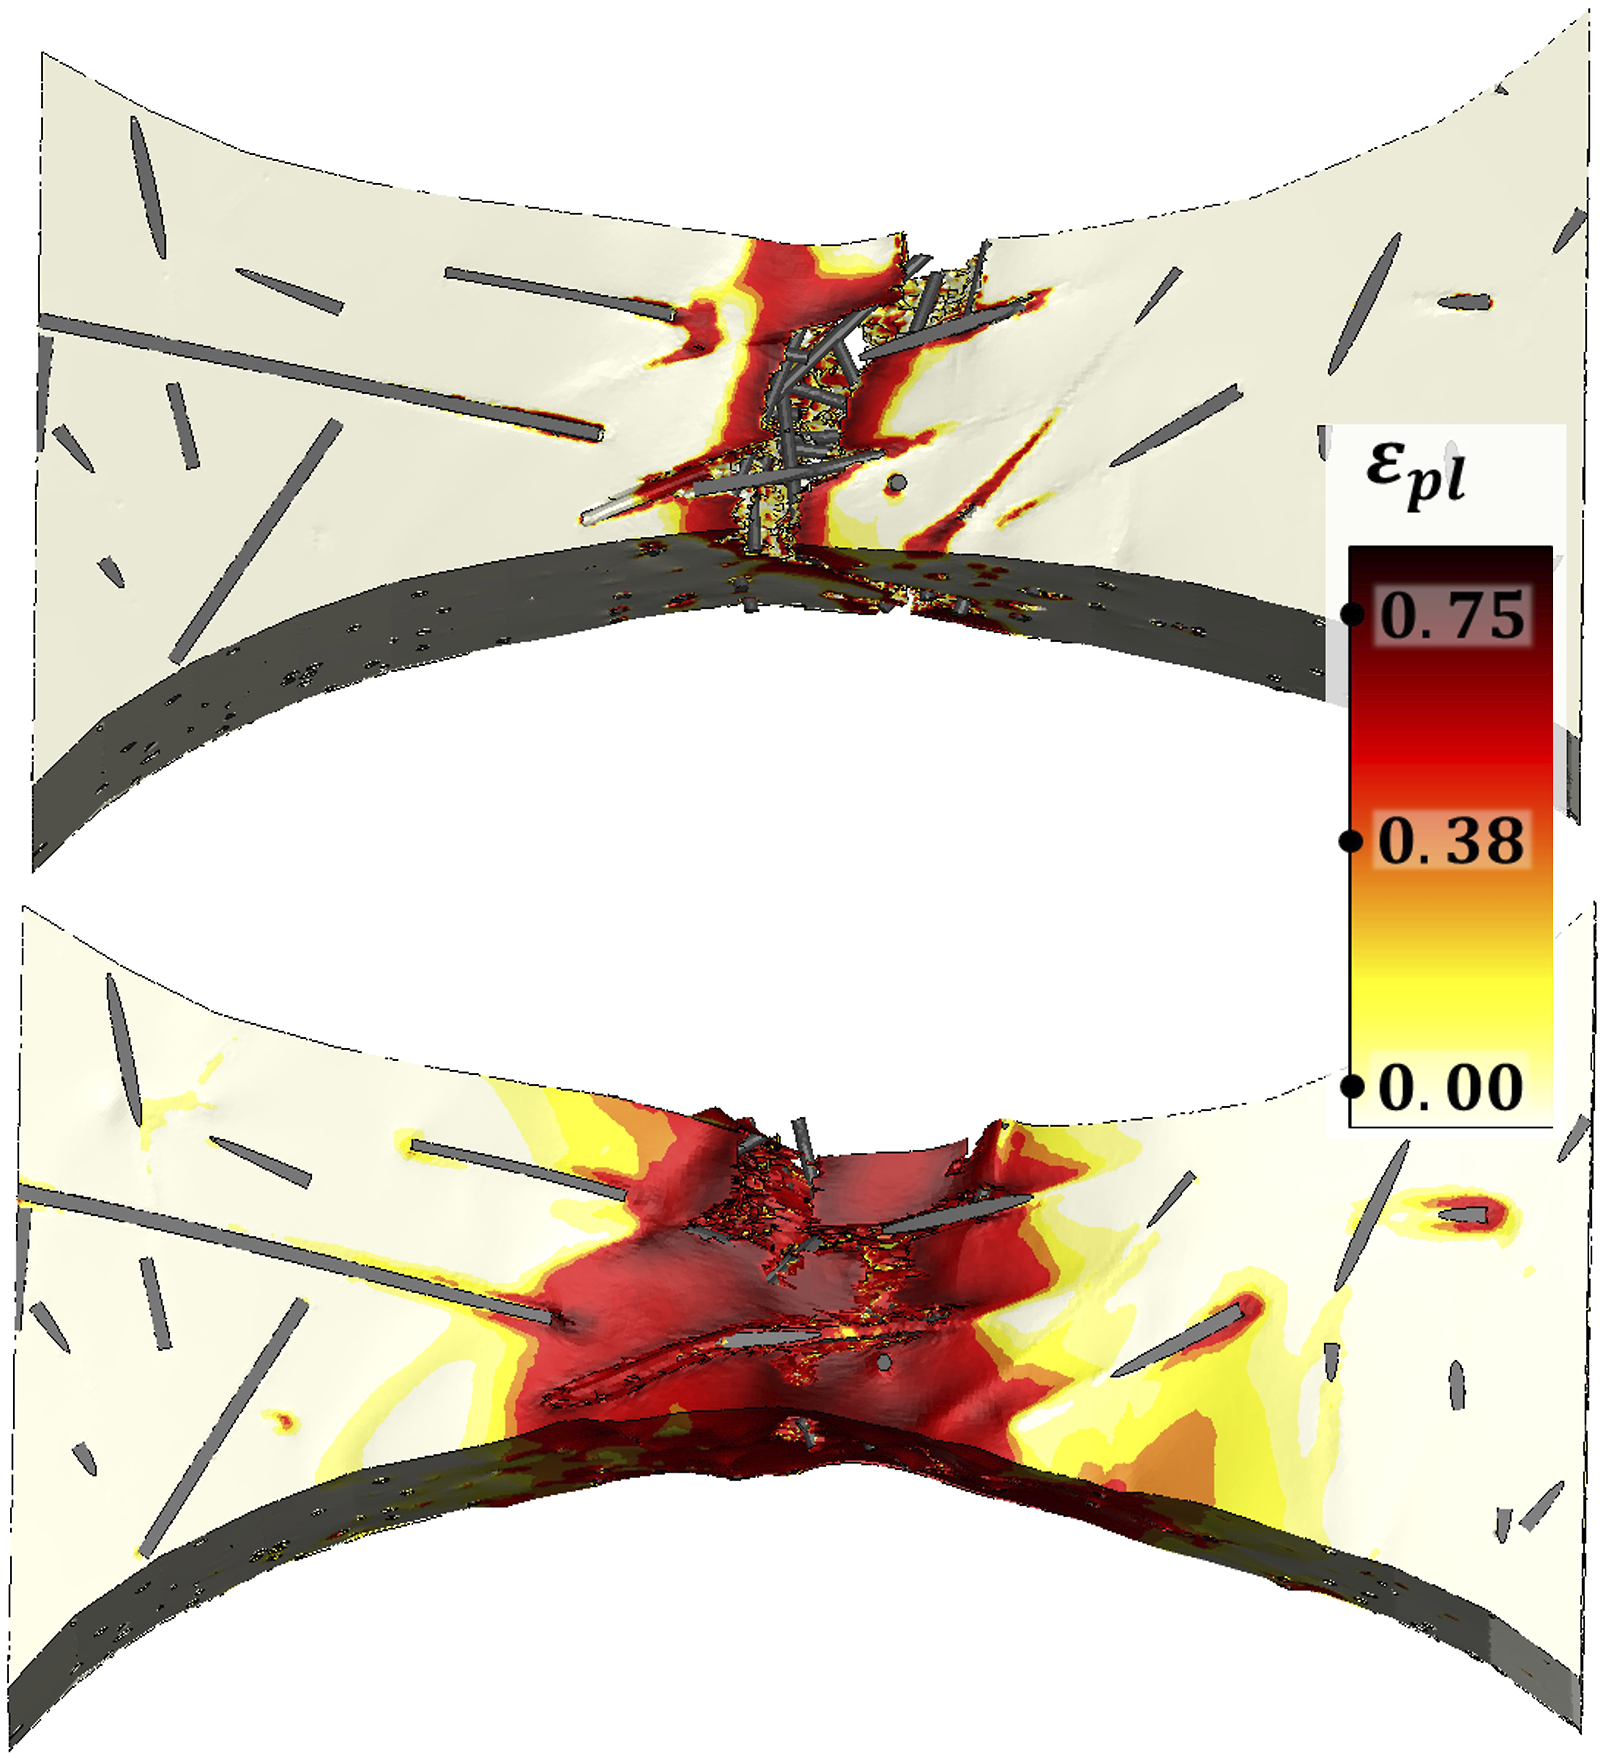
with a finite element study on the strain rate dependent microscopic failure mechanism of SFRP, modelling the fibers and the matrix material separately. The simulations showed that modelling the strain rate dependent delamination is necessary to capture the effect of the strain rate dependent deformed volume. And moreover, with this method it was possible to reproduce the results of the microscopic experiments based on the real fiber orientation. Figure 3 shows that the deformed volume is higher at high strain rates (lower) than at lower strain rates (upper). The analysis of the simulated distortion energy density showed a similar value at failure for both strain rates, providing another argument for describing failure with this value. Plastic strain distribution for the SFRP micro tensile test resolving the fibers and the matrix material modeling the strain rate dependent delamination and producing a strain rate dependent deformed volume. The same strain rate were applied as experimentally (0.0007/s above and 250/s below).
28
Failure model development
A predictive failure model for SFRP must describe the significant micro-mechanisms as discussed above. To achieve this, its core capability must be the prediction of the
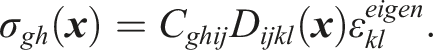
For prolate fibers ( A comparison of the stress field close to an ellipsoidal fiber (black) between the analytic Eshelby solution (upper) and a numeric FE simulation (middle). Displayed is the 11-component for a tension in fiber direction as well as their relative difference (lower). The upper left quadrant is shown in the symmetry plane at x3=0.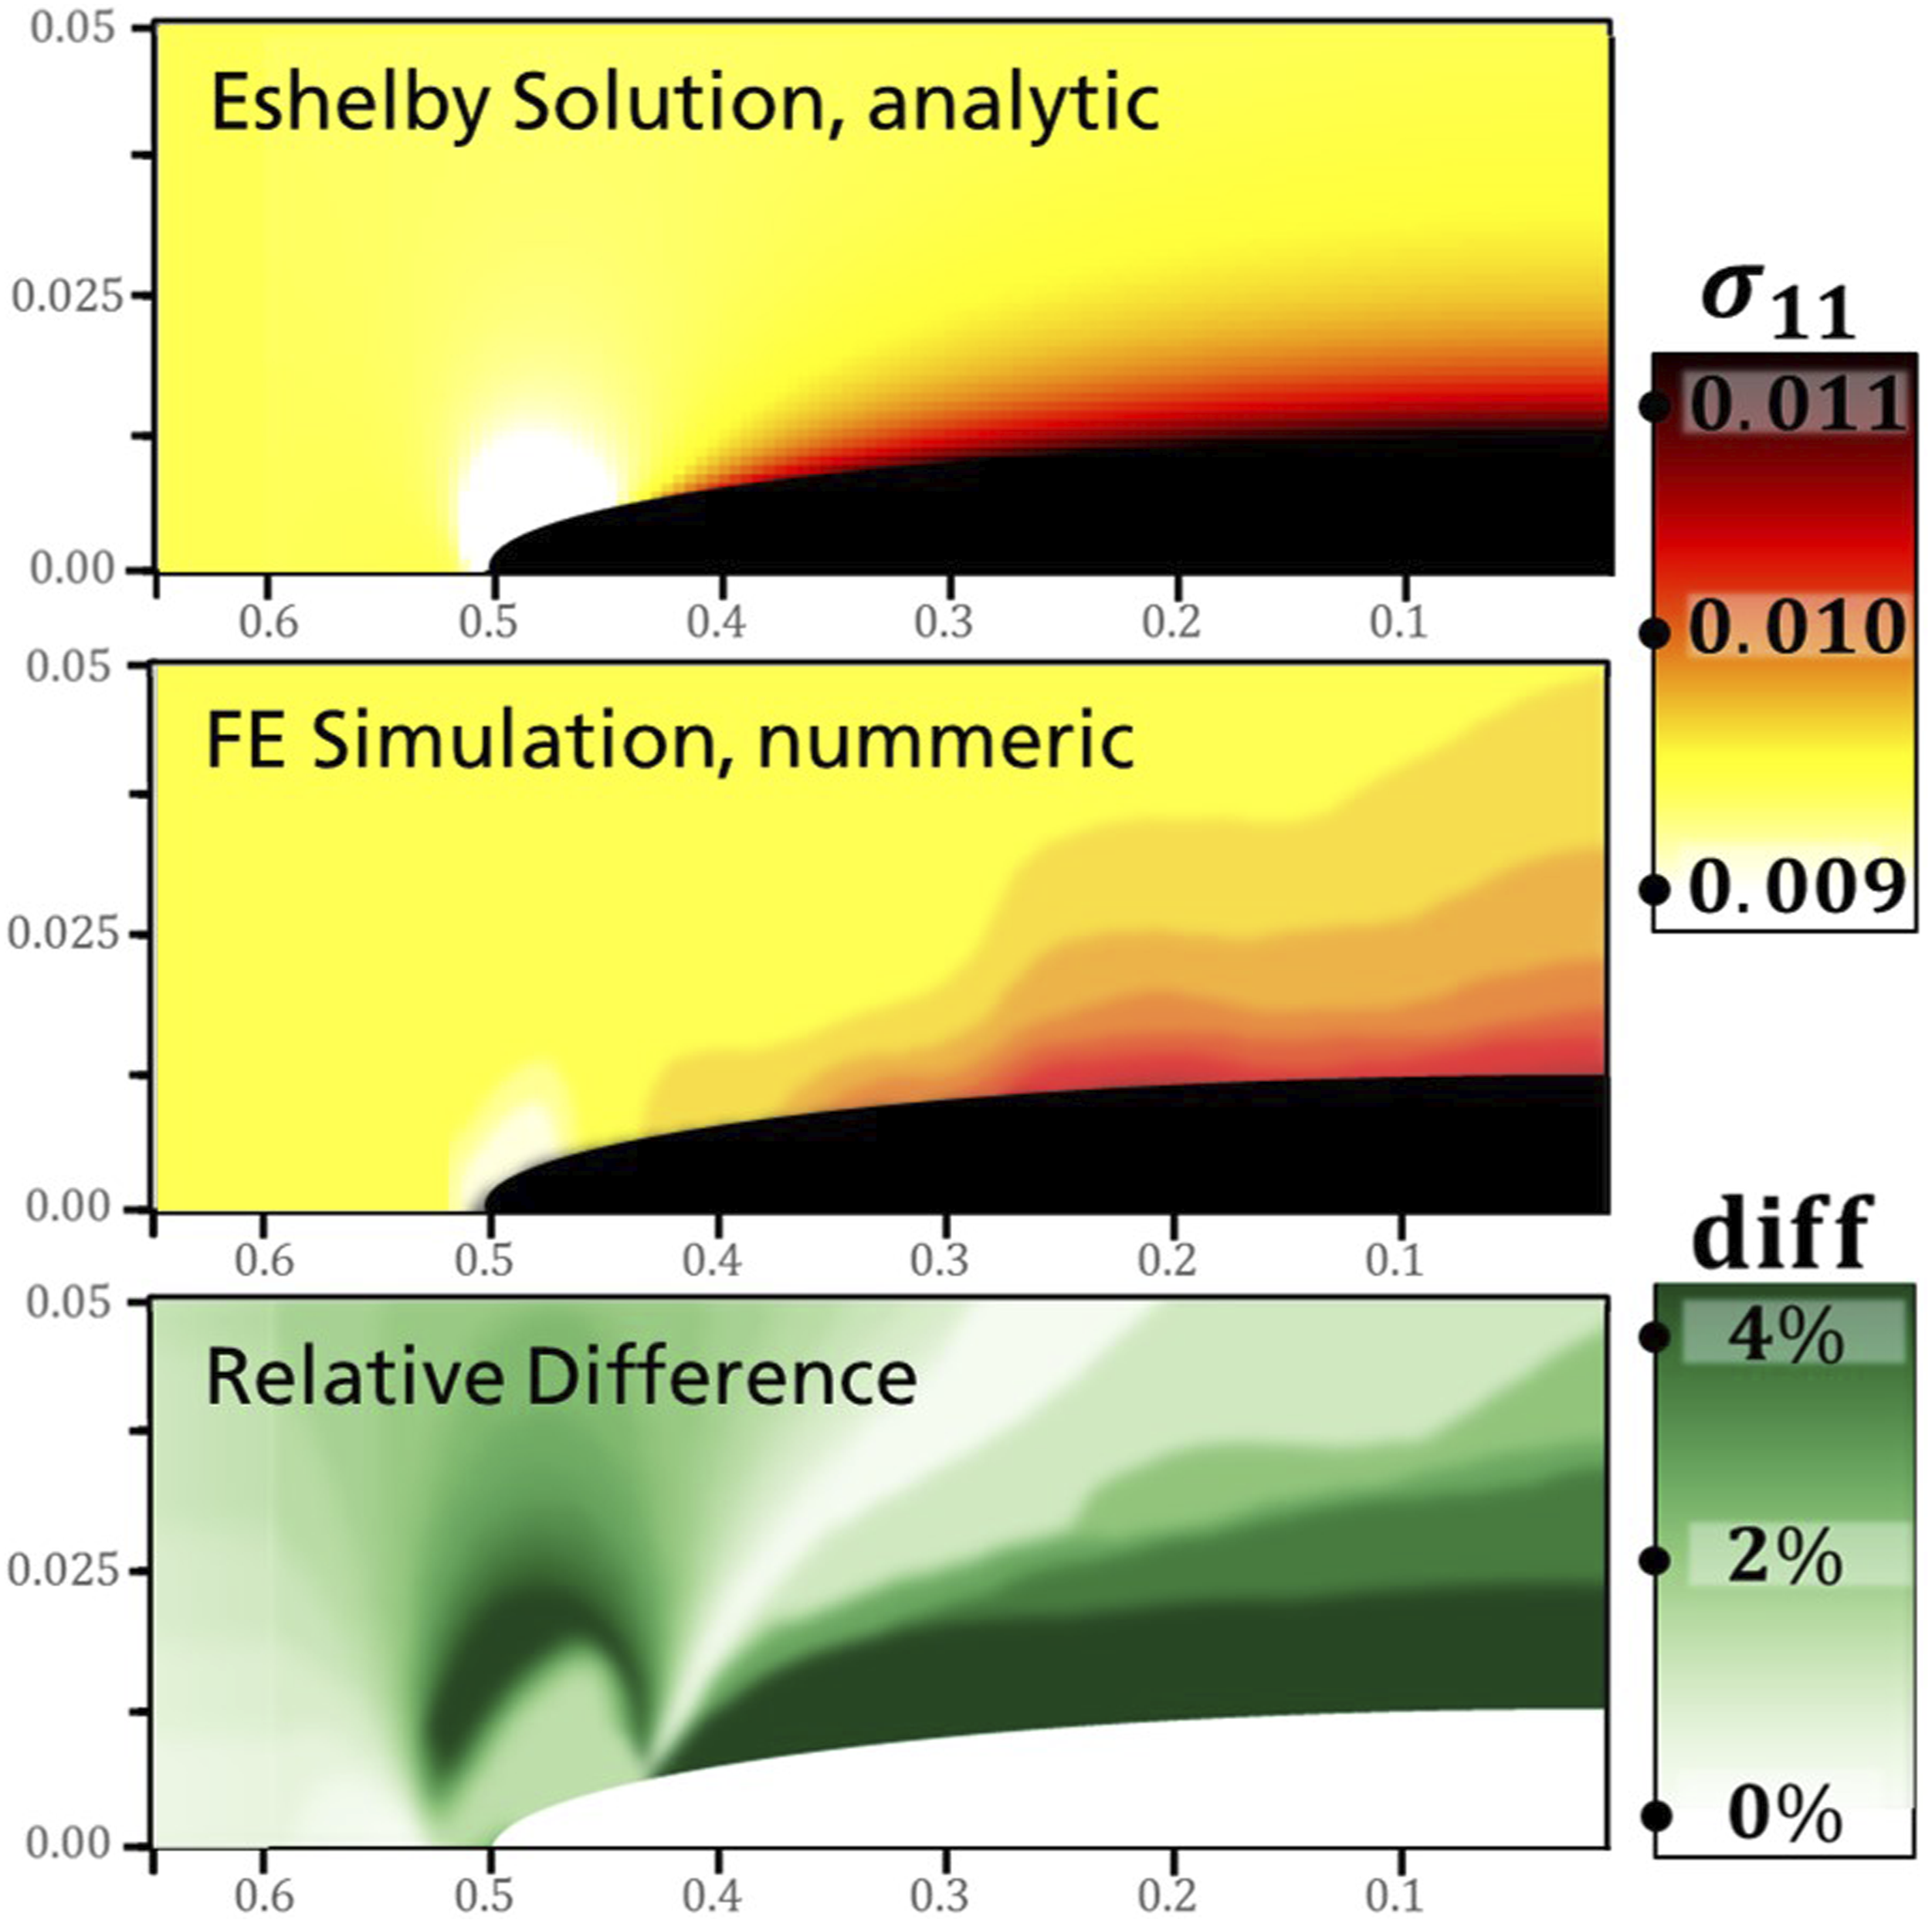
Even though the formulars are numerically efficient, the solution only holds with major assumptions. Firstly, only one inclusion in an infinite matrix is described. Secondly, the material behavior of the inclusion and the matrix is linear elastic. And thirdly, the fiber-matrix-contact is assumed to be perfect. As in SFRP the fibers are usually densely spaced, and the matrix deforms nonlinearly these assumptions do not hold and extensions to the solution must be made.
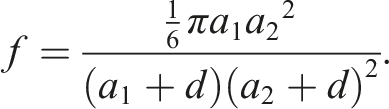
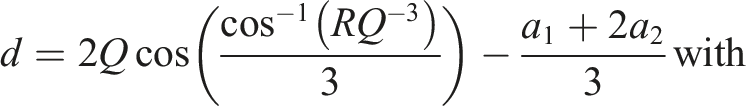
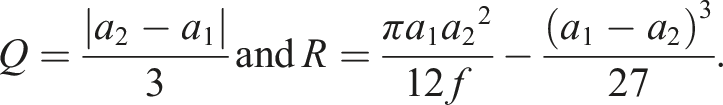
The A additive superposition of the stress field of adjacent fibers each calculate according to the Eshelby solution. The half fiber distance d is determined by the local fiber volume fraction. Displayed is the 11-component of the stress field for a tension in fiber direction in the symmetry plane at x3=0.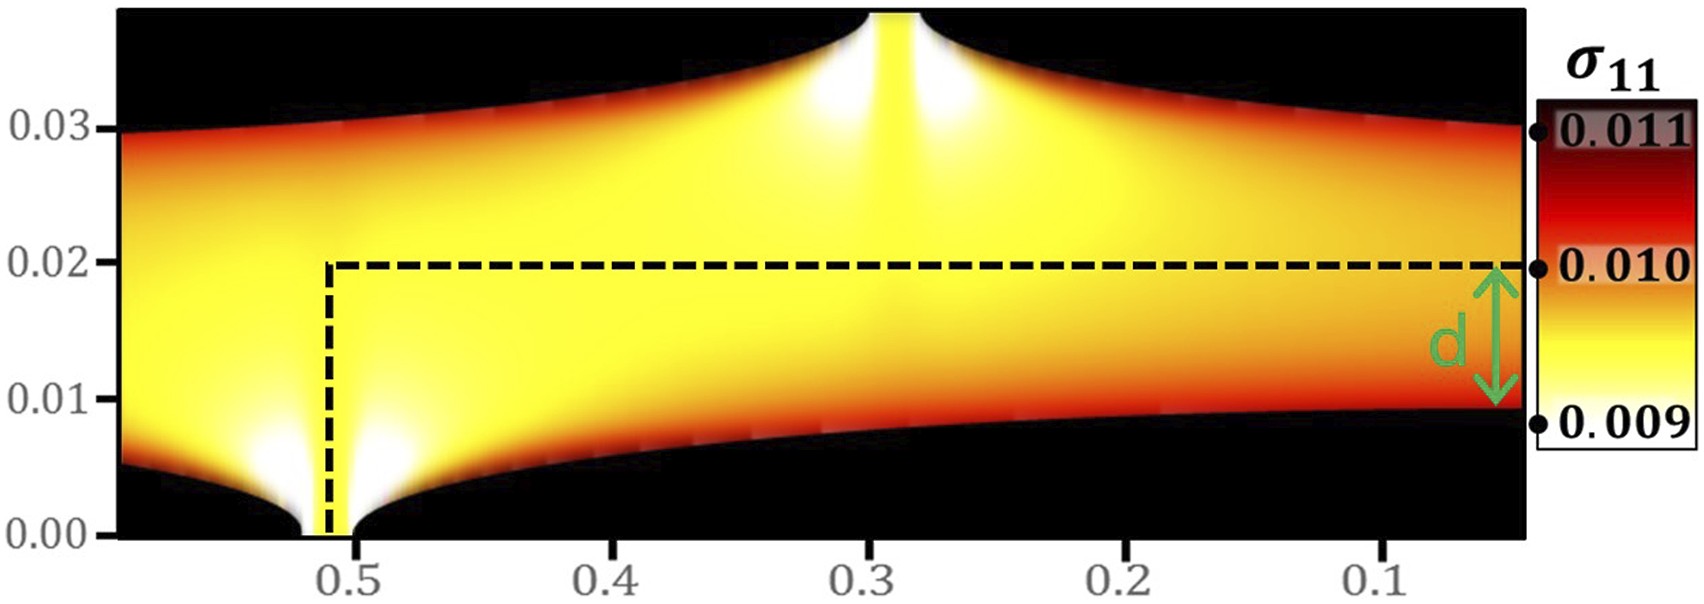
The dashed line in Figure 5 shows the boundaries of a volume element that is repeated in all directions. The same behavior in all of them can be assumed. Therefore, only one of these representative volume elements is considered in the user material model for each element or integration point in the finite element simulation.
The The overlapping stress field in the symmetry plane caused by rotated fibers around an angle of φ=13° based on the local fiber orientation.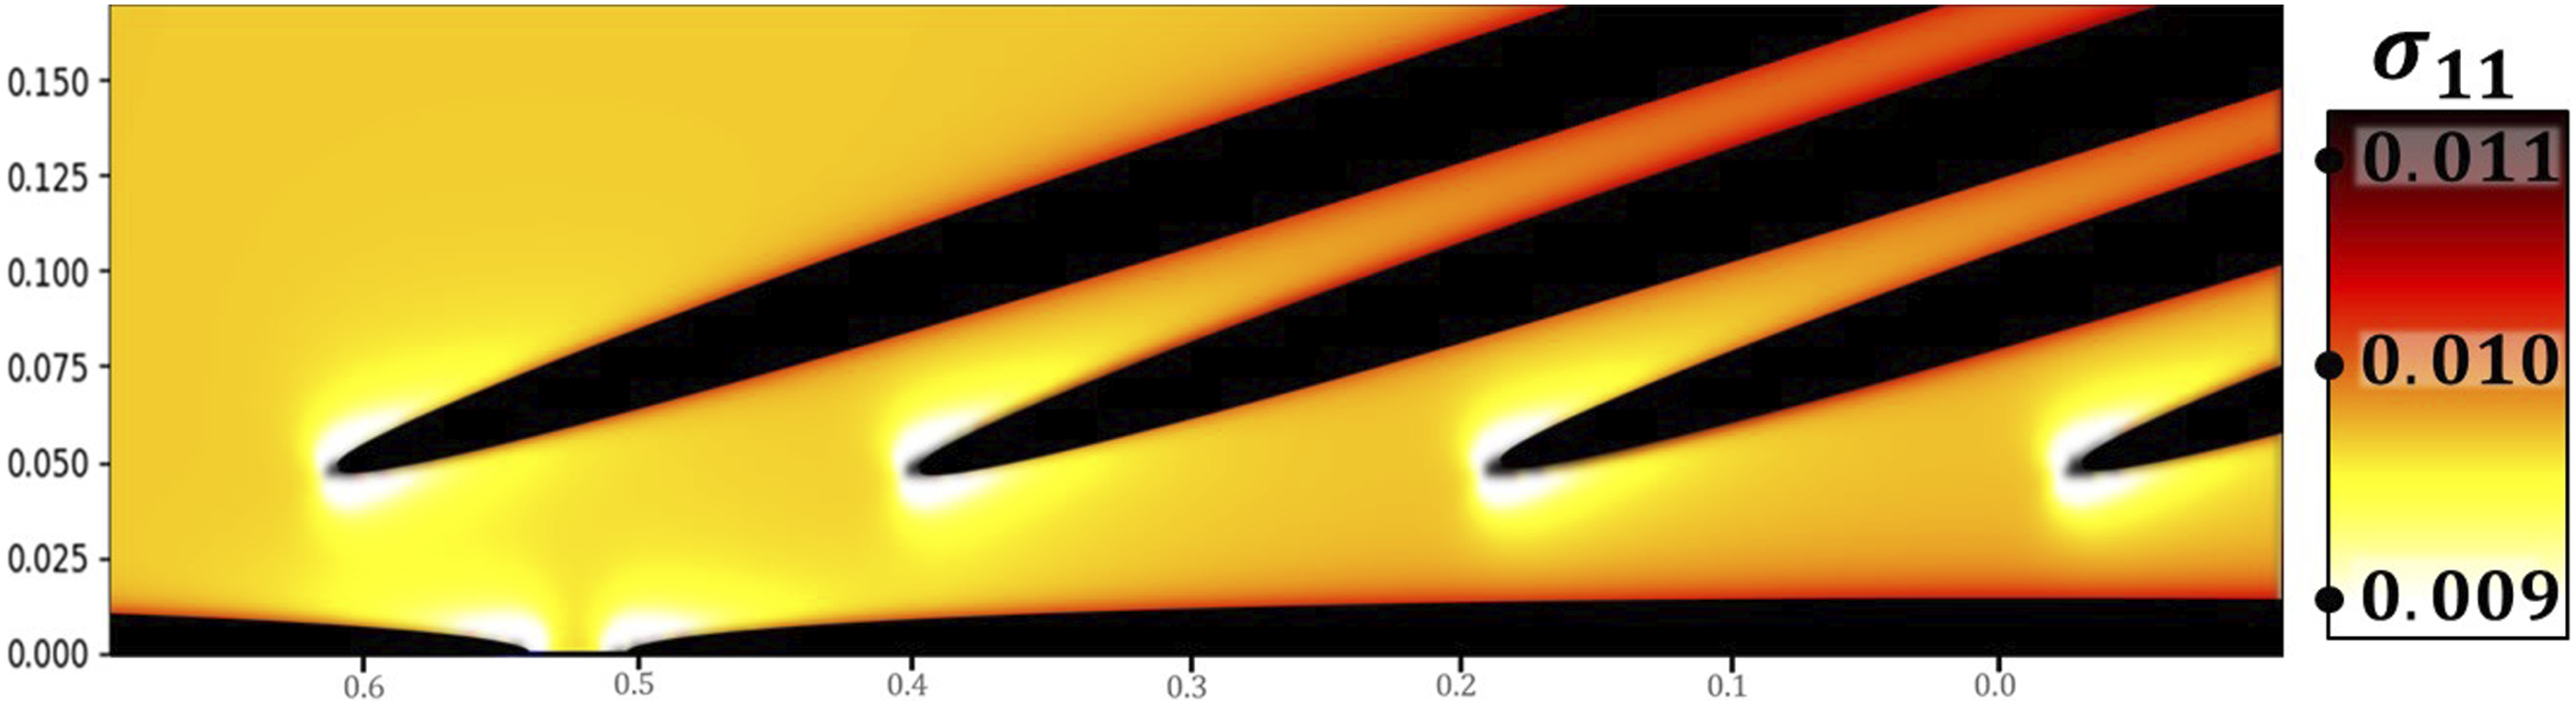
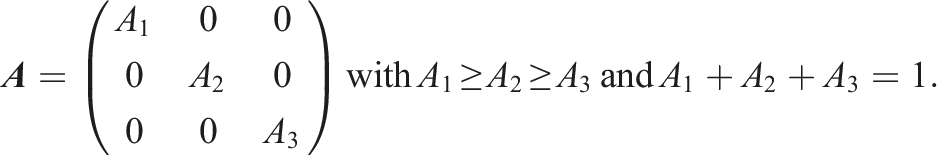
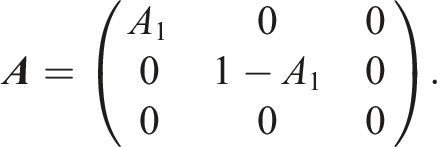
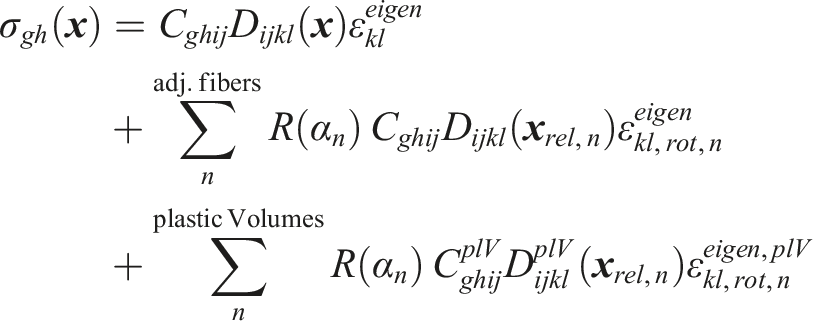
The fiber orientation tensor represented in the analytic model
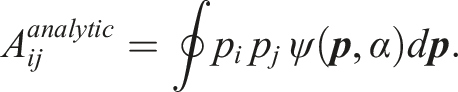
Thereby the distribution function
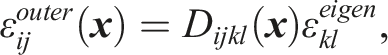
For the stress field a sum over all adjacent fibers is added with
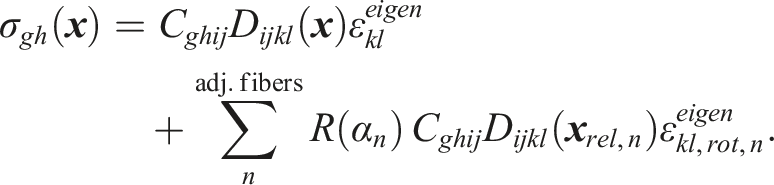
Thereby for rotated fibers the applied load must be rotated resulting in different eigenstrains
After a method has been established to describe the elastic behavior with the Eshelby solution, in the following an extension is developed for the
Therefore, the stress is calculated point wise on straight lines equidistant on the fiber surface minimizing the difference to the yield stress by applying an extended Golden Section search.34,35 Hereby the shape of the area with stresses above the yield stress can be approached as shown in Figure 7 (upper) for a tension 90° to the fiber direction. The optimal positioning of an ellipsoid within the plasticly deformed area by point wise optimization (upper) and the von Mises stress field caused by the plastic deformation of this volume (lower).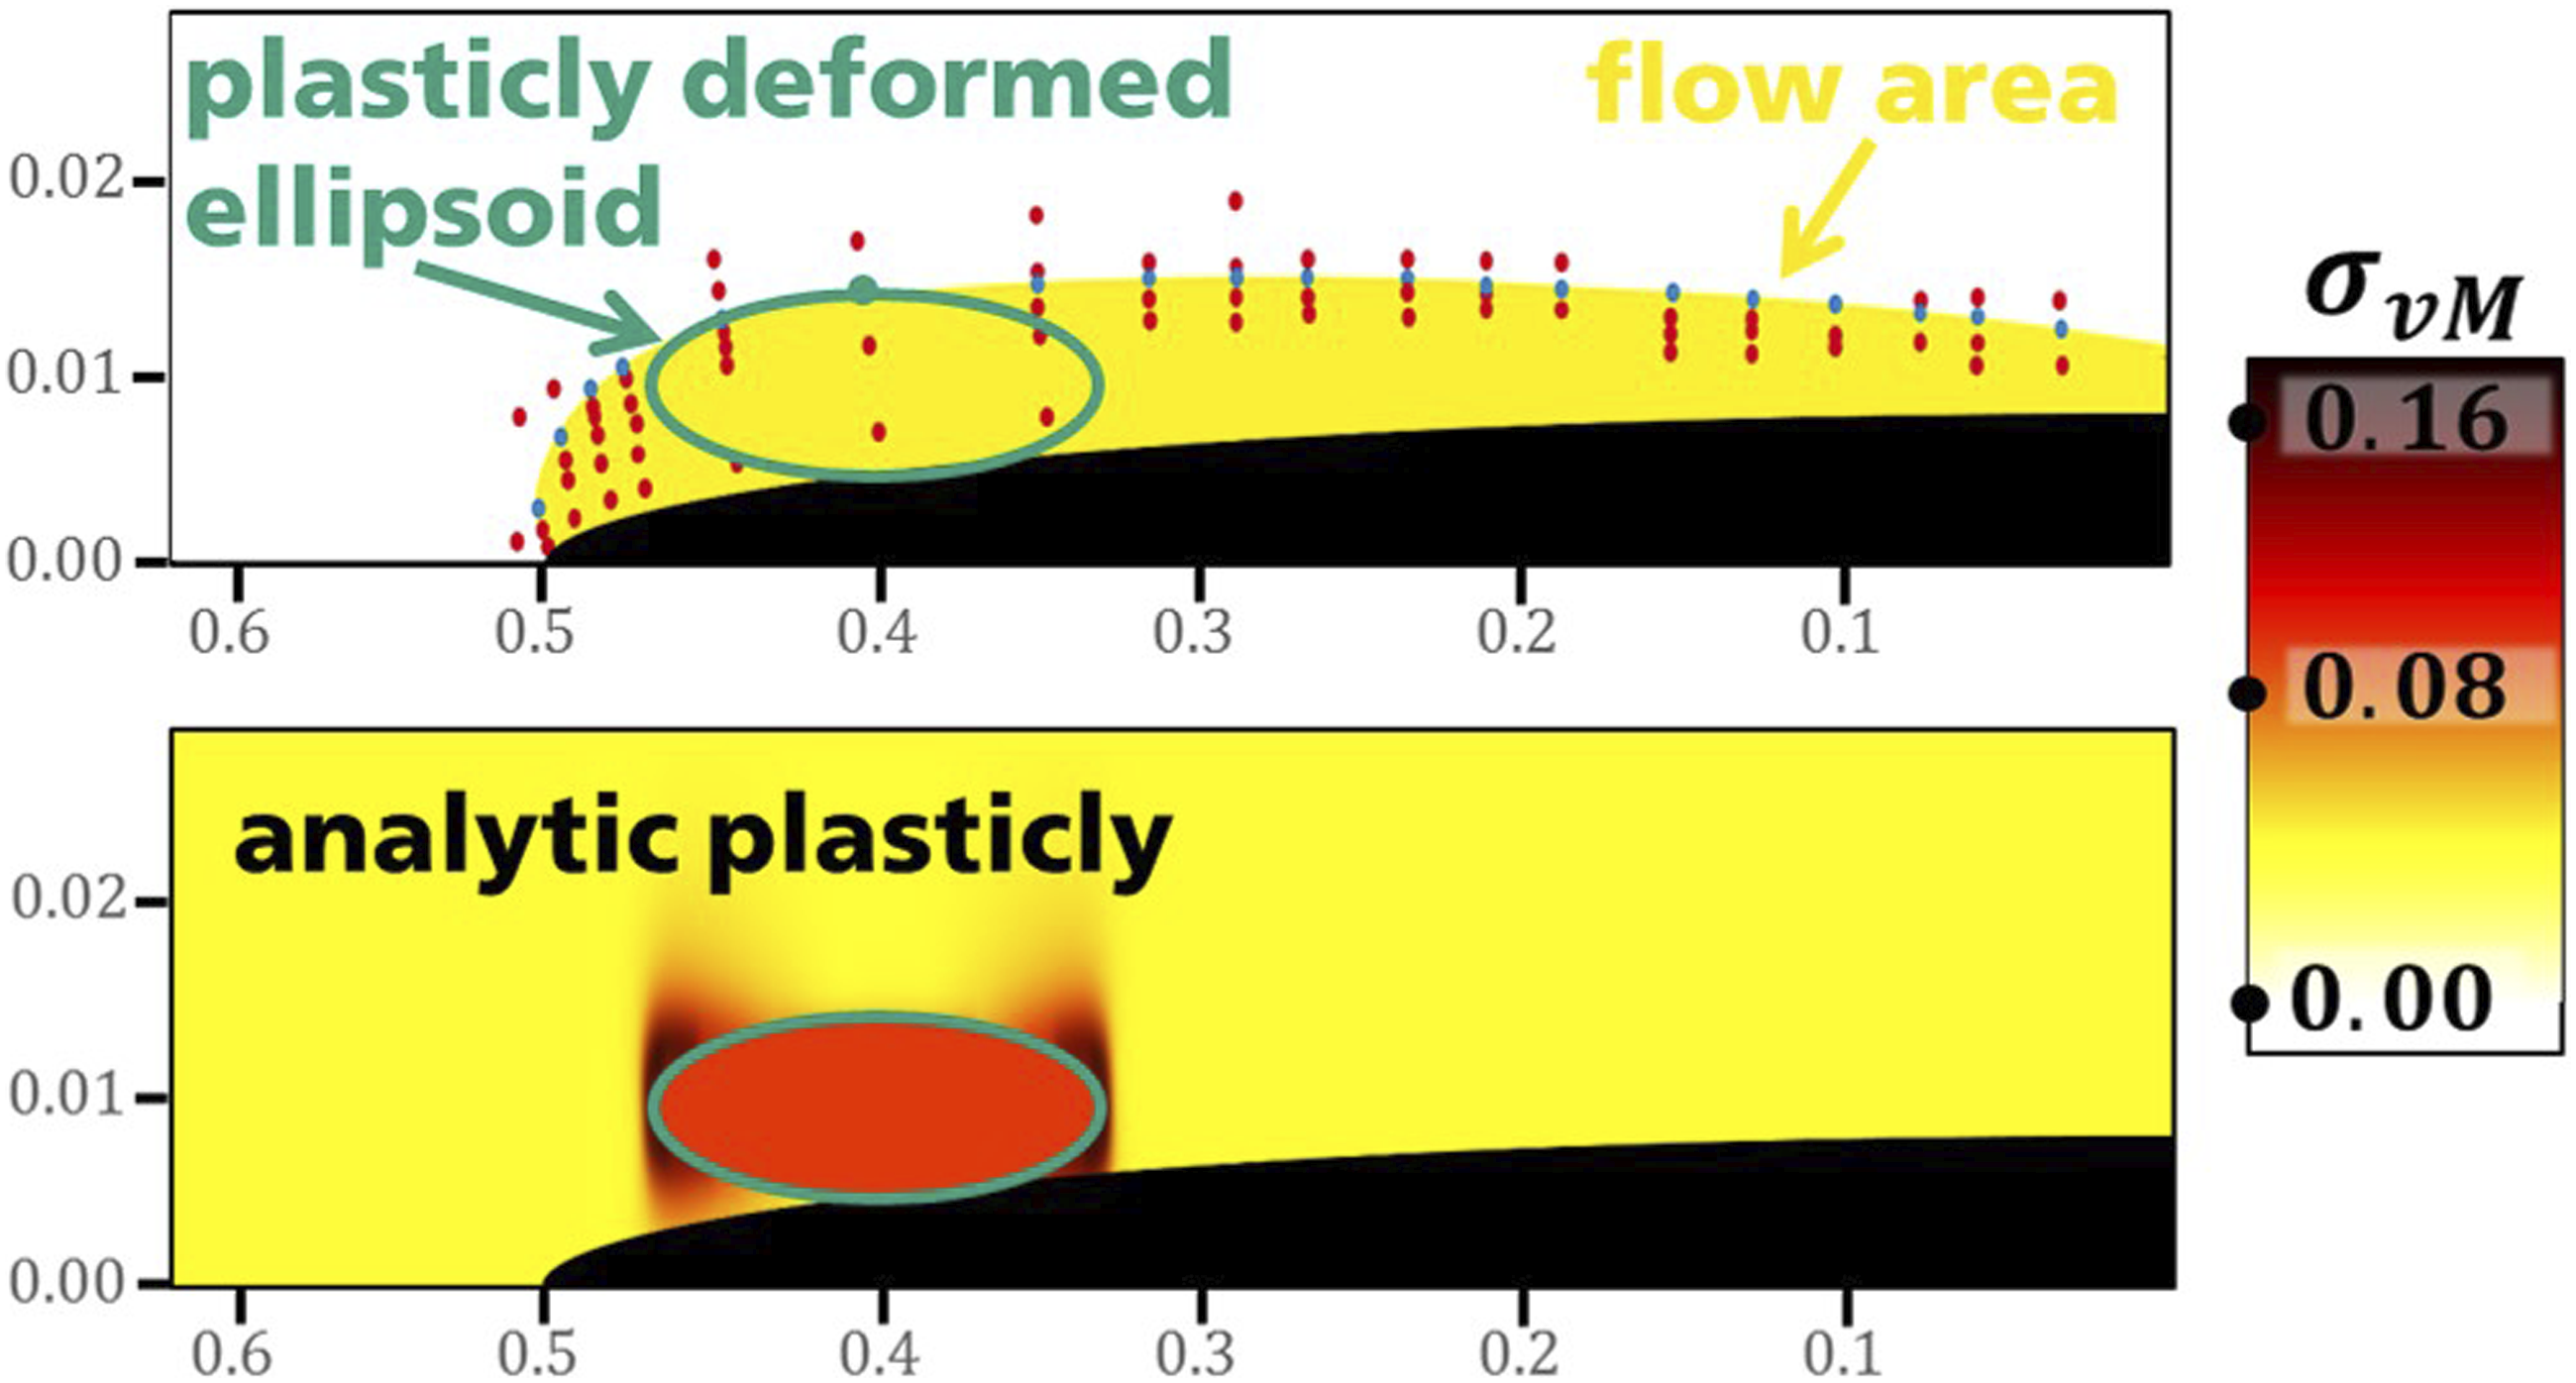
The effect of the plastic deformation of the matrix material on the stress field can again be calculated by the Eshelby solution if the plasticly deformed region is regarded as an additional inclusion with an E modulus deviating from the matrix material. This is done analogical to calculating the stress field caused by the glass fiber. But here the inclusion has a lower stiffness than the matrix material. To apply the Eshelby solution the plasticly deformed area is approximated by an ellipsoid of maximal volume, while not violating the border of the flow area (see Figure 7, upper).
To approximate the The relation between the present stress in plasticly deformed volume, the normal projection to the yield surface and the corresponding stress on the yield surface in the principal stress space.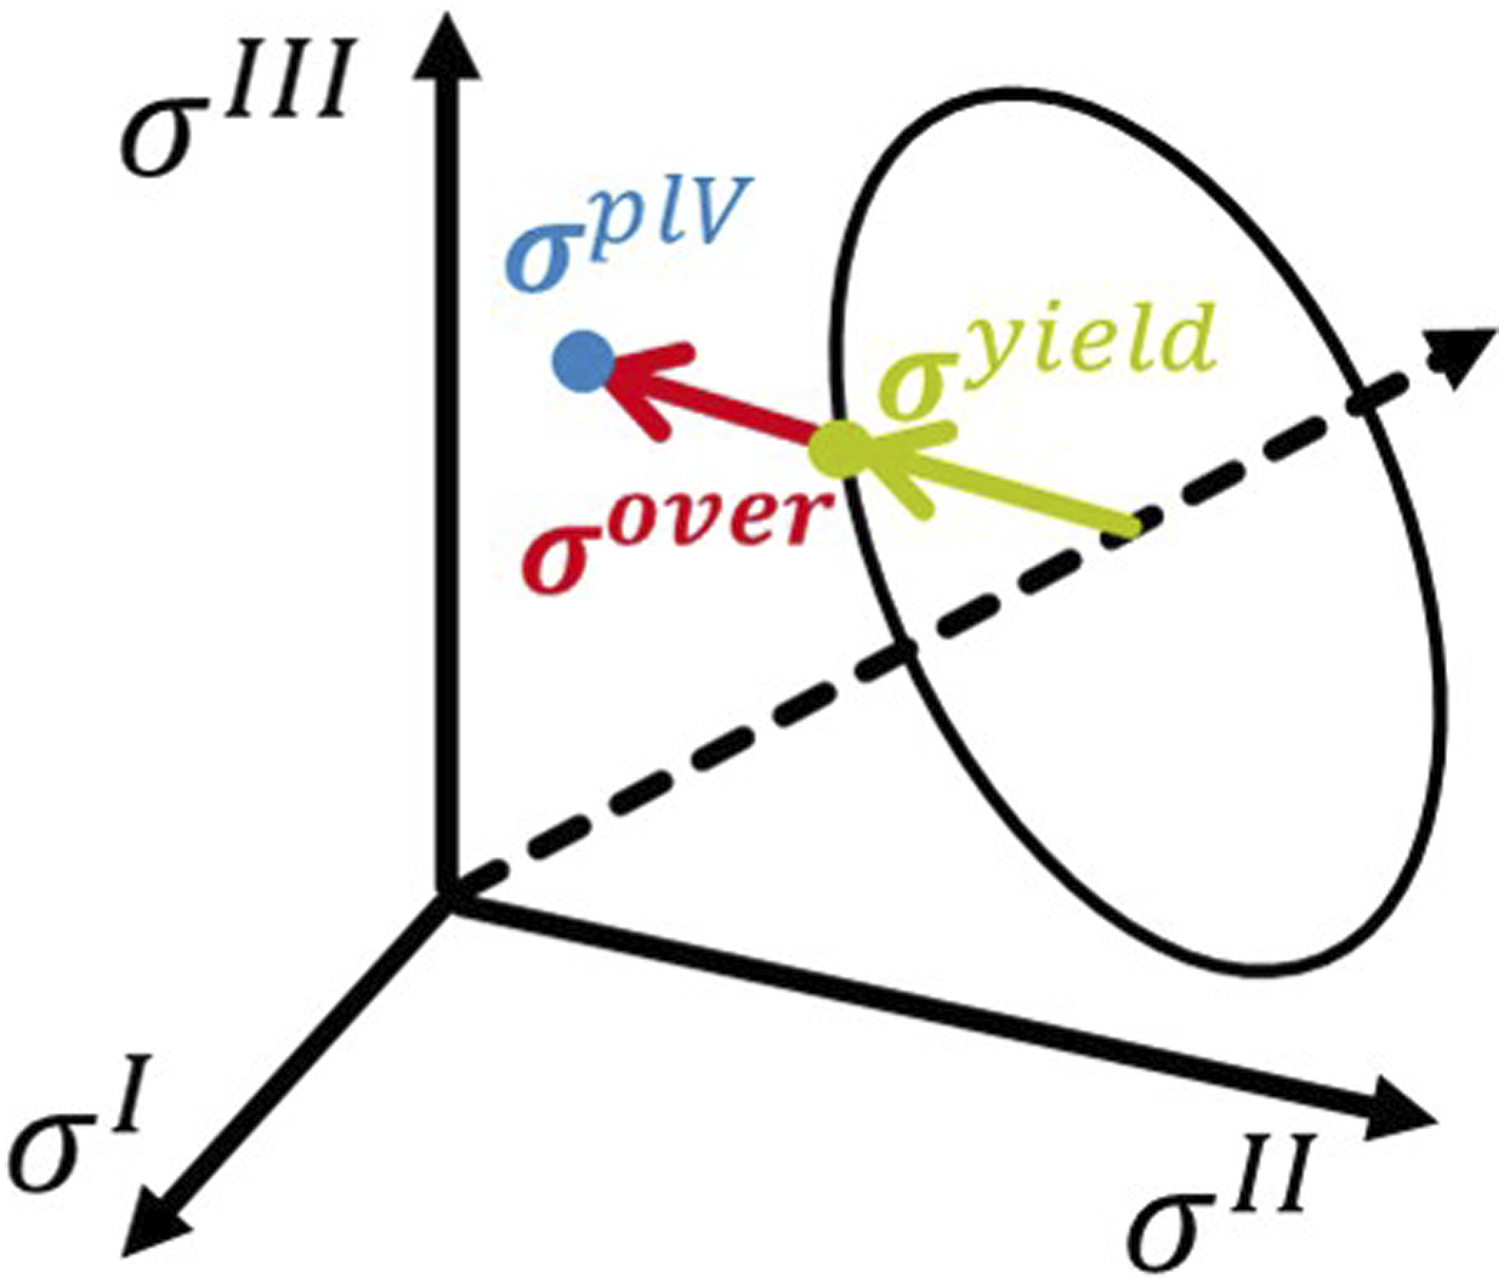
Following the stress above the yield stress, here called overstress
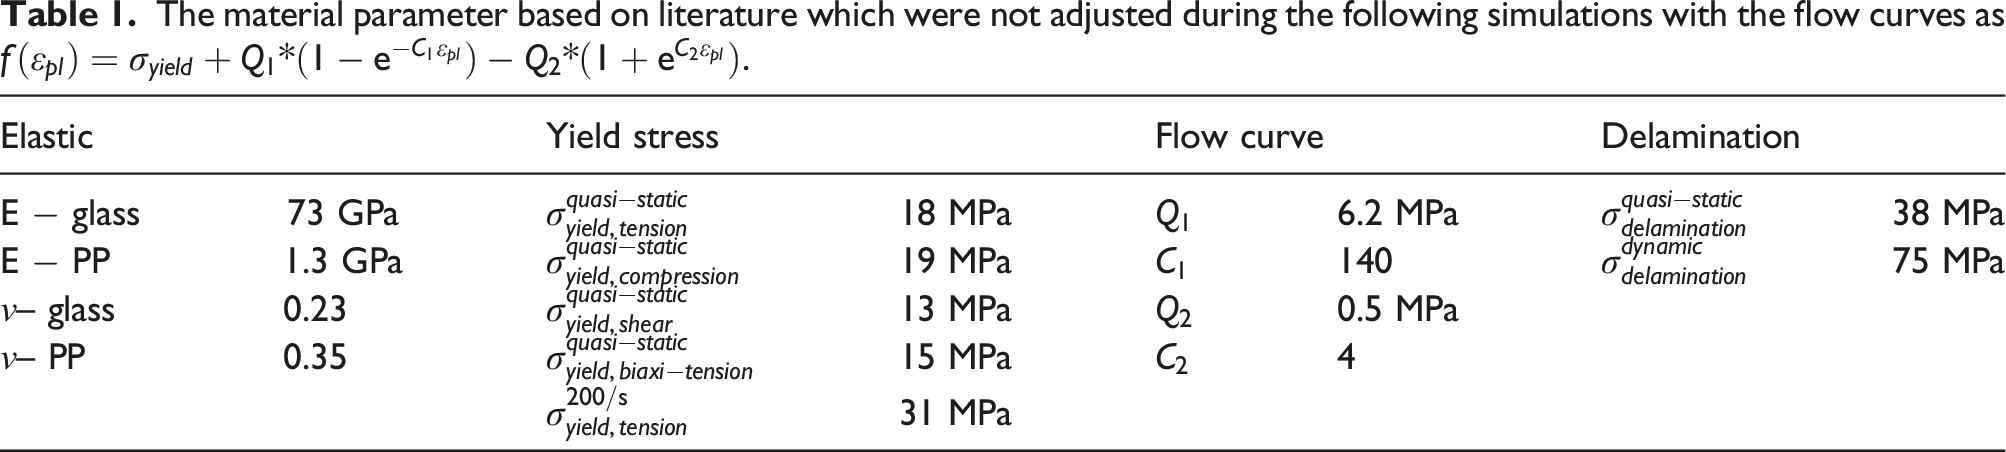
The material parameter based on literature which were not adjusted during the following simulations with the flow curves as
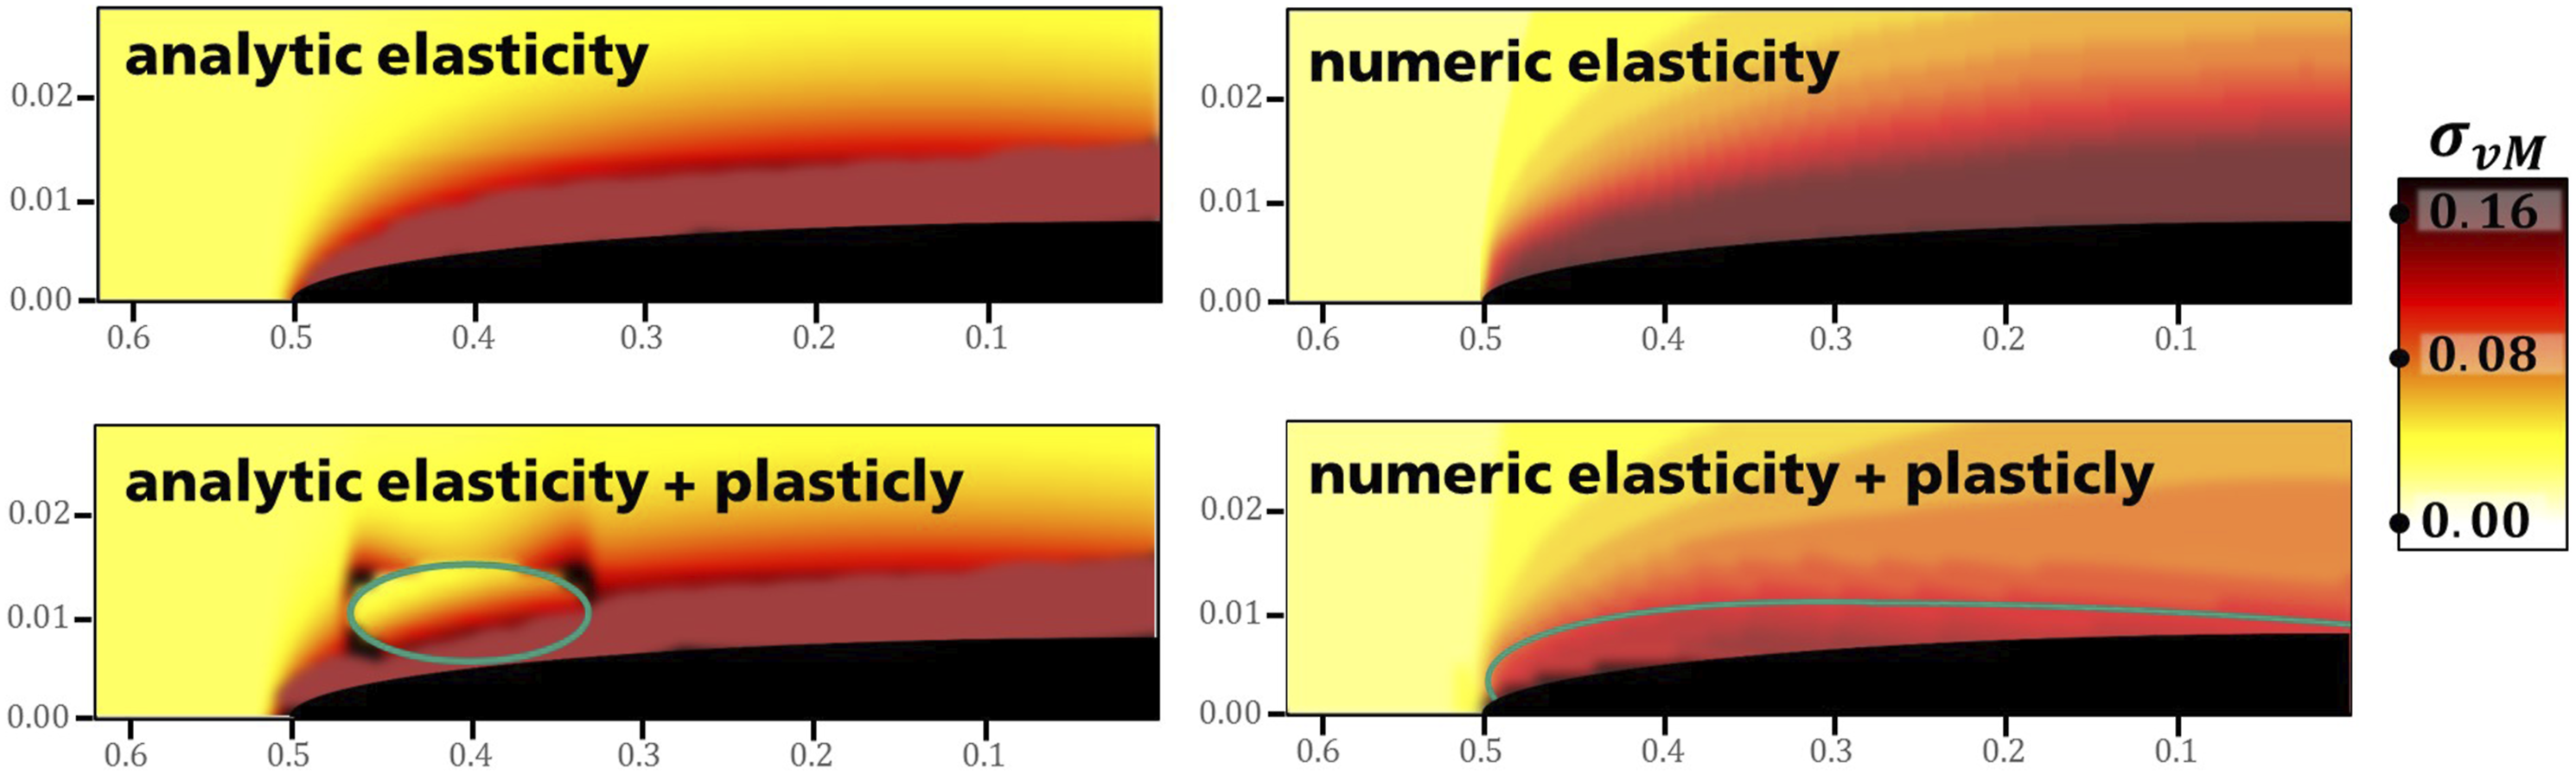
A comparison of the von Mises stress field between the analytic approximation (left) and the numeric validation simulation (right). Thereby the linear elastic for each modelling is displayed at the top. In the modelling accounting for plasticity (below) the regions of plastic deformation are marked.
A
With an approximation of the extent of the plasticly deformed volume the distortion energy density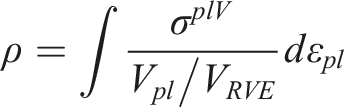
As discussed above the A comparison of the von Mises stress field caused by a partially delaminated fiber (upper) and by a by the same length shorten fiber (lower) with numerical simulations. The relative difference of the stress fields of Figure 10 and the relative difference whereby location of the stress maxima were matched.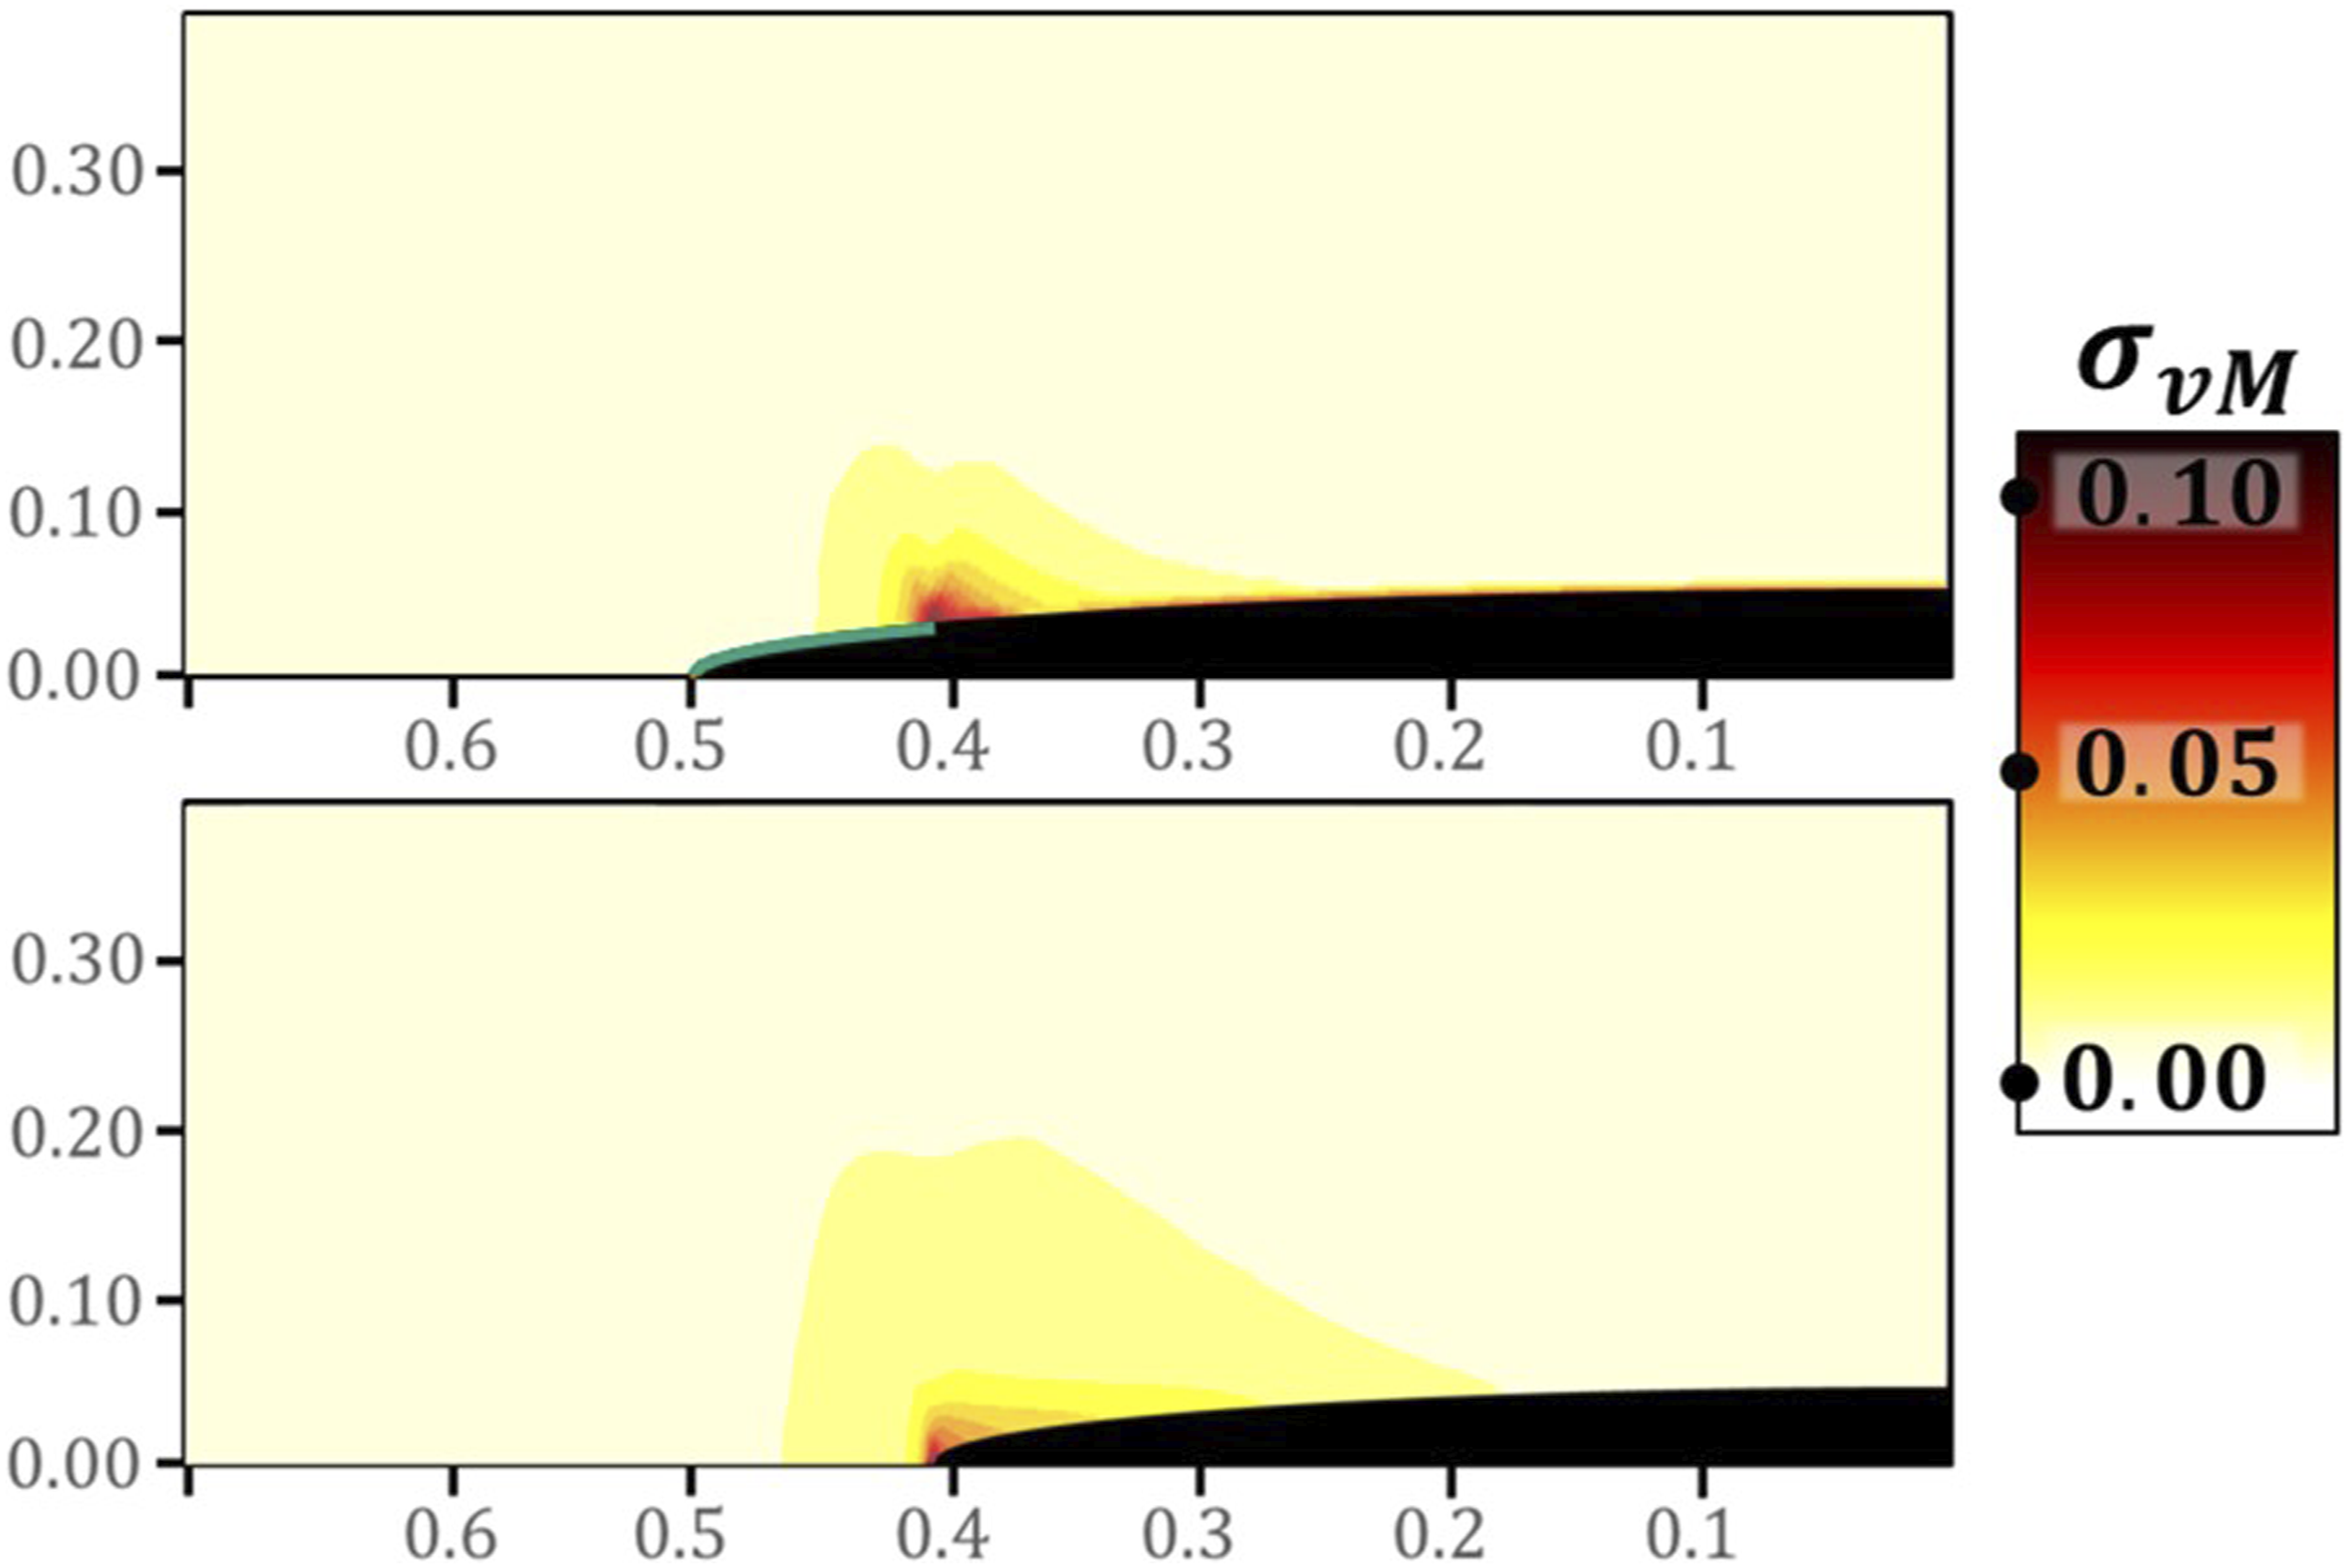
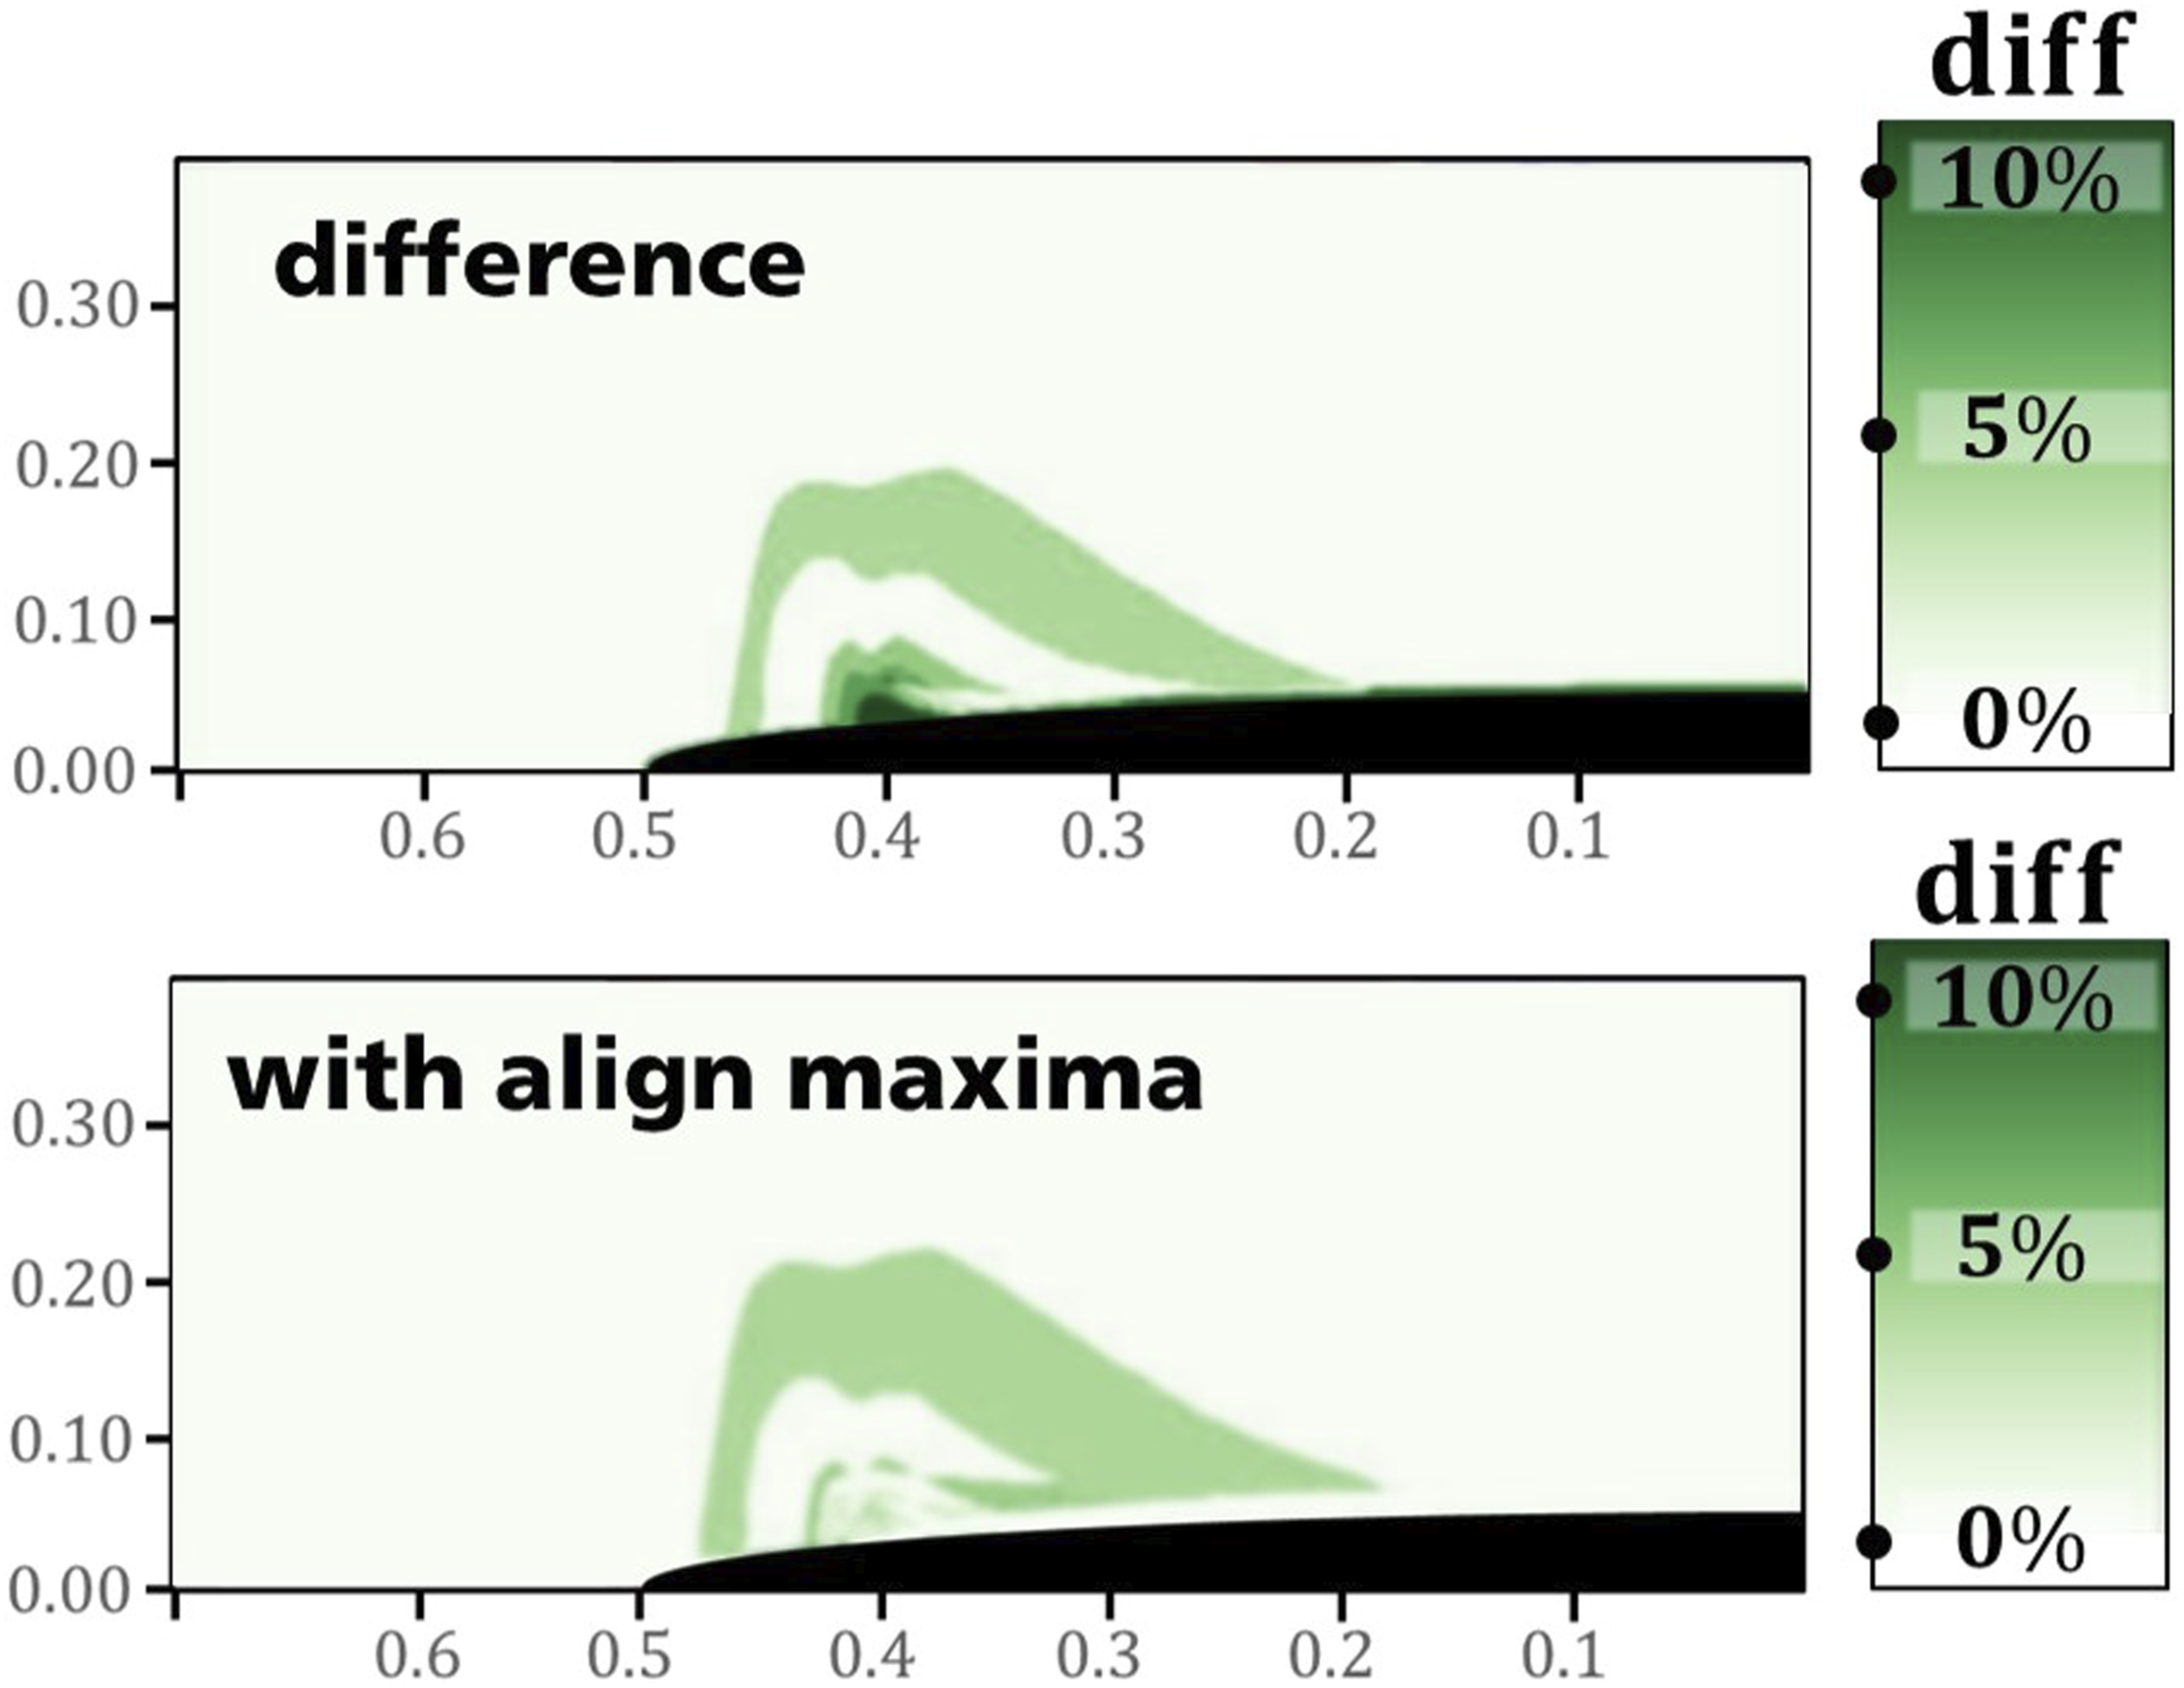
Consequently, the shortening of the effective fiber length is a good approximation of its debonding with regards to its stress field. This is implemented in the material model by checking the stress on the fiber surface point wise. If the delamination strength is exceeded the effective length of the fiber is reduced by that length. The delamination strength can be defined depending on the strain rate.
As the glass fibers are of cylindrical form and the Eshelby solution approximates the inclusions with ellipsoids, the influence of the fiber shape on the delamination must be discussed. In order to quantify this FE simulation are compared for quasi-static tension in fiber direction. First with cylindrical fibers and secondly with ellipsoids. In Figure 12 the stress field in the matrix material and the delamination is shown for three timesteps. For this simulation the linear elastic and delamination parameters discussed below (in Table 1) were applied. The delamination was again enabled by a tied-break-contact. At Finite element simulations for delamination with cylindrical and ellipsoidal fibers at three timesteps.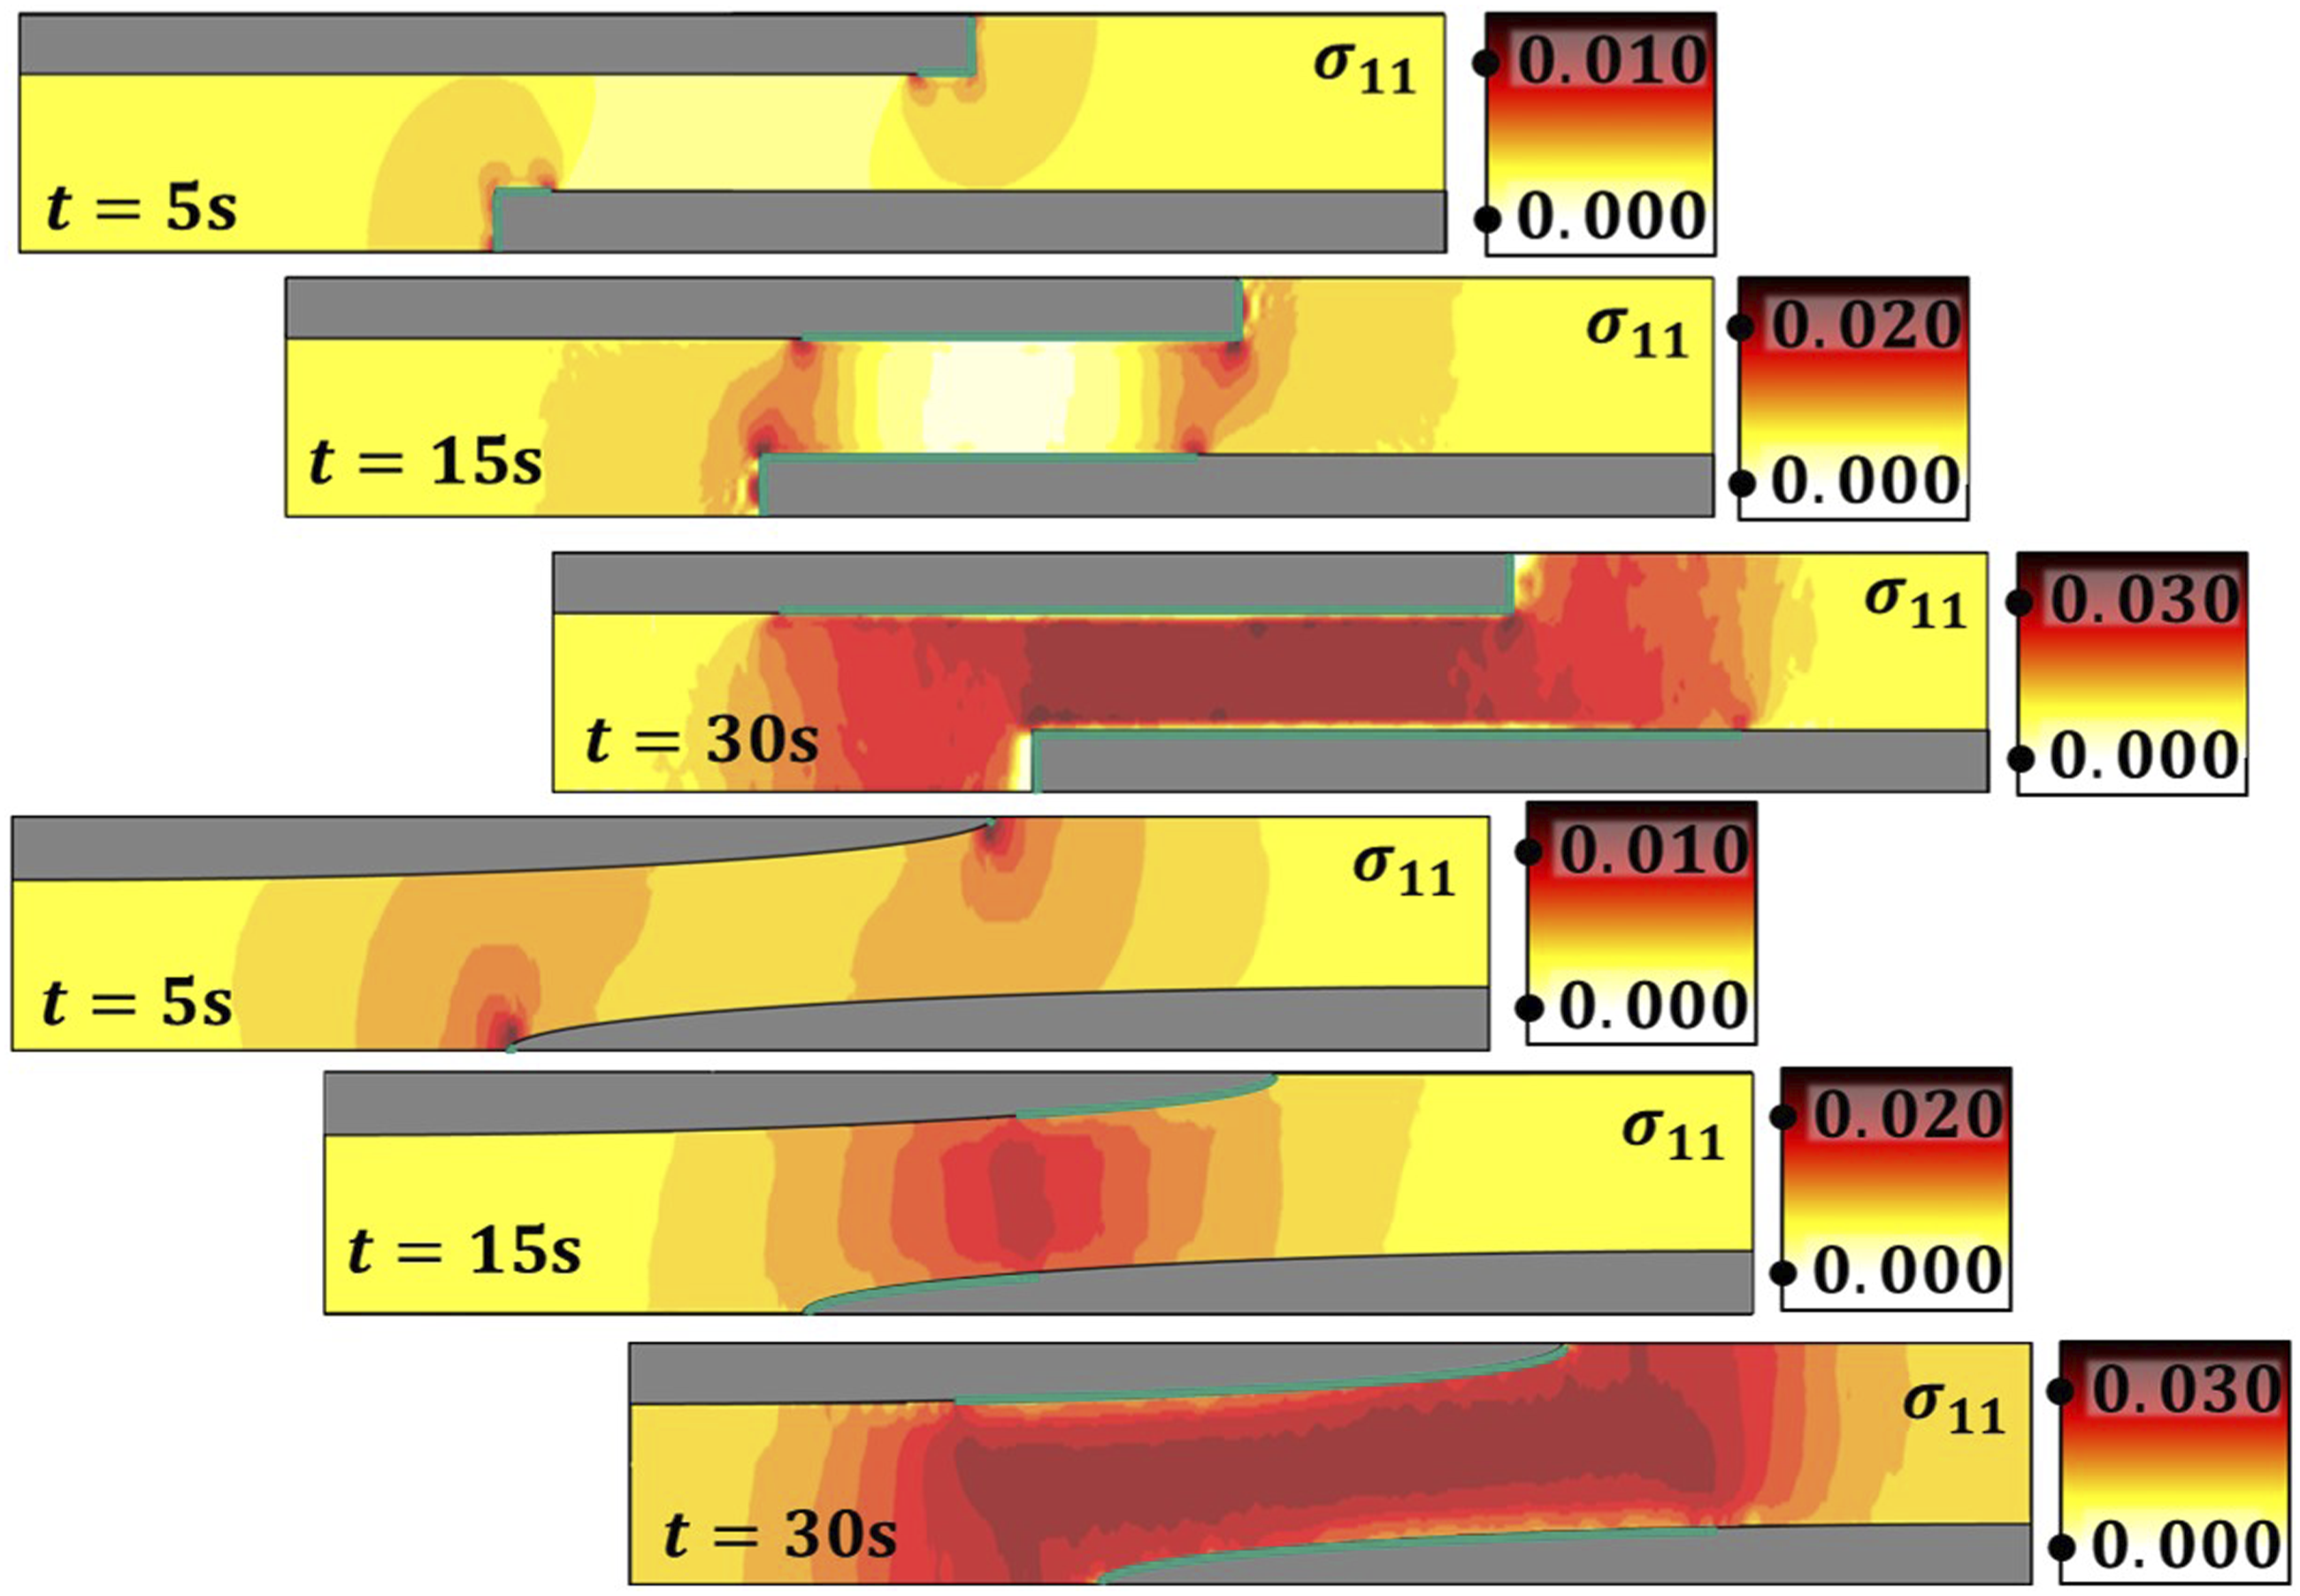
This exemplary simulation shows that the fiber shape has an influence on the delamination. The edge of the cylindric fibers causes an earlier detachment. But it also shows ellipsoidal fibers show qualitatively the same behavior and the delamination length even catches up in time. It can therefore be said that using ellipsoidal shape for the fibers is a simplification, but a justifiable and necessary simplification to find an analytical solution.
The failure model as described above was implemented as a user routine in LS DYNA. For the elastic and plastic material behavior the model of Schulenberg et al. 6 was used. Thereby a strain rate dependent elasticity can be described and the local fiber distribution is taken into account with the homogenization methods of Mori and Tanaka 38 as well as from Advani and Tucker. 39 The plasticity is strain rate dependent as well and the yield surface consists of three Hill surfaces 40 weighted by the eigenvalues of the local fiber orientation tensor with an exponential flow rule.
The numerical performance of the user material model is noticeable different compared with standard material models in LS DYNA with anisotropic behavior. The simulation speed is about 5–10 times slower from the onset of plastic deformation. But with a revision of the structural setup of the failure model, greater speed would be possible, as its initial implementation placed more emphasis on clarity than numerical efficiency.
Validation on characterization experiments
In the following the established failure model for SFRP is applied to characterization experiments. The critical distortion energy density
Tensile specimens in molding direction and 90° to the molding direction, tensile shear specimens and punch specimens for biaxial loading were manufactured from molded plates with 2.8 mm thickness of a PP-GF30. The specific geometries and measurements are shown in Figure 13. Each specimen is subjected to a quasi-static and a dynamic load resulting in eight configurations. A more detailed description can be found in Sommer et al.
4
Geometries and dimensions of tensile, shear and punch specimens. Colored grey are firmly clamped areas.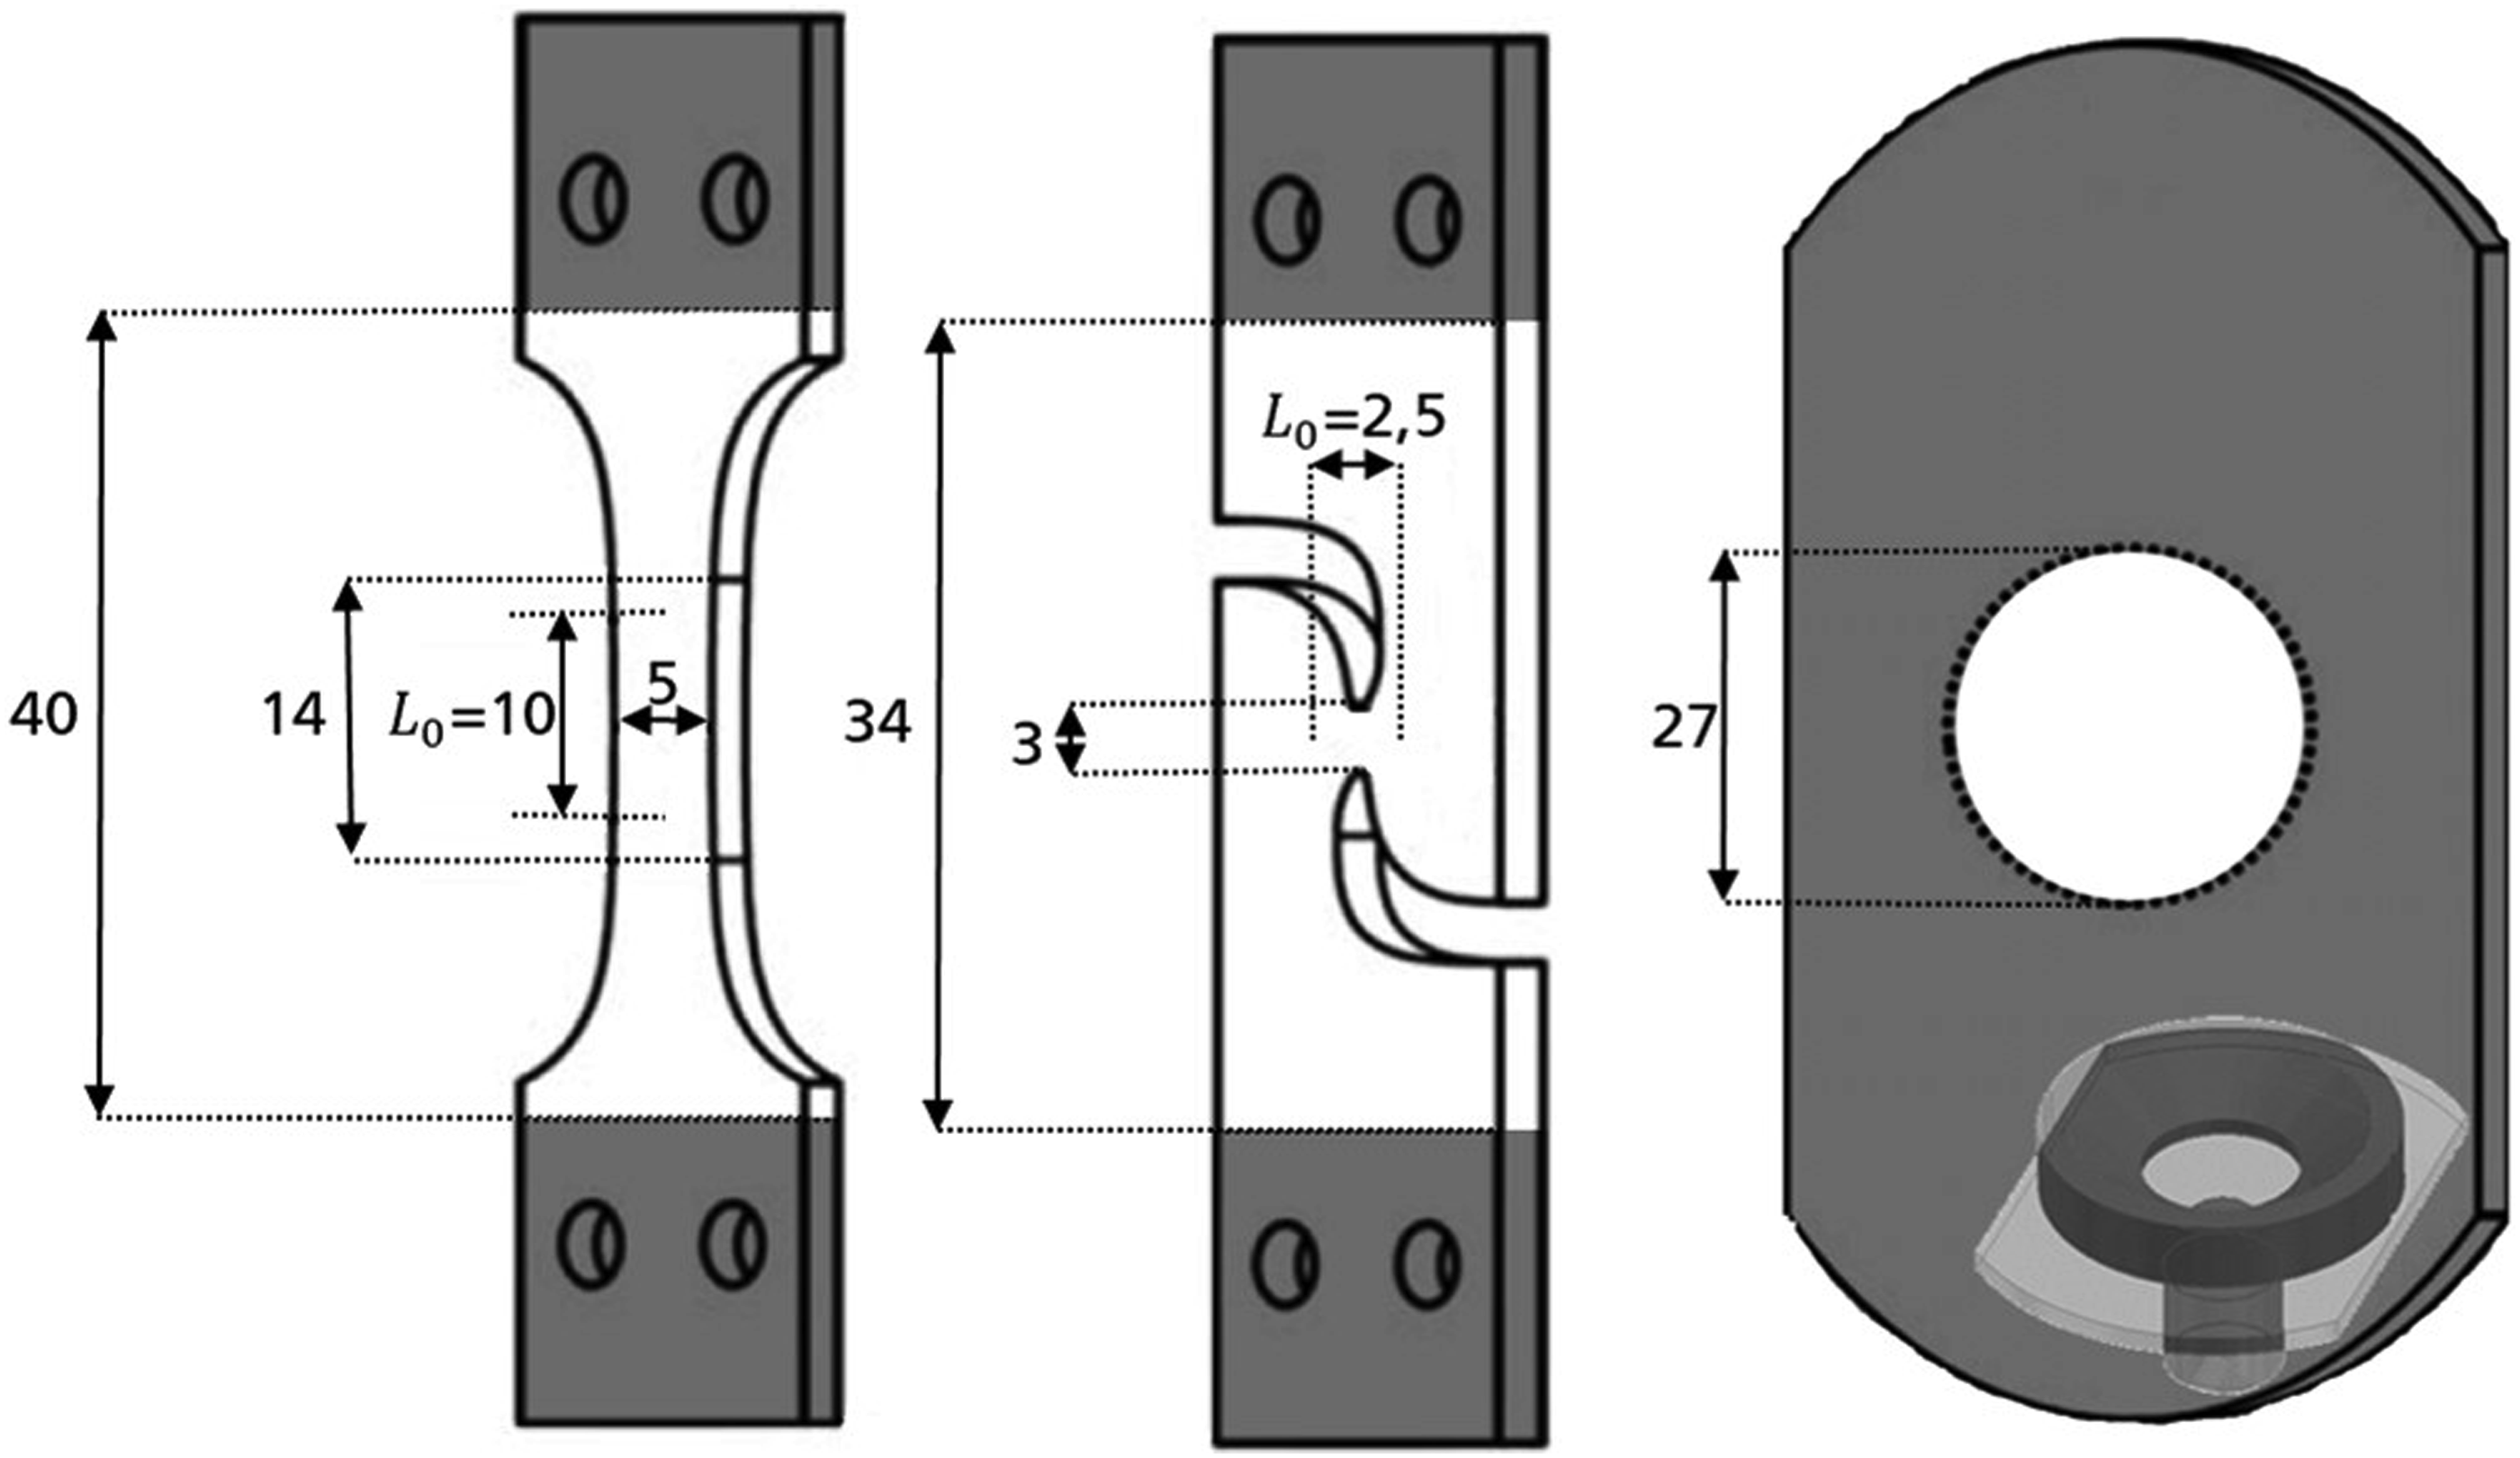
The specimens are represented by a finite element mesh of volume elements of hexahedral form with an edge length of 0.5 mm and simulated in LS DYNA using the proposed failure model. The same deformation velocities as in the experiments were applied. The force per area and elongation normalized on
The failure model requires some material parameters that can be found in the literature and which were not fitted during the simulations (see Table 1). Firstly, the linear elastic parameter of fiber and matrix, which were direct manufacturer information. In addition, the plastic behavior of the matrix must be described including the influence of strain rate and stress triaxiality. These flow curves were obtained by simulating the characterization experiments on pure polypropylene in Lienhard and Schulenberg
41
and Sommer et al.
4
and fitting the material model parameters (see Figure 14). Here it was only necessary to fit the yield stress, but in general the whole flow curve can be adjusted.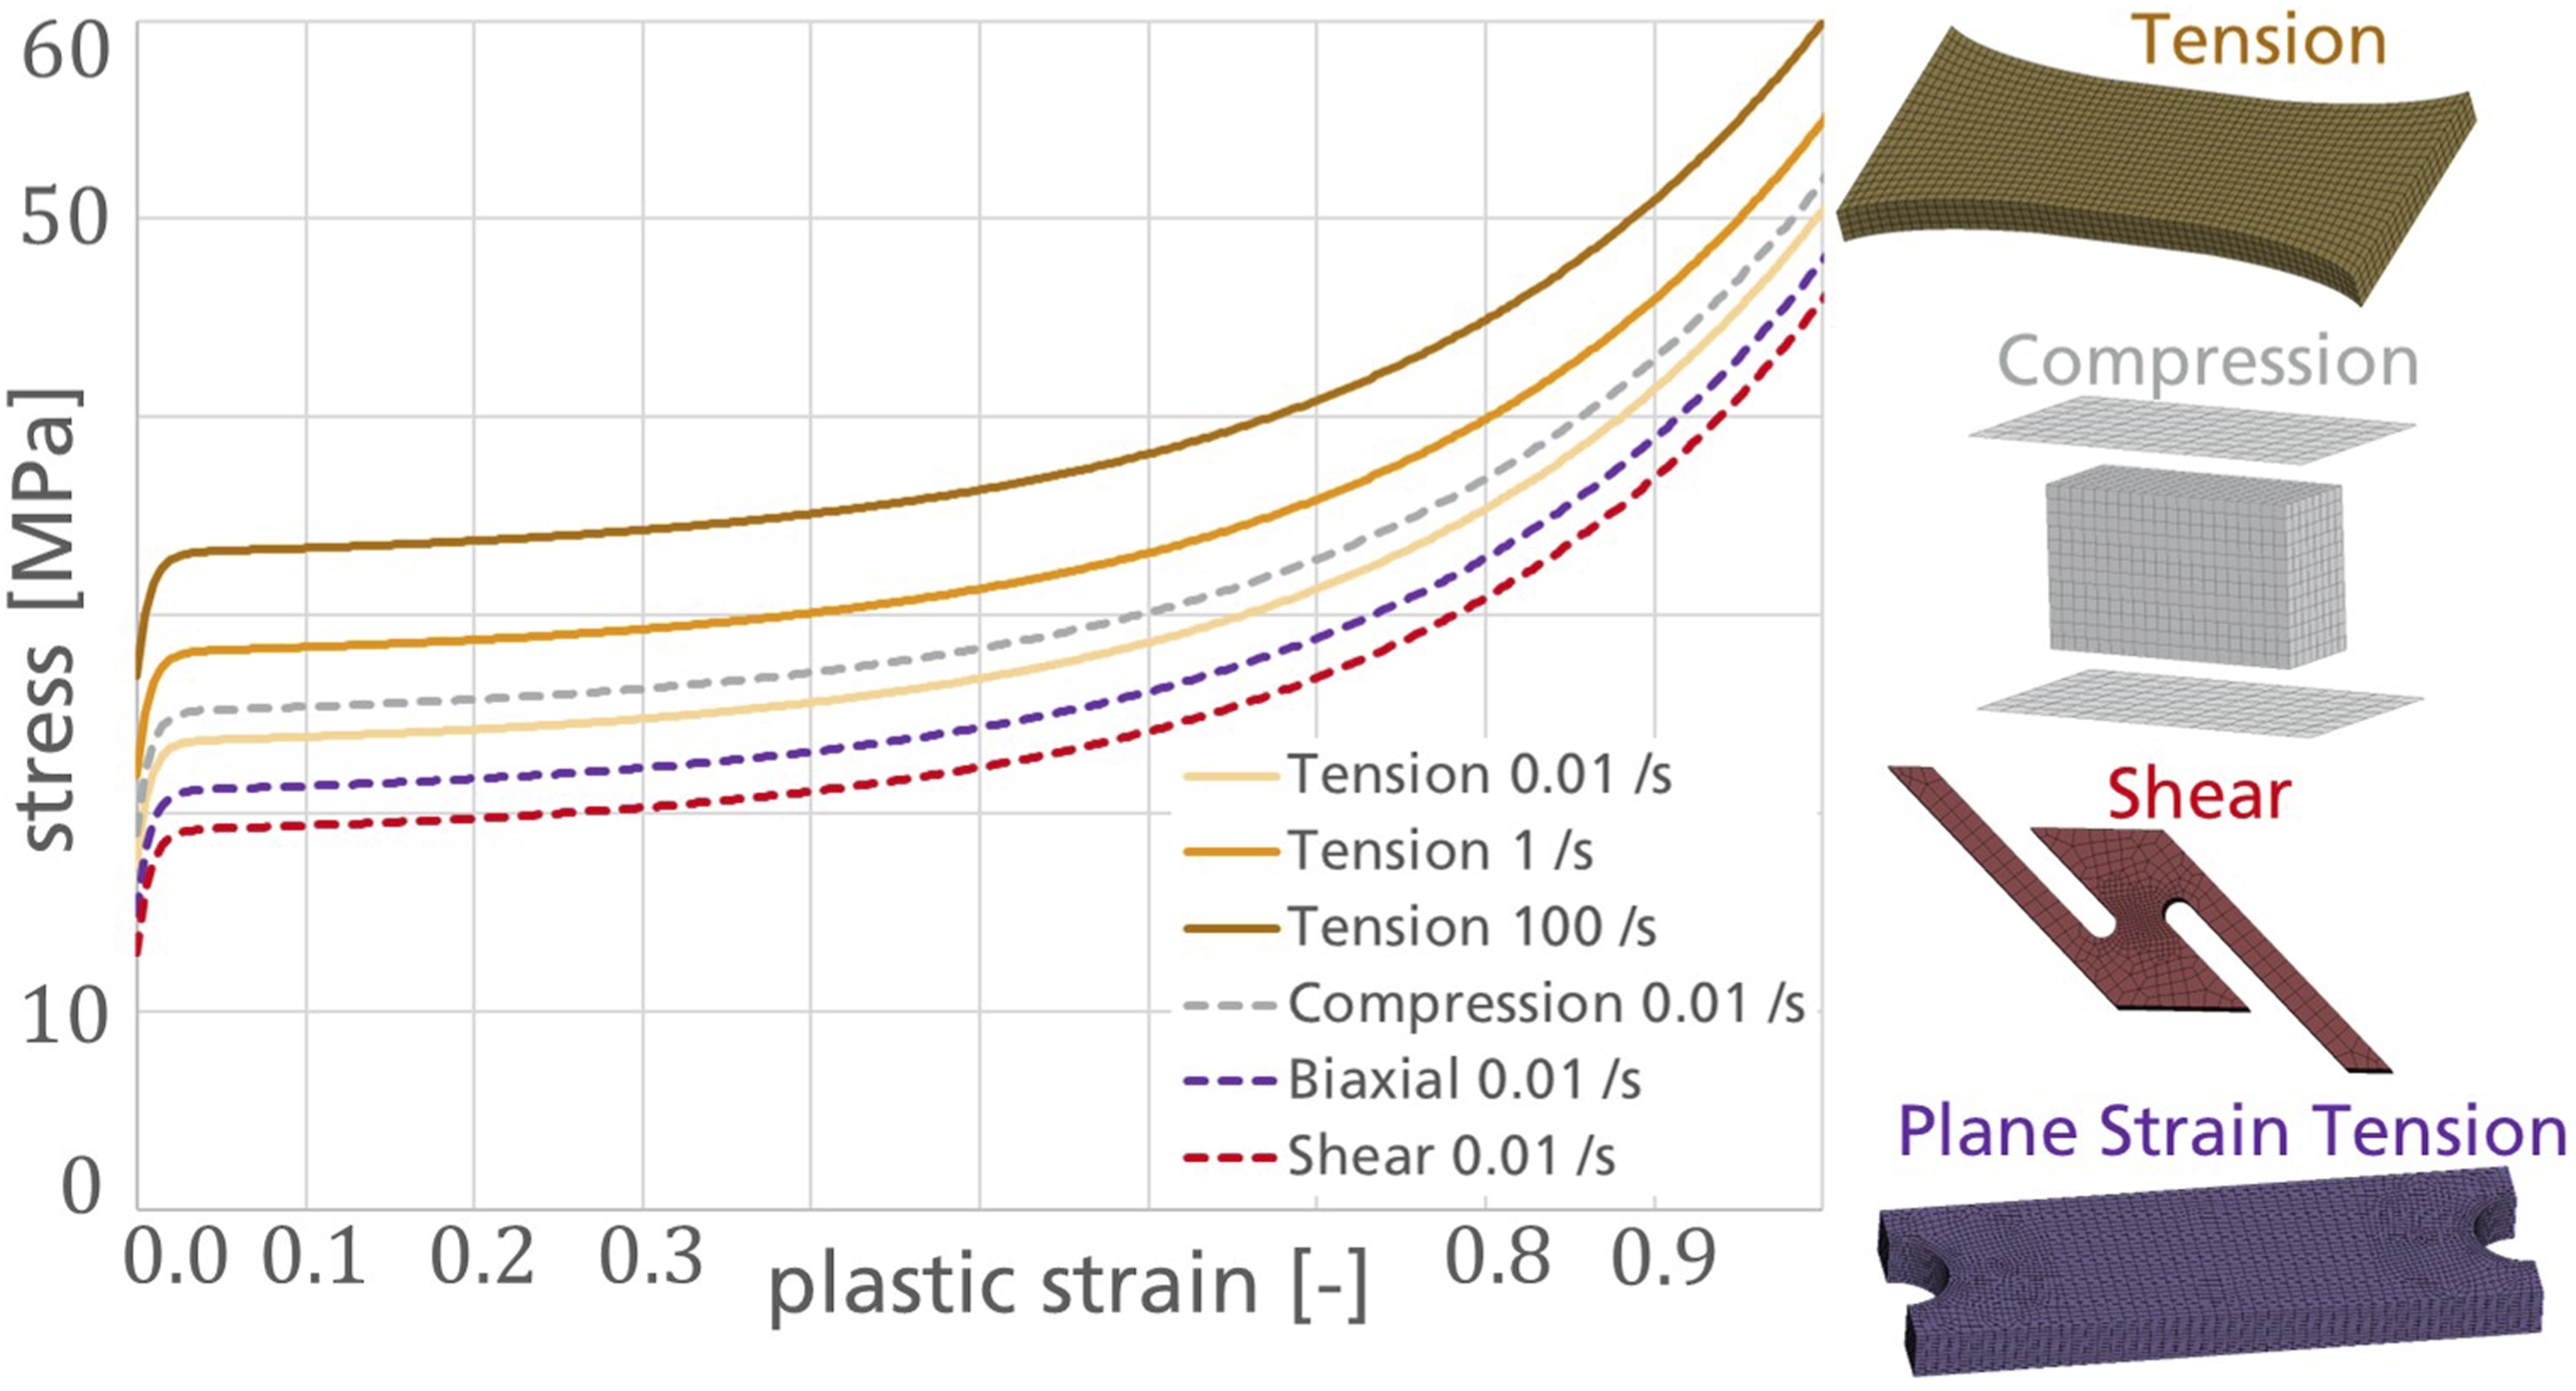
Most importantly the failure model features a strain rate dependent delamination. Whereas a critical stress for quasi-static loadings is well established in literature,24,25 for high loading velocities the direct experimental characterization is still a challenge. With the experimental work of Tanoglu et al. 25 on the delamination of glass fiber reinforced epoxy-amine and the molecular dynamic simulations of Zhang et al. 26 on glass fiber reinforced polypropylene at very high strain rates the critical stress can be approximated to 75 MPa at 250/s with an uncertainty of about 10 MPa. Thus, this should be verified experimentally in the future.
The only parameter which was optimized was the critical energy density
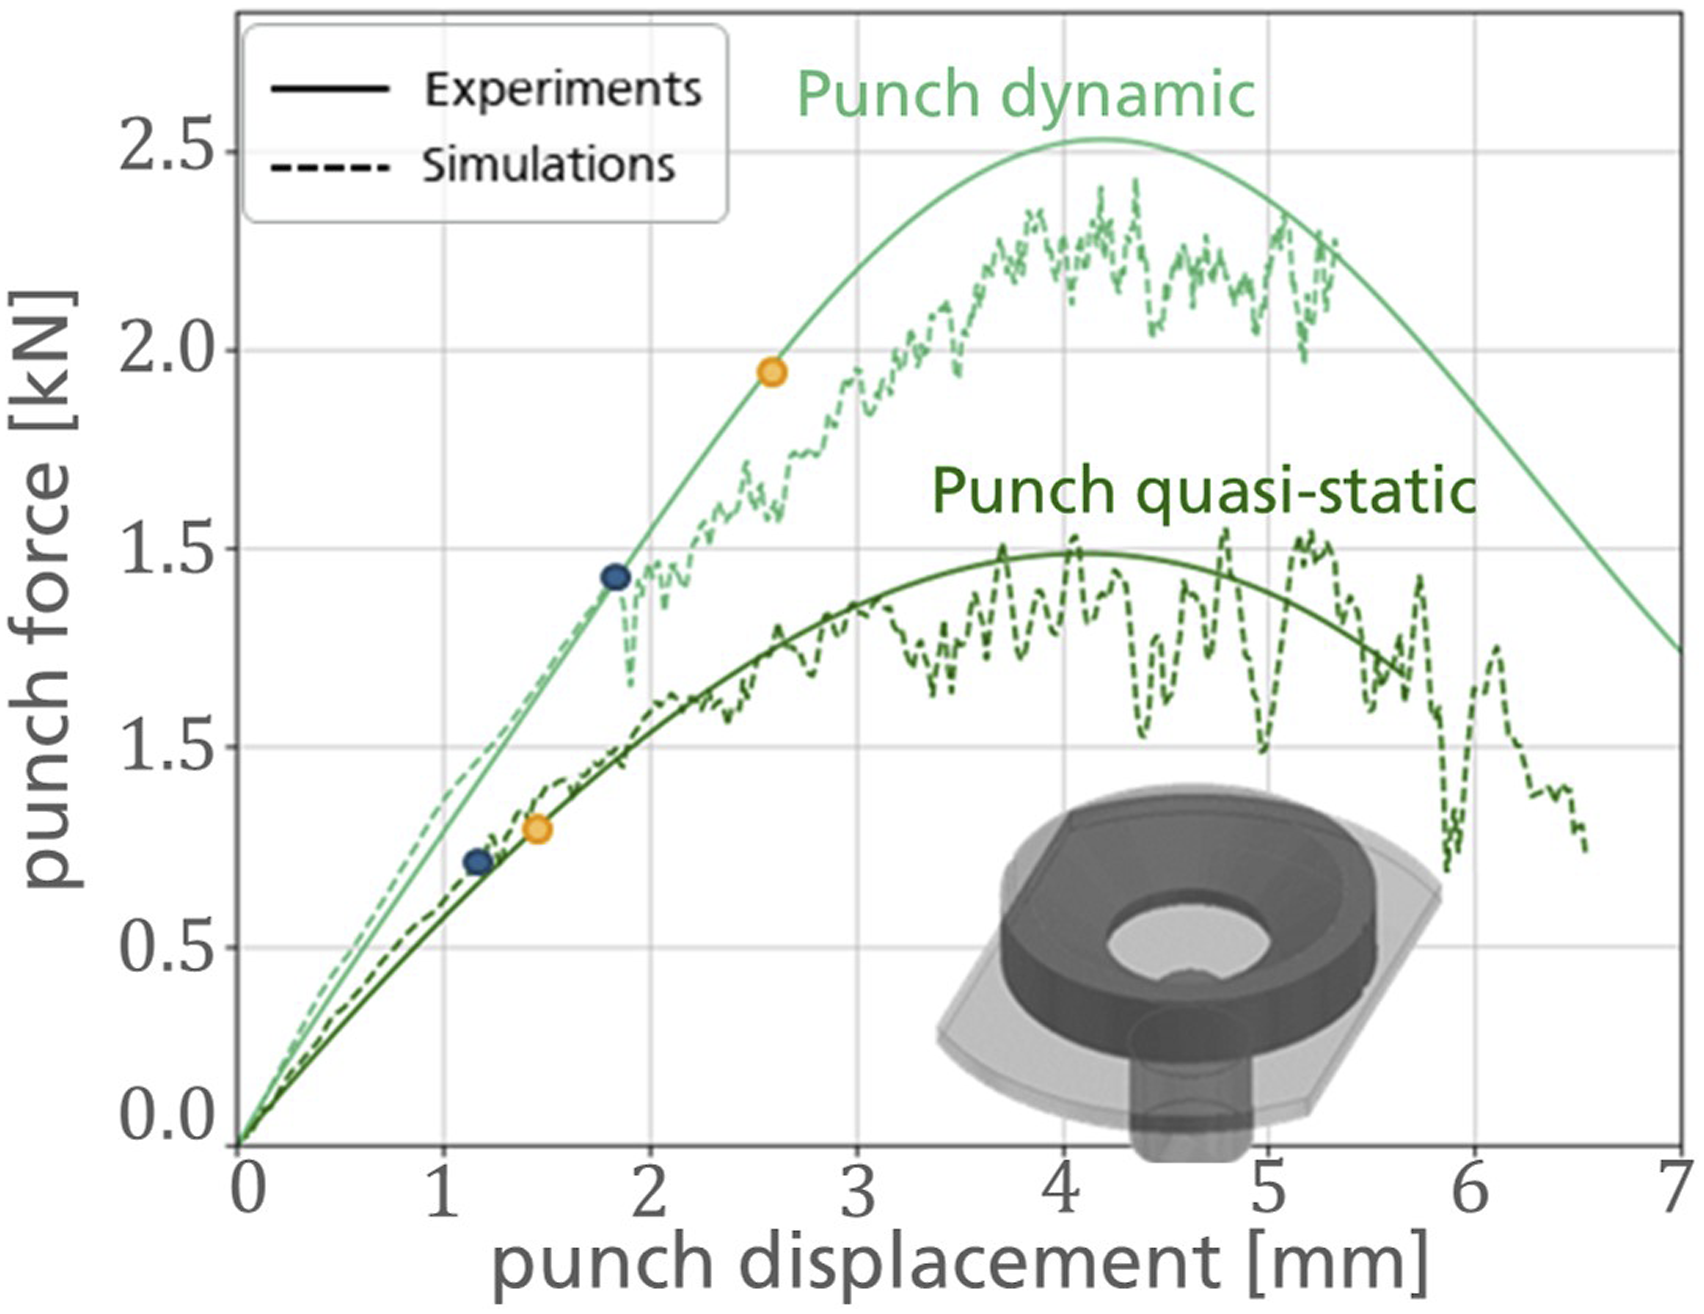
In Figures 15–17 the Comparison of the experimental (solid lines) and the simulated results (dashed lines) for the tension in 0° and 90° to the molding direction. A quasi-static load at 0.001/s and a dynamic load at 200/s is applied. Comparison of the experimental (solid lines) and the simulated results (dashed lines) for shear test. A quasi-static load at 0.001/s and a dynamic load at 200/s is applied. Comparison of the experimental (solid lines) and the simulated results (dashed lines) for the punch test. A quasi-static load with a punch velocity of 0.01°mm/s and a dynamic load with 1400°mm/s is applied.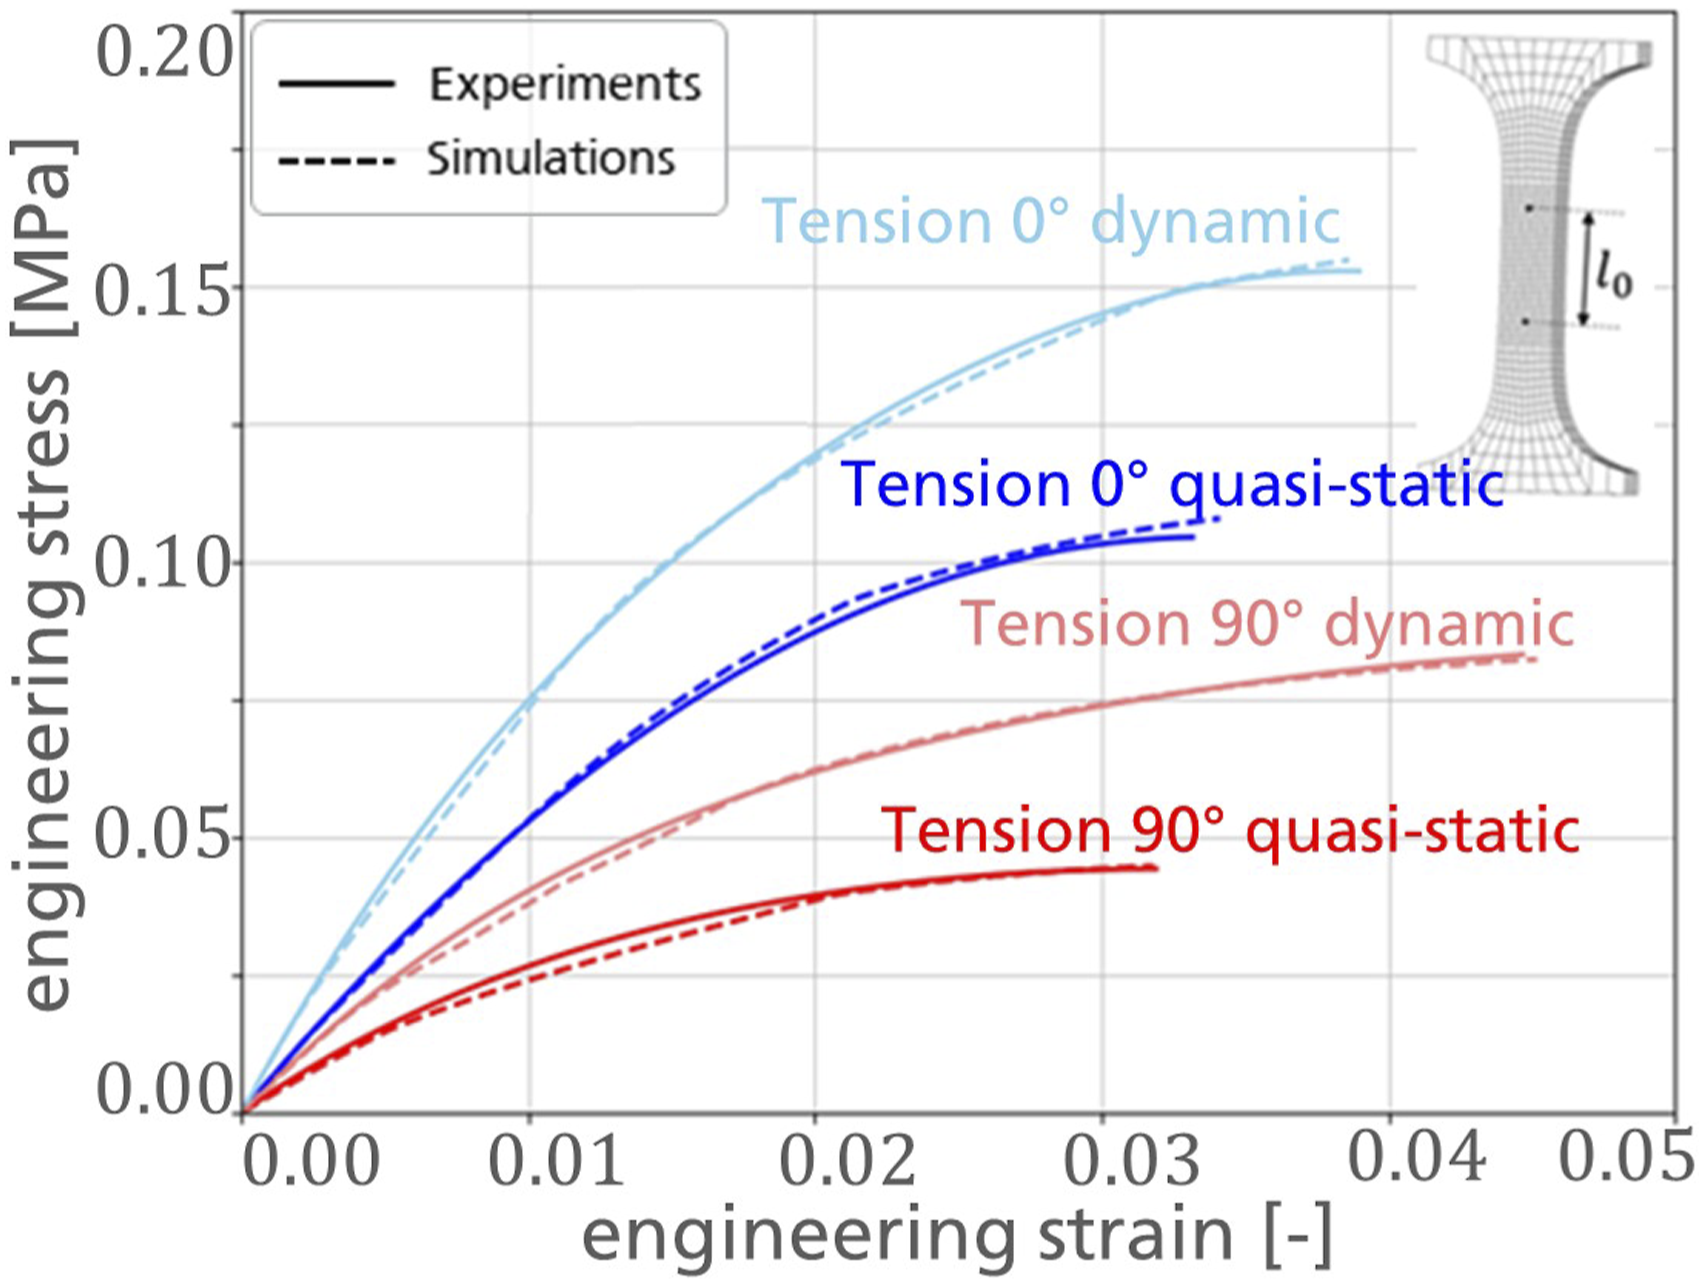
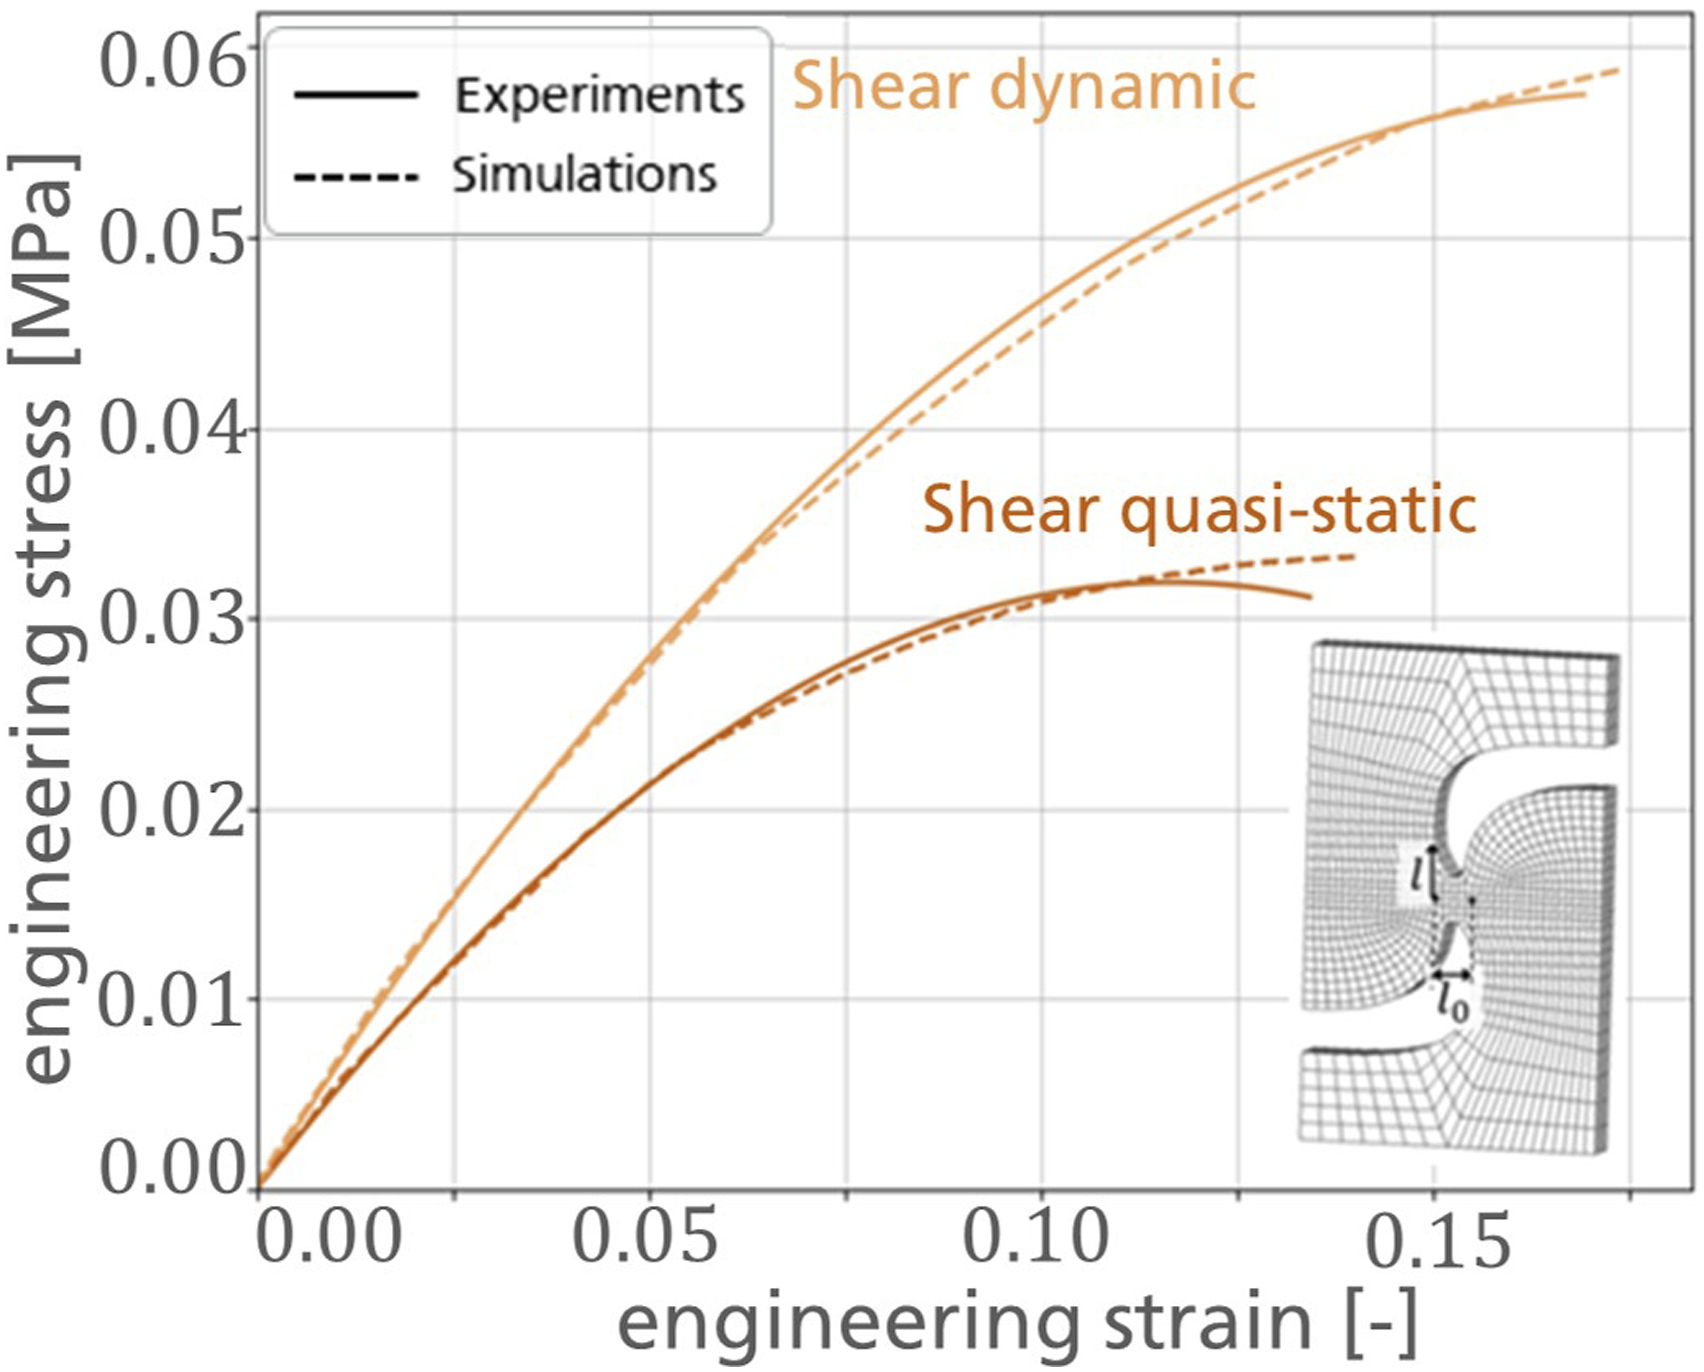
In Figure 16 one can see that the high deformations by applying shear can be reached as well. In the quasi-static case, the experiment shows a slight softening before failure, which cannot be described by the simulation. This suggests that implementing a stress-damage coupling would solve this divergence.
For the punch tests in Figure 17, additionally to the force–displacement curves the optically visible initial failure on the surface of the specimen is marked by points for the experiment and the simulation respectively. In the dynamic loading for these points a deviation is found. This could be explained in several ways. The exact time of the initial failure is often hard to determine as small cracks might occur which are not observed optically. Therefore, the initial failure might be experimentally detected too late, and the real initial failure happened earlier at a punch displacement closer to 2 mm. Another influence to consider is, that the punch is the only test with deformation components out of plane where bending occurs. This can lead to different behavior. Or these results might hint on a dependency of the critical energy density on the stress multiaxiality. Dynamic test on a biaxial tensile machine would lead to answers.
For a better understanding of the modeled microscopic effects in the following an analyzation is done of the calculation made by the failure models. Thereby, elements are selected where the failure in the specimen initiates. In Figure 18 the prediction for these critical elements for four simulations are displayed, the tension in 0° and 90° for the quasi-static and the dynamic load. As for the stress fields discussed previously, the upper left of a fiber is shown in the symmetry plane for The local predictions of the failure model in elements of first failure. The quasi-static case (upper) is compared with dynamic loading (lower) for the tension in fiber direction (left) and transverse (right). The fibers and their delamination are depicted (black and grey) as well as the development of the plasticly deformed volumes over time.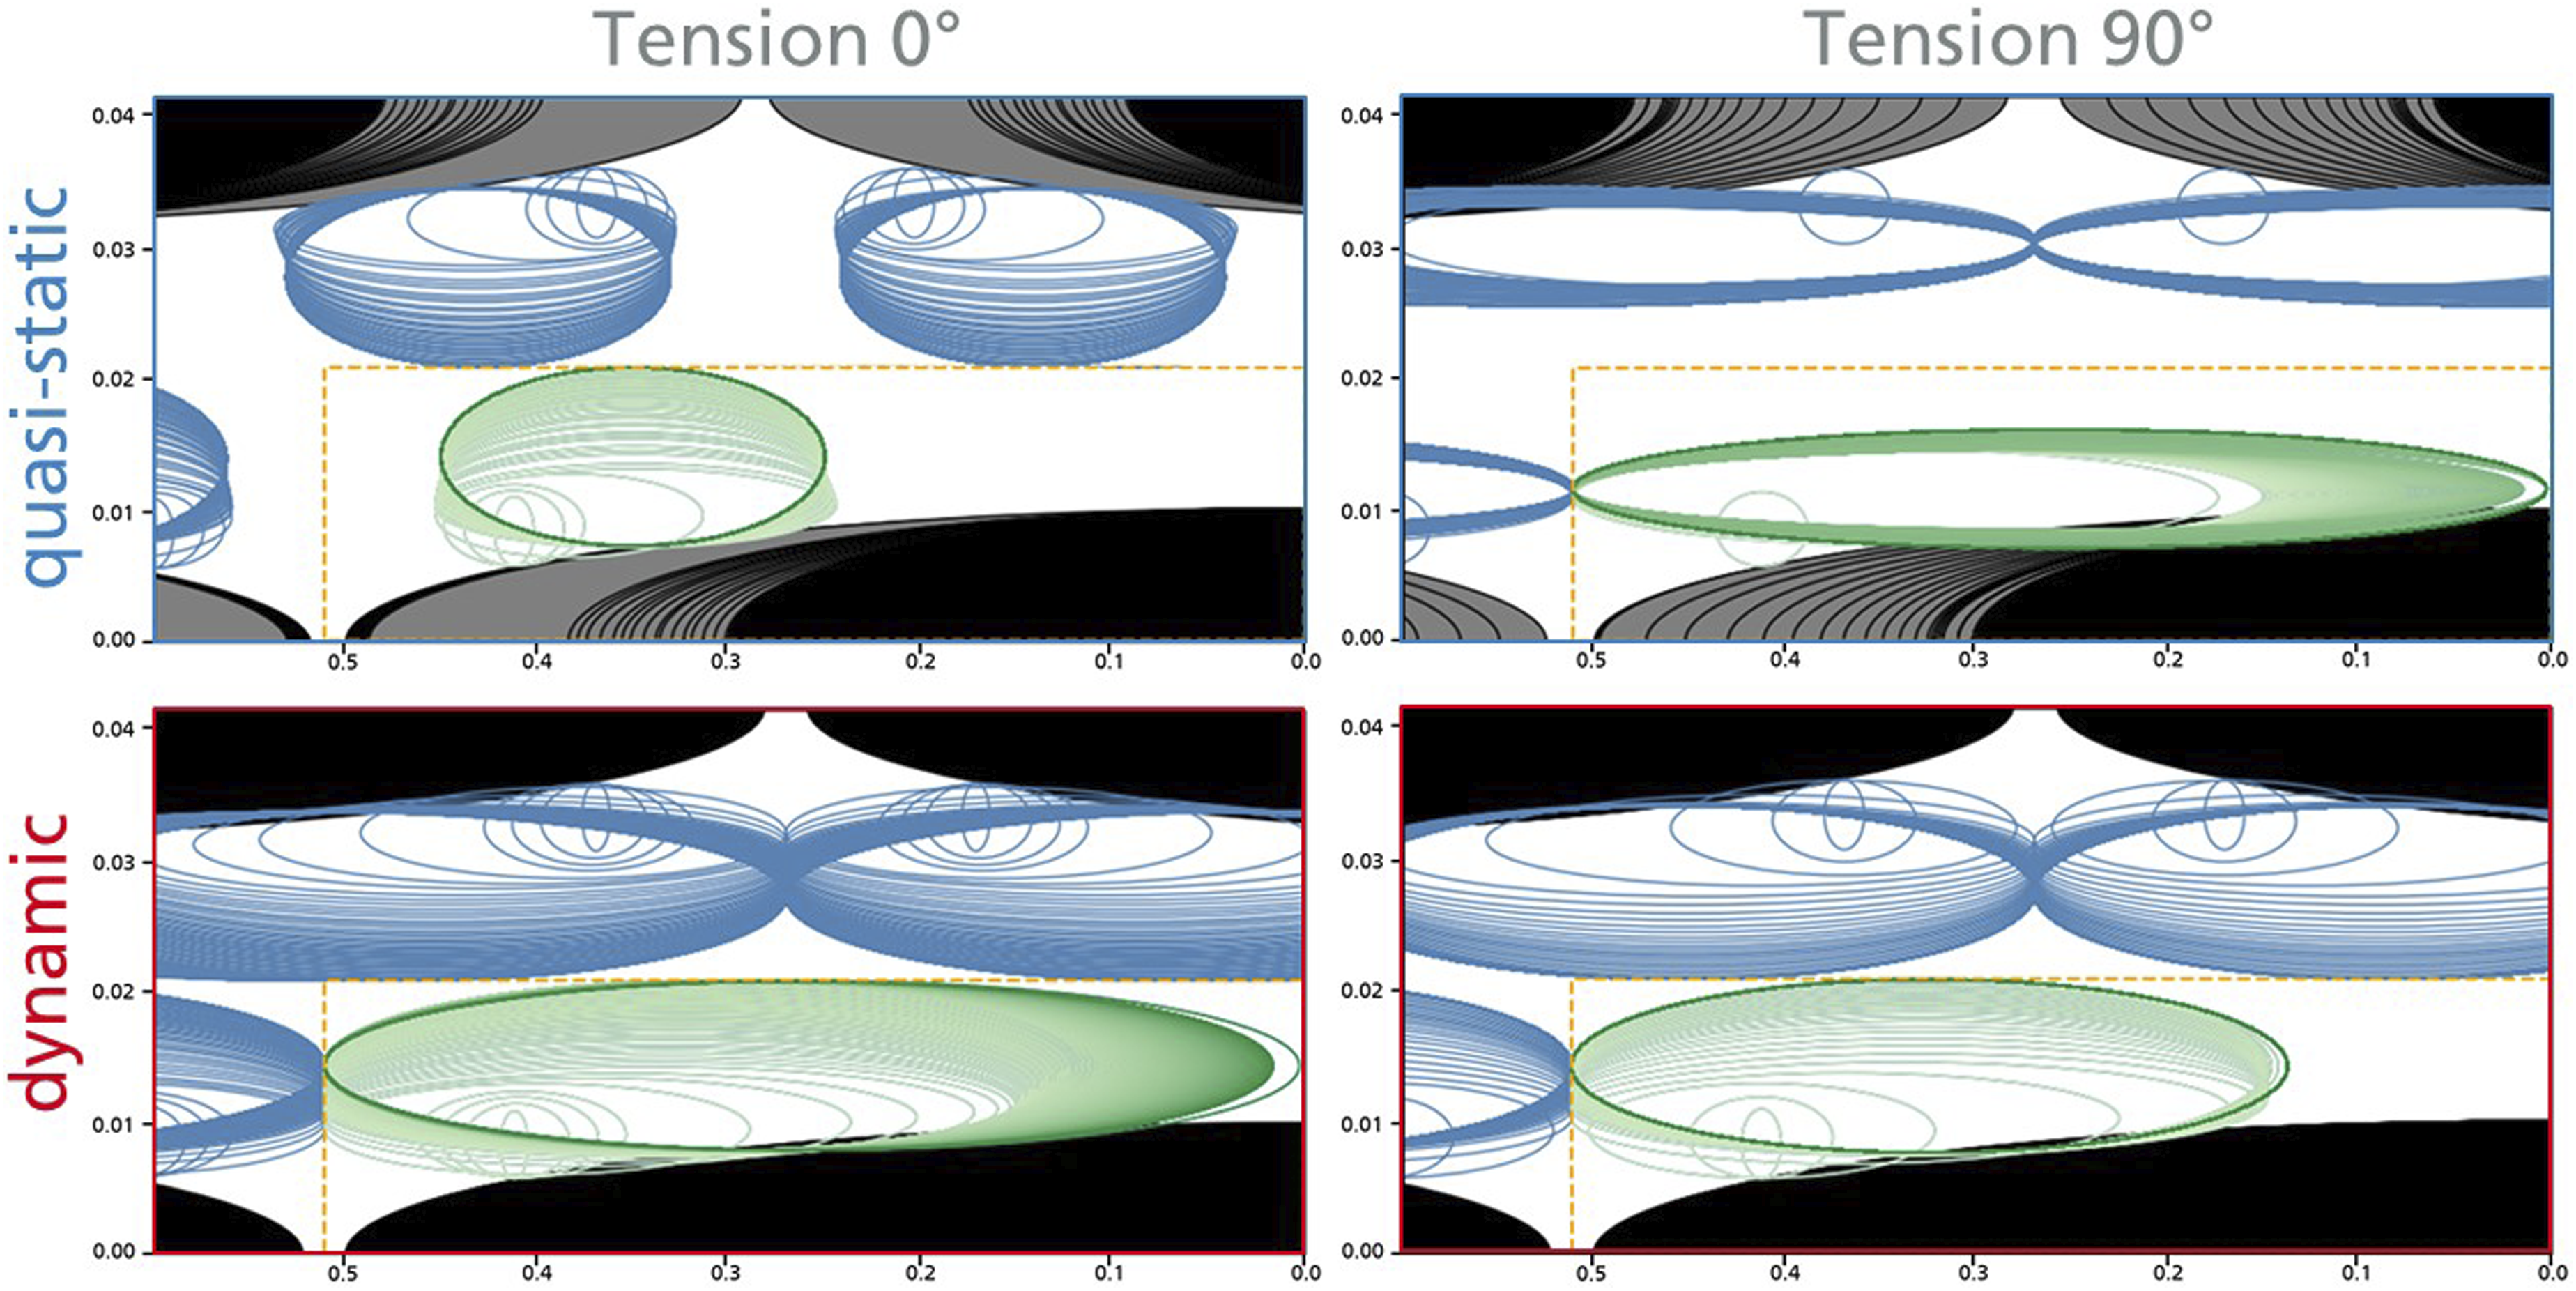
The failure model only calculates stresses within the borders of the symmetry element marked by the dashed line. Nonetheless for clarity neighboring fibers and their associated plasticly deformed volumes are displayed as well.
For the quasi-static tension in 0° a significant delamination is calculated and as a result of that the plasticly deformed volume stays small and localized close to the fiber ends. Together with the plasticly deformed volume of a neighboring fiber and the delaminated fibers, they form a band (from top to bottom) just as observed in the experiments (see Figure 2). A similar behavior is predicted in the quasi-static tension in 90°. Here the delamination leads to a small plasticly deformed volume stretching along the fiber length and forming a band in this direction (from left to right).
Applying a dynamic load for tension neither in 0° nor in 90° a delamination occurs with the failure model. Subsequently the size of the plasticly deformed volumes is higher covering almost the whole matrix and the critical energy density is reached later.
Validation on component experiments
After applying the failure model to characterization experiments, where a specific deformation is provoked, its transferability to more real crash scenarios is tested with complex deformations. The form of the molded component is a U-profile of 75 mm width, 245 mm length, and 60 mm height and a wall thickness of 2.4 mm. A full description of the experiments can be found in Sommer et al. 4
For the simulations the local fiber orientation was obtained from a molding simulation and mapped to the FE model. Two load cases are tested. The first is a 4-Point-Bending, where one side is restricted to ensure a reproducible behavior (see Figure 19). As before in the characterization experiments, two strain rates are tested and simulated with the calibrated user model. For both velocities the material model is accurate in the initial stiffness and the first failure marked by the first rapid decline in the punch force. Dynamically the force drops to zero at 10 mm whereas quasi-statically a plateau is observed till about 20 mm. This can be predicted by the model as well, though the level of the force plateau is calculated slightly too low. A component test with 4-point-bending, quasi-static and with a punch velocity of 1250°mm/s, comparing the experiment (solid lines) and the simulations (dashed lines).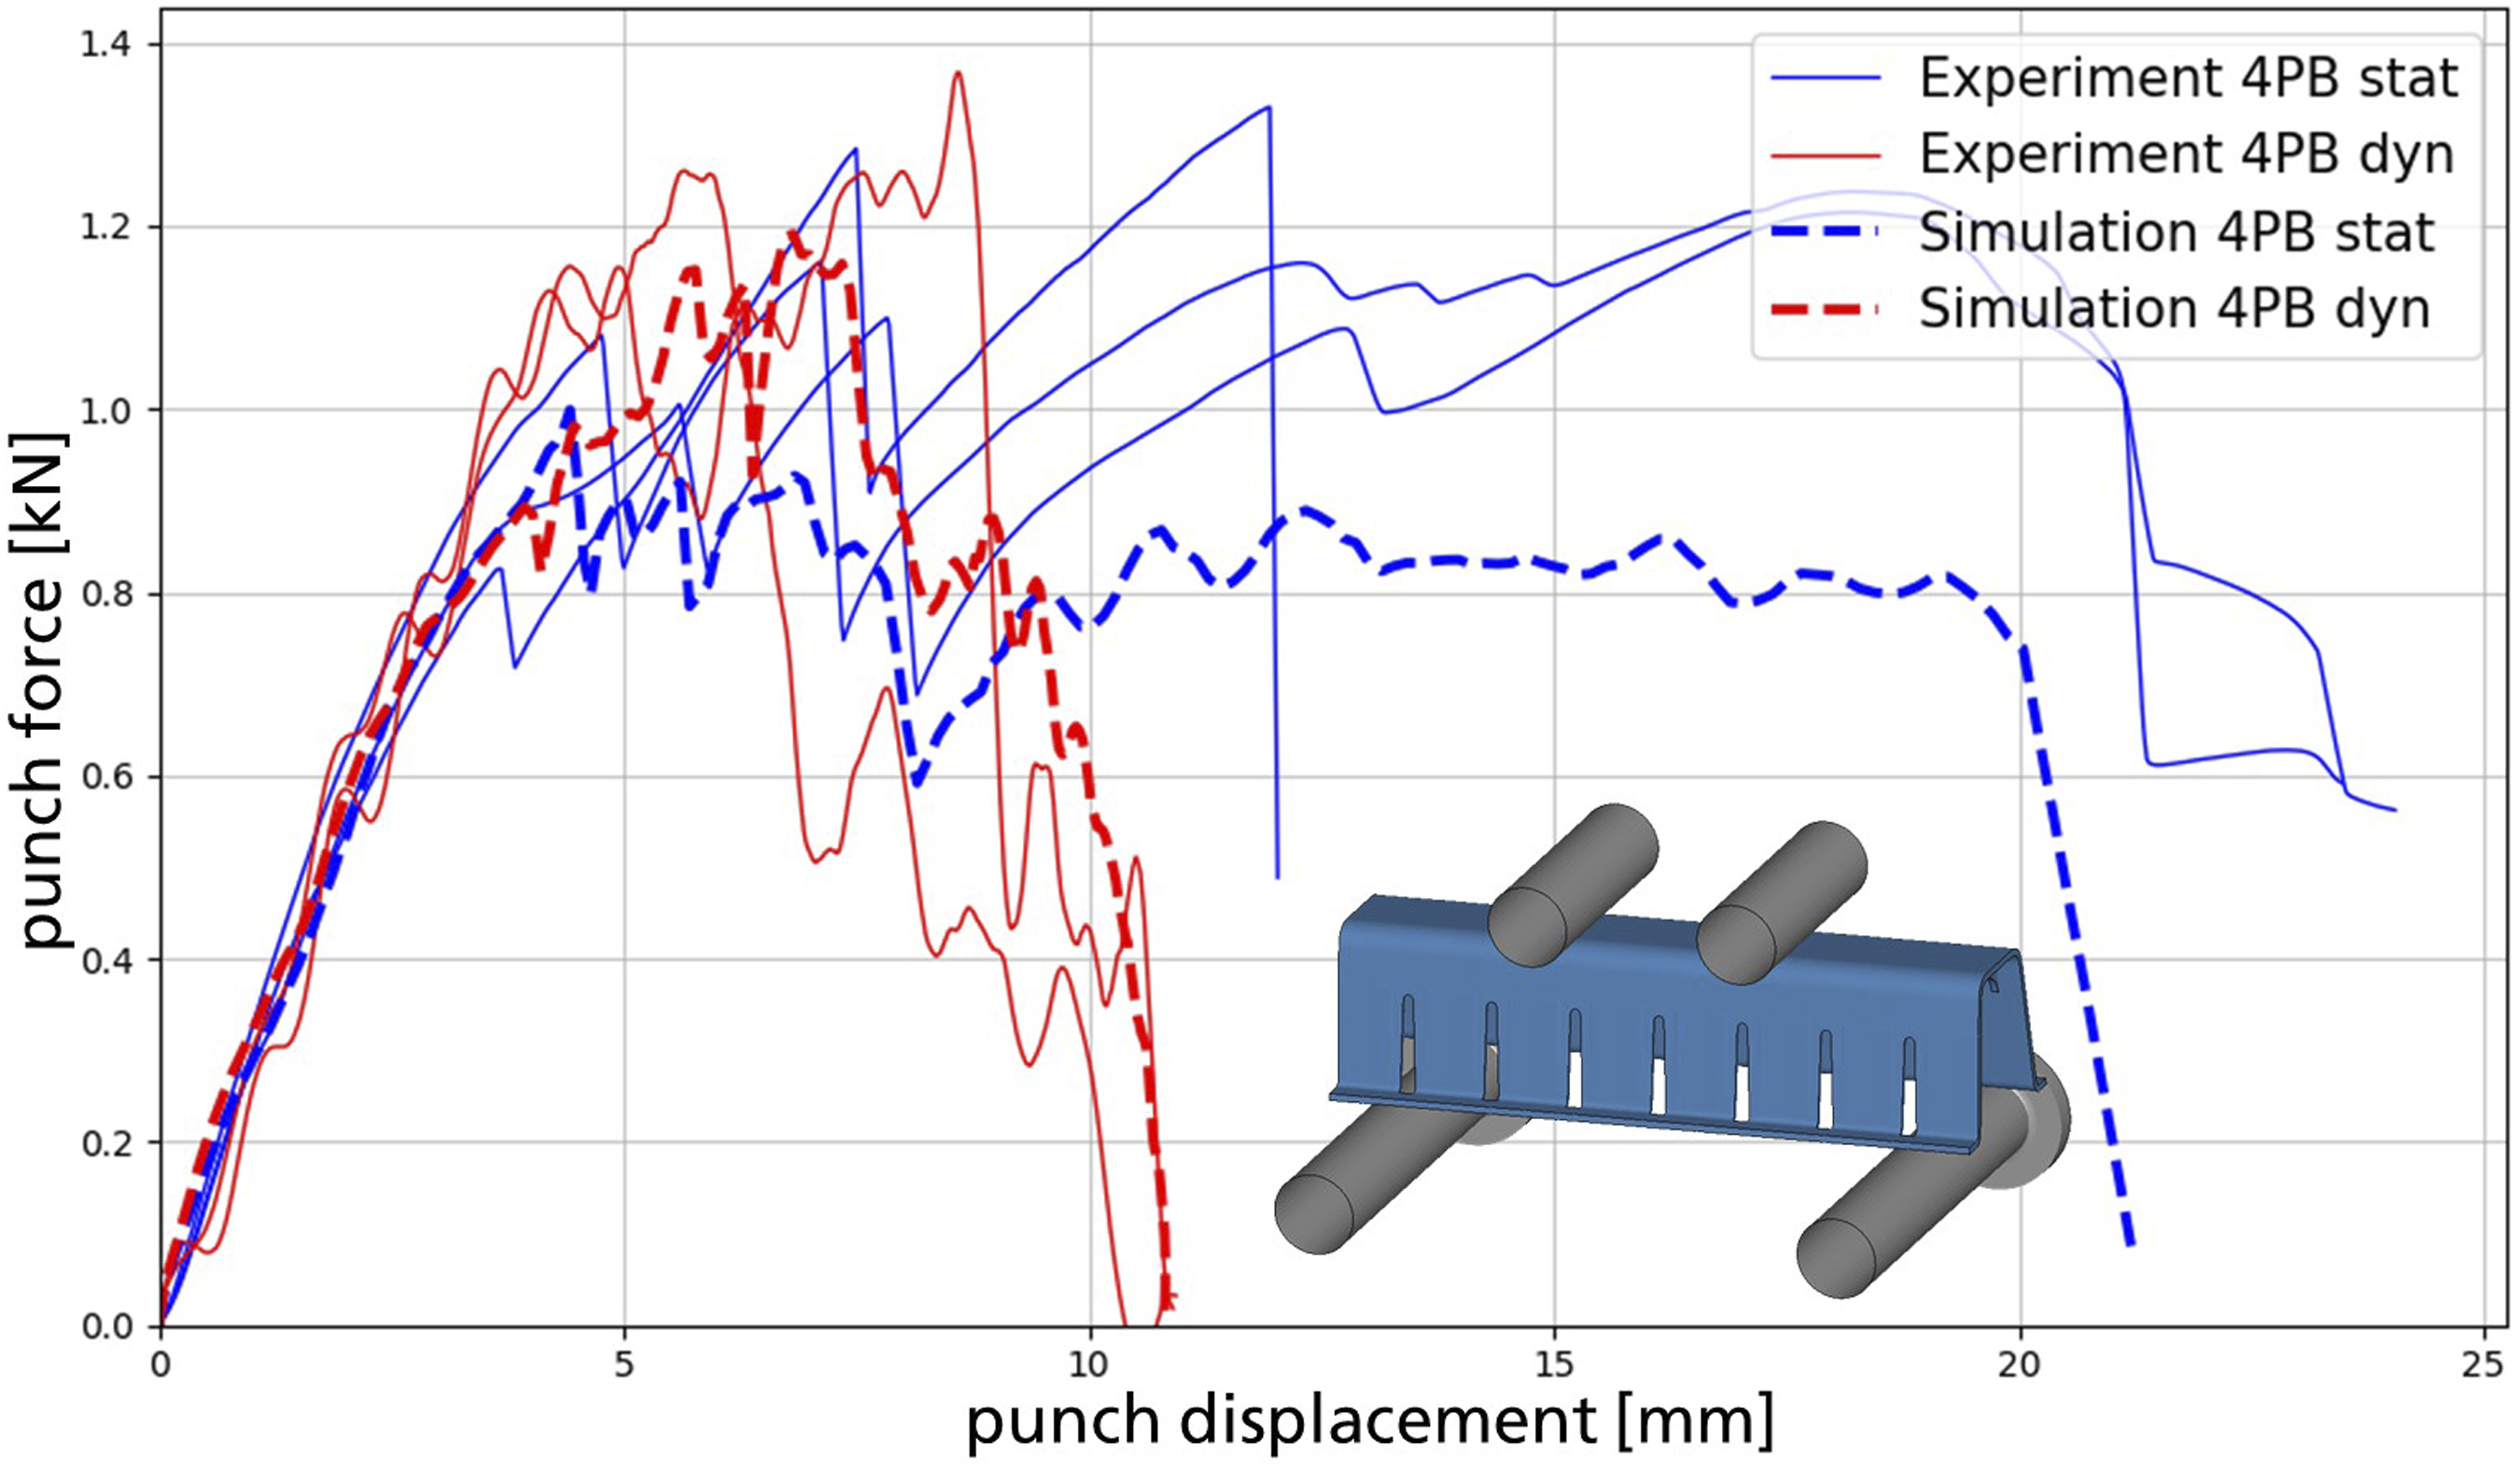
In a second experiment half of the component was crushed in its length direction, applying 1 mm/s and 1350 mm/s. As shown in Figure 20 the material model can predict the behavior for this test as well, reaching a maximal force of about 8kN quasi-statically and 13kN dynamically before the crack spans through the whole component at 6 mm and a sliding off with a slow decent in the punch force. The quasi-static and dynamic crush test on half of the component, comparing the experiment (solid lines) and the simulations (dashed lines).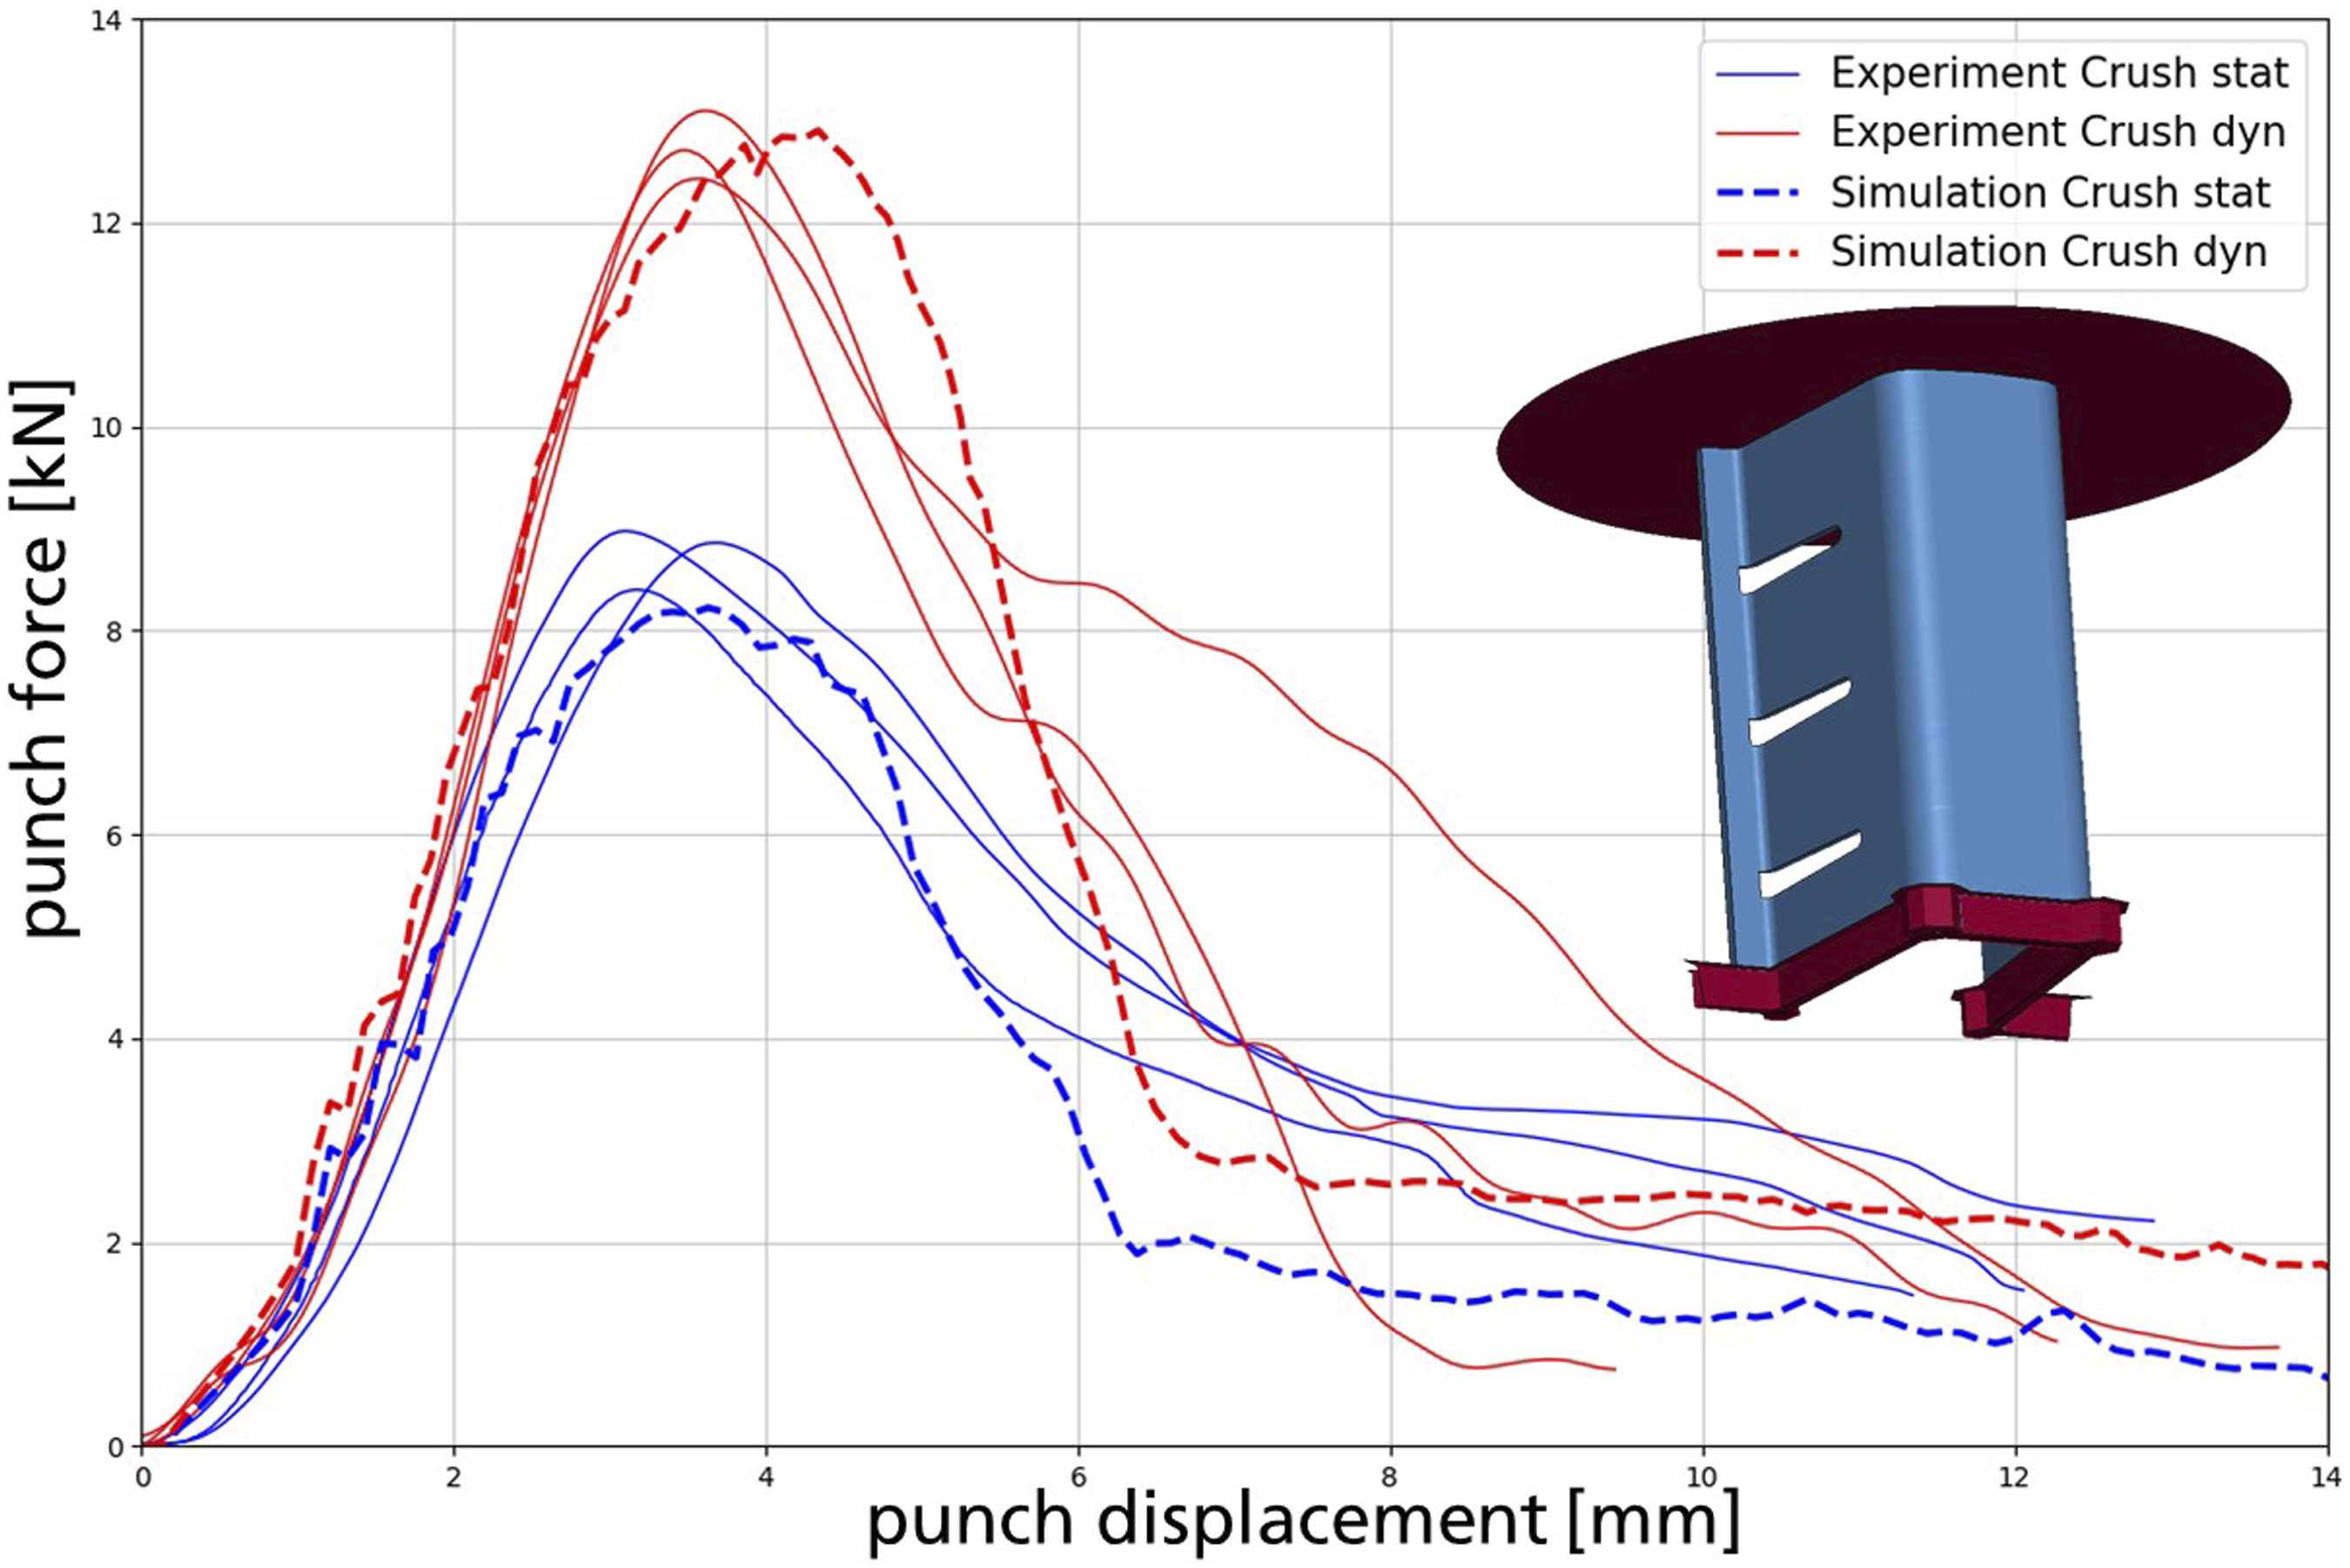
The failure model is not only capable of describing the influences on failure (anisotropy, strain rate, and stress multiaxiality) separately as it occurs in characterization experiments. But by these component tests it has been proven, that complex load cases can be predicted with mixed stress states and general fiber orientation distributions on realistic components.
Discussion and outlook
A failure model for SFRP was developed for simulating crash scenarios with FEM by describing the SFRP as continuum and taking the local fiber orientation into account as an inner variable. Based on the micro-mechanics and the delamination of the fibers in particular, the model is highly efficient with only one fit parameter. The material behavior can be predicted in a wide range of load cases.
Motivated by the analysis of macroscopic and microscopic experiments the distortion energy normalized on the deformed volume was incorporated as the driving value for failure. Based on the Eshelby solution the stress field in the matrix was calculated, and with modifications the local fiber volume fraction and local fiber orientation were considered.
As an approximation for the plasticly deformed volume an additional ellipsoidal phase within the matrix was introduced. By that, the Eshelby solution can be applied once again. This represents a major simplification and could be improved for example by implementing multiple volumes to better fit the real shape of the deformed volume. Lastly the strain rate dependent delamination was modeled by reducing the effective fiber length.
The predictive nature of the model was validated on multiple experiments. Thereby, all material parameters were taken from literature and only the critical distortion energy density was optimized. For all tests the strain rate dependency was predicted correctly. By means of the tension in and transvers to the fiber direction the anisotropy due to the fiber orientation was tested successfully. Different stress states can be described as was demonstrated on tension, shear, and biaxial tension. And by two component tests, it was proven, that the model can also predict complex loadings.
A so fare not tested influence on the failure is the degree of alignment of the fibers. This can range from uniformly distributed in all directions to unidirectional aligned. With the failure model in the current state such tests would be possible, but (micro-) experiments on material with specific fiber alignment would be needed for validation.
Furthermore, the universality of the failure model could be tested by transferring it to other SFRP, for example to other fiber lengths, fiber volume fractions or other fiber materials as carbon or even plant-based fibers and thereby possibly improving the modeling of a wide range of materials.
Footnotes
Declaration of Conflicting Interests
The author(s) declared no potential conflicts of interest with respect to the research, authorship, and/or publication of this article.
Funding
The author(s) disclosed receipt of the following financial support for the research, authorship, and/or publication of this article: This work was supported by AiF program of the BMWi for collaborative industrial research, a research association for vehicle engineering (Forschungvereinigung Automobiltechnik e. V. (FAT), Behrenstrasse 35, 10117 Berlin) grant no (IGF-No. 20418 N).