
Abstract
This study focuses on thermal degradation of carbon fibre-reinforced polymers depending on the specimen depth. For this purpose, the commercial composite HexPly® 8552/IM7 was thermally irradiated from one side with an infrared lamp at constant heat flux of 50 W/cm2 under varying exposure time. Subsequently, a defined number of plies was removed to prepare micro samples from different depths of the bulk material. Non-destructive and destructive testing methods were used to characterize the thermal degradation mechanism and mechanical properties of these specimens. The results showed that during thermal loading temperature and consequently damage gradients manifest along the material cross-section. Thereby, the damage distribution could be divided into the regions rI with matrix depletion, rII with and rIII without structural damage such as delaminations, cracks and pores. By means of ply-resolved investigations, the influence of these regions and corresponding decomposition processes on the mechanical properties could be determined. As a result, a simple damage model was introduced to calculate the residual strength from the initial strength, region sizes and sensitivity factors representing the effect of thermo-induced damage on strength types.
Keywords
Introduction
CFRP are composite materials with high specific strength and stiffness.1–3 Due to these mechanical properties, they are indispensable for lightweight structures in the aerospace industry.4–6 Unfortunately, these composites also exhibit lower thermal stability compared to metallic structures.7–11 Nevertheless, to ensure safe application, thermal threats and their effects on the decomposition mechanism and properties of the material must be known. In this case, threats such as fully developed fires (heat flux q = 5 W/cm2) 12 , burning fuels and propellants (q = 15 – 20 W/cm2) 13 as well as detonations (q = 50 W/cm2) 13 must be expected for military aircraft. Characteristic for these scenarios are the one-sided thermal loads under formation of temperature and damage gradients along the material cross-section.14,15 Thereby, the resulting decomposition processes and damage distributions depend on the heat flux and irradiation time. 14
Until now, scientific investigations primarily concentrate on low heat fluxes.15–17 During these thermal irradiations, the composite is heated moderately. For example, at a heat flux of 5 W/cm2, the material heated up with ∼4 °C/s after short warm-up interval. 15 As a result, surface temperatures of only ∼350 °C were reached in one minute. Thereby, the temperature between front and back side differed less than T < 150 °C, resulting in relatively homogeneous damage behavior over the 4 mm material cross-section. 15 In contrast, at high heat fluxes q ≥ 50 W/cm2, these temperatures and temperature gradients were exceeded within seconds. 14 Consequently, thermal degradation processes such as thermo-oxidative damage, weakening of fibre-matrix adhesion, degradation of polymeric matrix and carbon fibres, formation of delaminations, cracks, pores as well as matrix depletion occurred abruptly.14,18 Since these processes arise in combination with extreme damage gradients, the material properties depend significantly on the specimen depth. 14
For this reason, the unidirectional composite 8552/IM7 has been irradiated with an infrared lamp at 50 W/cm2 from one side under varying irradiation time. To analyze the thermo-induced damage gradient, a defined number of plies was removed to prepare micro samples in different depths of the bulk material. Subsequently, the bulk and micro samples were investigated using non-destructive and destructive methods. The aim of this study is to characterize, classify and quantify the thermal damage in order to determine its effect on the mechanical properties. For this purpose, the material cross-section was separated into three regions with different damage states. These consisted of the regions rI with matrix depletion as well as rII with and rIII without structural damage such as delamination, cracks and pores. By means of depth profiles the effect of degradation processes as well as damage regions on residual strength could be determined. It turned out that the mechanical loading types react differently sensitive to these regions. Consequently, residual interlaminar shear, compressive, flexural and tensile strengths were affected variously from, e. g., delaminations. However, since experimental residual strengths correlate with calculated residual strengths, a three-region model could be introduced. In this model, residual strength was calculated from the product sum of initial strengths, region sizes and sensitivity factors, representing the effect of thermo-induced damage on strength types.
Experimental
Sample preparation and treatment
In this research, the commercially available CFRP HexPly® 8552/IM7 from Hexcel Composites GmbH (Stade, Germany) was used. The initial material consisted of prepregs with unidirectional carbon fibres impregnated in epoxy resin system. 19 HexTow® IM7 are continuous, intermediate modulus, polyacrylonitrile based fibres with a filament count of 12K. 20 HexPly® 8552 is a high-performance cured matrix, composed of the epoxy components tetraglycidyl methylene dianiline as well as triglycidyl-p-aminophenol, the curing agent 3,3′- or 4,4′-diaminodiphenyl sulfone and the thermoplastic toughener polyethersulfone.21,22 According to the manufacturer’s data sheet, the glass transition temperature of the cured dry matrix is Tg = 200 °C. 19
32 plies of 8552/IM7 prepregs were laminated to unidirectional 500 × 500 mm2 panels and cured according to the manufacturer’s specifications. 19 With a nominal cured ply thickness of 0.131 mm, 19 approximately dl = 4 mm thick laminates were formed. Referring to the data sheets, the cured composite has an 0° interlaminar shear strength of τ = 137 MPa, 0° compressive strength of σc = 1690 MPa, 0° flexural strength of σf = 1860 MPa and 0° tensile strength of σt = 2538 MPa.19,23
In addition, 100 × 100 mm2 panels were manufactured with inserted type K thermocouples. 24 To evaluate the temperature as a function of sample depth, eight thermocouples were centrally laminated between 3–4, 7–8, 11–12, 15–16, 19–20, 25–26 plies and additionally positioned on the front and back side using peel ply. Thereafter, the thermocouple-equipped panels were cured in an autoclave according to the manufacturer’s recommendations. 19
With the ultrasonic testing system Hill-Scan 3060 UHF from Dr. Hillger (Braunschweig, Germany), the material was inspected for quality defects such as pores, macroscopic delaminations and fibre orientation defects according to DIN EN ISO 16810. 25 A test head from Panametrics with a frequency of 15 MHz and a step size of 0.1 mm was used. After quality control, with the exception of 130 × 100 and 330 × 100 mm2 for some compressive and tensile strength samples, only 100 × 100 mm2 panels were cut with a water-cooled diamond wheel saw and dried for one week in a heating chamber with forced convection at T = 70 °C until mass constancy.
Subsequently, the 3000 W infrared lamp from Micor’s tube emitter (Niedernhausen, Germany) was adjusted to a heat flux of q = 50 W/cm2 at 25 mm distance using a heat flux meter of Fire Testing Technology’s cone calorimeter. The panels were thermally loaded from one side with varying time intervals of tl = 5, 10, 15, 20, 25 and 30 s (see schematic representation in Figure 1(a)). Thereby, the irradiation energy impinges homogeneously on the surface over a width of Δy = 100 mm and minimum height of Δx = 20 mm. During thermal loading, the temperature was recorded with the TC-08 data logger from pico Technology. Schematic representation of (a) one-sided thermal irradiation of a CFRP panel with an infrared lamp and (b) preparation of micro specimens from bulk material as well as classification of damage regions ri.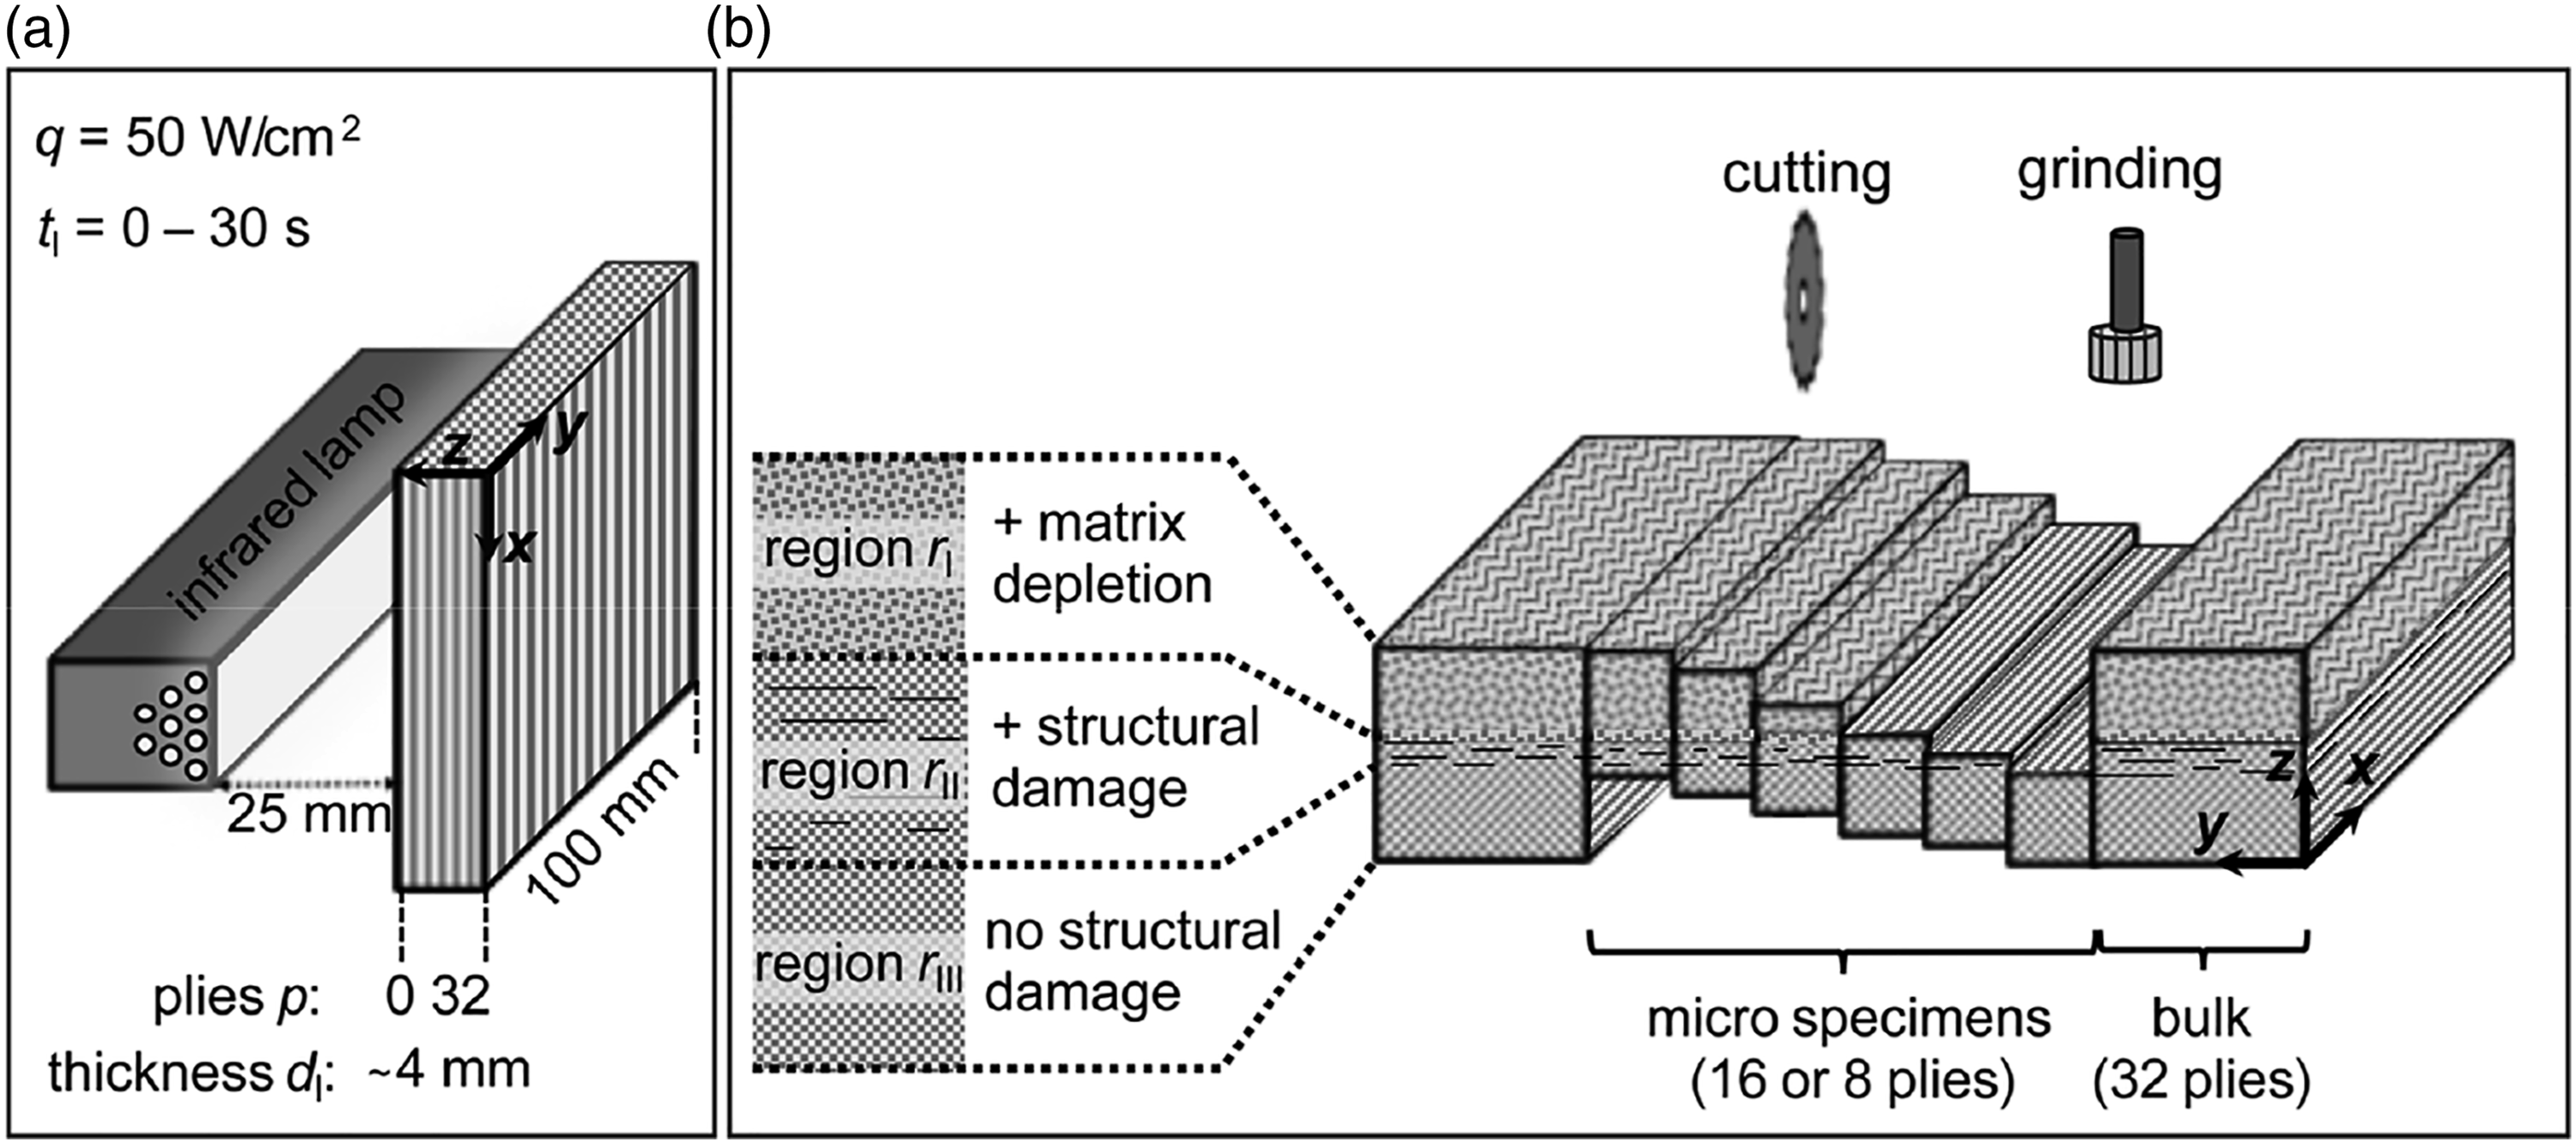
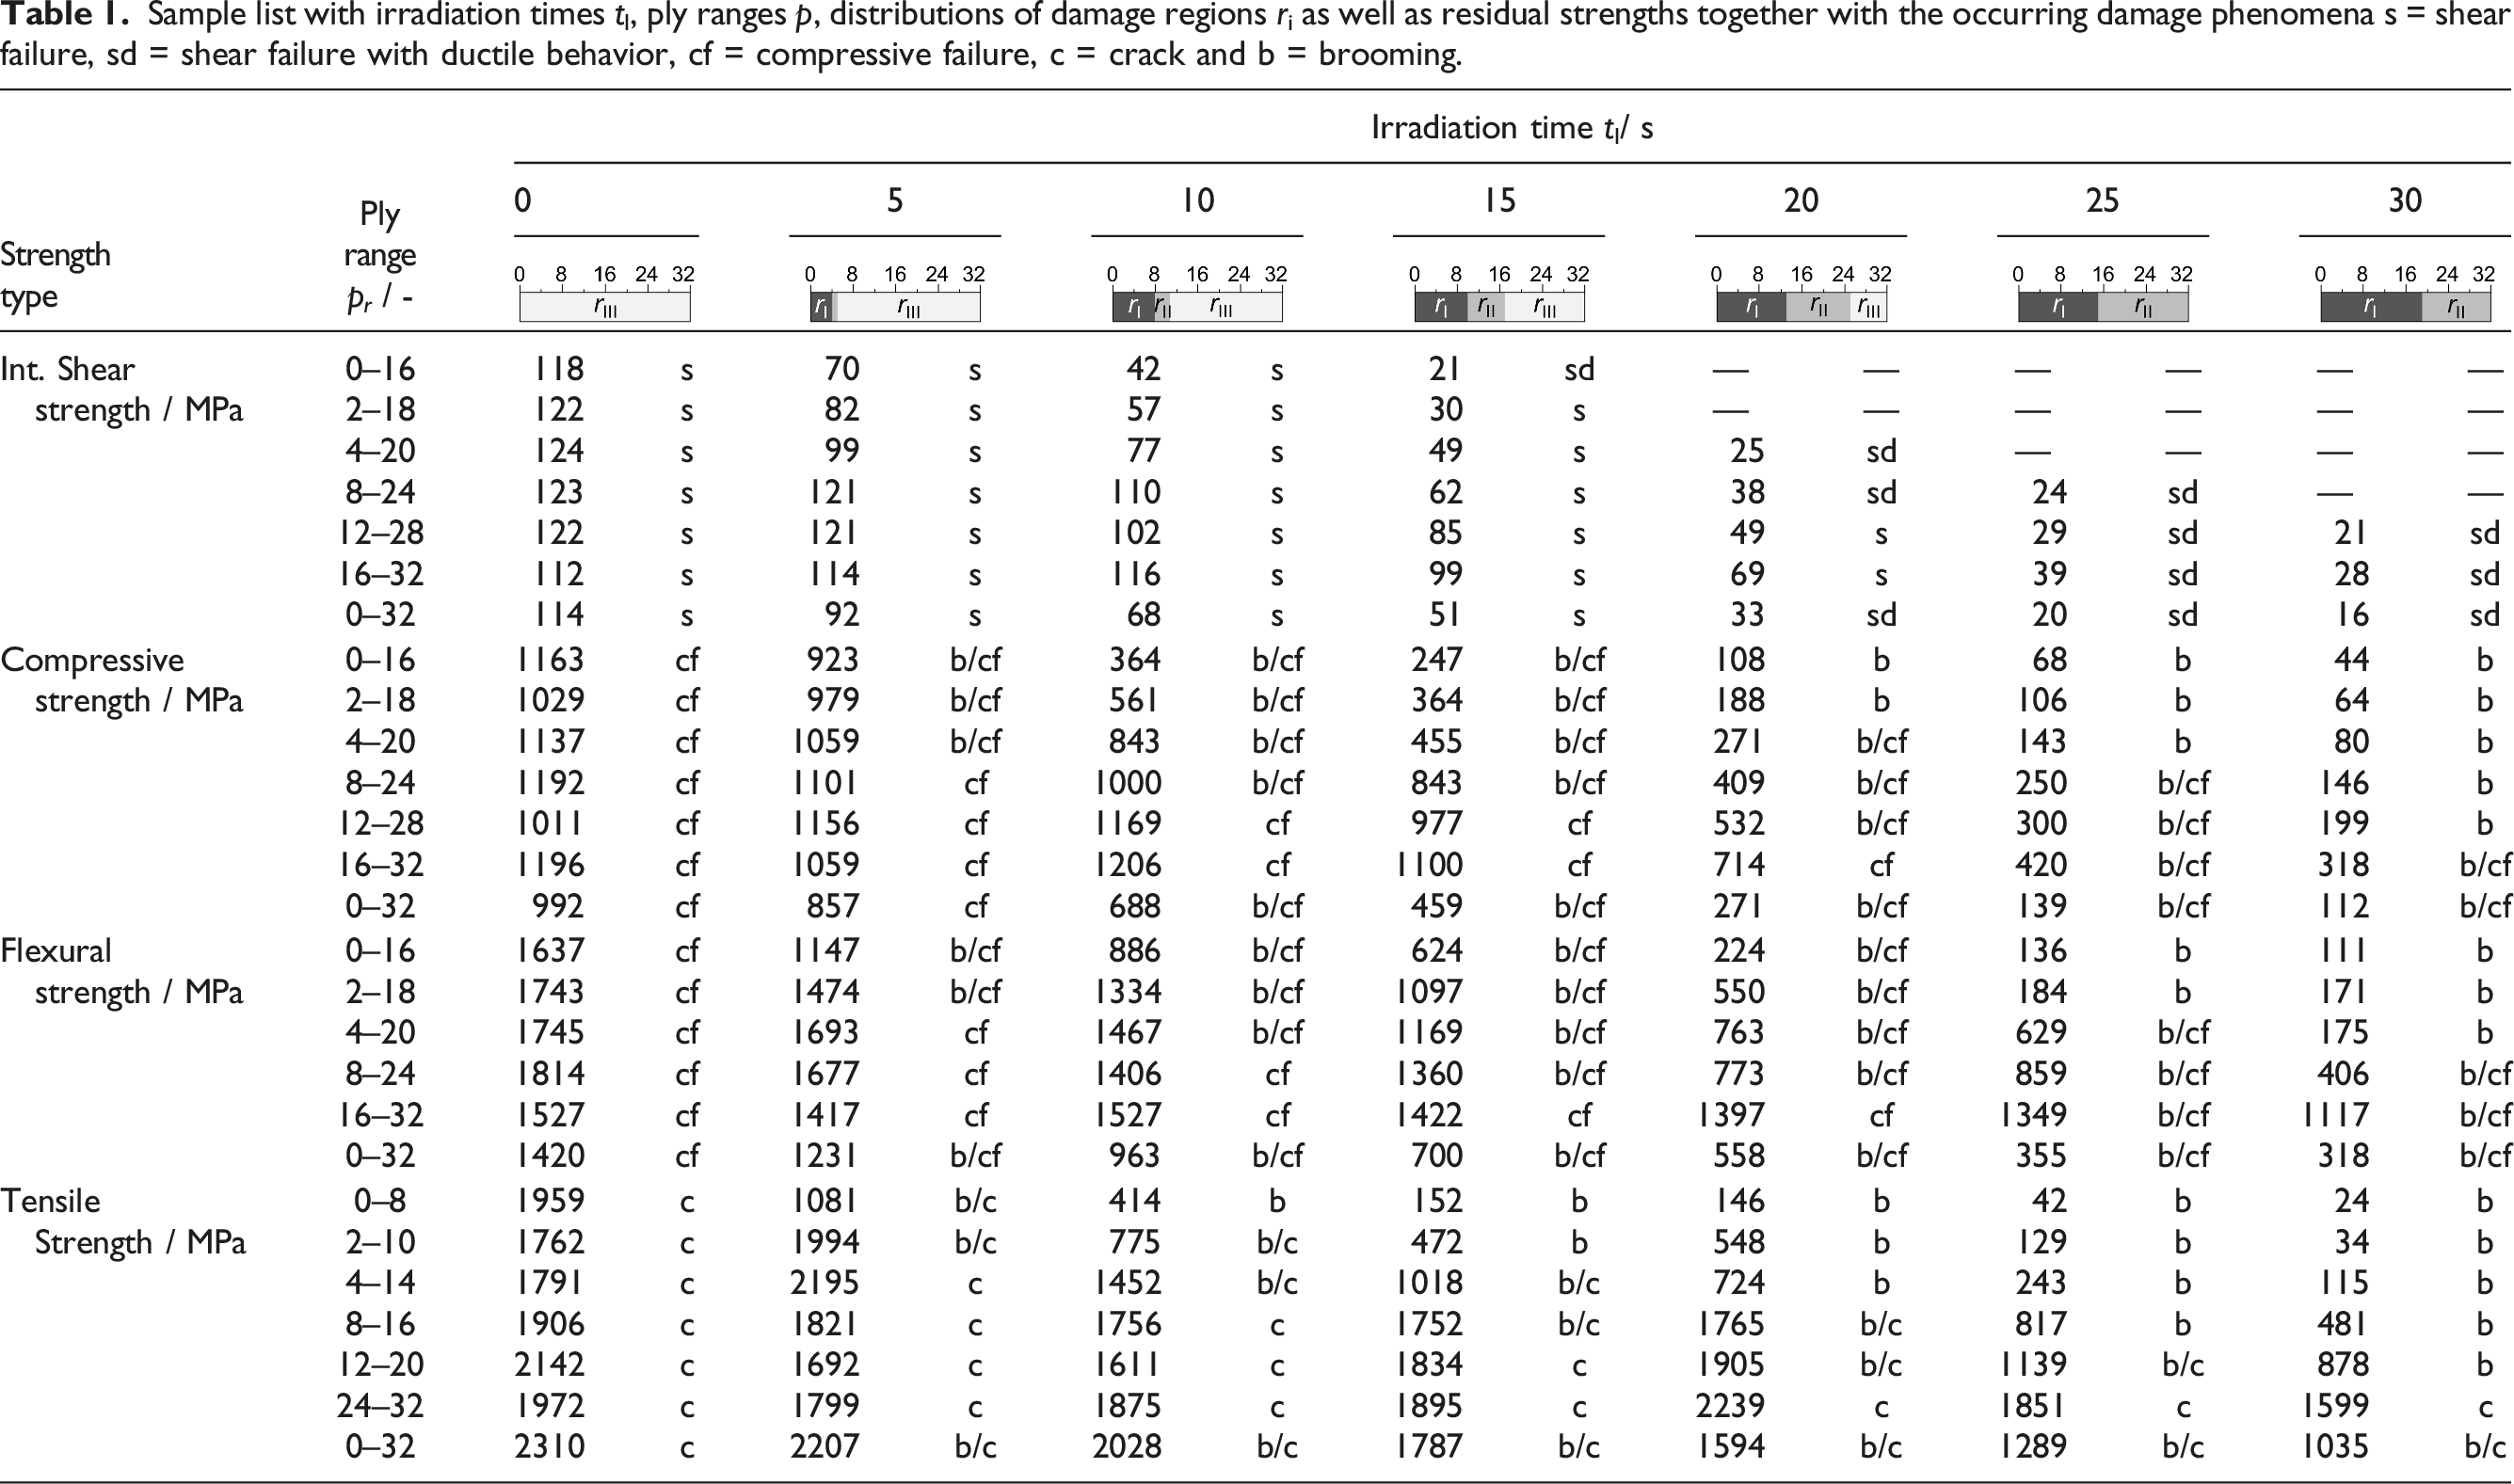
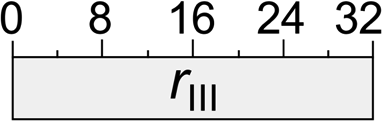
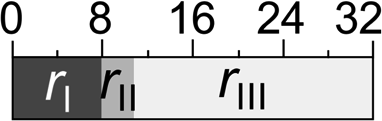
Sample list with irradiation times tl, ply ranges p, distributions of damage regions ri as well as residual strengths together with the occurring damage phenomena s = shear failure, sd = shear failure with ductile behavior, cf = compressive failure, c = crack and b = brooming.

Non-destructive testing
By means of micro attenuated total reflection Fourier transform infrared spectroscopy (ATR-FTIR), matrix degradation depending on the ply depth can be quantified.21,26 For this, inclines with an angle of 11.3° were ground along the width of 40 × 20 mm2 bulk samples. With the infrared microscope LUMOS II from Bruker, 10 average spectra per ply with a depth resolution of Δz ∼ 40 μm were recorded in a wavenumber range of
Dynamic mechanical analysis (DMA) can be used to measure the storage modulus. Thereby, 60 × 10 mm2 micro and bulk specimens were tested with three-point bending setup according to DIN EN ISO 6721-1 using Gabo Eplexor® 500 from Netzsch. 27 These samples were heated from T = 30 – 275 °C with a heating rate of θ = 1 °C/min. Simultaneously, static load of 10 % and dynamic load of 5 % from the specimen cross-section strain was applied at a frequency of f = 1 Hz.
The sample density was examined with the CM224S balance from Sartorius (Goettingen, Germany) and the equipped hydrostatic density determination set using the Archimedes principle according to DIN EN ISO 1183-1. 28 In this regard, the sample masses were measured in air and water atmosphere to obtain the density of the material.
Thermally induced defects such as delaminations, cracks and pores could be visualized with the micro-focused computed X-ray tomograph (μCT) V-TOME XL 300 from General Electric. A 180 kV source was used to record the volumes of 40 × 20 mm2 bulk samples and sliced into two x-y images per ply with voxel size of 10 μm. In the tomograms, the damaged area of CFRP can be identified, because the contained air and pyrolysis gases in the defects reduce the X-ray attenuation and thus displayed in darker gray levels.29,30 To quantify the damaged area, the number of voxels and their gray levels were determined. The threshold value for the gray level defining the damaged material was set by successively increasing the threshold until the deepest defects were just detected. The percentage damaged area represents the ratio between the number below the threshold and the total number of voxels in x-y plain. Similarly, the percent damaged volume could be determined, when gray scale analysis was applied to multiple plies.
Destructive testing
The apparent interlaminar shear strength of composite materials was determined with short beam shear tests using a universal testing machine Z020 from Zwick/Roell in accordance to DIN EN ISO 2563. 31 The specimens were positioned with the irradiated side on the two lower supports and tested at a constant rate of 1 mm/min. For 40 × 20 mm2 bulk specimens, supports with 5 mm radius, support distance of 20 mm and a 25 kN loading cell of type Xforce P from Zwick/Roell were used. For 20 × 10 mm2 micro samples, support radius of 3 mm, support distance of 10 mm and a 5 kN loading cell of the same type were utilized.
Compressive strength of the specimens was assessed with the universal testing machine Z250 from Zwick/Roell in accordance to DIN EN ISO 14126. 32 For this purpose, 64 × 10 mm2 and 45 × 10 mm2 glass fibre tabs were glued to both ends of 140 × 10 mm2 bulk and 100 × 10 mm2 micro samples, respectively, using the universal two-component epoxy resin adhesive Delo-Duopox® 1895 according to the manufacturer’s instructions. 33 The specimens were tested in Celanese fixture at a constant rate of 1 mm/min using a 250 kN loading cell of the type Xforce K from Zwick/Roell.
By means of 4-point flexural test, the flexural strength of the samples was evaluated with the universal testing machine Z020 from Zwick/Roell in accordance to DIN EN ISO 14125. 34 The thermally irradiated side of 100 × 15 mm2 bulk and micro samples rested on the lower supports. Flexural strength was tested at 5 mm/min with support radius of 2 mm, support distance of 81 mm and a 5 kN loading cell of the type Xforce P from Zwick/Roell.
Tensile strength of the composites was obtained with the Z250 universal testing machine from Zwick/Roell according to DIN EN 2561. 35 The 330 × 15 mm2 bulk and 100 × 10 mm2 micro specimens were glued at both ends with 115 × 15 mm2 and 30 × 10 mm2 glass fibre tabs according to the manufacturer’s specifications. 33 The measurement was performed at 2 mm/min with a 250 kN loading cell of the type Xforce K from Zwick/Roell.
Results and discussion
Characterization of thermal damage
When CFRP are thermally loaded from one side, radiation impinges on the sample surface, causing primarily reflection, emission and absorption.
36
Thereby, the absorbed heat is conducted in the material, visualized by temperature rises in different ply depths. For this purpose, Figure 2(a) shows temperature–time profiles T(t) for heating at q = 50 W/cm2 up to 30 s as well as cooling thereafter at q = 0 W/cm2. After a very short warm-up phase, the front side heats up with a nearly constant heating rate of θ ∼ 150 °C/s to t ≤ 5 s. With rising exposure time and temperature, the heating rate slows down. Maximum surface temperatures of approximately T ∼ 1000 °C are reached after t ∼ 15 s. Since the absorbed heat diffuses from the front to the back side, temperature gradients in z-direction can be found. Thereby, discontinuous T(t) curves can arise due to impaired heat conduction along the material cross-section caused, for example, by the formation of delaminations (see p = 7–8).
14
For t > 30 s, no more radiation impinges on the sample surface. As a result, on the one hand, heat is emitted on the front side indicated by the pronounced temperature per time drop. On the other hand, heat is conducted to the back side until the temperature gradient is reduced with rising time according to the heat conduction equation.
37
Consequently, continued heating and thermal damage occurs in deeper plies after the infrared lamp is switched off.38,39 Temperature profiles during one-sided thermal irradiation at q = 50 W/cm2 to t ≤ 30 s and cooling thereafter at q = 0 W/cm2 depending on (a) time T(t) as well as (b) ply number T(p) in z-direction recorded in eight different laminate depths.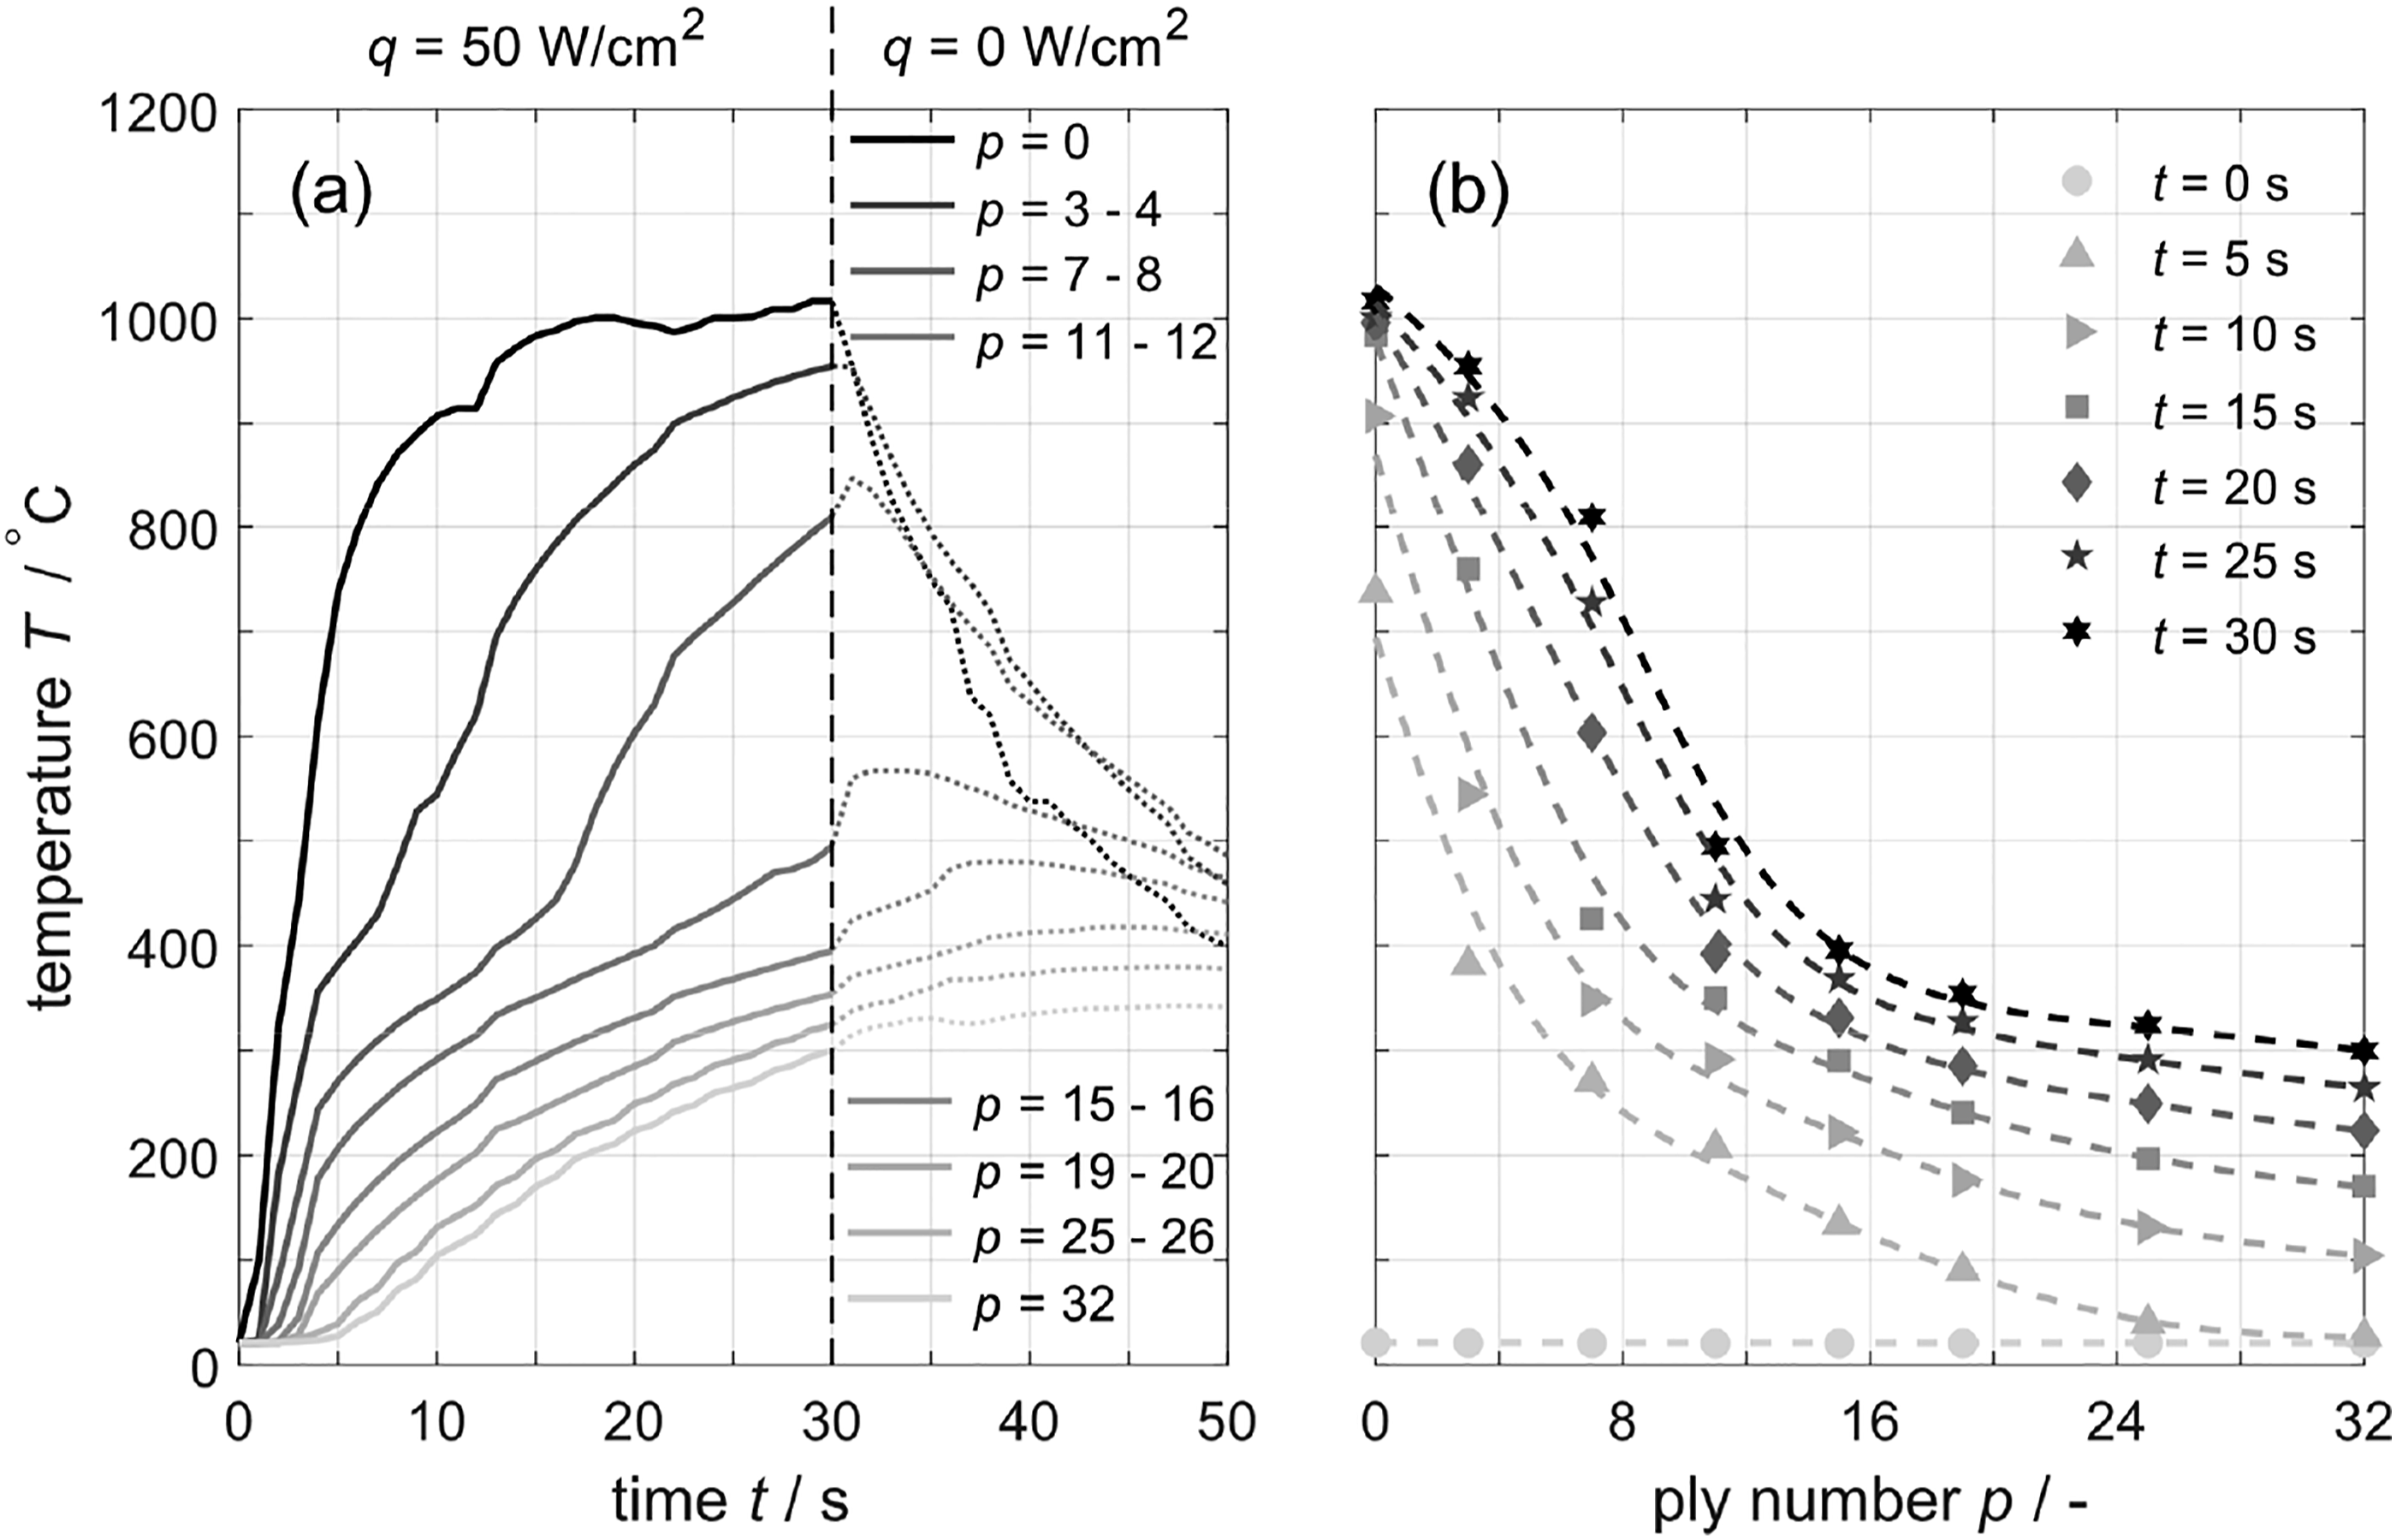
In addition, Figure 2(b) illustrates temperature-depth profiles T(p) in z-direction for different times t. Due to the high heat flux, the material heats up very quickly, resulting in extreme temperature gradients within the first seconds. The maximum temperature difference between front and back side of ΔT = 814 °C is reached after 15 s. Within approximately 8 s, the sample ignites because sufficient pyrolysis gases are accumulated on the surface and burns until no more radiation impinges. 40 Thereby, the combustion of the sample surface reduces the absorbed heat share and a dynamic equilibrium sets in on the front side, visualized by a constant T(t > 15 s)-surface profile.37,40 As a result, the heat flux in z-direction and consequently the temperature gradient according to the heat conduction decreases.37,40 Thus, temperature gradients and stress along the material cross-section increase until the maximum specimen temperature is achieved.
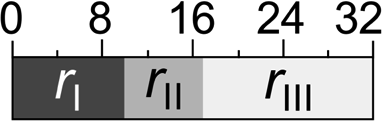
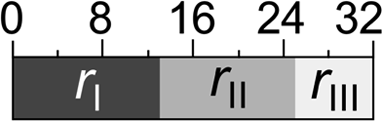
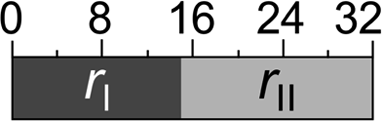
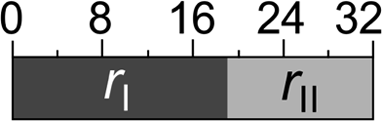
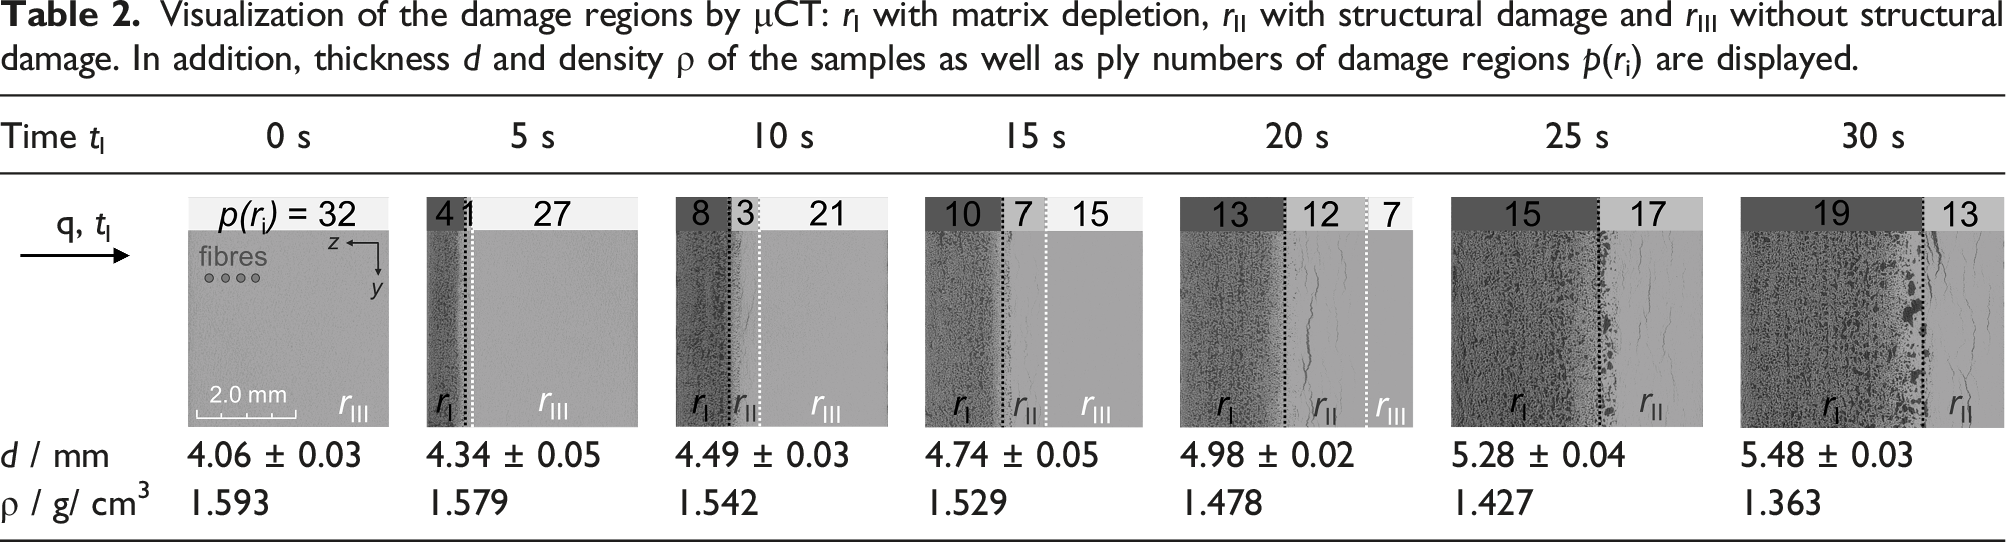
Visualization of the damage regions by μCT: rI with matrix depletion, rII with structural damage and rIII without structural damage. In addition, thickness d and density ρ of the samples as well as ply numbers of damage regions p(ri) are displayed.
To determine the structural damage along the cross-section, tomograms are generated in the x-y plane. Illustrative tomograms are shown in Figure 3 at constant irradiation time of tl = 20 s and different ply depths p. Basically, the defects are oriented in fibre direction and increase in number and size towards the front side. With the help of gray value analysis, these defects can be quantified. For this purpose, Figure 3(a) shows the voxel number v with the corresponding RGB color code c. The RGB color code can assume values between black (red = 0, green = 0, blue = 0) and white (255, 255, 255).
41
Since these values change uniformly for red, green, and blue in gray scale analysis, the RGB color code is simplified from black to white with c = 0–255.
41
In the initial state, no defects are visible, resulting in high color codes with a narrow color distribution. With growing structural damage, lower color codes and a broader distribution occurs. By introducing a threshold for damaged material, the percentage damaged area Ad/A0 can be determined. Ad represents the number of voxels below the threshold and A0 the total number of voxels. Figure 3(b) shows this damaged area for different irradiation times along the ply depth. At q = 50 W/cm2, extreme structural damage gradients occur within a few seconds. Thereby, the damage distribution can be separated into three regions. In region rIII, no structural damage is present with Ad/A0 = 0 %. Only with the presence of region rII, thermo-induced delaminations can be detected. The ply depth at the transition from rIII to rII thus represent the border for delamination formation. In region rI, the polymeric matrix is additionally depleted, confirmed by the density loss from 1.593 to 1.363 g/cm3 within tl = 30 s in Table 2. The transition between rII and rI hence constitutes the threshold for matrix depletion at Ad/A0 = 20 ± 5 %, determined by infrared spectroscopy in Figure 4(b) and explained in the following paragraphs. Based on this region classification with μCT, the bulk with 32 plies can be separated into p(rIII) = 21 plies without and p(rII) = 3 plies with structural damage as well as p(rI) = 8 plies with matrix depletion after a thermal exposure of, e. g., tl = 10 s (see also Table 2). Determination of (a) voxel number v and RGB color code c in x-y plane of μCT tomograms at constant irradiation time tl = 20 s and varying ply number p as well as (b) damaged area Ad/A0 depending on the ply number. In addition, threshold for matrix depletion at Ad/A0 ≥ 20 ± 5 % and damage regions ri are presented. Determination of (a) band intensities at 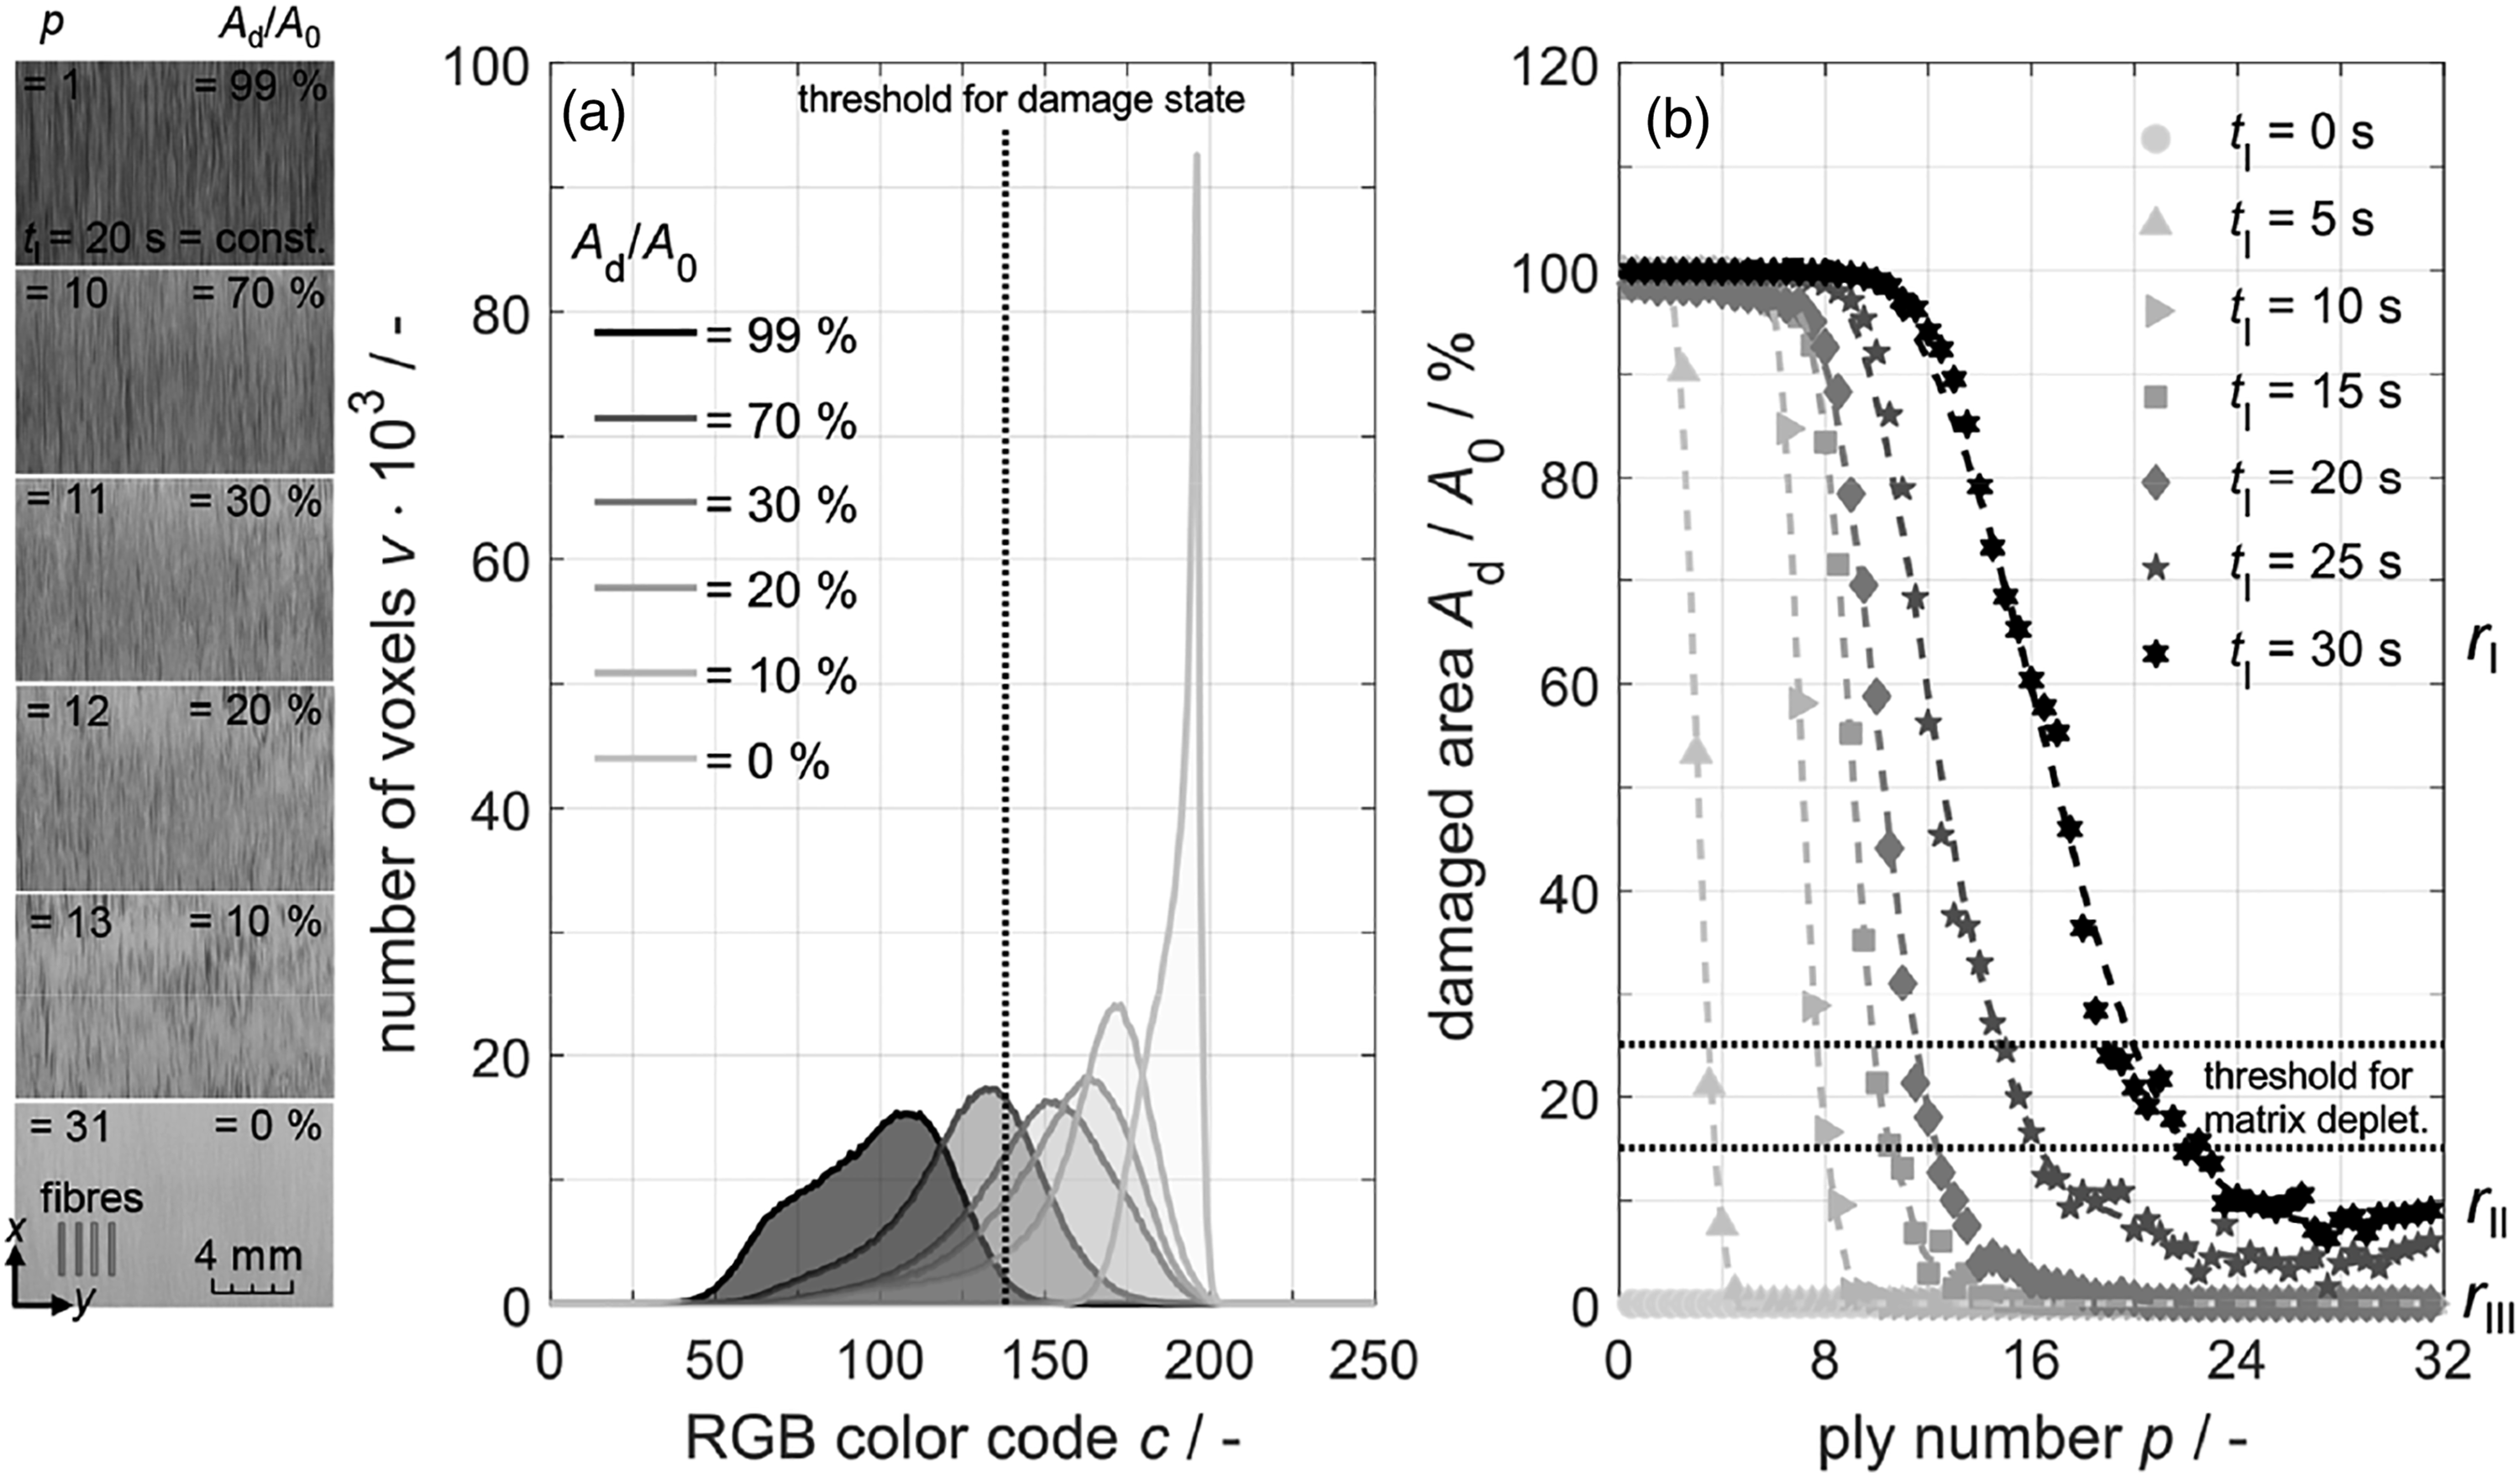
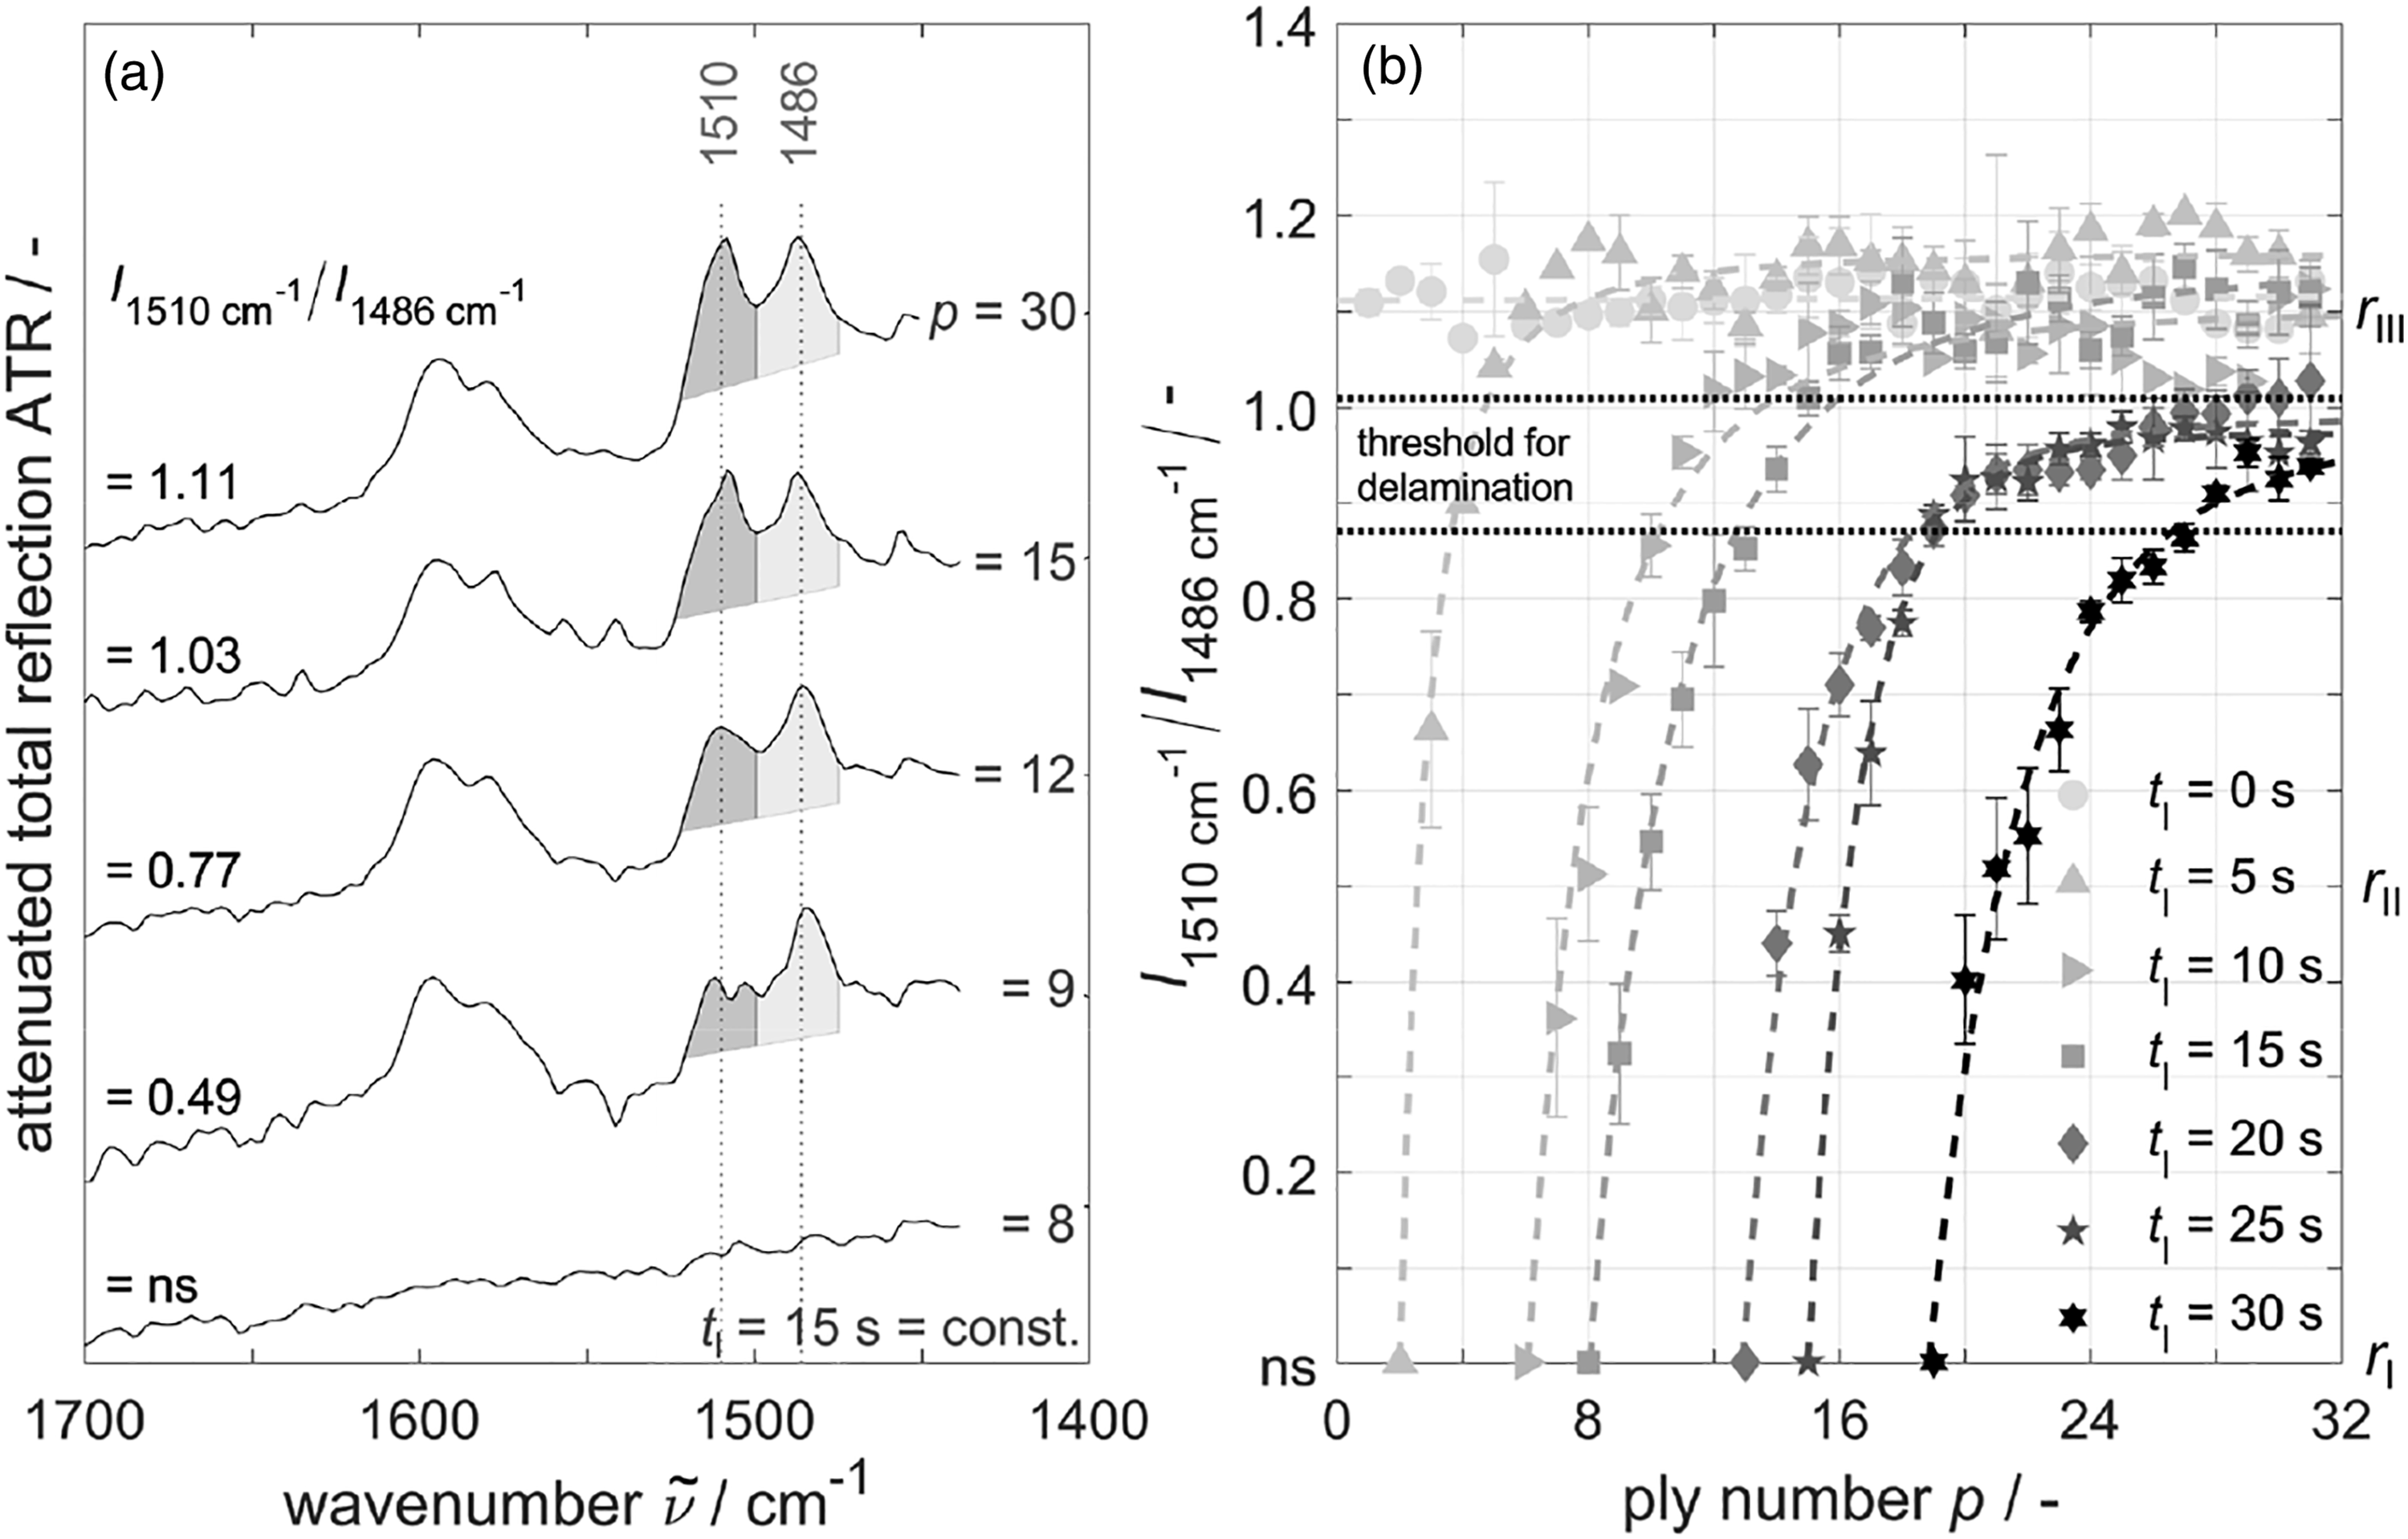
The thermal degradation of the polymeric matrix can be detected with the help of FTIR. For illustration, infrared spectra are shown in Figure 4(a) at constant exposure time of tl = 15 s and different ply depths p. In these spectra, the band at
Figure 4(b) visualizes this intensity ratio Id = I1510 cm−1/I1486 cm−1 in relation to the ply depth p. The infrared intensity ratio is Id = 1.11 ± 0.02 in the initial state and drops with rising thermal loading. During one-sided thermal irradiation at high heat fluxes, extreme intensity ratio gradients occur along the specimen cross-section. Similar to the structural damage distribution investigated by μCT, Id gradients can be separated into three regions. Beginning from the specimen back side (p = 32), the virgin rIII, matrix degraded rII and matrix depleted rI regions appear. In region rIII, the intensity ratio remains almost on the initial level. Only in rII, the intensity ratio drops significantly due to epoxy resin decomposition. Thereby, the matrix is sufficiently damaged that thermo-induced delaminations occur as determined by μCT. The transition from rIII to rII thus represents the threshold for delamination formation at Id = 0.94 ± 0.07. A slight deviation from the previously reported threshold value of 0.79 ± 0.04 15 is explained by the different integration method and the higher heat flux level of 50 W/cm2 compared to 5 W/cm2. Based on this threshold, the depth where structural damage occurs can also be found with FTIR. In the matrix depleted region rI, no infrared signal Id = ns can be detected anymore, due to additional decomposition of the polyethersulfone. These depths at Id = ns consequently represent the border for matrix depletion at Ad/A0 = 20 ± 5% in Figure 3(b). Now the 32 plies of the irradiated specimen can be allocated to the three regions. When composites are thermally irradiated for, e. g., tl = 10 s, the cross-section can be divided in 22 virgin, four degraded and six depleted plies by FTIR. With rising thermal exposure, the virgin plies get more and more reduced. Simultaneously, matrix degraded and depleted plies increase until ultimately all plies are depleted.
As described previously, the three damage regions can be classified with μCT and FTIR. For visualization, Figure 5 represents the damage region sizes depending on the irradiation time tl for both methods. Thereby, the regions are delimited regarding the depth and separated as follows: Beginning from the back side, the virgin region rIII appears without structural damage and infrared intensity ratios of Id > 0.94 ± 0.07. As soon as structural damage such as delaminations, pores and cracks become visible, region rII is present. In region rI, the matrix is additionally depleted, resulting at Ad/A0 ≥ 20 ± 5 % or Id = ns. Thus, for undamaged materials, all 32 plies can be assigned to the virgin region rIII. Only with rising thermal exposure, region rII with structural damage and rI with matrix depletion arise. Simultaneously, the size of region rIII decreases until it no longer exists from tl ≥ 25 s. Thereby, the assigned region ply numbers are similar between μCT and FTIR. The error from rIII to rII and from rII to rI is only ±1 ply between the two methods. Consequently, both non-destructive measurement methods can be used independently to separate the specimen cross-section into the three damage regions. Identification of damage regions using μCT and FTIR: Ply number p without structural damage is represented by p(rIII,μCT) and p(rIII,IR), structural damage by p(rII,μCT) and p(rII,IR) as well as matrix depletion by p(rI,μCT) and by p(rI,IR) versus irradiation time tl.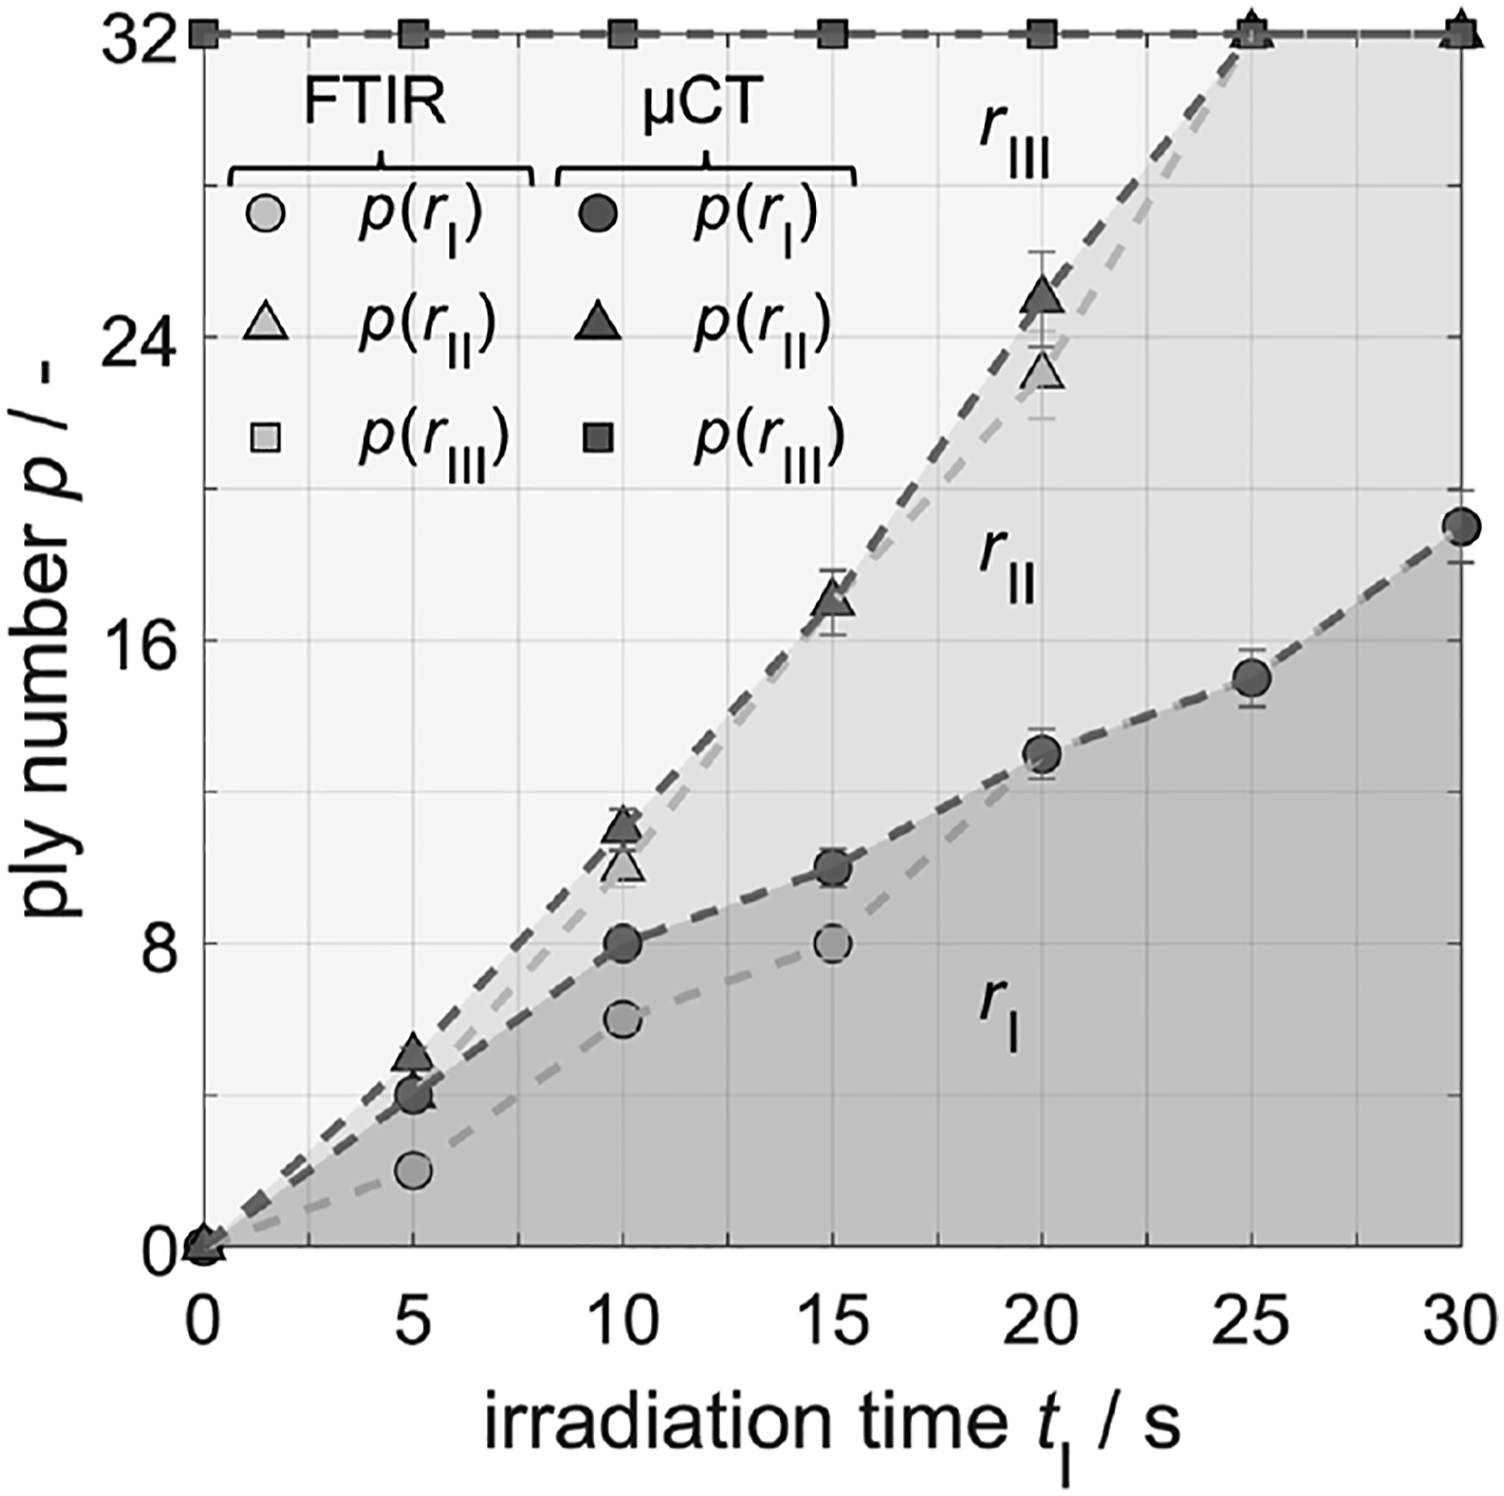
Furthermore, the matrix damage of CFRP can be mechanically characterized by means of DMA.
27
For this purpose, the storage modulus G′(T) from bulk samples at various irradiation times tl is shown in Figure 6(a). With rising temperature, the transition from energy-elastic to entropy-elastic behavior is reflected in the drop of the storage modulus. For the non-thermally pre-loaded material, the glass transition temperature is Tg = 232 °C, determined by the inflection point of the G′(T) curve. In case of thermally pre-damaged specimens, the inflection points shift to lower temperatures and storage moduli. These developments can be attributed to increased mobility and flexibility of the molecular fragments, caused by, e. g., cracks in epoxy resin macromolecules.43,44 As a result, the stiffness of the material reduces. Since the cross-link density correlates with the storage modulus, stiffness drop can be used to quantify the matrix damage.43,44 For illustration, Figure 6(b) shows the storage modulus G′(tl) at T = 50 °C. With rising irradiation time, the storage modulus of the bulk samples drops because the damage accumulates within the matrix. The corresponding depth profiles are illustrated in Figure 6(c) as normalized storage modulus versus ply ranges pr for micro samples. In case of one-sided thermal loads, stiffness gradients arise along the cross-section, affected differently by the thermo-induced damage. Beginning from the back side (p = 32), the in light gray visualized region rIII without structural damage hardly reduces the stiffness. Only with defects in rII (dark gray) and especially with matrix depletion in rI (black) the stiffness drops significantly. Consequently, the damage regions are also reflected in the material stiffness and matrix damage. Determination of storage modulus depending on (a) temperature G′(T) at different irradiation times tl as well as (b) irradiation time G′(tl) from energy-elastic range at T = 50 °C of bulk specimens recorded by DMA. Furthermore, depth profiles of (c) normalized storage modulus 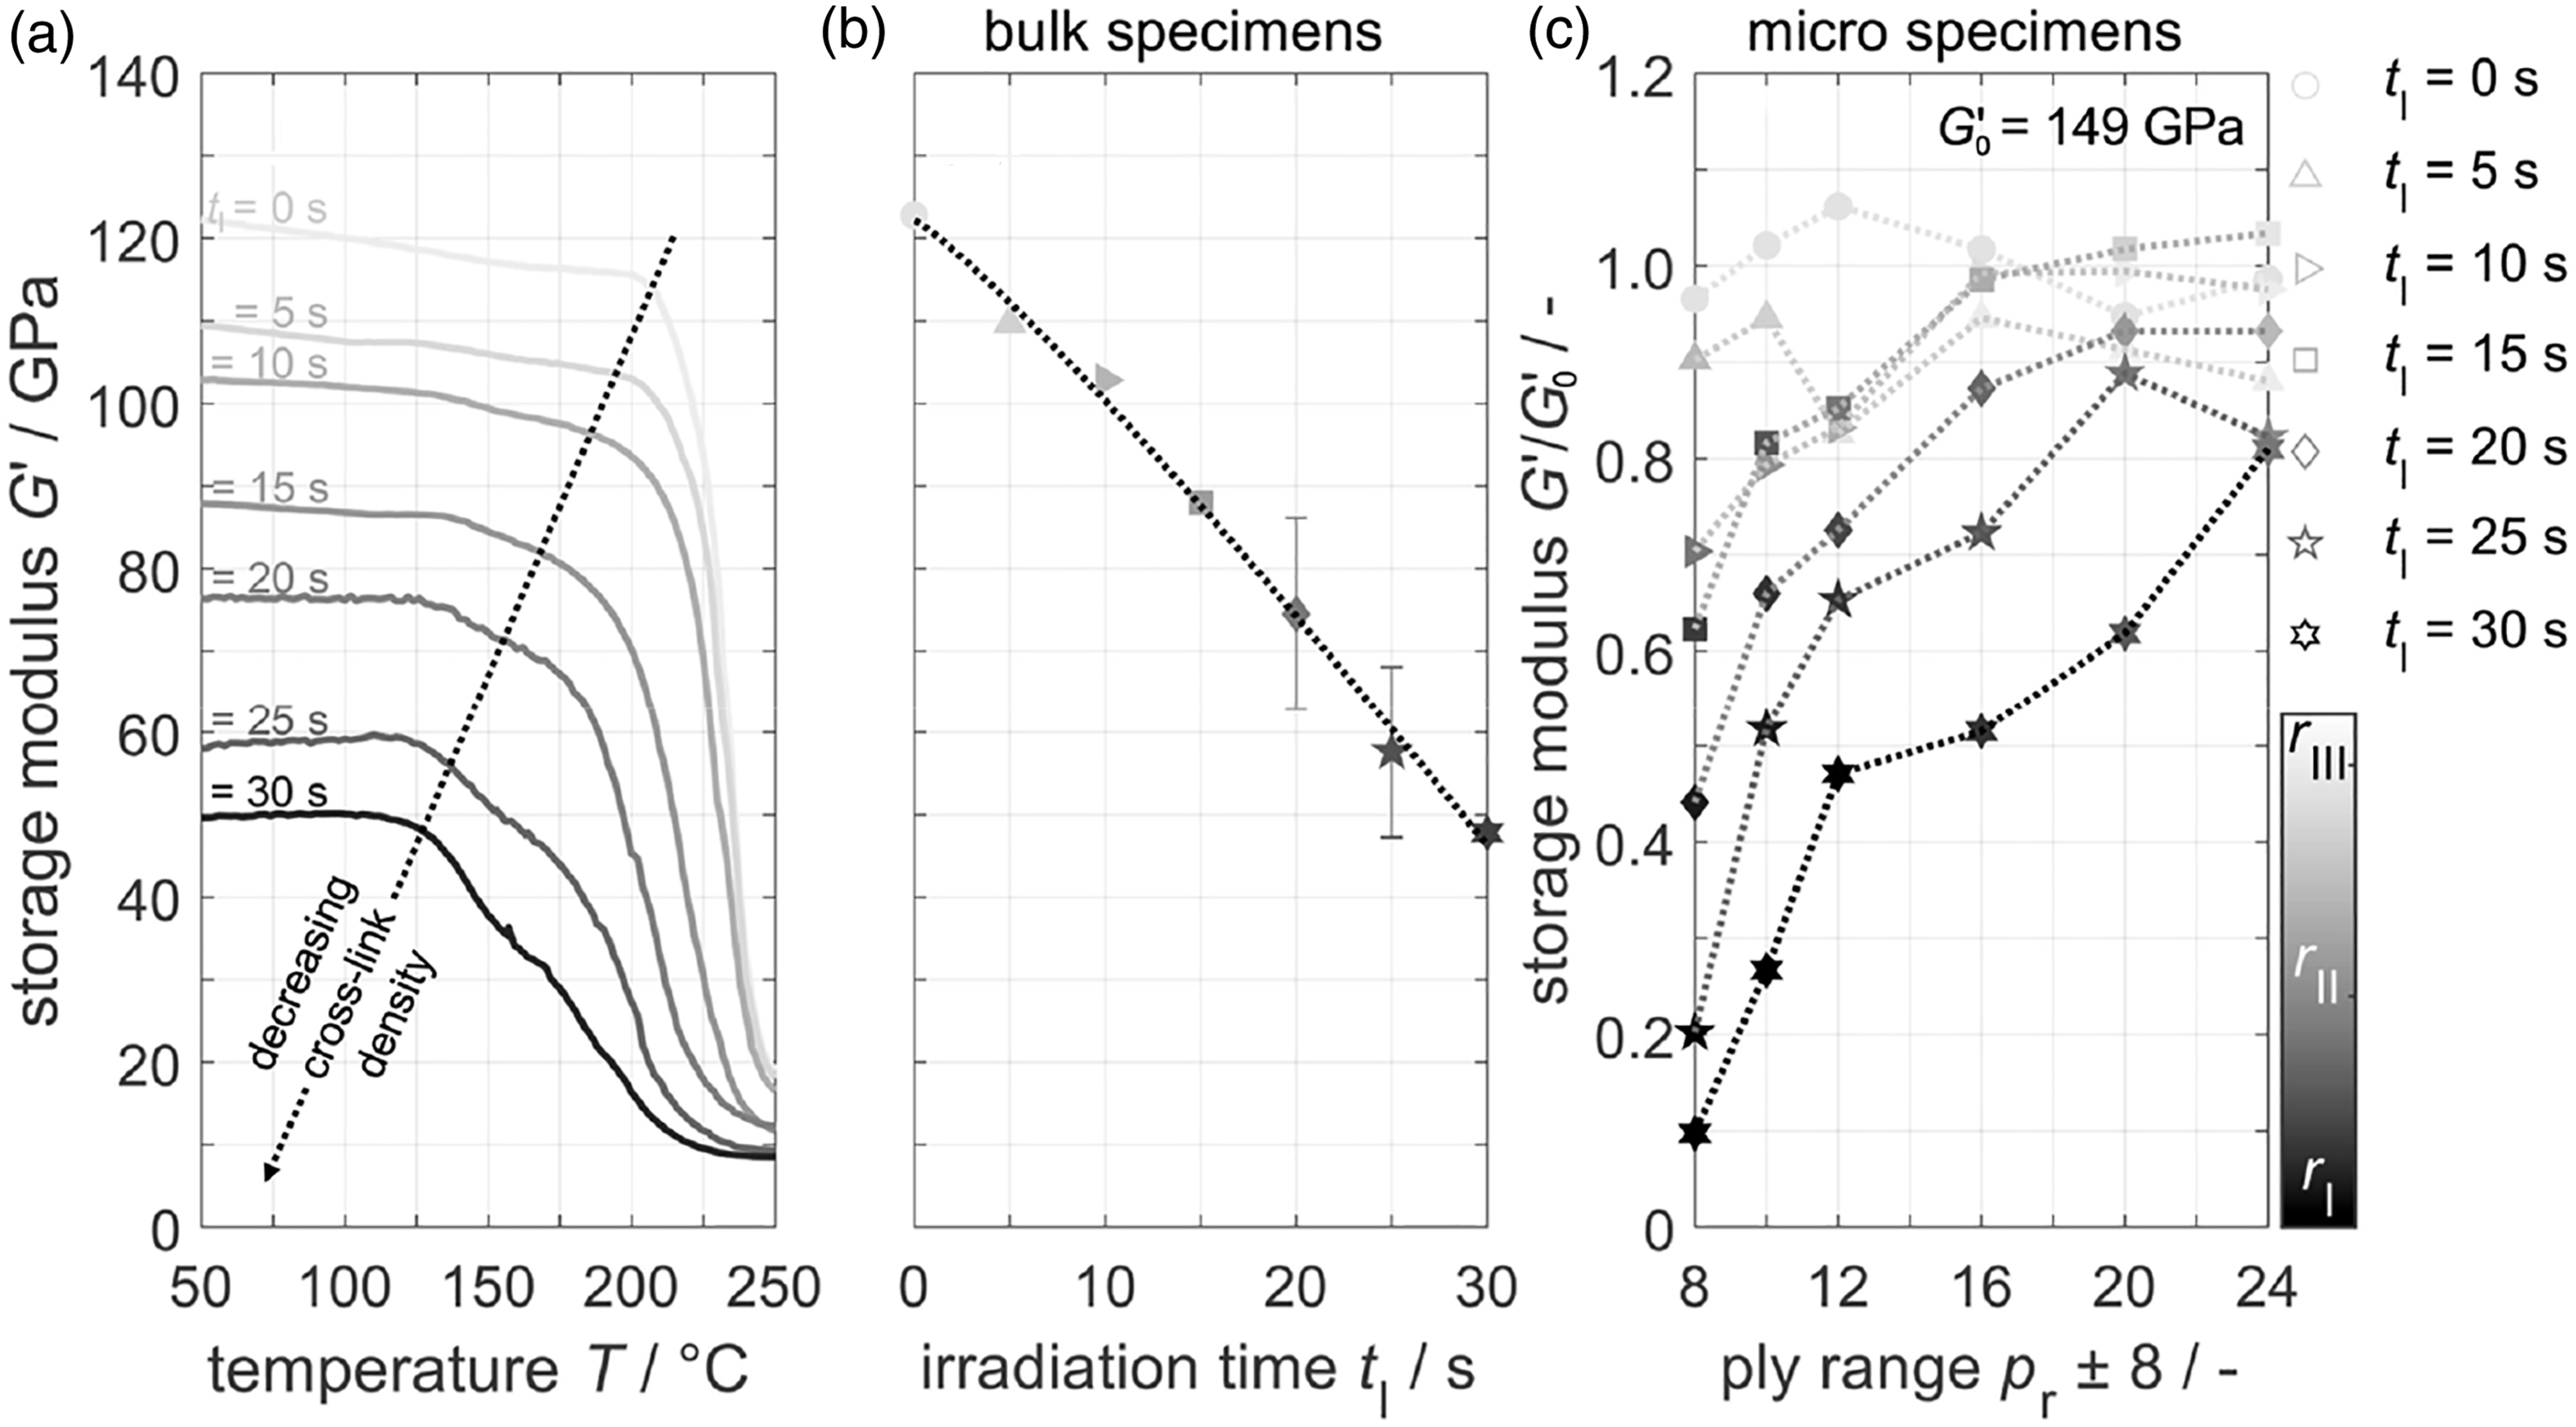
In summary, using DMA, FTIR and μCT, matrix damage can be characterized volumetrically via material stiffness, matrix degradation locally along the cross-section and structural damage within the material. Thereby, the methods complement each other optimally to explain the thermo-induced damage comprehensively by the three defined damage regions rIII, rII and rI.
Mechanical properties
Photographs of typical damage phenomena in short beam shear, compressive, four-point flexural and tensile tests for non-irradiated and irradiated bulk specimens.
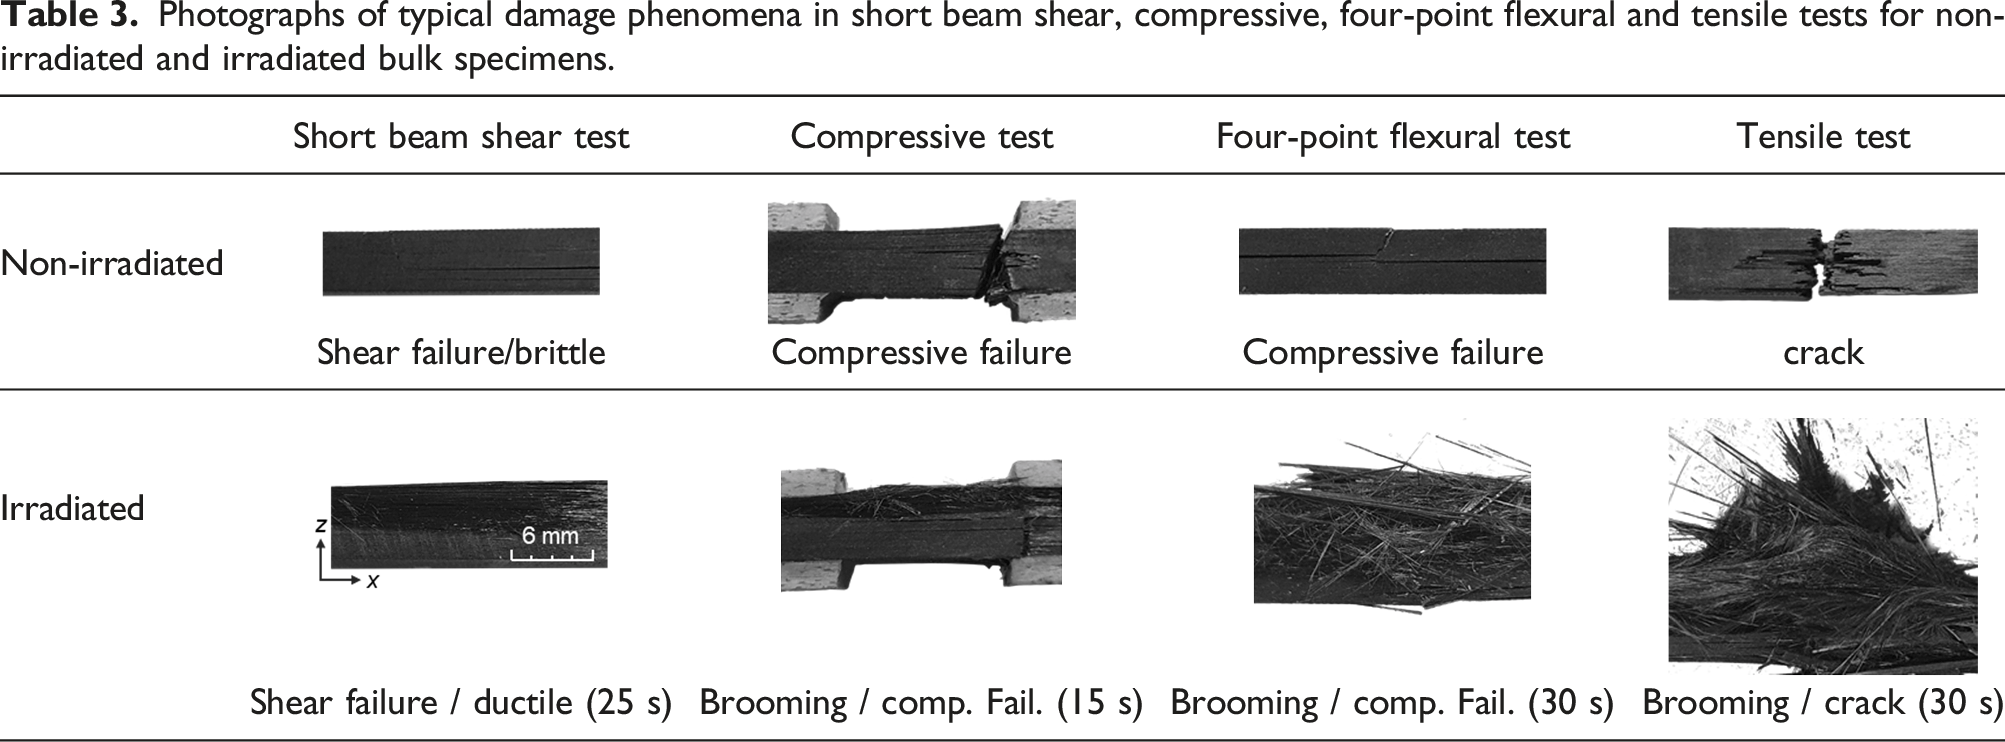
During short beam shear and four-point flexural test, the specimens are loaded under tensile, compressive and shear stress. Since in the short beam shear test small length to thickness ratios of the specimens are used, shear stresses dominate in the material.31,45,46 With progressive damage, the phenomenon changes from shear failure in one or more plies with brittle behavior to shear failure in multiple plies with ductile behavior. Under mechanical loading, shear failure with brittle behavior is indicated by steep stress-per-strain rise and significant drop at maximum force. As a result, at least one ply delaminates, which is macroscopically visible in Table 3. In comparison, shear failure with ductile behavior is indicated by flat stress-per-strain rise with multiple small stress drops and higher strains. Thereby, no significant stress drop occurs anymore due to the thermo-induced low interlaminar adhesion between the plies. For both phenomena, the first force drop is evaluated to calculate the apparent interlaminar shear strength because this is the initial point of failure. 31 In the four-point flexural test, compressive and tensile stresses dominate. Thereby, with rising thermal damage, the behavior can change from compressive to tensile failure caused by brooming.34,45,46 Thus, the damage states within the specimens are reflected in the failure phenomena and consequently in the mechanical properties.
Figure 7 shows the mechanical properties of the normalized interlaminar shear, compressive, flexural and tensile strength of (a–d) bulk and (e–h) micro specimens. The depth-resolved strength evolution induced by one-sided thermal loading can be directly analyzed by micro samples prepared from bulk material. Consequently, for non-irradiated bulk and micro specimens, similar interlaminar shear strengths of τ0 = 114 ± 2 MPa and τ0 = 120 ± 2 MPa, respectively, are obtained because in the short beam shear test the support sizes and distances are changed by a defined factor. With rising thermal loading, the strength of the specimens decreases as expected. For example, at q = 50 W/cm2 and tl = 5 s, residual strengths decrease for interlaminar shear strength to τ/τ0 = 0.81, compressive strength to σc/σc,0 = 0.86, flexural strength to σf/σf,0 = 0.87 and tensile strength to σt/σt,0 = 0.96 for the bulk material. Thus, after thermal loading, interlaminar shear strength reacts most sensitive to the irradiation scenario, followed by compressive, flexural and finally tensile strength. The effect of thermo-induced damage on mechanical strength along the cross-section can be taken from the depth profiles in (e–h). In this consideration, the virgin region rIII (light gray) has only a minor influence on the mechanical properties because its corresponding residual strengths hardly differ from the initial strengths. Only with the presence of structural damage (dark gray), noticeable strength drops occur. When the matrix is additionally depleted (black), extreme strength losses result for all mechanical loading types. For visualization, Table 1 summarizes the damage region sizes, ply ranges and failure phenomena. When these are compared, a correlation between region rI and brooming becomes evident. During compressive, flexural and tensile loads, brooming occurs only in ply ranges with region rI. This indicates that brooming requires a matrix degradation of Id = ns or structural damage of at least Ad/A0 ≥ 20 ± 5 %. Comparison of mechanical properties between bulk and micro specimens for normalized (a, e) interlaminar shear strength τ/τ0, (b, f) compressive strength σc/σc,0, (c, g) flexural strength σf/σf,0 and (d, h) tensile strength σt/σt,0 depending on irradiation time tl and ply range pr ± 8 for (e–g) and pr ± 4 for (h). In addition, the initial strengths of bulk material and damage regions ri are shown.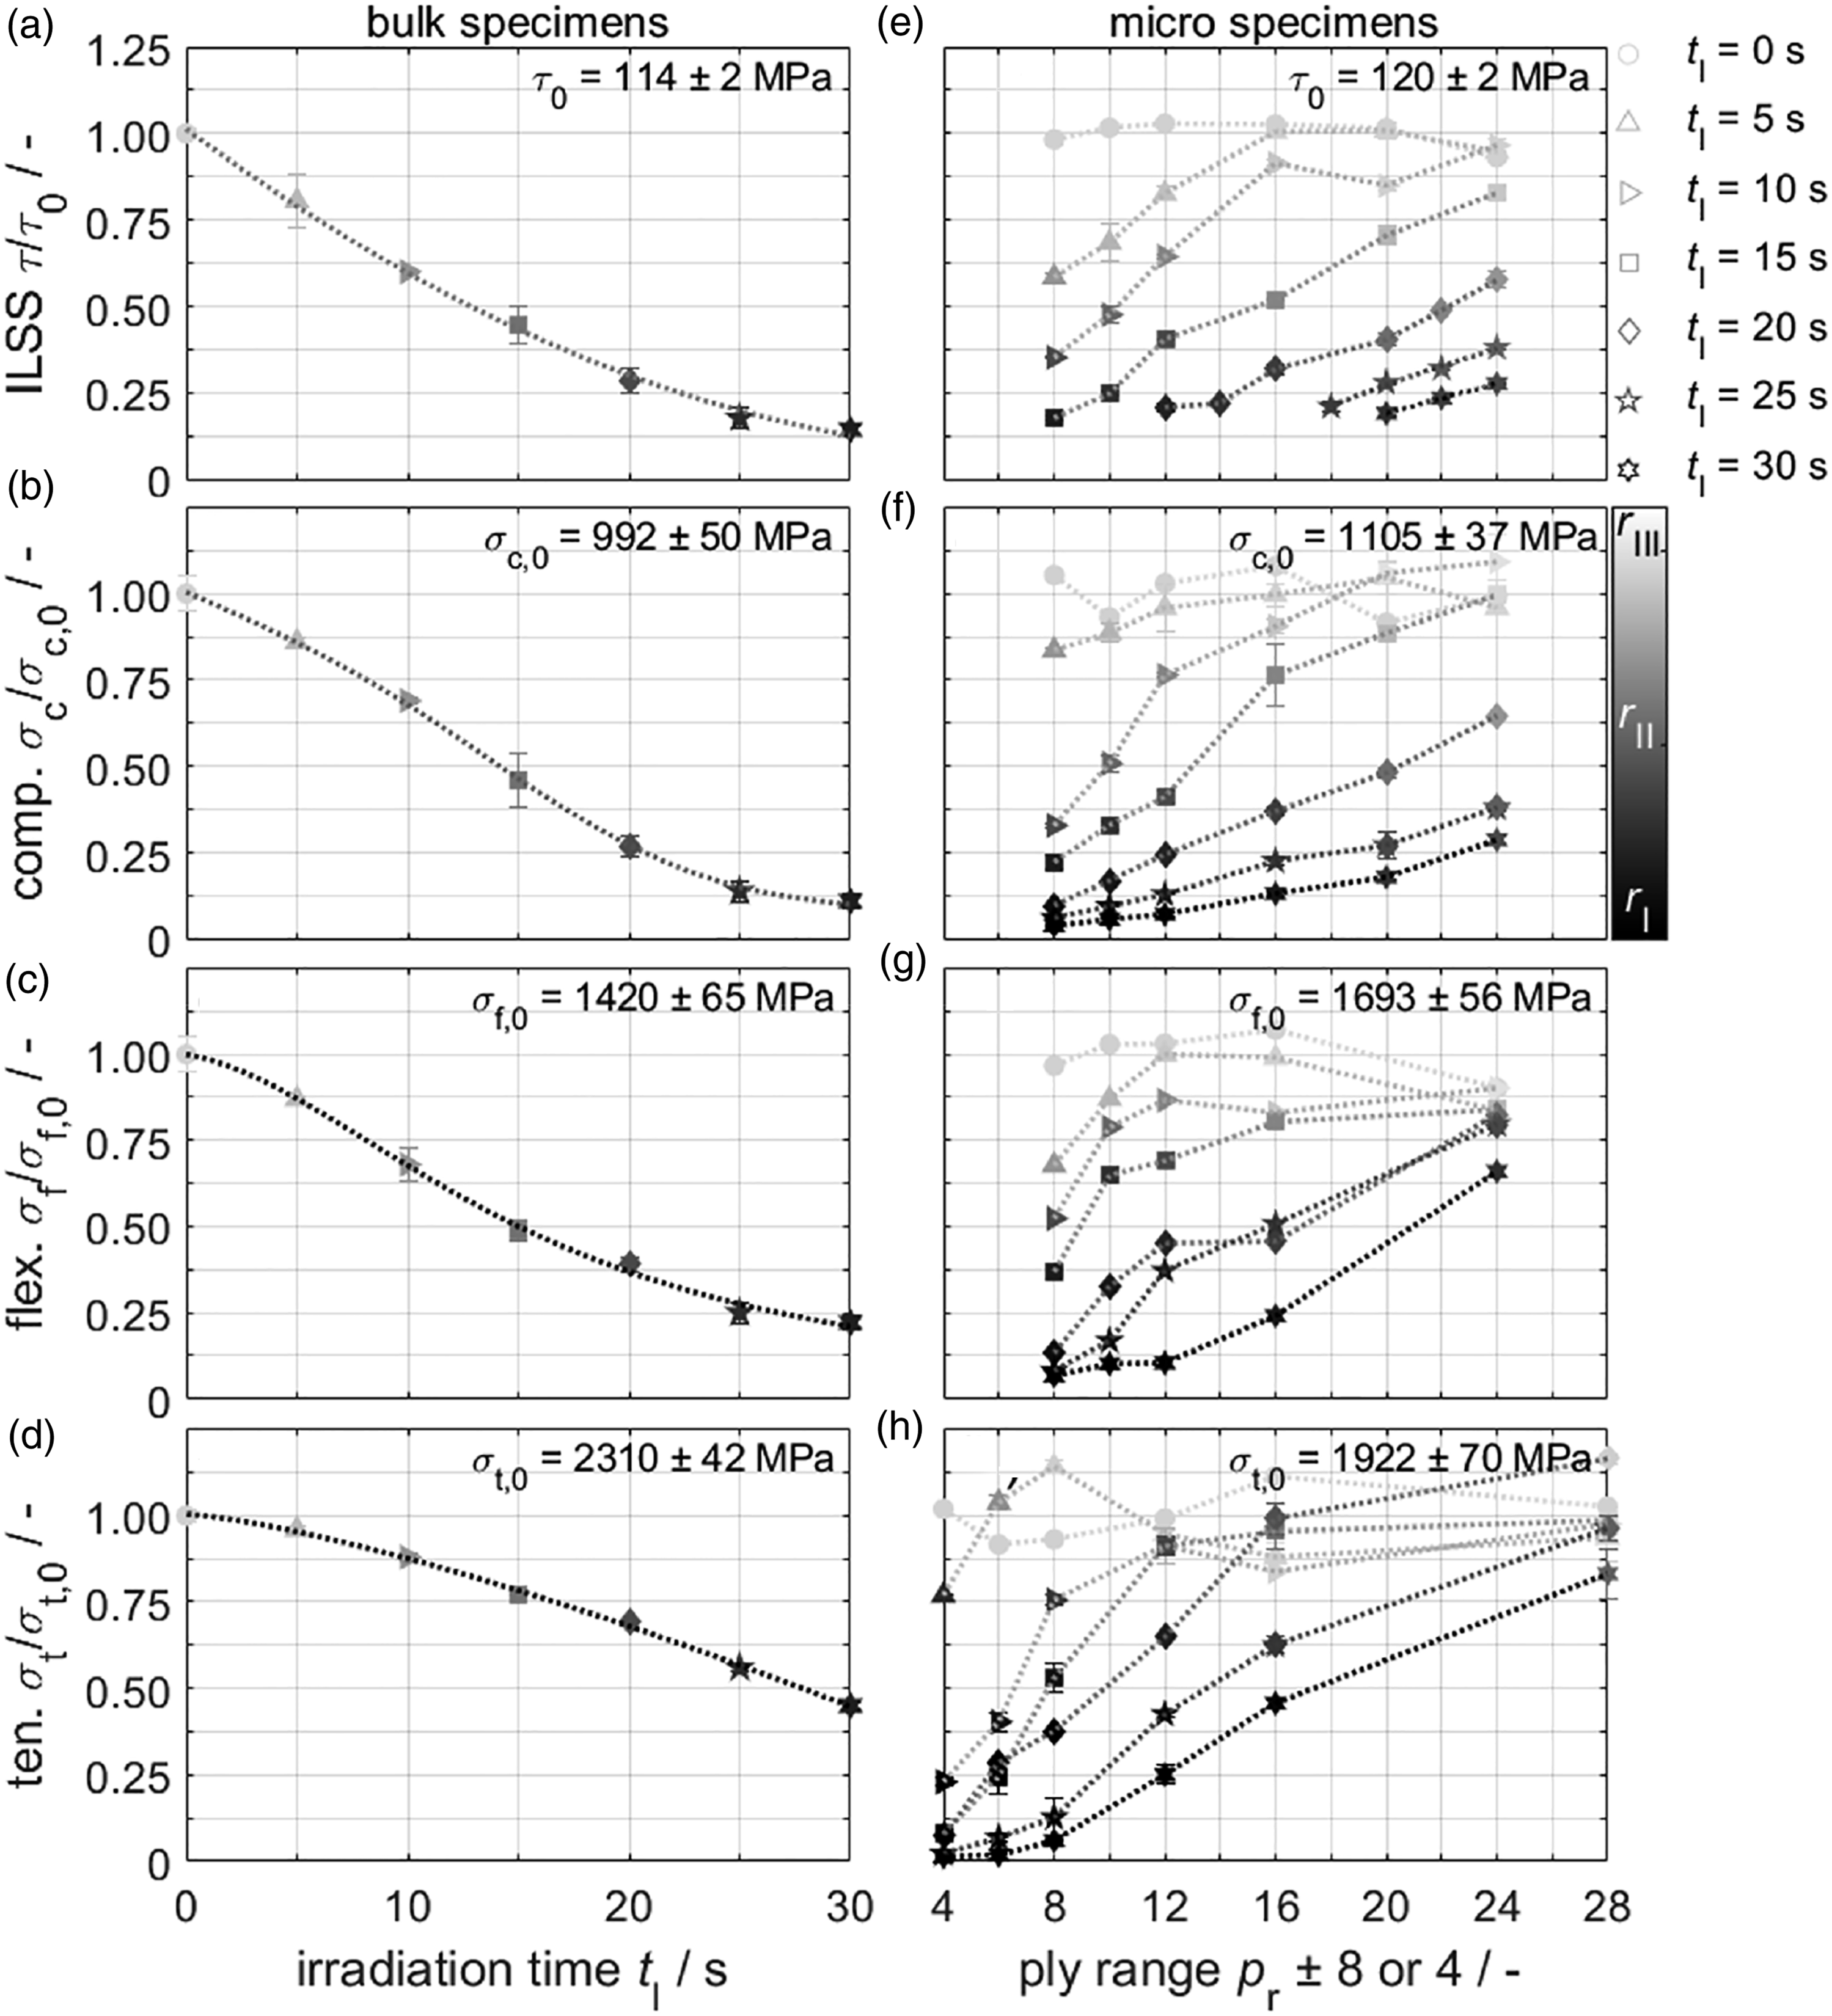
To determine the effect of structural damage on mechanical properties, the interlaminar shear, compressive, flexural and tensile strength are correlated with the normalized damaged sample volume Vd/V0 in Figures 8(a)–(d). Generally, with rising structural damage in the specimen, the strength declines. Since the residual strength decreases approximately linearly between Vd/V0 = 0 and 0.01, the sensitivity of the strength types to thermo-induced damage can be expressed via the line slope m. For example, in this range, the slope flattens from interlaminar shear strength with m(τ/τ0) = −30.6 < compressive strength with m(σc/σc,0) = −20.8 < flexural strength with m(σf/σf,0) = −3.9 < tensile strength with m(σt/σt,0) = −3.0. The closer the slope is to 0, the lower is the effect of thermo-induced damage on the strength types. Thus, interlaminar shear and compressive strength are most affected by minor structural damage. In the compressive test, defects parallel to the mechanical loading direction can lead to facilitated separation of fibre and matrix and thus to premature failure.
46
In contrast, flexural and especially tensile strength are hardly impaired. Since in the 0° tensile test the composite strength is dominated by fibre strength, this mechanical loading type is least sensitive to matrix depletion at low damaged volume.
46
Comparison of damaged volume Vd/V0 determined by μCT and normalized storage modulus 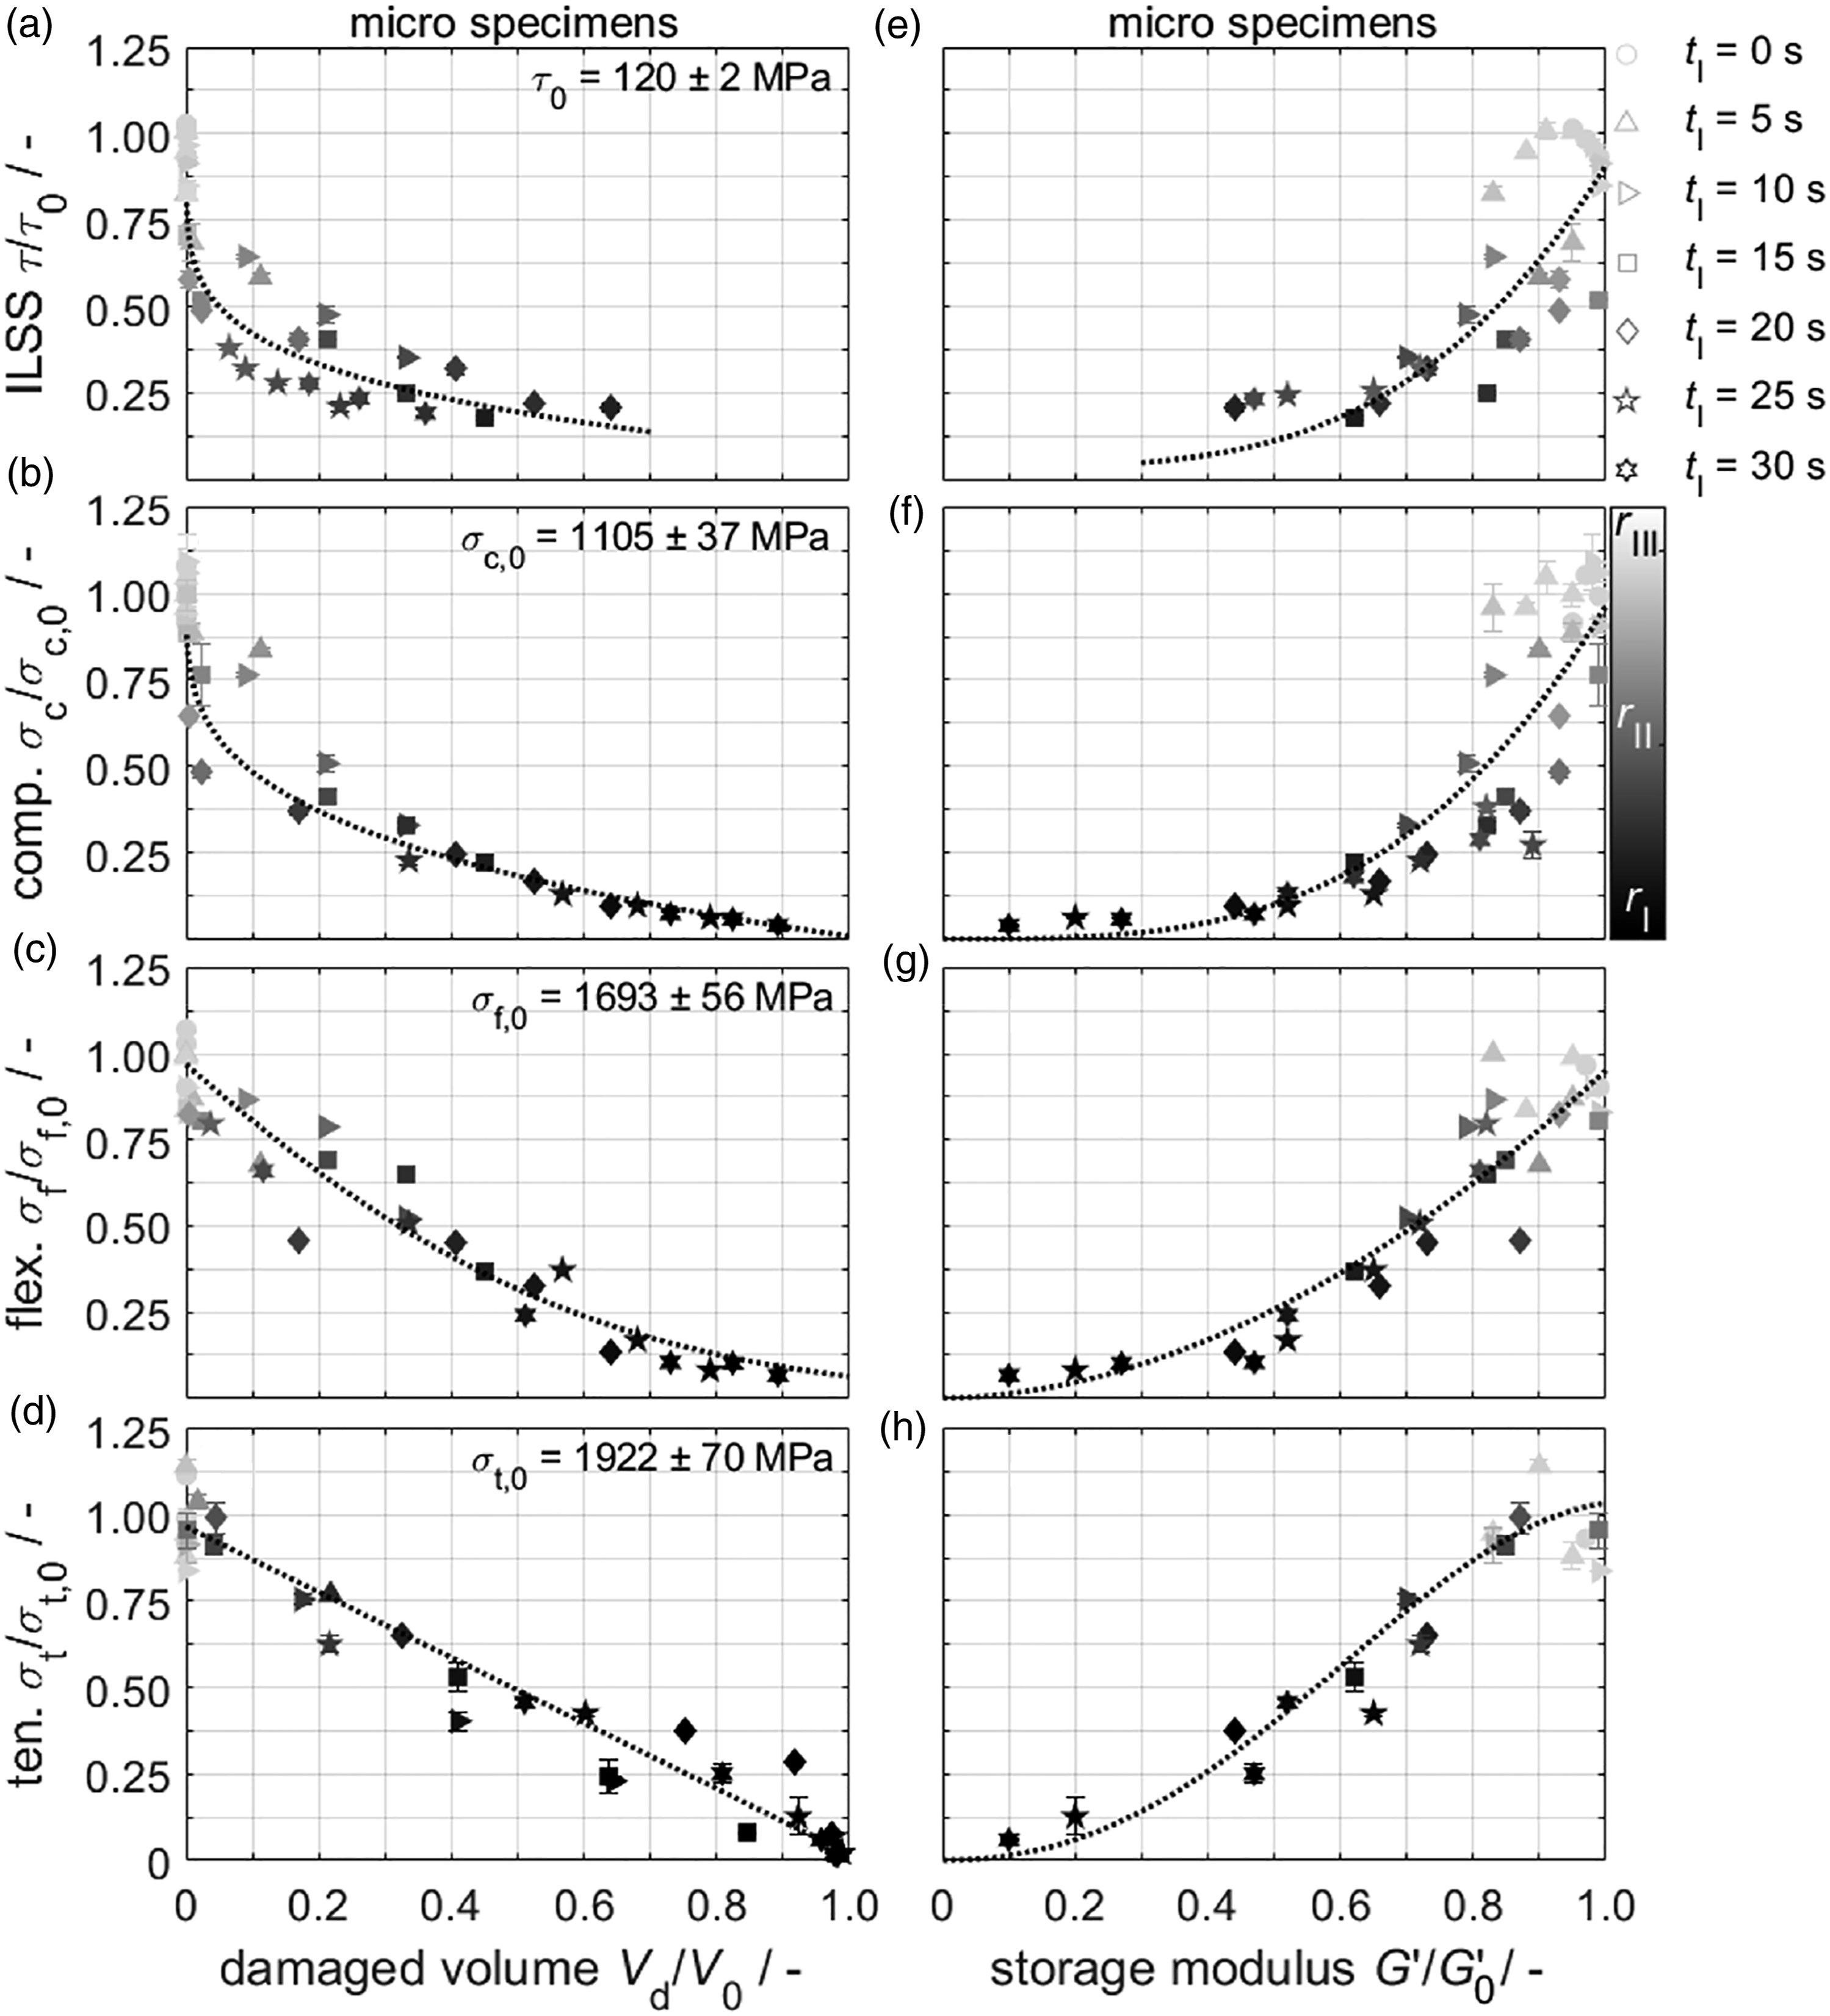
Furthermore, the influence of matrix damage on mechanical properties can be identified by correlating the interlaminar shear, compressive, flexural and tensile strength with the normalized storage modulus
Three-region model for strength calculation
In the following, the three-region model is introduced to predict the mechanical properties of CFRP after one-sided thermal irradiation based on the thermo-induced damage distribution in the material. For this purpose, the sample cross-section is separated into three damage regions defined by non-destructive methods such as μCT in Figure 3(b) or FTIR in Figure 4(b). Subsequently, the ply numbers of the regions p(ri) are determined and normalized to the total ply number pt. Finally, the normalized residual strength τrs/τ0 is calculated from the product sum of relative region sizes p(ri)/pt and sensitivity factors α(ri) according to Formula (1).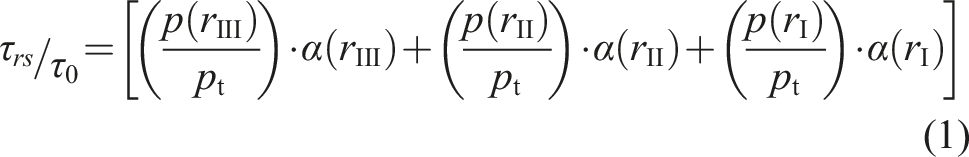
The sensitivity factors represent the different impact of the damage regions rIII, rII and rI on the various types of mechanical loading. Thereby, the factors can reach values between 0 (no residual strength left) and 1 (initial strength). Consequently, from the virgin region rIII to matrix depleted region rI, the sensitivity factor declines. As first approximation, sensitivity factors of α(rIII) = 1 and α(rI) = 0 can be selected for all strength types. This means that the strength does not decrease at region rIII and completely at region rI. The sensitivity factors for region rII are intermediate and can be calculated using the least square method47–49. In this method, the factor is adjusted until the residual sum of squares from calculated and experimental values reaches a minimum. For illustration, Figures 9(a)–(d) shows the experimental residual strengths versus the calculated residual strengths according to Formula (1) for interlaminar shear, compressive, flexural and tensile strength. Thereby, the experimental strengths of the micro samples are used to calibrate the sensitivity factors. The approximation results in low sensitivity factors for interlaminar shear strength with ατ(rII) = 0.34 and compressive strength with αc(rII) = 0.35 and higher factors for flexural strength with αf(rII) = 0.86 and tensil strength with αt(rII) = 1.00. Thus, the effect of structural damage in region rII on mechanical properties decreases from interlaminar shear to compressive, flexural and tensile strength. The sensitivity sequence is consistent with the determined line slopes in Figures 8(a)–(d). Consequently, the sensitivity factors correlate with the corresponding damage regions. With known initial strengths, region sizes and sensitivity factors, the residual strengths can now be calculated. As an example, for interlaminar shear strengths, intensity factors of ατ(rIII) = 1, ατ(rII) = 0.34, and ατ(rII) = 0 are applied. If the micro sample is composed of p(rIII) = 7, p(rII) = 3 and p(rI) = 6 plies, a residual strength of τrs = 60 MPa is calculated, which corresponds to the experimental residual strength of τ = 57 ± 3 MPa. For the various strength types, the coefficients of determination between experimental and calculated strengths are R2(ILSS) = 0.957, R2(comp.) = 0.969, R2(flex.) = 0.917, R2(ten.) = 0.809. Thus, the assumption of α(rIII) = 1 and α(rI) = 0 for the sensitivity factors provides a good prediction quality for interlaminar shear, compressive and flexural strength. In comparison, the calculated tensile strength deviates most from the experimental values, which can be attributed to a systematic error of the sensitivity factors. Comparison between experimental and calculated residual (a) interlaminar shear τ/τ0, (b) compressive σc/σc,0, (c) flexural σf/σf,0 and (d) tensile strength σt/σt,0 of micro samples. The calculated strengths are obtained with constant α(rIII) = 1, α(rI) = 0 as well as variable 0 < α(rII) < 1 sensitivity factors using Formula (1). In addition, coefficients of determination R2 and damage regions ri are illustrated.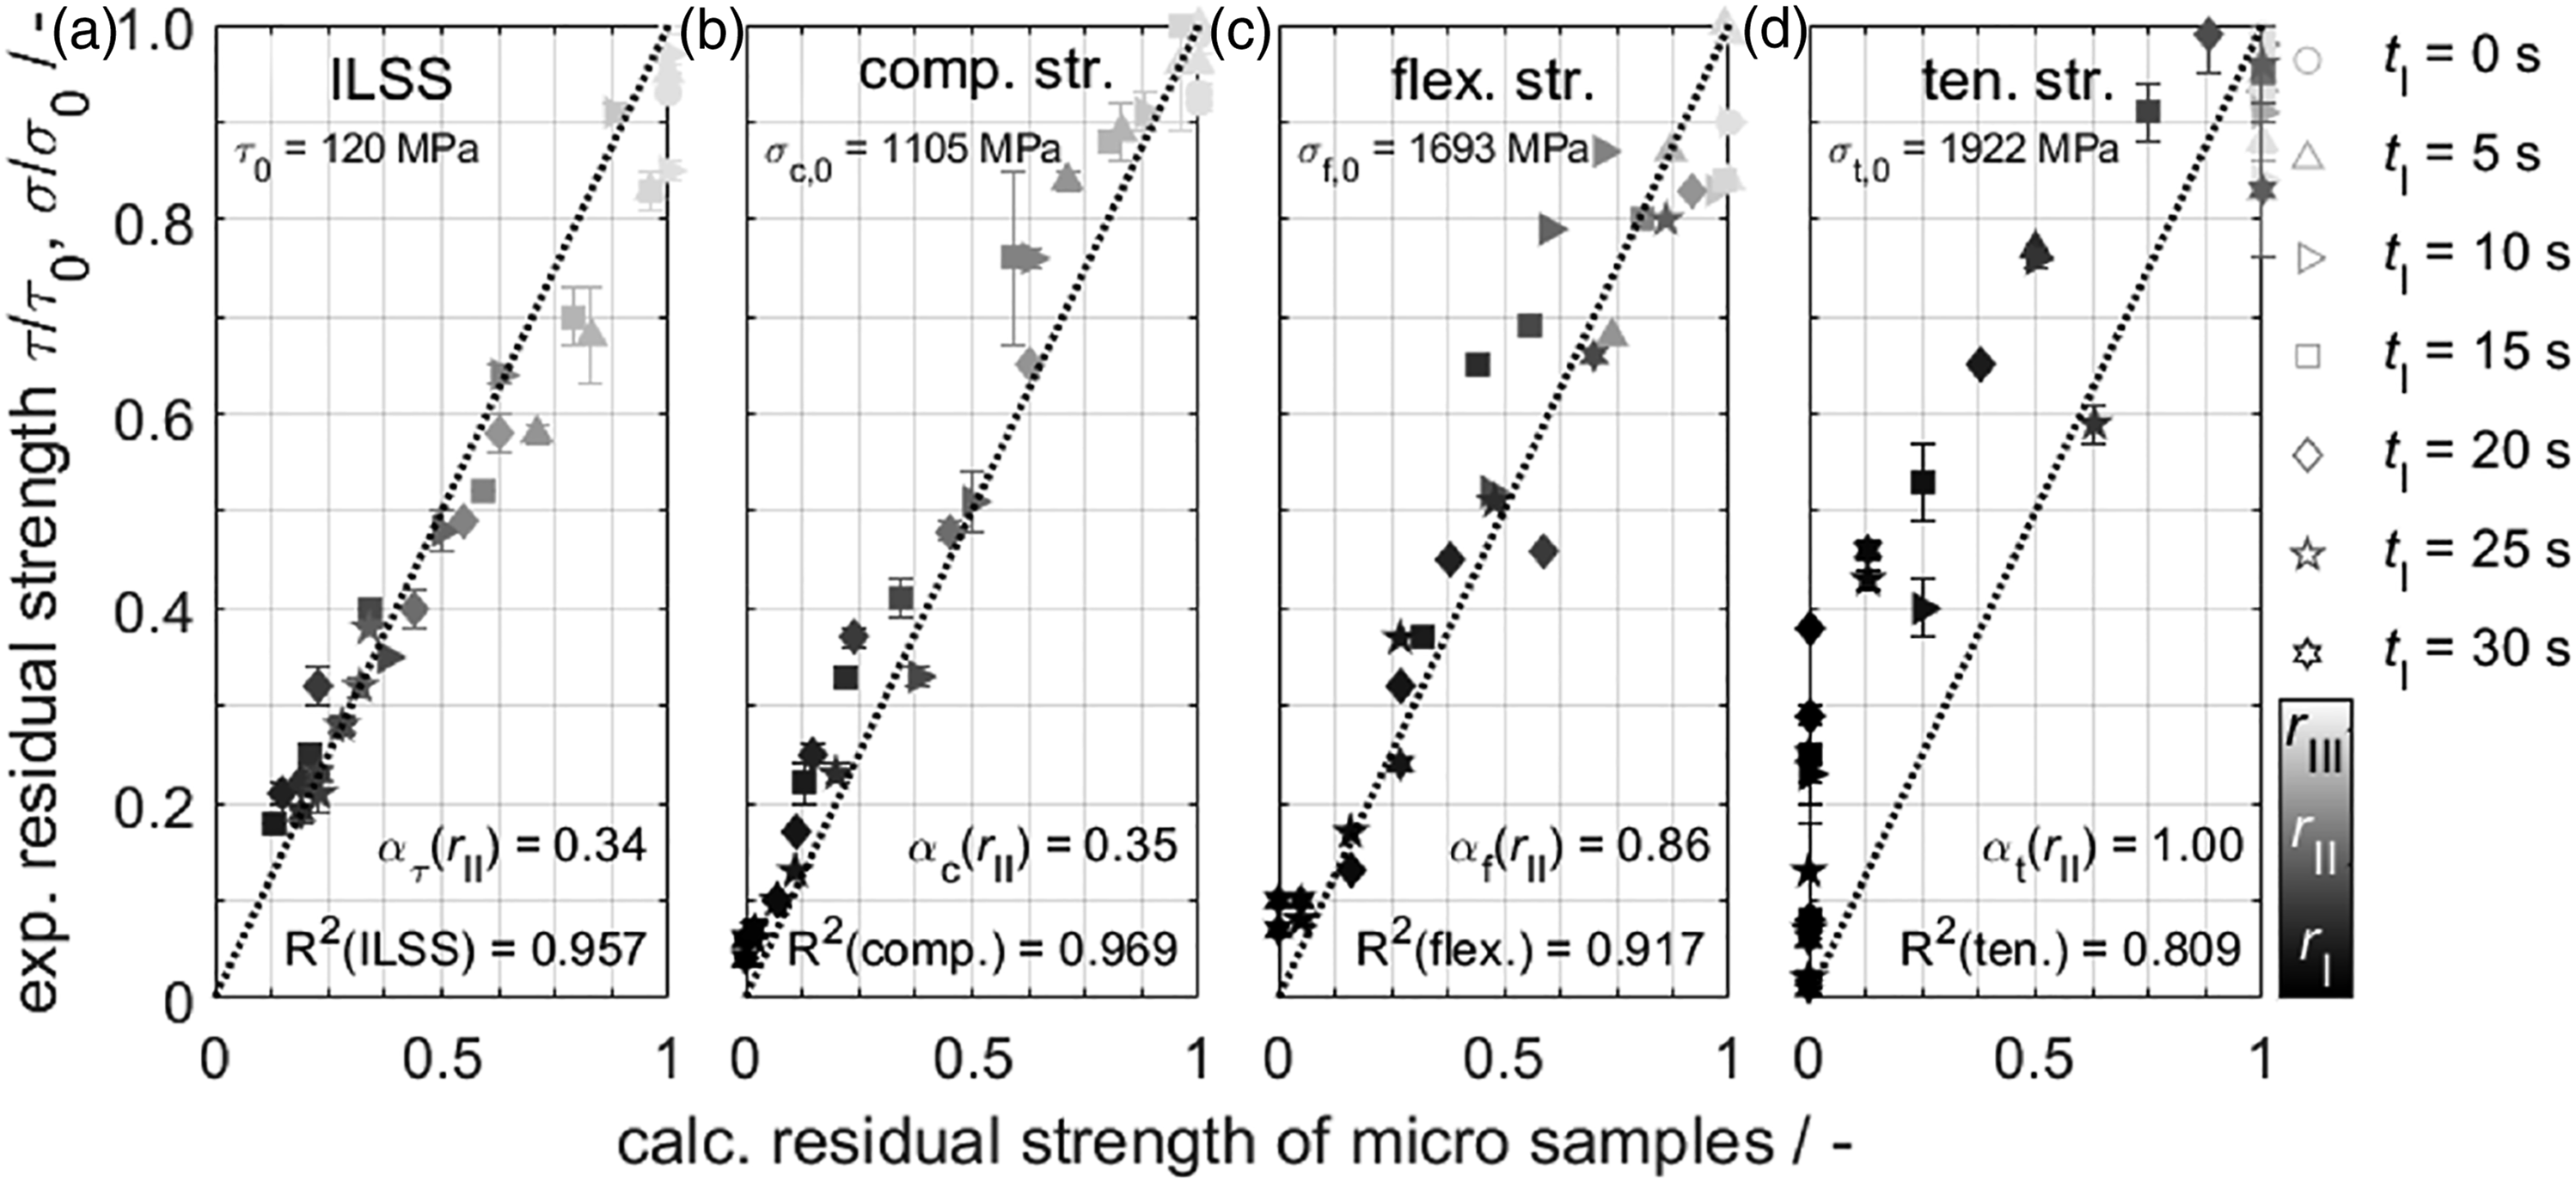
The assumptions that region rIII leads to no and region rI to complete strength loss are simplifications which can be more accurately determined on the basis of the generated results. For this purpose, the correlation of residual strength with damaged volume and storage modulus in Figure 8 also considers the effect of damaged regions on mechanical properties using gray value scaling. The strength values for region rIII (light gray) are near Vd/V0 ∼ 0 and
Overview of sensitivity factors α(ri) from the simple and advanced 3-region model for interlaminar shear, compressive, flexural, and tensile strength.
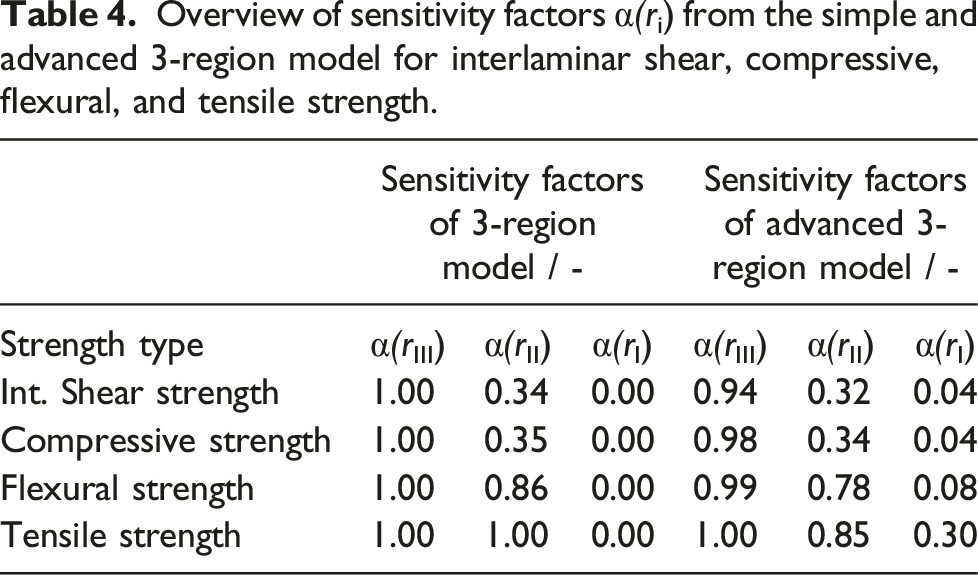
To evaluate the sensitivity factors, the experimental residual strengths are compared to the calculated residual strengths of the bulk material using (a) three-region model and (b) advanced three-region model in Figure 10. In the three-region model, the sensitivity factors α(rIII) = 1 and α(rI) = 0 are set constant for simplification and only α(rII) is varied. In contrast, in the advanced three-region model, all factors are adjusted according to the determined strength type sensitivities to thermo-induced damage. For both models, the prediction quality is high with R2 = 0.964 and R2 = 0.983, respectively, for all strength types of the bulk samples. For interlaminar shear, compressive and flexural strength, both models are equivalent since the sensitivity factors are similar. These strength types are hardly affected by region rIII with moderate matrix degradation and extremely by region rI with matrix depletion. Thus, the strength types differ primarily in their different sensitivities to region rII with delaminations. For the determination of tensile strength, the simple-region model provides good R2(ten.) = 0.881 and the advanced excellent R2(ten.) = 0.940 accuracies. This is because region rI must not lead to complete strength loss according to the sensitivity factor of αt(rI) = 0.3. Consequently, for a precise calculation of the tensile strength of severely damaged specimens σt/σt,0 < 0.3, a fourth region rIV with fibre degradation might be introduced in a further advanced model. Comparison of experimental and calculated residual strengths of bulk specimens using (a) three-region model and (b) advanced three-region model. In addition, coefficients of determination R2 are given to illustrate the prediction quality.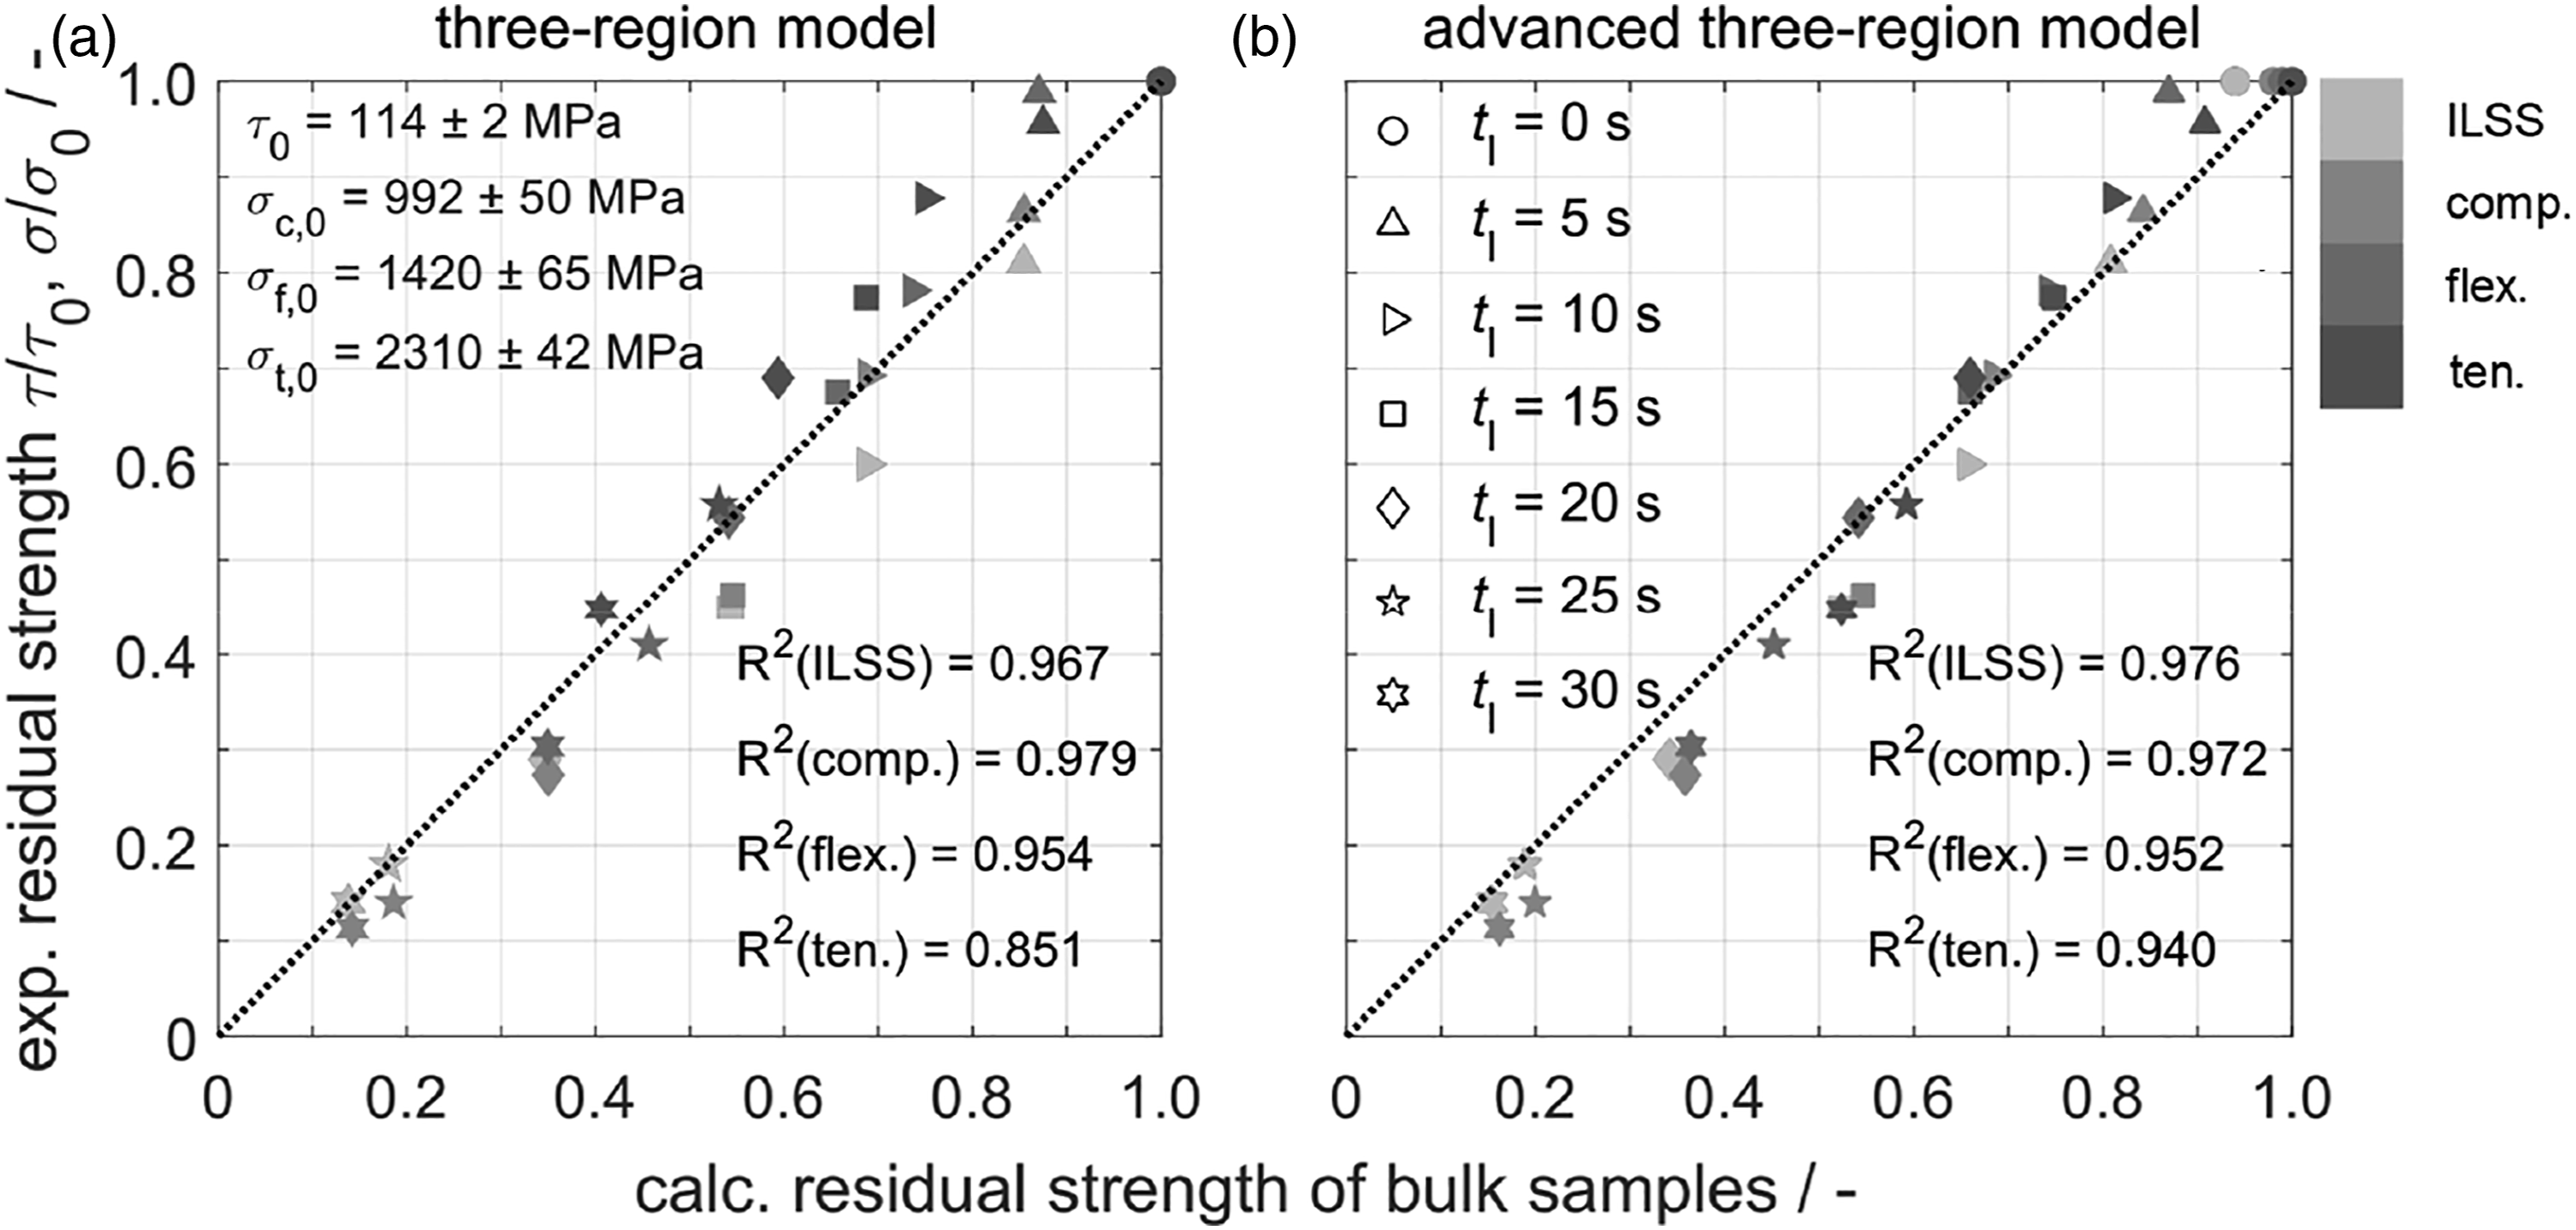
Compared to other approaches,18,50 the three-region model is characterized by the following features: Since the material cross-section is divided into three damage regions, the model provides an excellent approximation of strength. Furthermore, it is not necessary that irradiation conditions as well as radiation effects must be known, because only the distribution of the three regions is considered. Moreover, the model can be used to predict the mechanical properties of various strength types. Thereby, the influence of strength types on thermo-induced damage can be expressed with sensitivity factors. The material thickness and expansion in the z-direction may be negligible due to the ply-related approach. However, depth-resolved investigations require considerable instrumental effort.
Conclusion
In this work, the CFRP 8552/IM7 was thermally loaded from one side at q = 50 W/cm2 under varying irradiation times. The temperature was recorded depending on exposure time and ply position. Subsequently, defined plies of bulk material were removed to prepare micro samples from different depths. Both bulk and micro samples were examined by non-destructive and destructive methods.
During one-sided thermal loading, the material heats up under formation of temperature gradients along the thickness direction. As a result, damage gradients develop, which can be generally divided into three regions using non-destructive methods like μCT and FTIR. Beginning from the back side, in region rIII, no visible structural damage can be detected. Nevertheless, moderate weakening of fibre-matrix adhesion and matrix degradation may be present. In contrast, region rII contains structural damage such as delaminations, cracks and pores. In region rI, the matrix is additionally depleted and carbon fibres are set free.
Thereby, μCT and FTIR are differently sensitive to thermal damage of CFRP. Whereas, FTIR is able to detect moderate thermal damage such as matrix degradation, μCT is limited to more pronounced structural damage. However, both methods are suitable to identify the three damage regions. FTIR can characterize the transition from virgin to structural damage region (rIII → rII) by the threshold for delamination formation. While μCT identifies the transition between structural damage to matrix depleted region (rII → rI) by the threshold for matrix depletion. Thus, both methods complement each other optimally and can be used independently within this study.
By ply-dependent characterization of thermal degradation in composites, the influence of heat flux, decomposition processes and damage regions on residual strength can be determined. It turns out that the damage regions from moderate matrix degradation, via structural damage to matrix depletion increasingly affect the strengths. Thereby, interlaminar shear is affected most, followed by compressive, flexural and tensile strength. Tensile strength in fibre direction is least sensitive to heat flux and irradiation time, since matrix depletion or fibre decomposition must be present for a significant strength drop. If matrix depletion is present, brooming occurs and thus failure phenomena during mechanical loading change.
It is important to consider the various steps of the degradation mechanism with respect to their different impact on the four investigated strength types. By this, it is possible to correlate the expansion of the three regions, in which the various degradation steps differently occur, with the residual strength, separately for interlaminar shear, compressive, flexural and tensile strength. Based on these findings, a three-region model can be introduced to predict the mechanical properties of thermally loaded composites. In this model, the material cross-section is divided into three damage regions and the residual strength is calculated from the product sum of initial strengths, relative region sizes and sensitivity factors. The sensitivity factors represent the influence of damage regions and therefore the effect of the certain degradation steps on the various strength types. For the simple model, the assumptions are made that the strength types are not affected by virgin region and maximally influenced by matrix depleted region. Thus, the influence of structural damage to strength types can be quantified. In the advanced model, all sensitivity factors are adjusted according to the quantification of thermal damage in CFRP. Thereby, both models provide excellent prediction qualities for interlaminar shear, compressive and flexural strength. Moreover, in the advanced model, the predicted tensile strengths are more accurate, since matrix depletion does not necessarily lead to complete strength loss.
The overall goal of this work is to use non-destructive methods in combination with the three-region model to characterize, classify and quantify the thermo-induced damage in CFRP components after real thermal loading scenarios in order to predict its residual strengths. To realize this, the model will still be validated in future research for different irradiation scenarios like long-lasting low heat fluxes and short-lasting high heat fluxes, various material thicknesses and materials types. Based on these results, the model should be universally applicable for even unknown irradiation conditions and common materials with different laminate structures. Furthermore, the damage regions will be correlated with temperature profiles to find possible temperature thresholds for damage processes. As a result, maximum material temperatures could also be inferred from thermo-induced damage. Finally, the presented results might also be a good basis for refined finite element simulations, considering the thresholds for various damage states.
Footnotes
Acknowledgements
The authors want to thank André Ehgartner for his experimental support.
Declaration of conflicting interests
The author(s) declared no potential conflicts of interest with respect to the research, authorship, and/or publication of this article.
Funding
The author(s) disclosed receipt of the following financial support for the research, authorship, and/or publication of this article: We acknowledge financial support for open access publication by SAGE Choice of the Universität der Bundeswehr München.