
Abstract
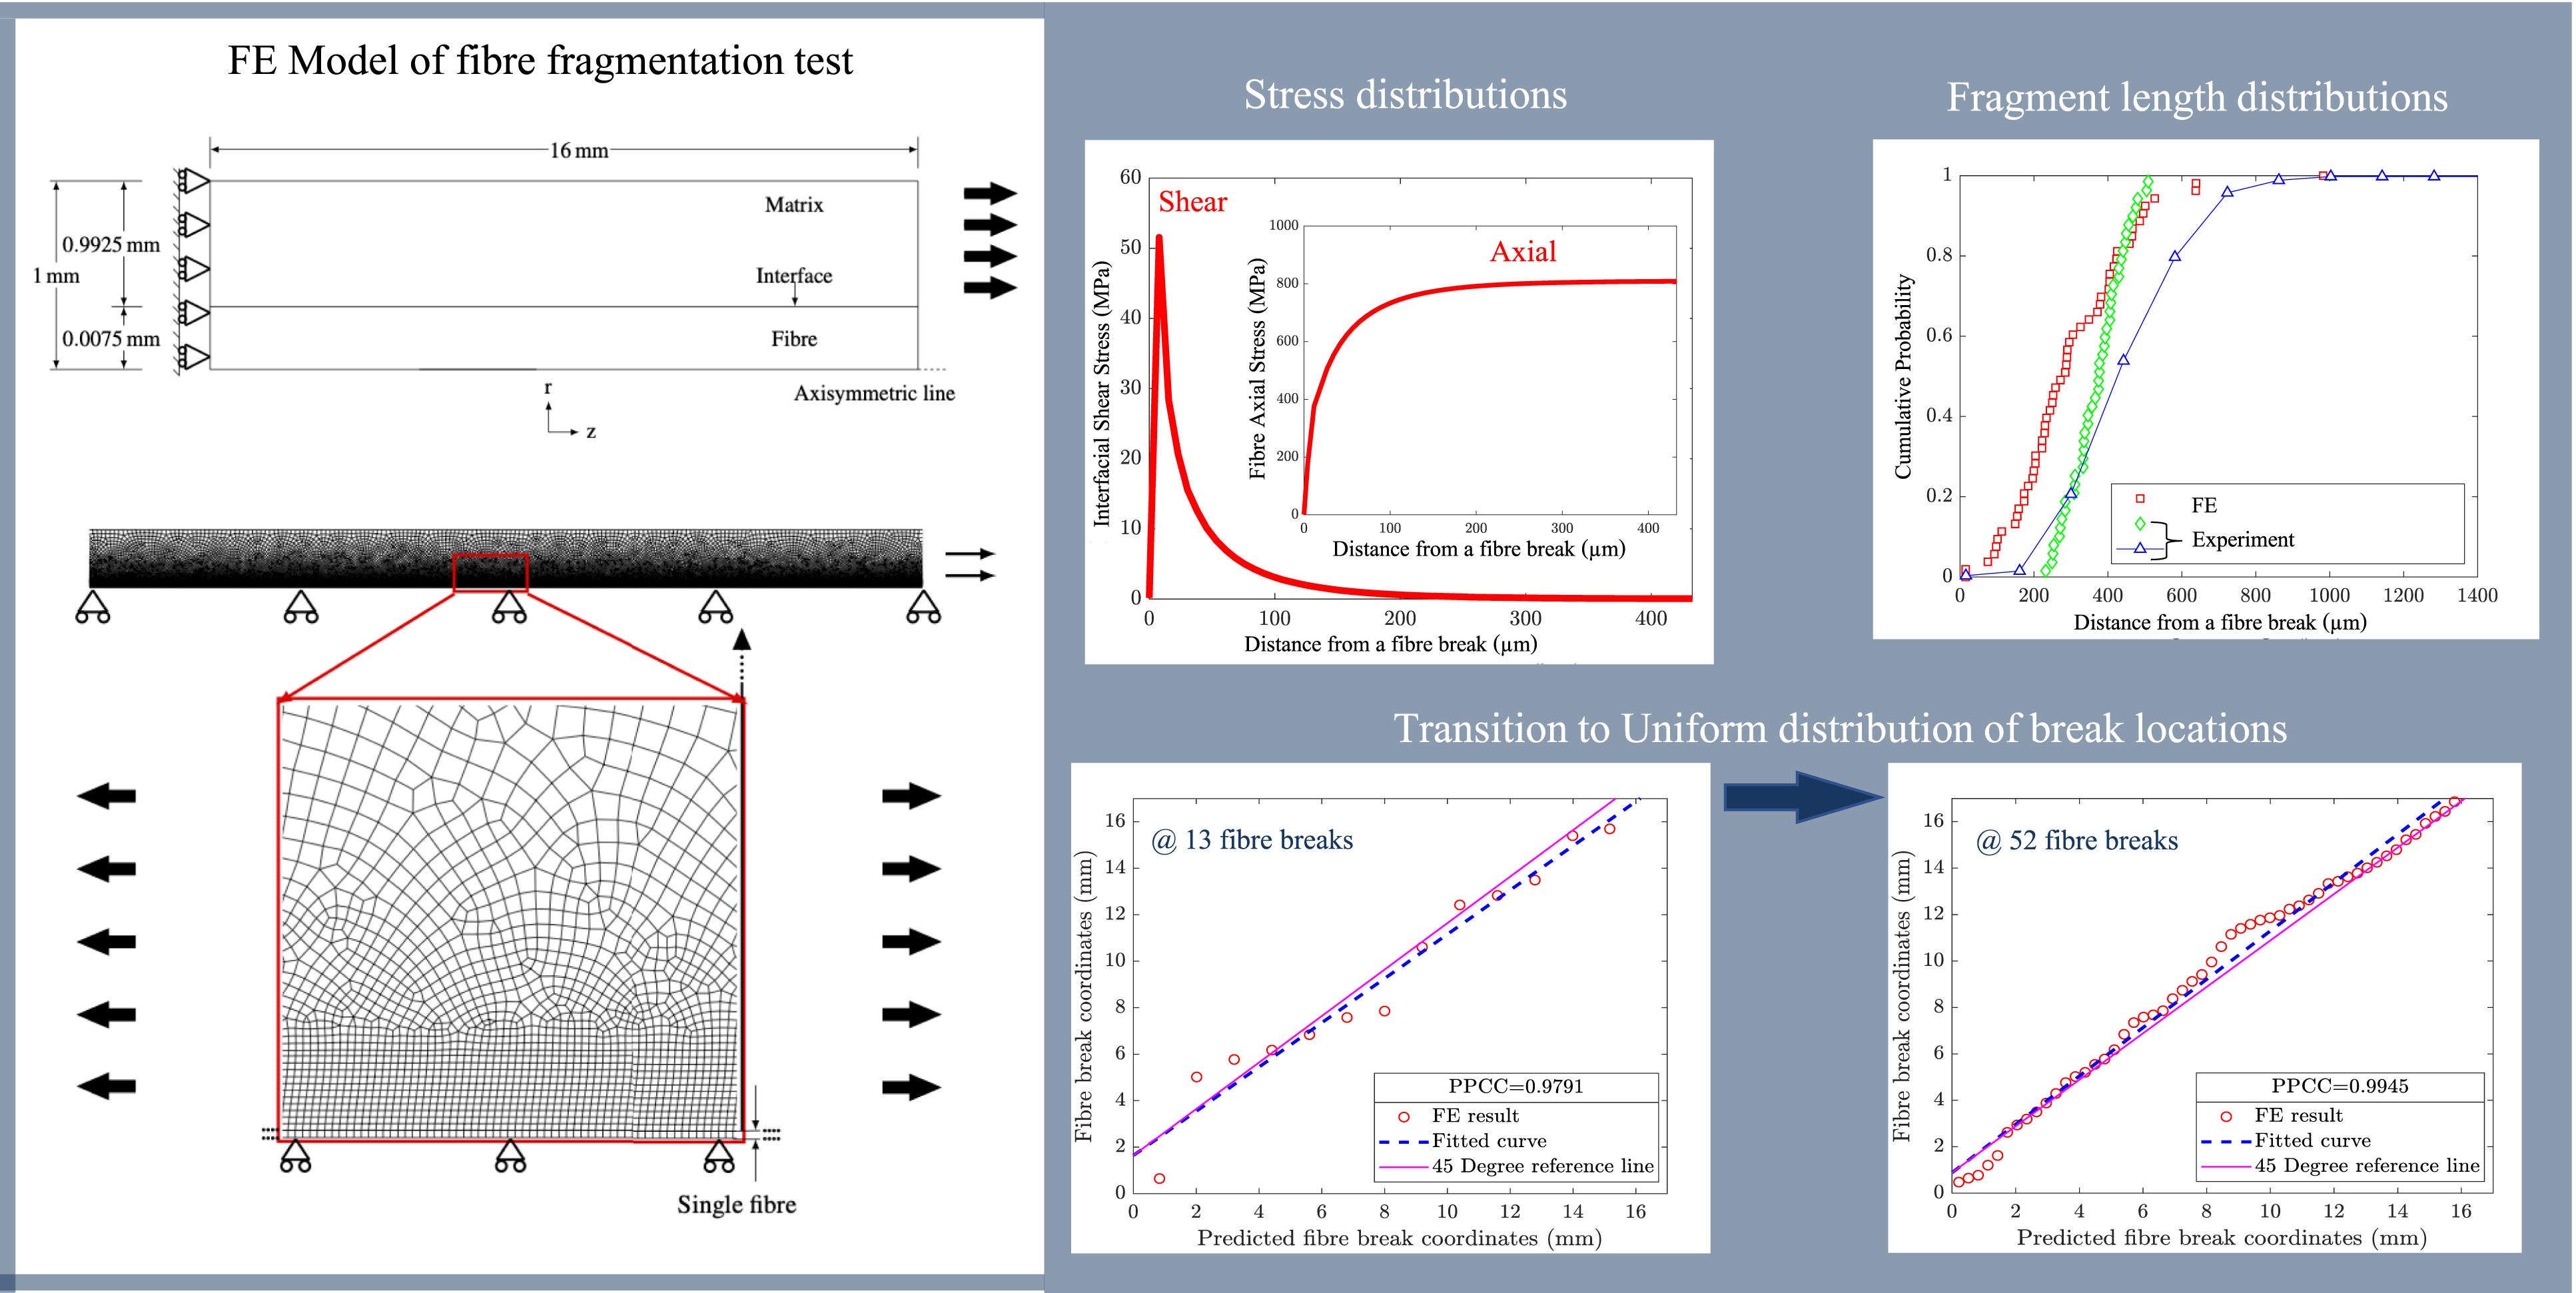
This paper develops a finite element (FE) model of the single fibre fragmentation test designed for direct comparison with experimental results on an E-glass/epoxy system by McCarthy et al. (2015). Interface behaviour is modelled via a cohesive surface, and stochastic Weibull fibre strengths (determined by independent experiments) assigned at random to the elements along the fibre. Predictions from the model agree with experiment for a range of outputs: The evolution of the number of fibre breaks with strain is similar and breaks occur at random locations as required. The model also captures a transition to a Uniform (rather than Weibull) statistical distribution of break locations at later stages of the test consistent with recent experiments. The evolution of the cumulative distribution of fragment lengths is also similar to that of the experiment. In addition, fibre axial stress and interfacial shear stress distributions conform with experimental observation. Correct model predictions of break locations confirm the approach taken on assigning stochastic (Weibull) strengths along the fibre. The effectiveness of the FE model in capturing a number of key aspects of the fragmentation phenomenon suggest its usefulness as a tool in analysing and interpreting fibre fragmentation tests, including back-calculation of interfacial shear strength.
Keywords
Introduction
In fibre-based composite materials, excellent specific strength and stiffness properties are achieved because the reinforcing fibres (usually glass or carbon fibres) confer high stiffness and strength while a relatively low density matrix material (often a polymer) holds the material together. The mechanical properties of the composite clearly depend on the mechanical properties of the constituent fibre and matrix materials, but they are also highly dependent on the properties of the fibre-matrix interface. Essentially, when load is applied to the composite matrix, it is transferred to the fibres via shear stress arising from the inherent strength of the fibre-matrix interface.
Fibre and matrix mechanical properties can be easily determined by conventional tensile testing. However, the properties of the interface are more complex and difficult to access. The main parameter characterising the interface is the fibre-matrix interfacial shear strength (IFSSh). This is clearly a critical parameter: for example, a low-strength interface will tend to debond, while a high-strength interface will tend to remain bonded and transfer more load into the fibres. Key practical uses of the IFSSh include its importance as a key input to micromechanical composite strength and damage models1,2 and its usefulness as a means for assessing the interfacial strength of various fibre sizing (coating) types.3,4 Several testing approaches have been proposed to measure fibre-matrix interface behaviour: pull-out tests,5,6 micro-bond tests,5,7 micro-indentation tests8,9 and, the subject of the present paper: the single fibre fragmentation test (SFFT).10–12 Among these approaches, the SFFT (first proposed by Kelly and Tyson 13 ) is considered one of the most insightful as it allows for determination of interface properties in-situ while the fibre is fully embedded in a matrix as would be the case in the real composite. In general, the SFFT involves tensile testing of a dog-bone specimen with a single full-length axial fibre embedded along the central longitudinal axis. A matrix material with strain-to-failure of three to four times that of the fibre is generally chosen to ensure fibre breaks occur instead of matrix failure. Carbon and glass fibres are brittle materials containing some stochastic distribution of flaws along their length. When the shear stresses exerted on the fibre by the matrix have built up enough axial stress in the fibre, the fibre will fracture at a flaw location where the stress is sufficient to break the fibre. This process then repeats as the applied global load is increased and local axial stresses at other locations become sufficient to cause further breaks, resulting in the fibre breaking into smaller and smaller fragments. The fibre is said to be stress-saturated when the fragments become so short that shear transfer along their lengths becomes insufficient to generate enough axial stress to cause further breaks even with increased load. At saturation, the number of breaks and fragment lengths are recorded at the final applied strain. The longest fragment length which cannot incur further breaks is called the critical fibre fragment length lc. An important disadvantage of the method is the fact that the IFFSh cannot be measured directly from the SFFT and has to be back-calculated. Usually, this involves using parameters determined from the SFFT in combination with one of the theoretical models describing the fibre-matrix interaction. Generally, the parameters required are an approximation of the critical fibre fragment length lc and the strength of the fibre σ f {lc} at the critical fibre fragment length (stochastic fibre strength is length dependent) – both can be determined from the SFFT. Typical examples of theoretical models that have been used include the models introduced by Kelly and Tyson, 14 Cox, 15 Nairn, 16 Wu et al.17–19 and Okabe and Takeda. 20 However, this means that the calculation of the IFFSh is tied to the idealisations and assumptions implicit in the theoretical models. The problem is that any effective model has to capture a wide range of behaviours including correct interface properties, fibre strength distribution, fibre-matrix debonding, matrix plasticity and matrix damage (i.e., matrix cracking). The theoretical models often focus on specific aspects, but a theoretical treatment becomes extremely complex if all these factors are to be included. Advances in computational capability in recent years make the finite element (FE) method ideal for constructing more comprehensive models of the SFFT that could potentially be used to back-calculate IFFSh more accurately from SFFT data.
A number of interesting contributions have been made to the FE modelling of the SFFT. Budiman et al. 21 developed an axisymmetric elastic model using a non-rigid cohesive surface to define the traction-separation behaviour of the fibre-matrix interface. By incorporating a single pre-existing fibre break, they demonstrated how a critical length taken from the contour plot of principal stress difference could be used (via the appropriate formula) to calculate fibre-matrix interface strength from just a single break. However, more work is required to determine the accuracy of this new method in comparison to the conventional SFFT. Wang et al. 22 developed a fully elastic model to handle the repeating fibre break process in ABAQUS using the user subroutine USDFELD. In Wang el al., 23 the authors added cohesive zone elements to model the traction separation behaviour of the interface and a matrix damage criterion to simulate matrix cracking in an elastic matrix. These contributions, however, did not incorporate the stochastic distribution of fibre strengths along the fibre as is evident from each new break occurring at the centre of fibre fragments (which is contrary to the random break locations that occur experimentally). FE models that have included the key stochastic (Weibull) distribution of fibre strengths along the length of the embedded fibre include van der Meer et al. 24 and Nishikawa et al. 25 and these models also included matrix plasticity. However, the modelling results in 24 and 25 (and those in22,23) were not compared to equivalent SFFT experiments to determine how well the models capture certain key behaviour such as evolution of the distribution of fibre break locations and distribution of fragment lengths during the test (Budiman et al. 21 were concerned only with the first break so did not use their model to study break evolution). In fact, there has been some disagreement concerning the fragment length distributions that have been observed at saturation. Drzal et al. 26 studied an epoxy/carbon fibre system and found good agreement with a Weibull distribution; Netravali et al. 27 found good agreement with a lognormal distribution (also epoxy/carbon); and Bascon and Jensen 28 noted correspondence with a Gaussian distribution for their epoxy/carbon system. Recently, Kim et al. 10 and McCarthy et al. 11 reported on a very high level of agreement (Probability plot correlation coefficient (ppcc) ≥ 0.99) of break location data with a uniform distribution for their glass fibre/epoxy SFFT system. They noted that a Uniform distribution of break locations leads to an explicit equation for the ordered fragment length distribution due to Whitworth. 29 Clearly there is wide variation in the fragment length data observed and this may be due to obvious variation between materials (fibre & matrix), interface properties and test setups. However, it is important, therefore, that an effective FE model be able to predict the evolution of the distribution of break locations and fragment lengths.
In contrast to previous numerical models that are short and focus on microscopic damage with a constant fibre strength, the length of the present model is equivalent to experimental specimen gauge lengths 11 and the variation of the strength along the embedded single fibre is modelled following an appropriate statistical (Weibull) distribution with experimentally determined distribution parameters. This allows us to compare key model predictions to experimental data (such as distribution of break locations and stress distributions). In addition, the model is designed to mimic the experimental SFFT test setup in McCarthy et al. 11 as closely as possible (i.e., identical properties for the E-Glass fibres and epoxy matrix etc.). The comparison can reflect the degree to which FE modelling can capture the underlying physics in these single fibre fragmentation tests. In summary, the key difference between this work and previous FE modelling work is that the present paper compares the FE result directly with experimental data and is also the first FE paper to study the evolution of the distribution of fibre break locations (and fragment lengths) during the test.
Numerical simulation
Finite element model
The purpose of the FE model here is to compare FE results with the single fibre fragmentation experiments in McCarthy et al.
11
In McCarthy et al.,
11
the single fibre fragmentation tests were carried out on epoxy dog-bone specimens with E-glass fibres. Fibre break data were recorded optically in the central 16 mm of the gauge length. Here an axisymmetric FE model is used to simulate the 16 mm observation length. The model (developed in ABAQUS Implicit) is illustrated schematically in Figure 1. Boundary conditions (Figure 1(a)) were defined by fixing one end of the model (A) and allowing the fibre axisymmetric boundary to apply along the model length. Tensile elongation is applied to the matrix at the opposite end (B). A mesh dependency analysis was performed to ensure a fine mesh is selected and the mesh details are illustrated in Figure 1(b). The glass fibre mesh is composed of 2133 four-node bilinear (a) Finite element model schematic and (b) finite element mesh with local inset showing mesh detail.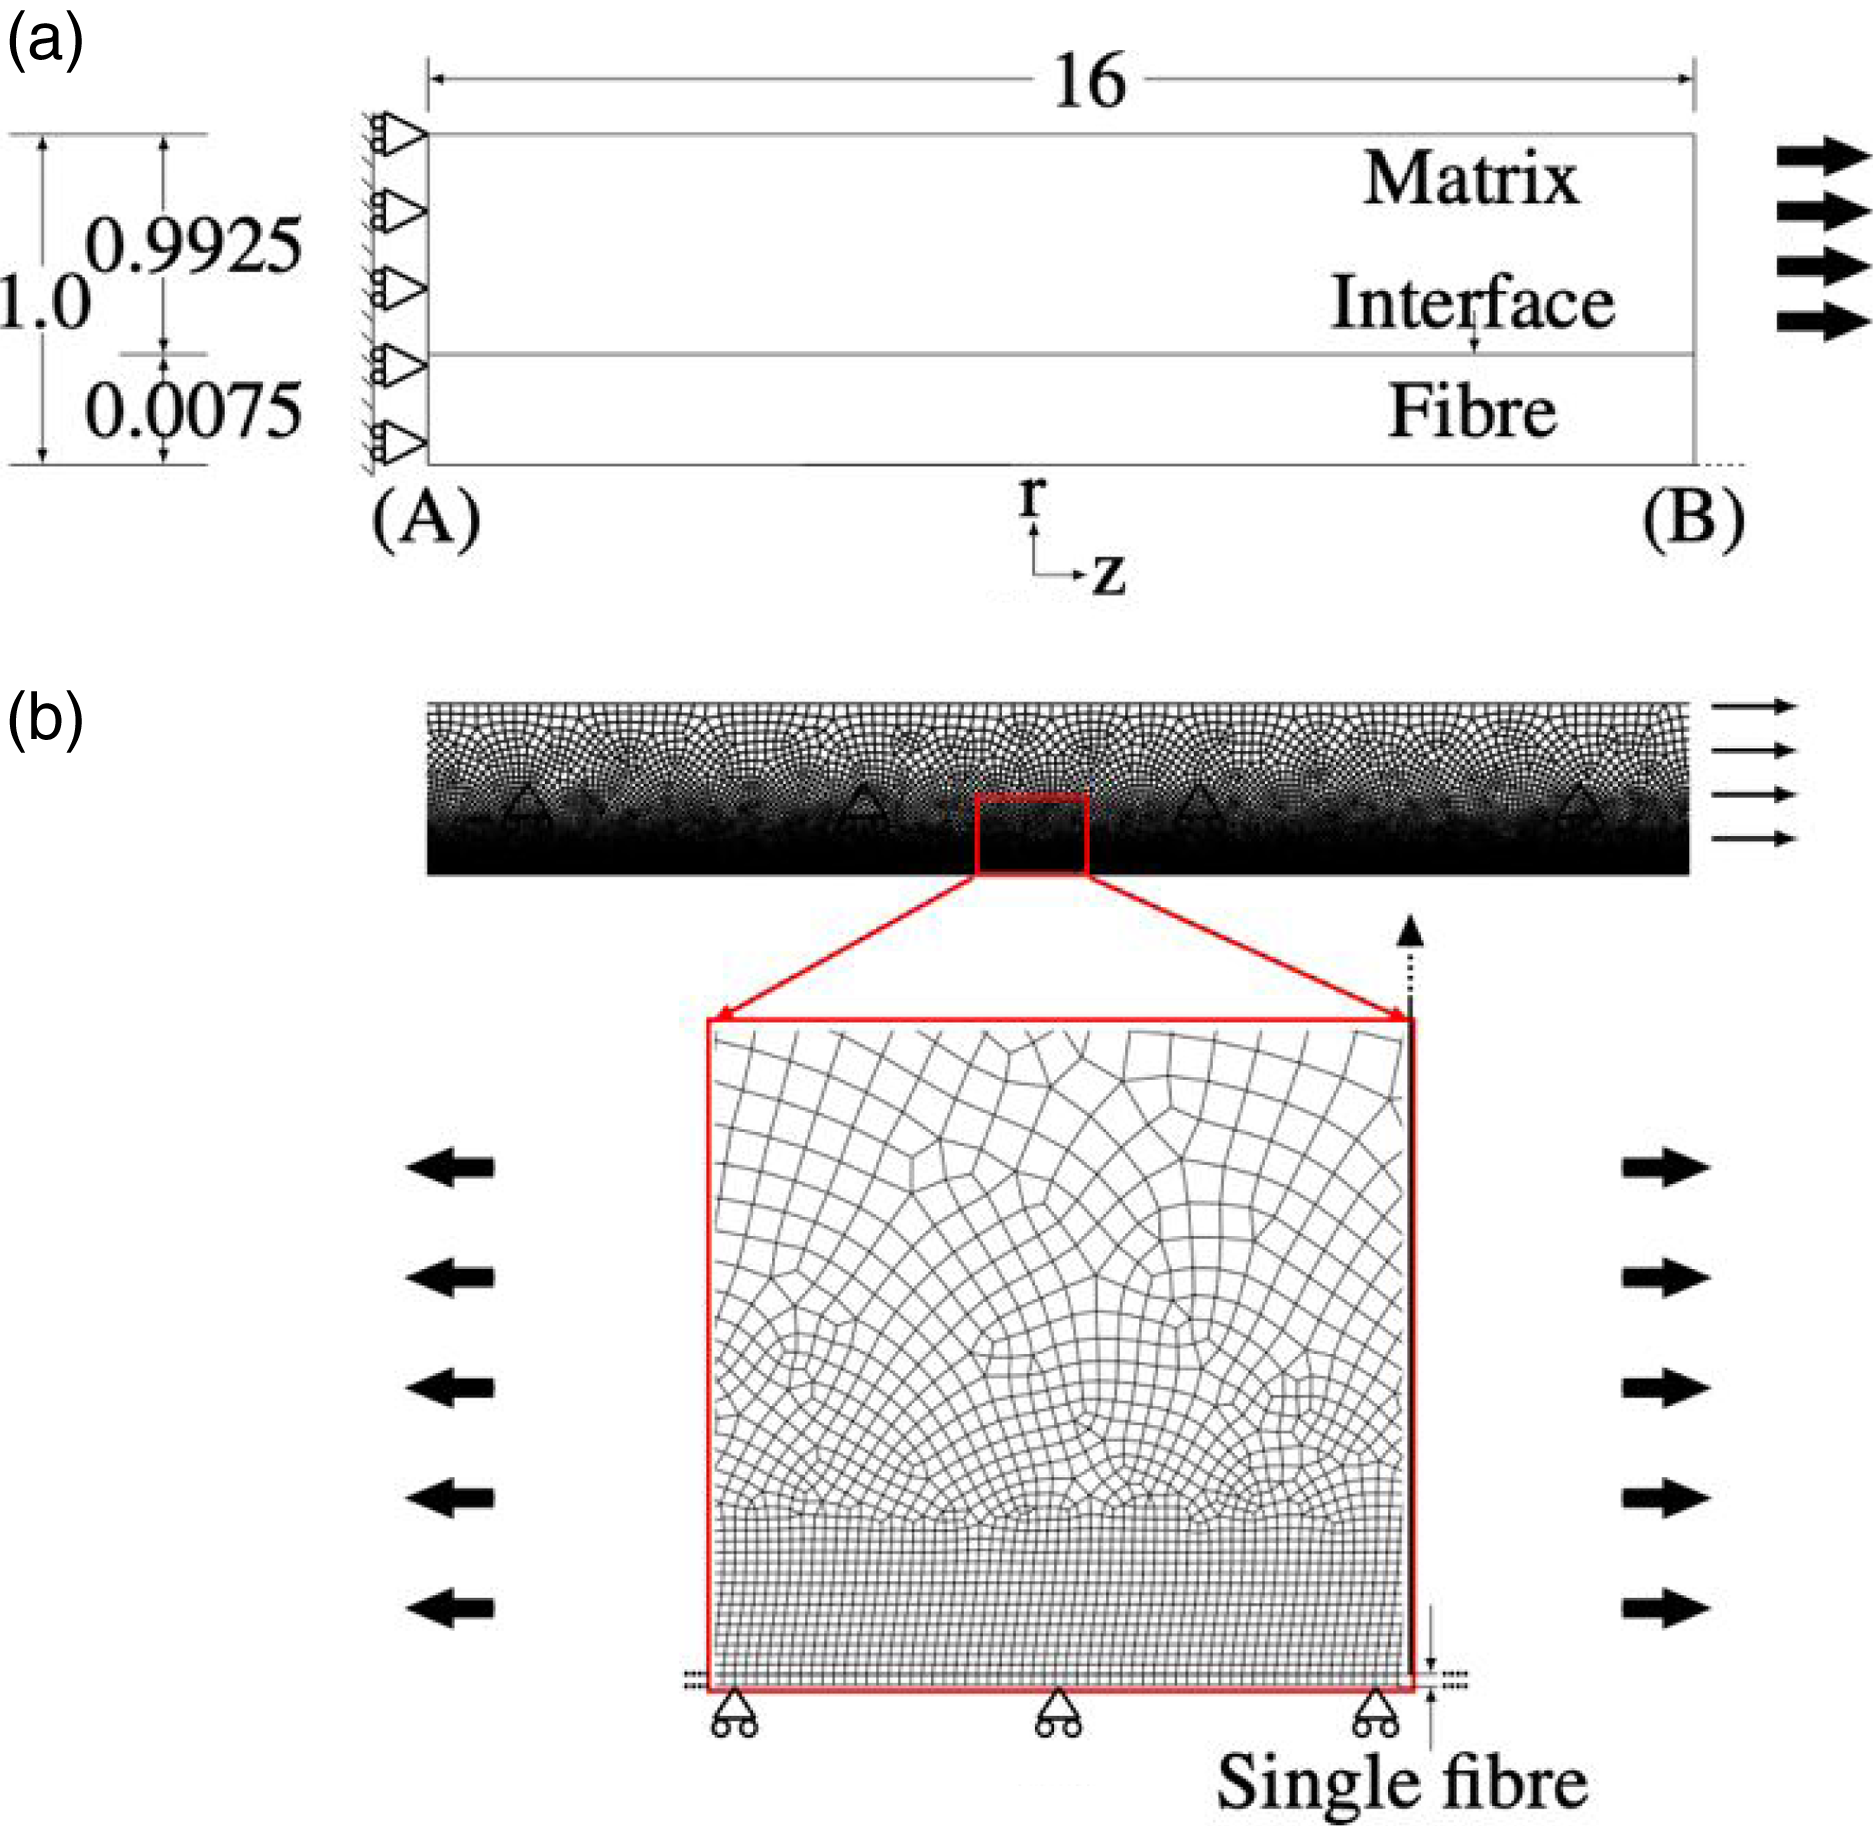
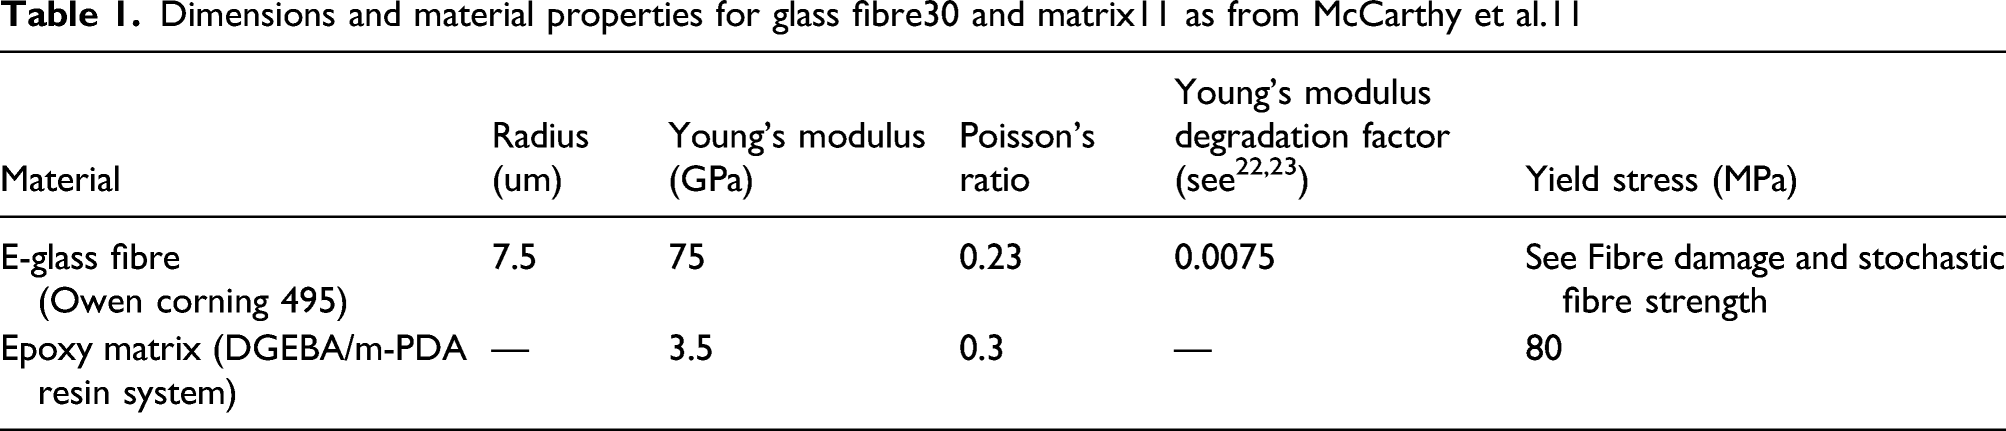
The fibre was assumed to be mechanically elastic until the onset of damage (see Fibre damage and stochastic fibre strength), and the matrix was assumed to be elastic-perfectly plastic. General properties of the fibre and matrix are chosen to be those of McCarthy et al., 11 and are outlined in Table 1. The properties of the matrix (a DGEBA/m-PDA resin system) are taken directly from, 11 while the general fibre properties are taken from the datasheet for Owens Corning 495 E-glass fibres 30 (as these are the fibres used in McCarthy et al. 11 ). For simplicity, viscoelastic effects were not incorporated, and the model was run quasi-statically. Strain was increased by applying 0.75 mm extension increments to the 16 mm gauge length up to 5% strain (which was sufficient to reach saturation of fibre breaks).
Fibre damage and stochastic fibre strength
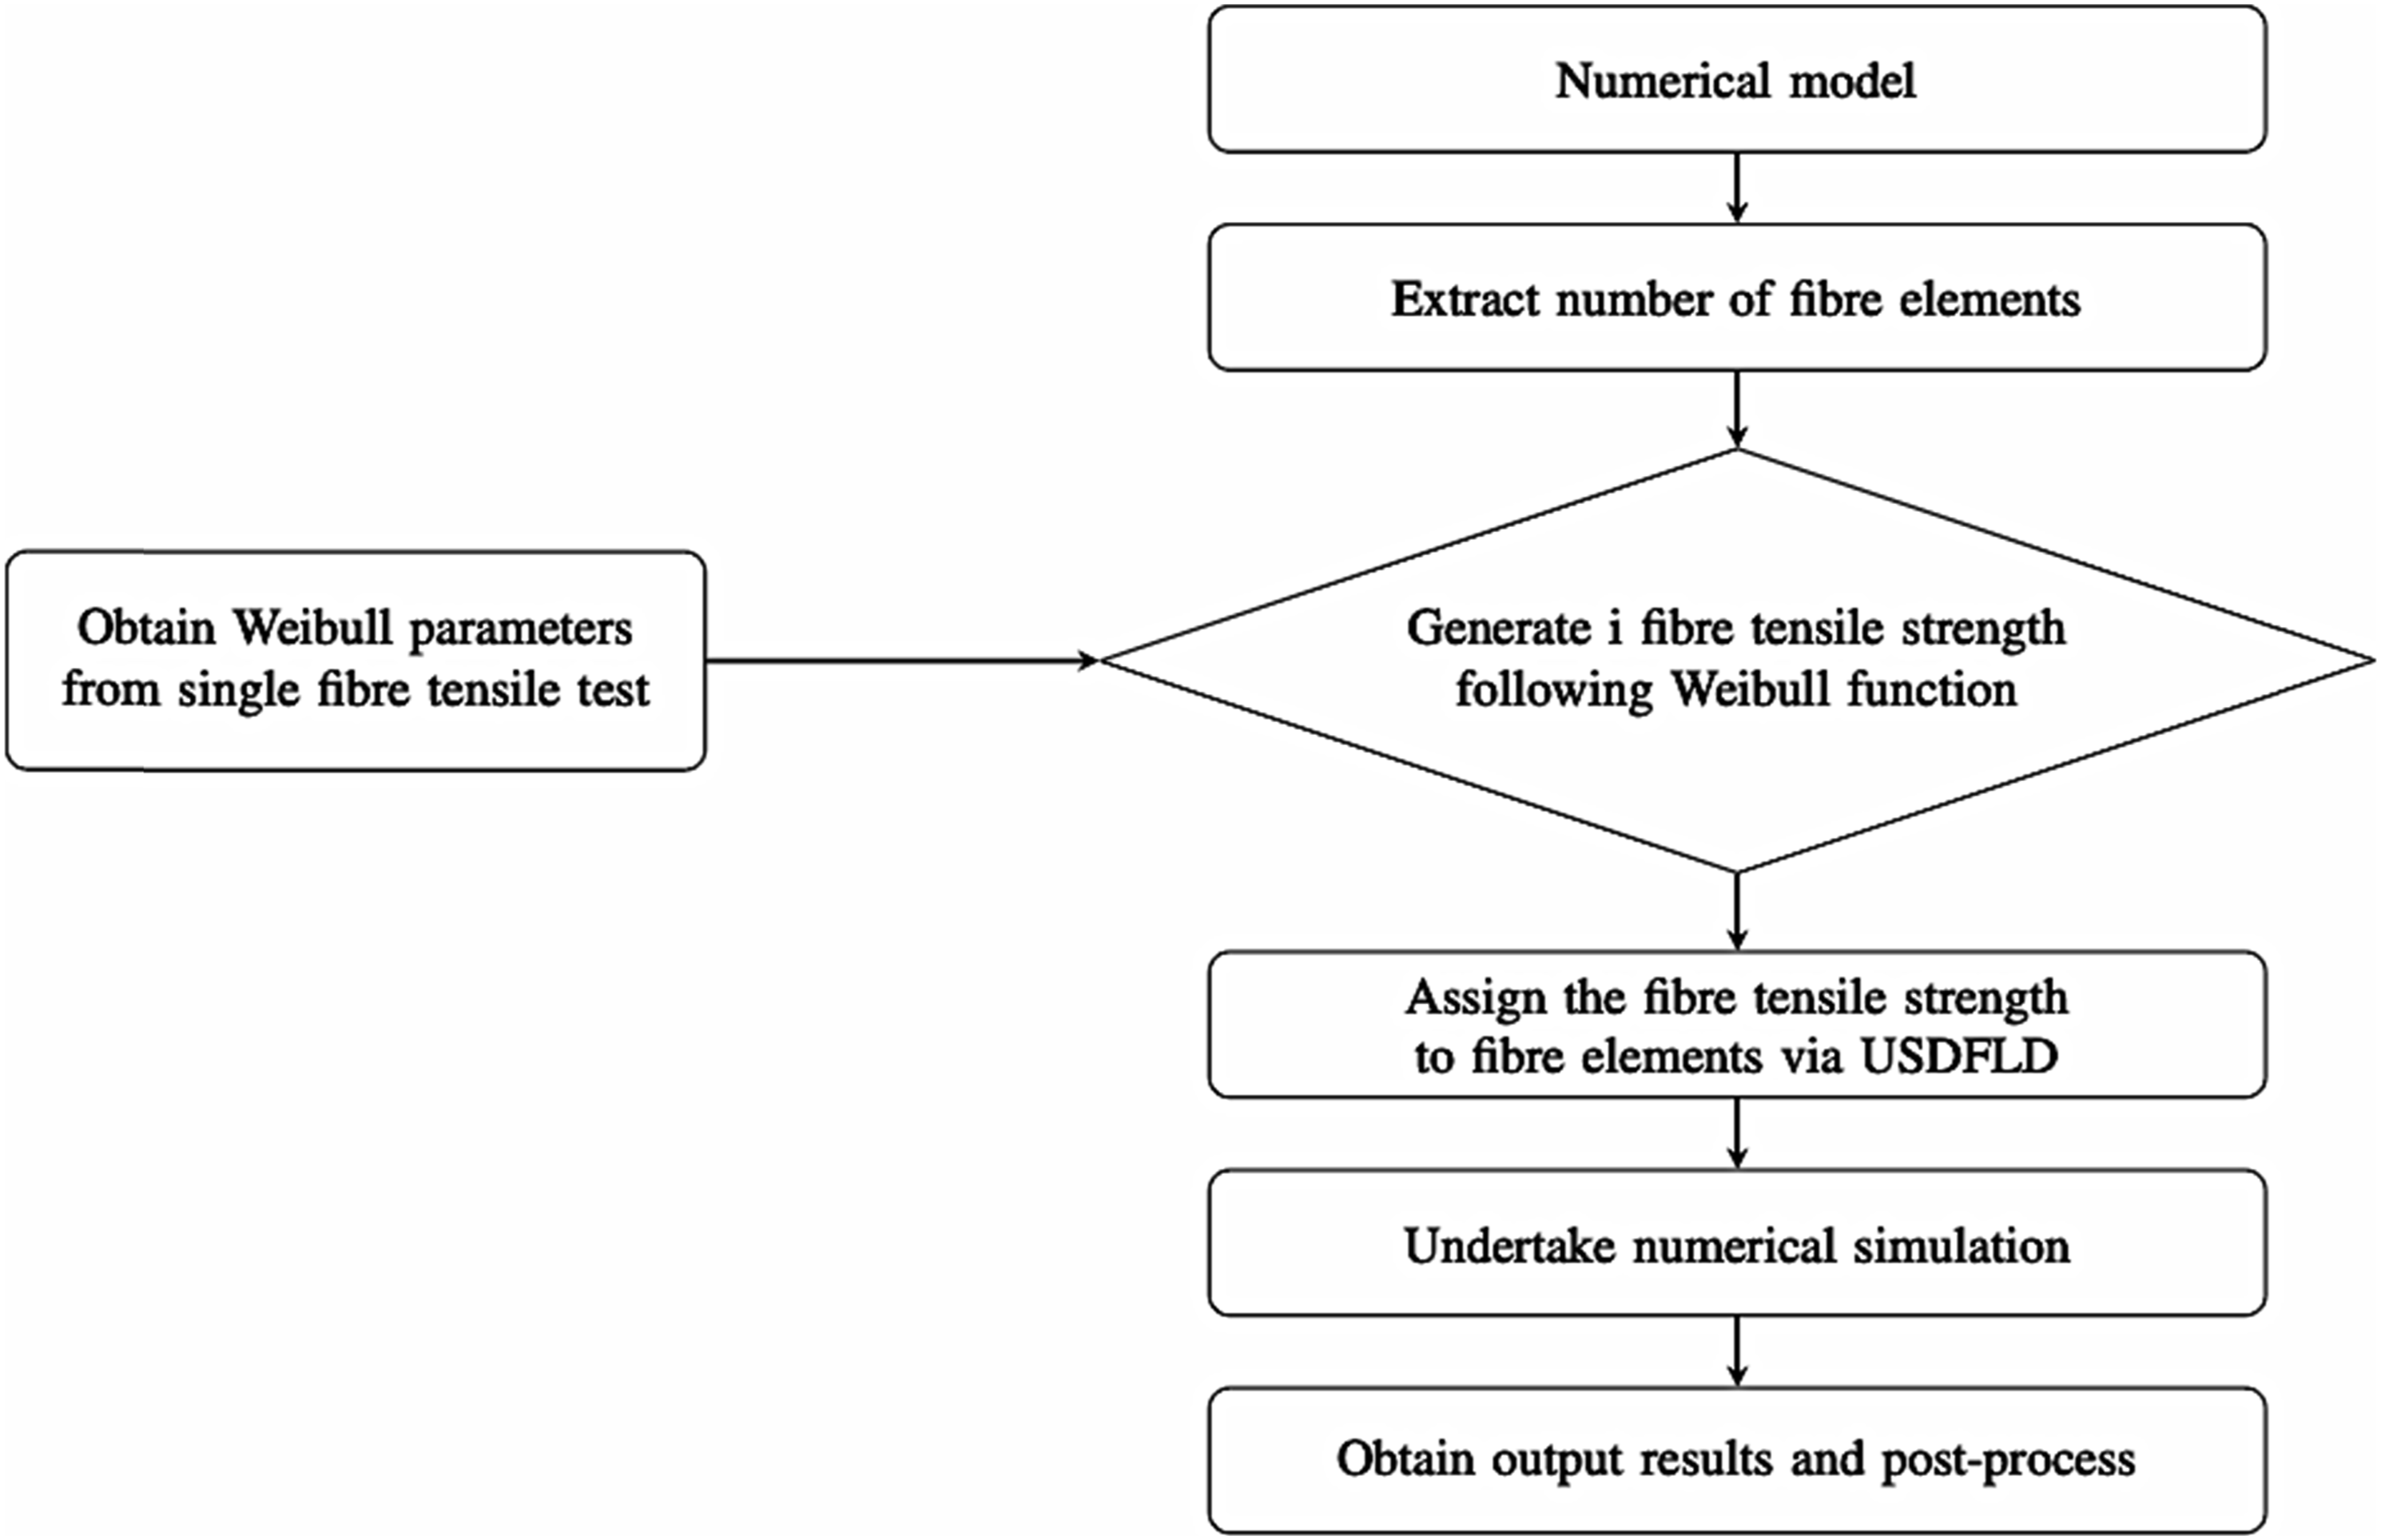
In the case of the SFFT, the fibre has lower strain-to-failure (than the matrix) and carries most of the applied load, so it is the fibres that begin to fail first. A fibre break happens when the local stress in the fibre exceeds the local strength: Flowchart for simulating fibre damage process with subroutines USDFLD and GETVRM.
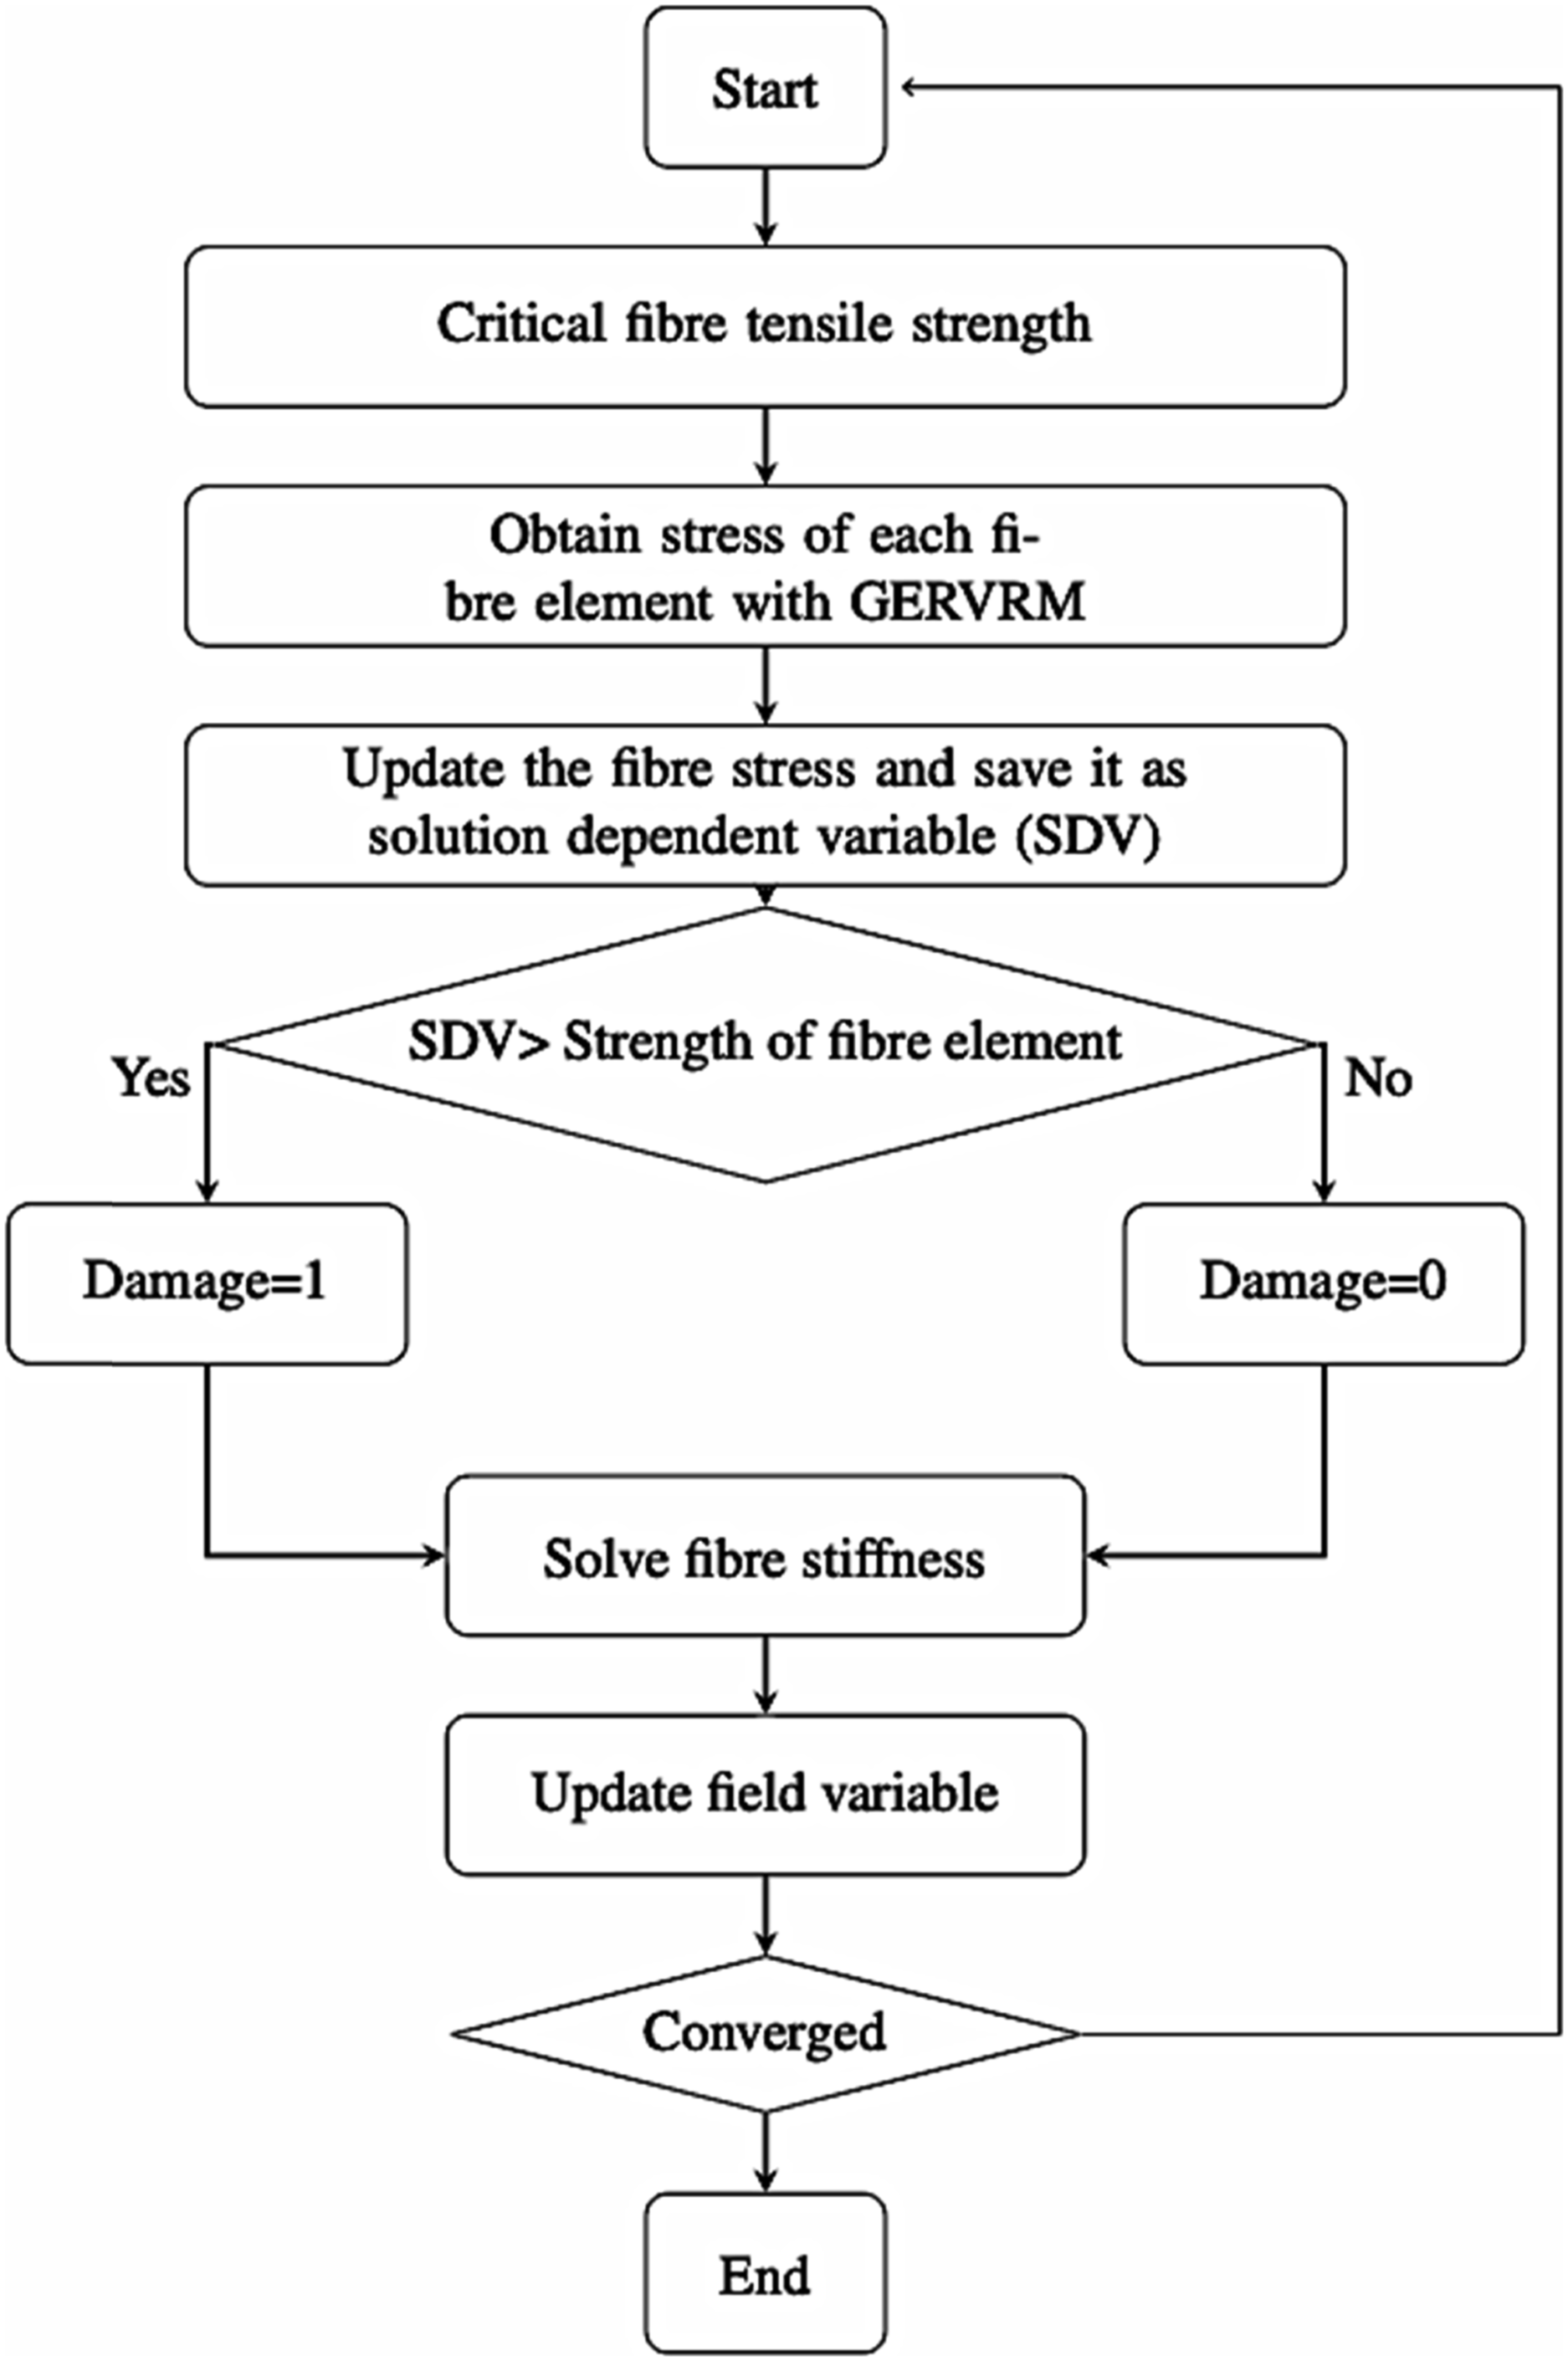
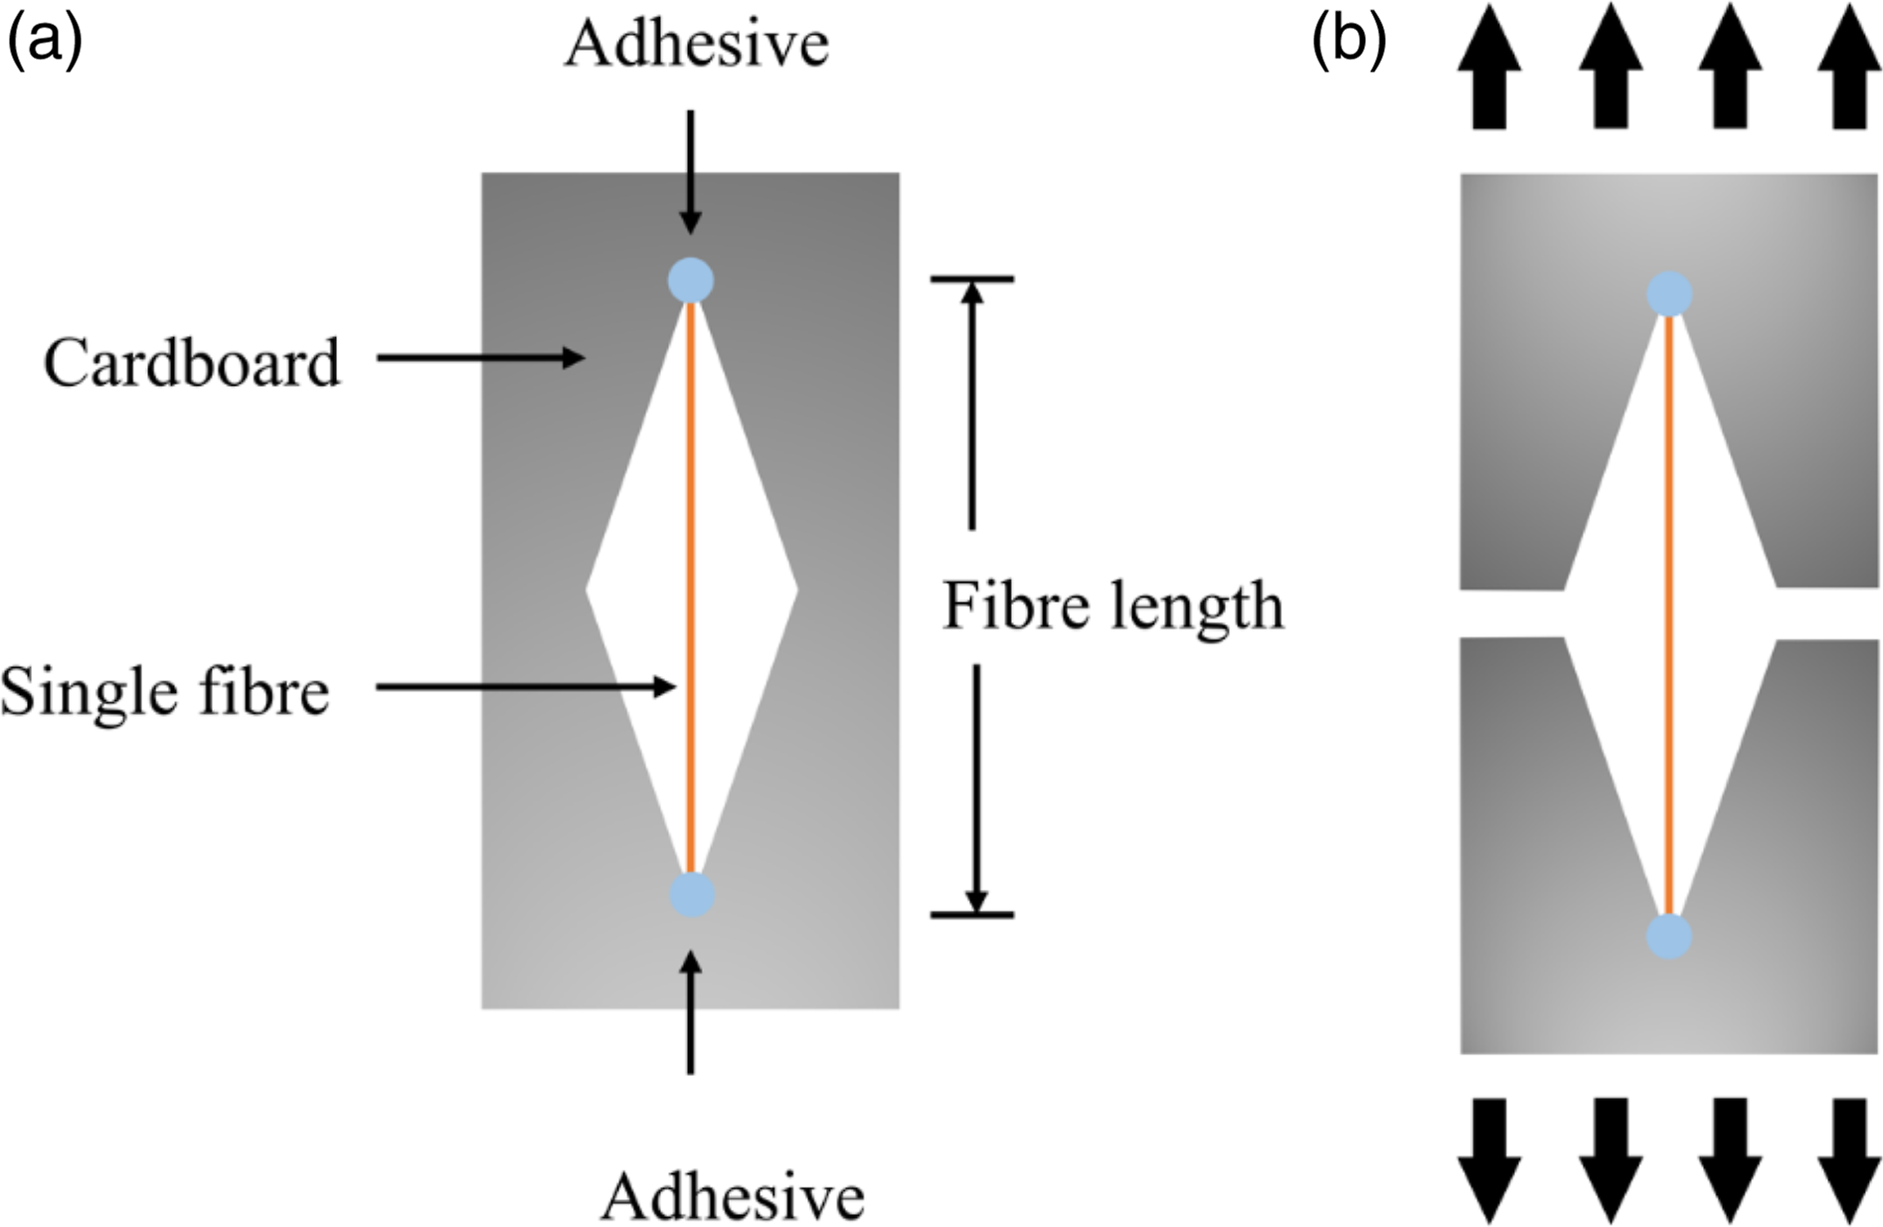
To implement a Weibull based fibre tensile strength distribution, each fibre element was assigned a tensile strength extrapolated from the Weibull function: Single fibre test: (a) fibre placement and (b) fibre tensile testing.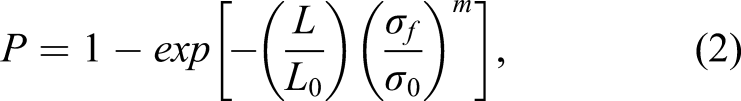
For a constant gauge length test such as this, equation (2) can be rearranged as:
The test was conducted N = 30 times and failure strengths were calculated and sorted in ascending order with a unique rank value j. The cumulative probability is then calculated as
37
:
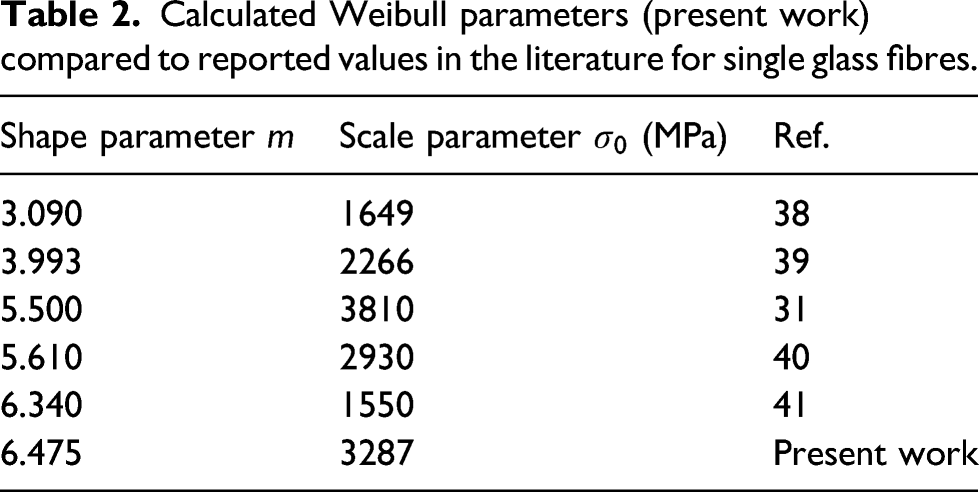
Fitting a straight line to the plot of Weibull fitting plot of Calculated Weibull parameters (present work) compared to reported values in the literature for single glass fibres. Flowchart for assigning glass fibre strengths to individual fibre elements in the FE model.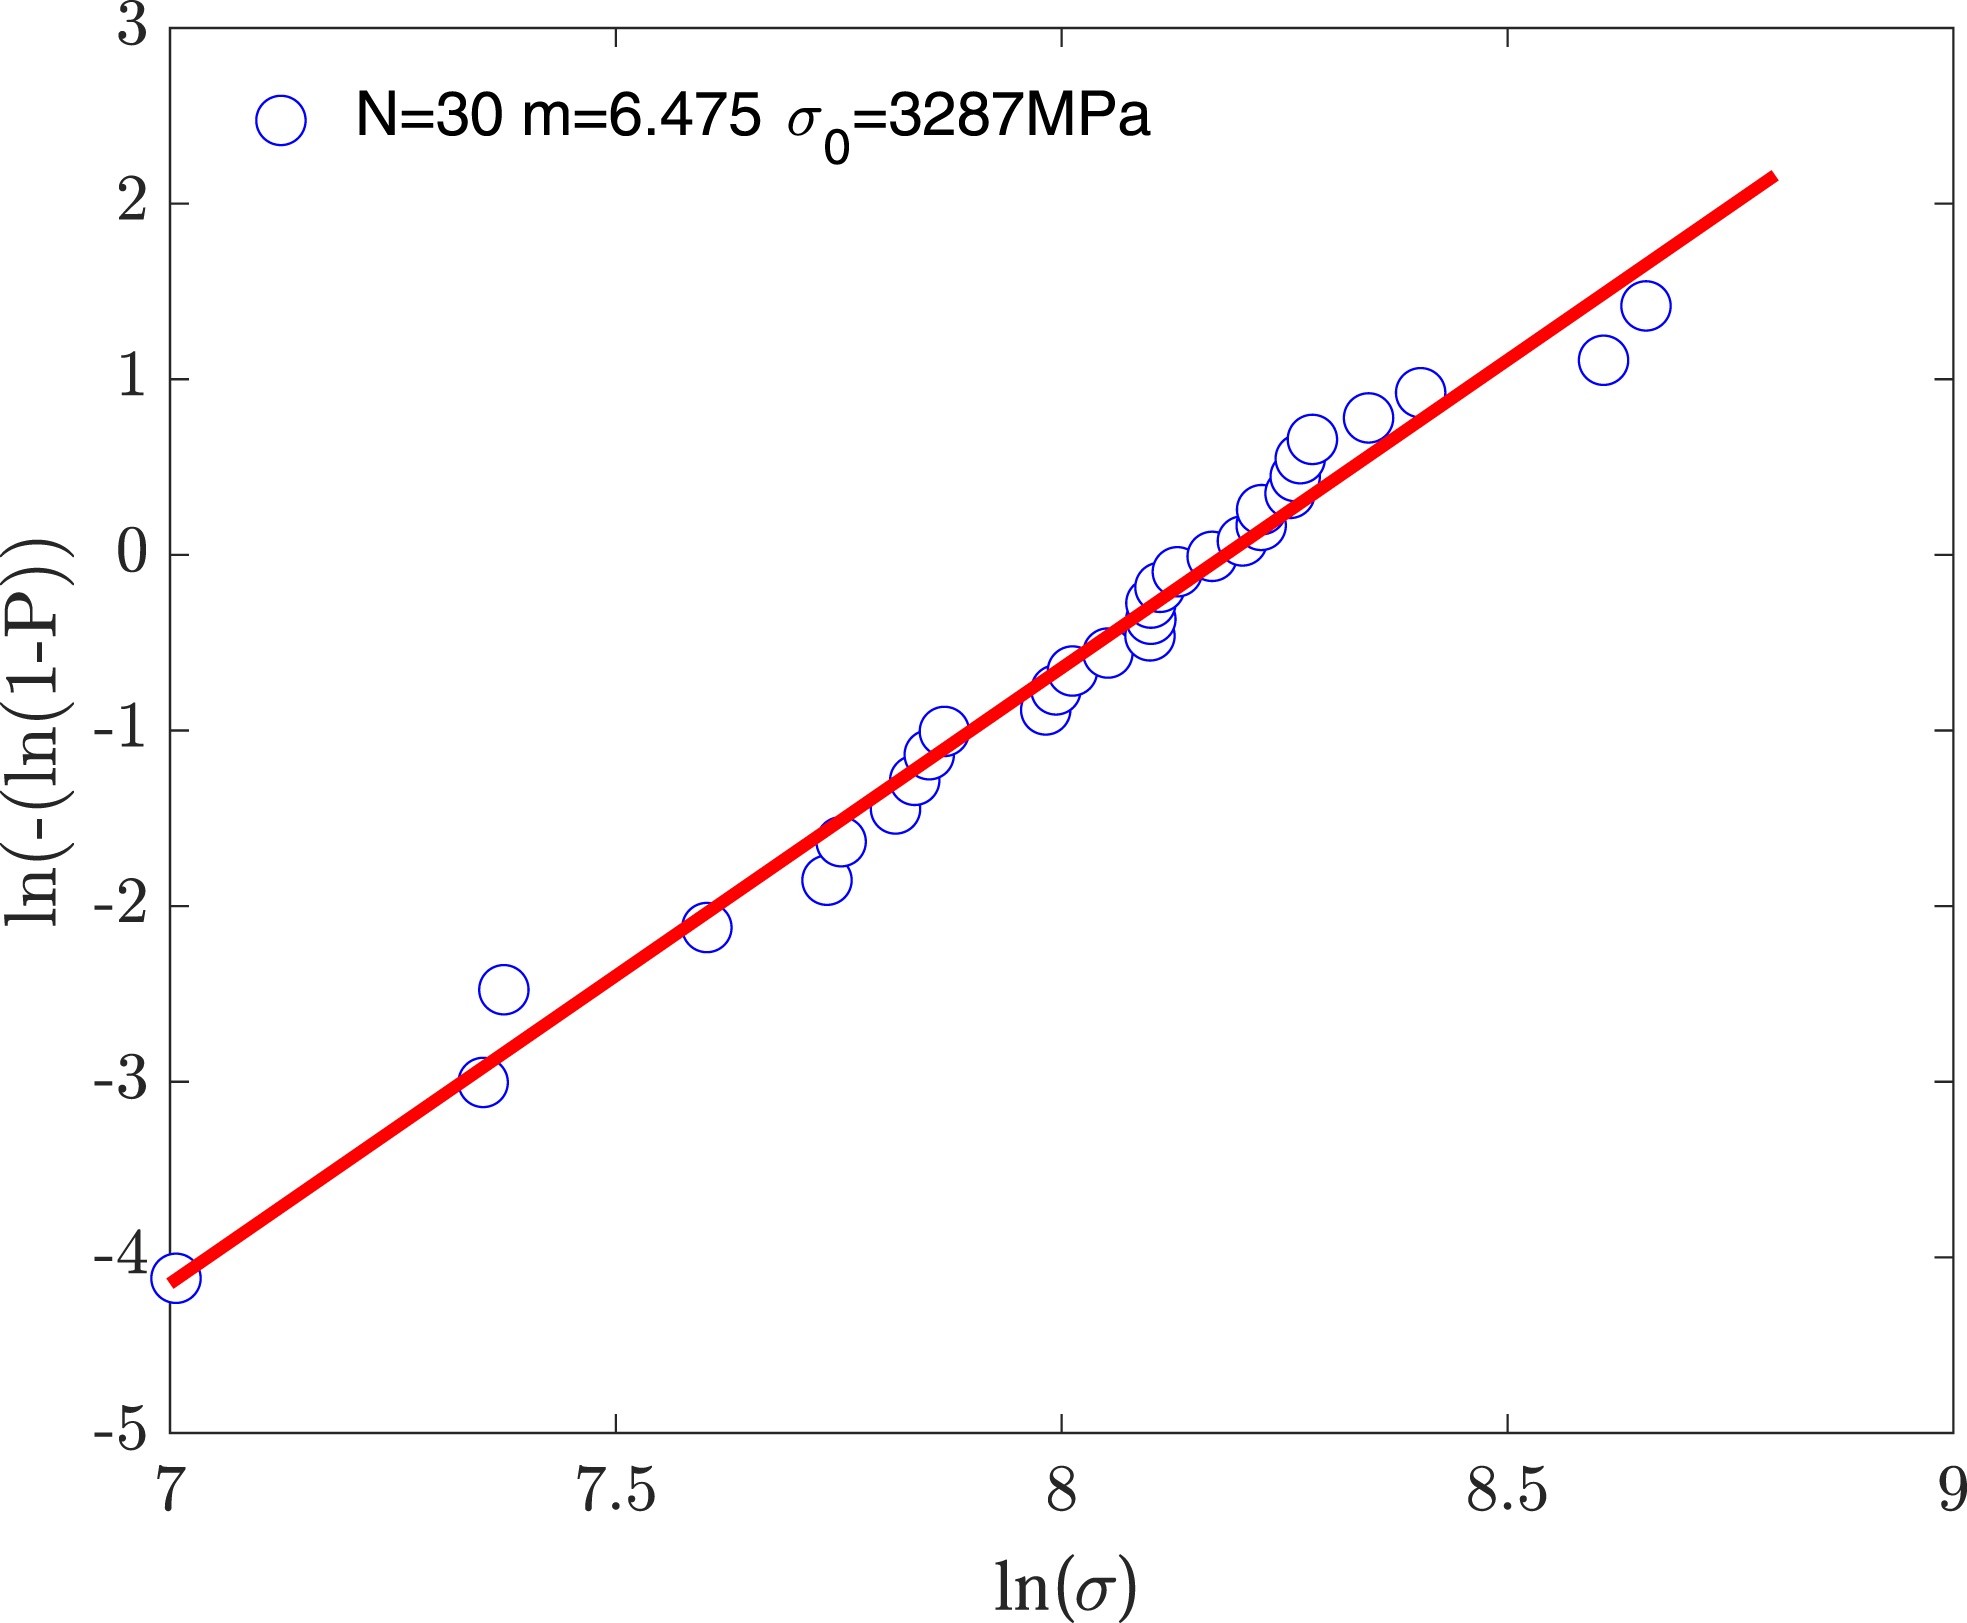
Interface behaviour
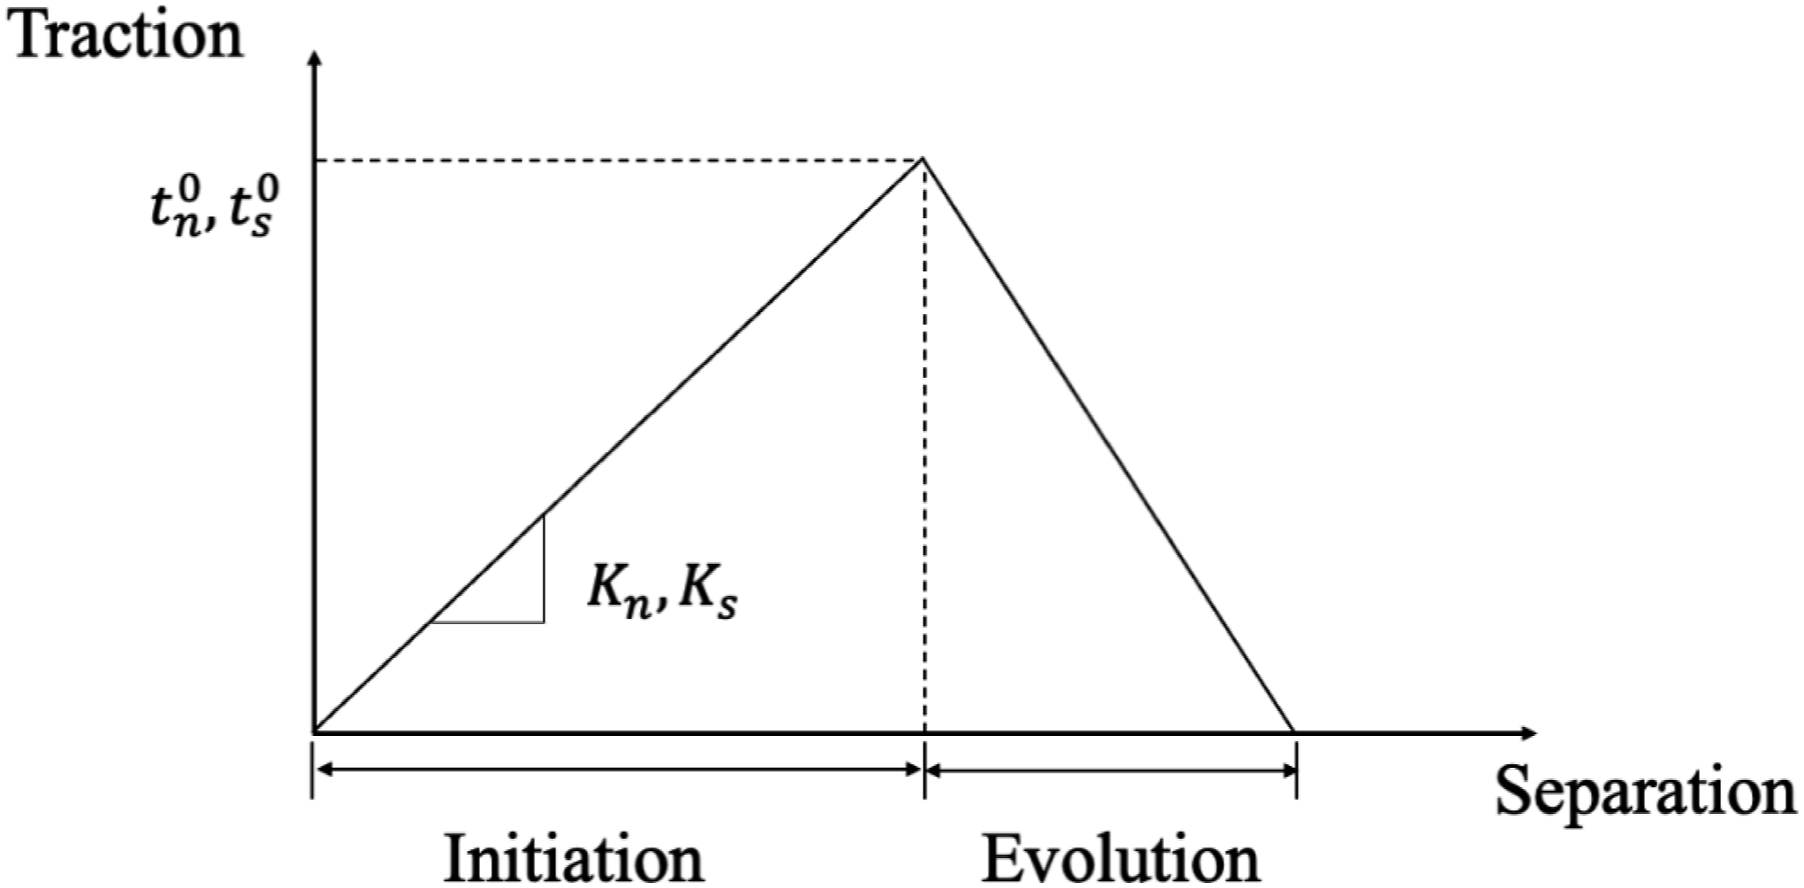
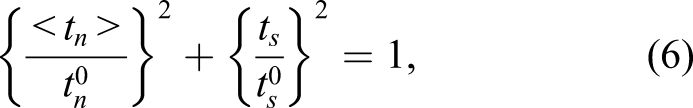
The interface between a fibre and its surrounding matrix is a flexible (i.e., non-rigid) interface that enables stress transfer from the matrix to the fibre. The interface can transfer increasing amounts of shear stress (as determined by the applied loading) until it reaches a strength limit, which we refer to as the interfacial shear strength (IFSSh). Thus, the interface behaviour can be approximated by a traction-separation law of the type outlined in Camanho et al.
44
Normal and tangential stress at the interface can be defined as being linearly related to interface displacement as: Interfacial traction–separation response for the fibre-matrix interface (t0 is max traction – i.e., strength).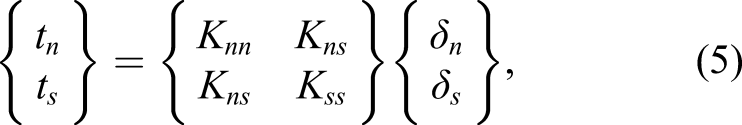
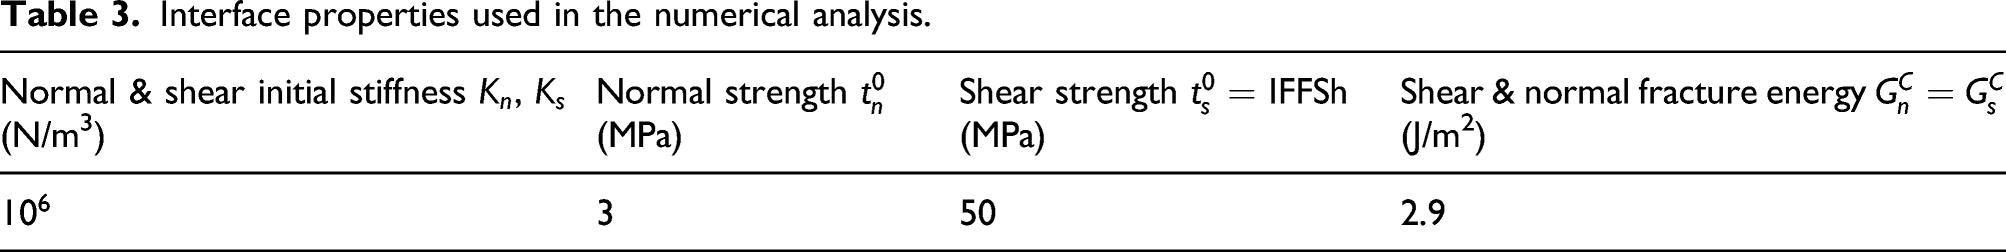
Interface properties used in the numerical analysis.
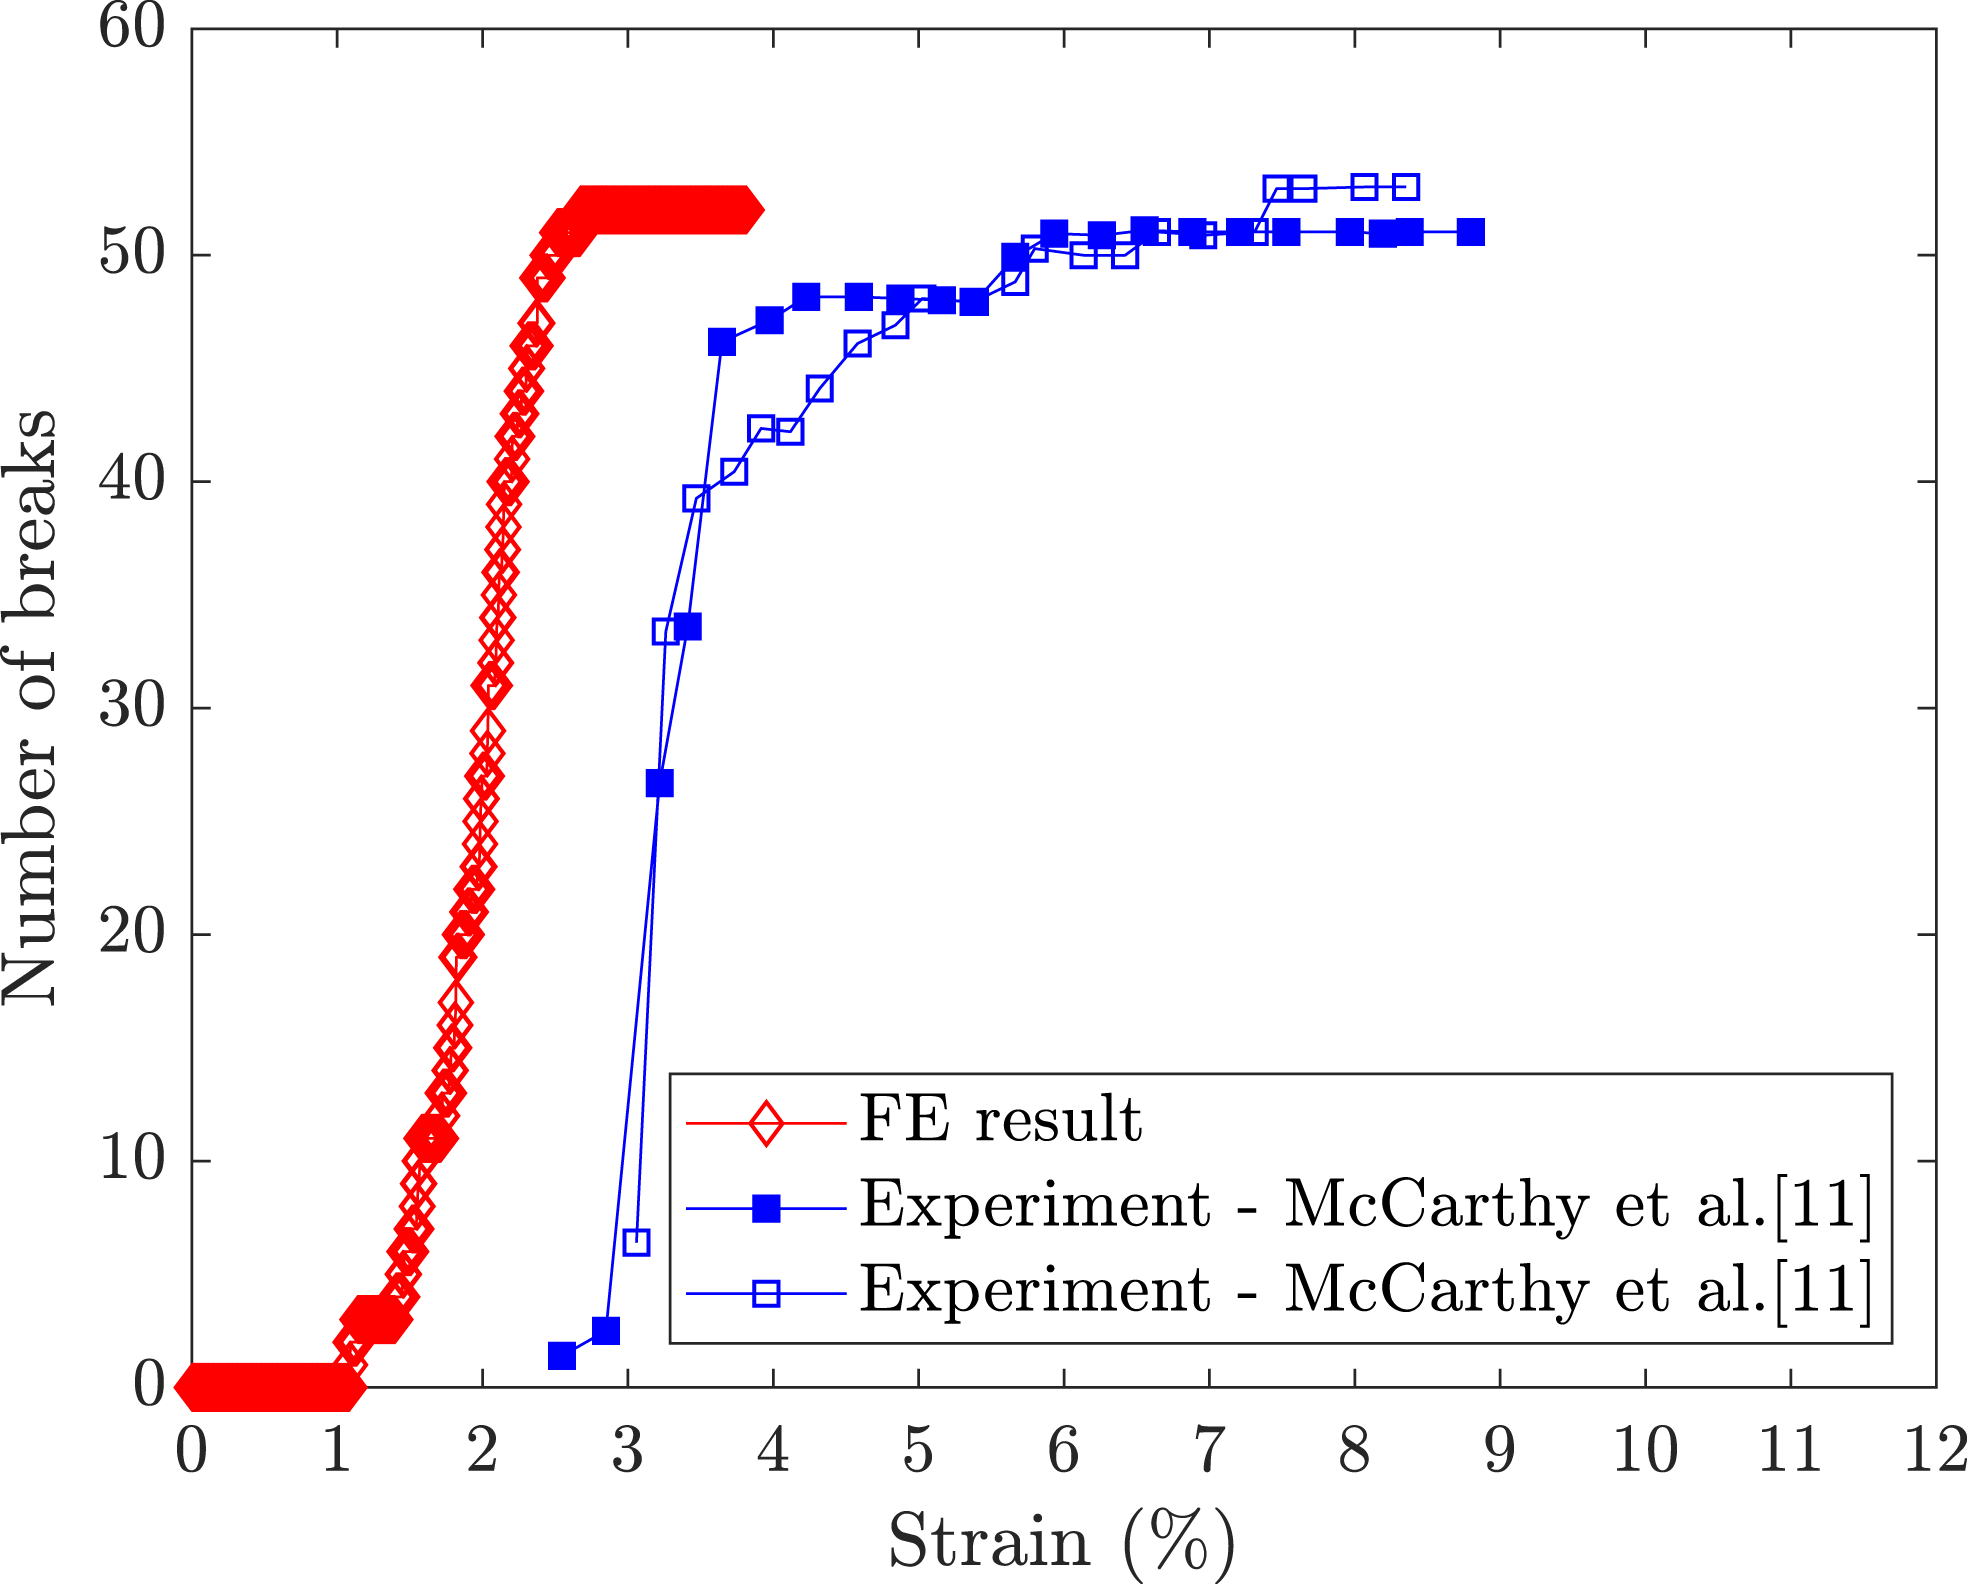
Comparison of number of fibre breaks versus applied strain for the FE model and the experiments of McCarthy et al.11.
Results and discussion
Evolution of fibre breaks and stress distributions
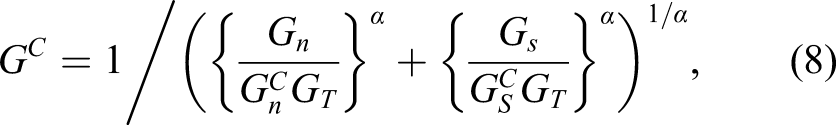
In the FE model, strain was increased incrementally and the fibre break coordinates were recorded. Figure 7 compares the evolution of the number of fibre breaks with applied strain for the FE model devised here with two data sets from the experiments in McCarthy et al. 11 As noted in Interface behaviour, the critical fracture energy of the interface in the FE model was tuned until the number of breaks at saturation was nearly equivalent to the experiments (52 breaks in the FE model and 51 and 53 breaks for the two experimental results). With this equivalence established, we are now able to use the FE model to study a number of aspects of the problem. We note from Figure 7 that the FE break distribution has a similar profile to the experimental profiles, although the strains at which breaks occur are somewhat lower in the FE model. This may be due to the assignment of some weaker fibre strengths in the model (Weibull strength data for the model is derived from several repeat single fibre tests, but the two experimental SFFT results in Figure 7, obviously come from a test on a single embedded fibre). It may also be that the interfacial shear strength in the FE model (50 MPa chosen from glass-fibre/epoxy literature39,46,47) was somewhat higher than that in the experiments of McCarthy et al. 11
To explore the possibility of closing the strain gap between model and experiment further, we carried out a simple parametric study to examine the effect of fibre-matrix interface properties on the resultant fibre break evolution. The influence of interfacial normal strength, interfacial shear strength and critical fracture energy were investigated by varying each one over three alternative values while holding the other two constant (at the default values used in the paper: Parametric study indicating the effect of interface failure upon the fibre break evolution during the test (i.e., on number of breaks versus strain): (a) influence of normal strength 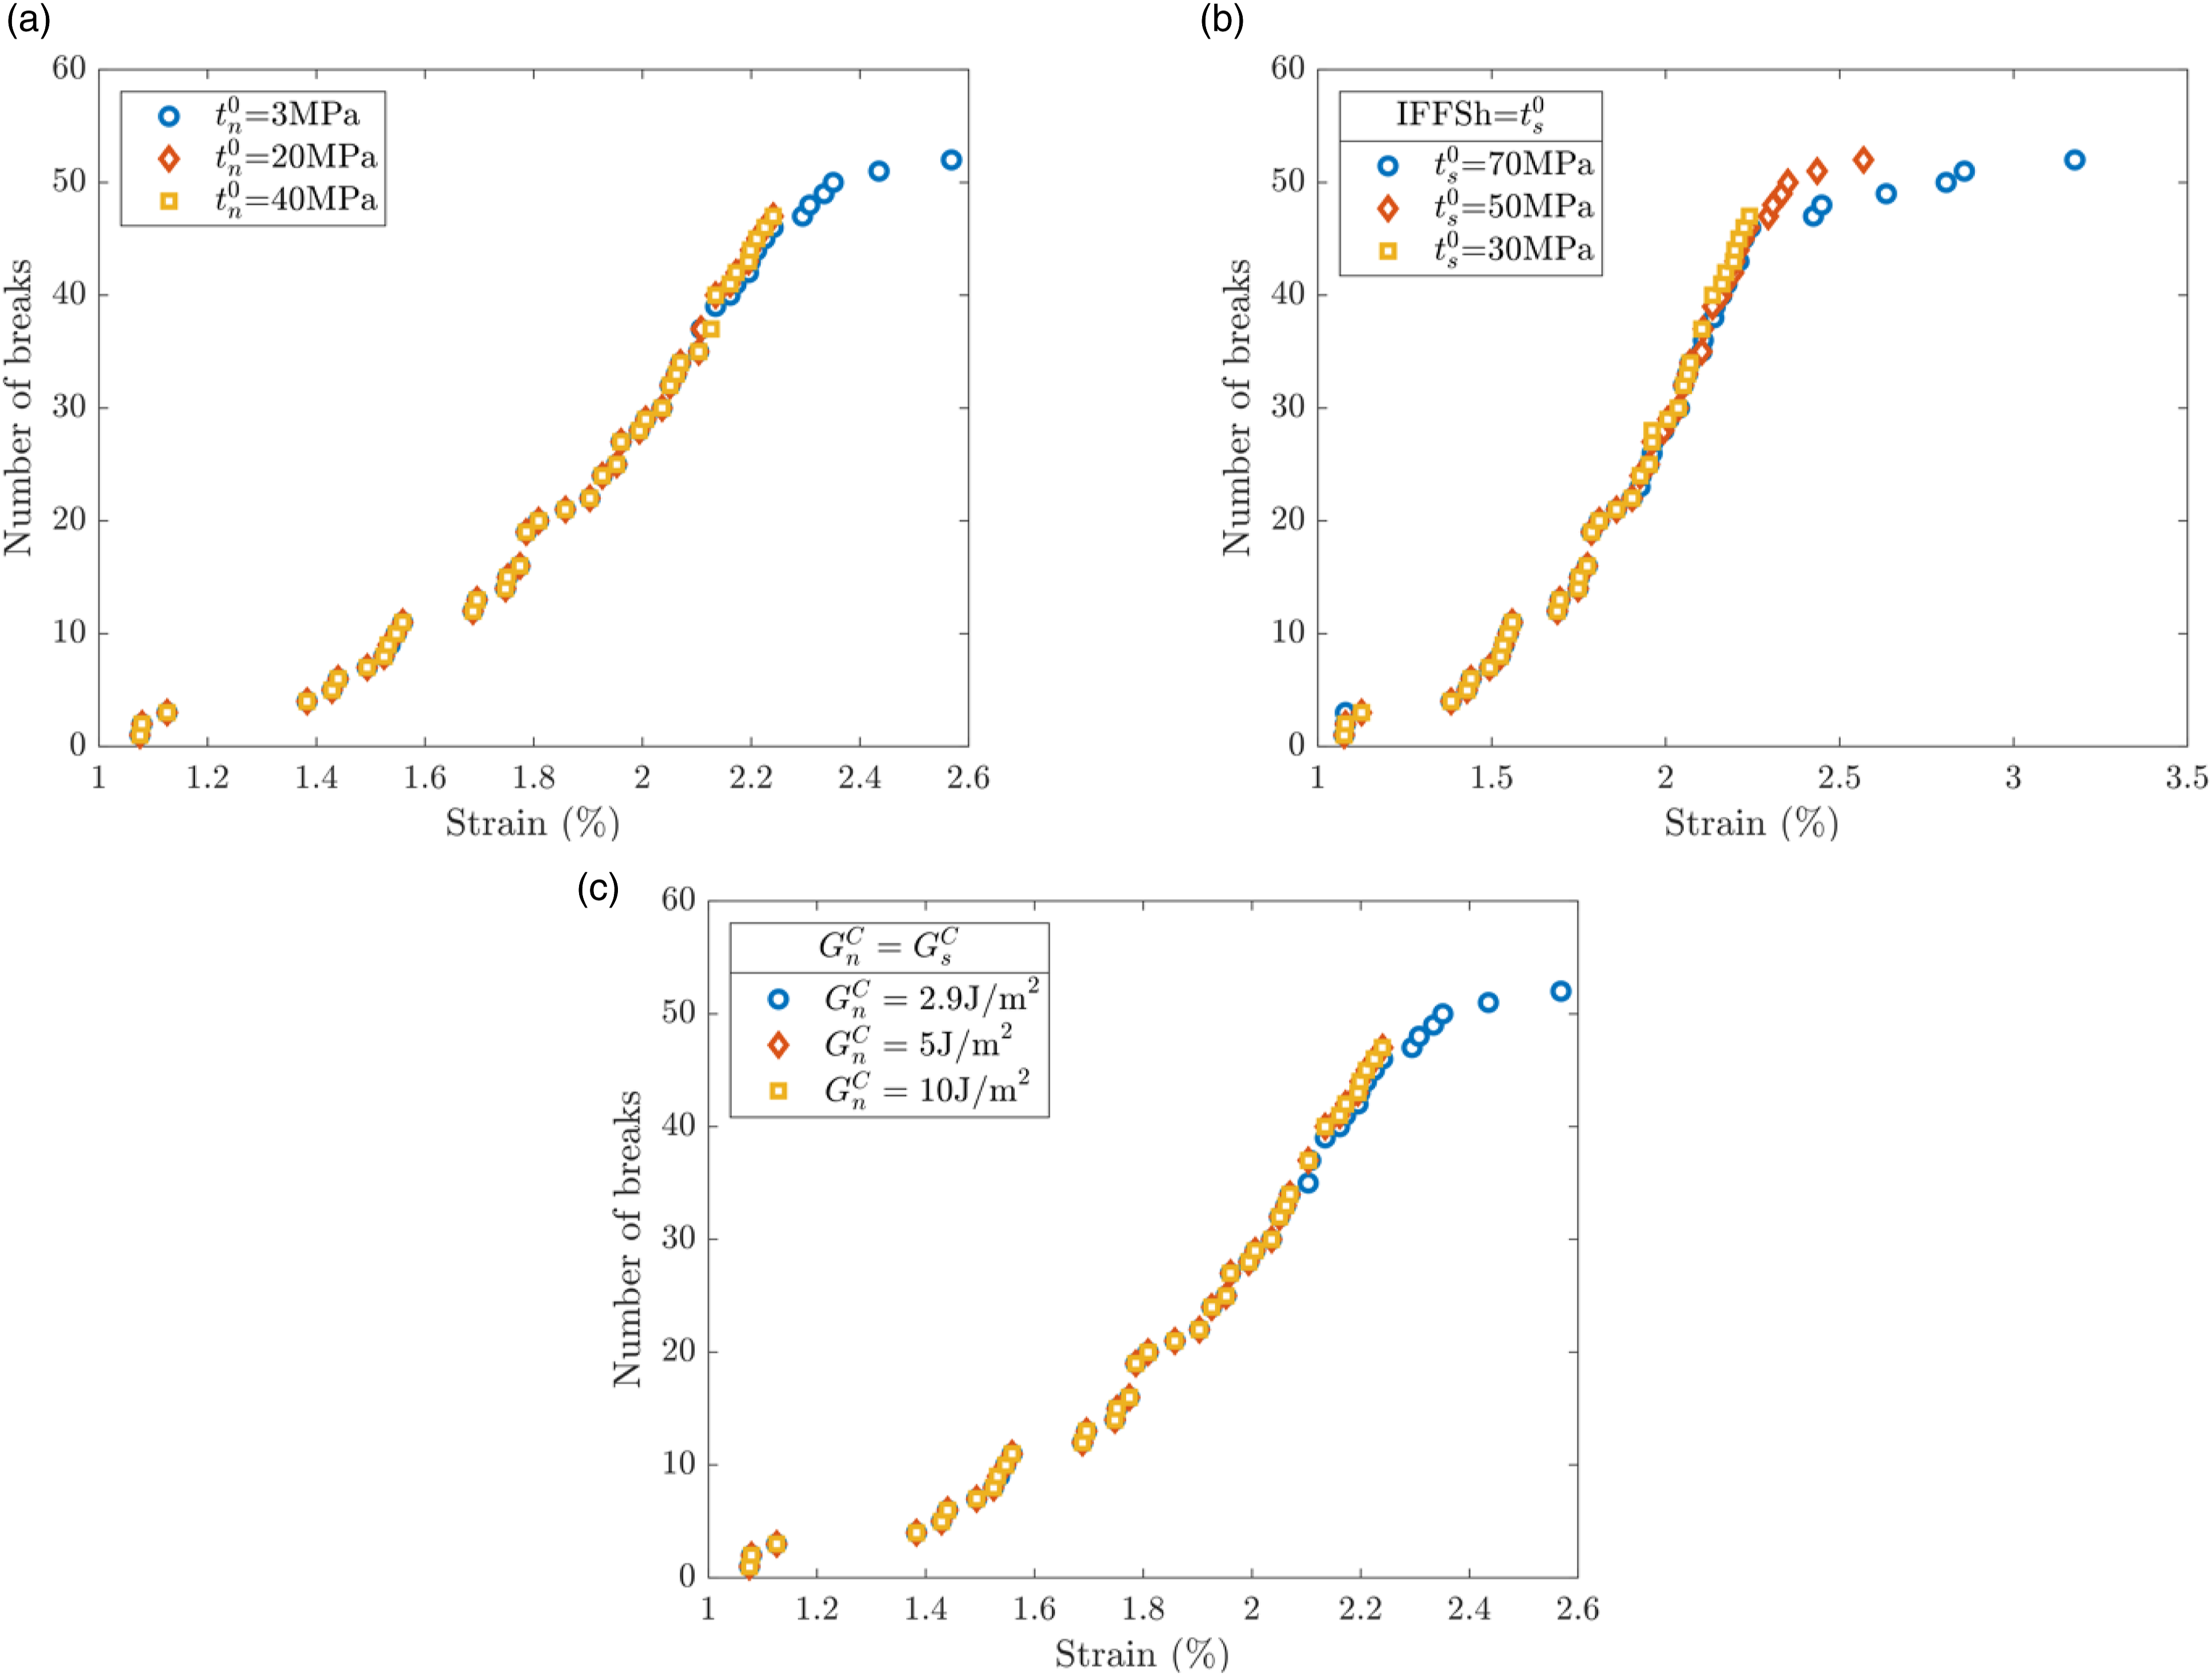
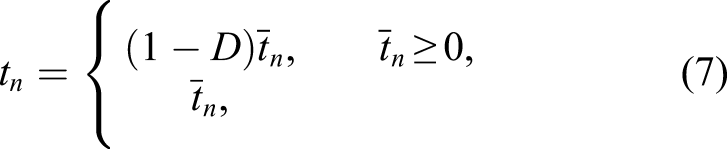
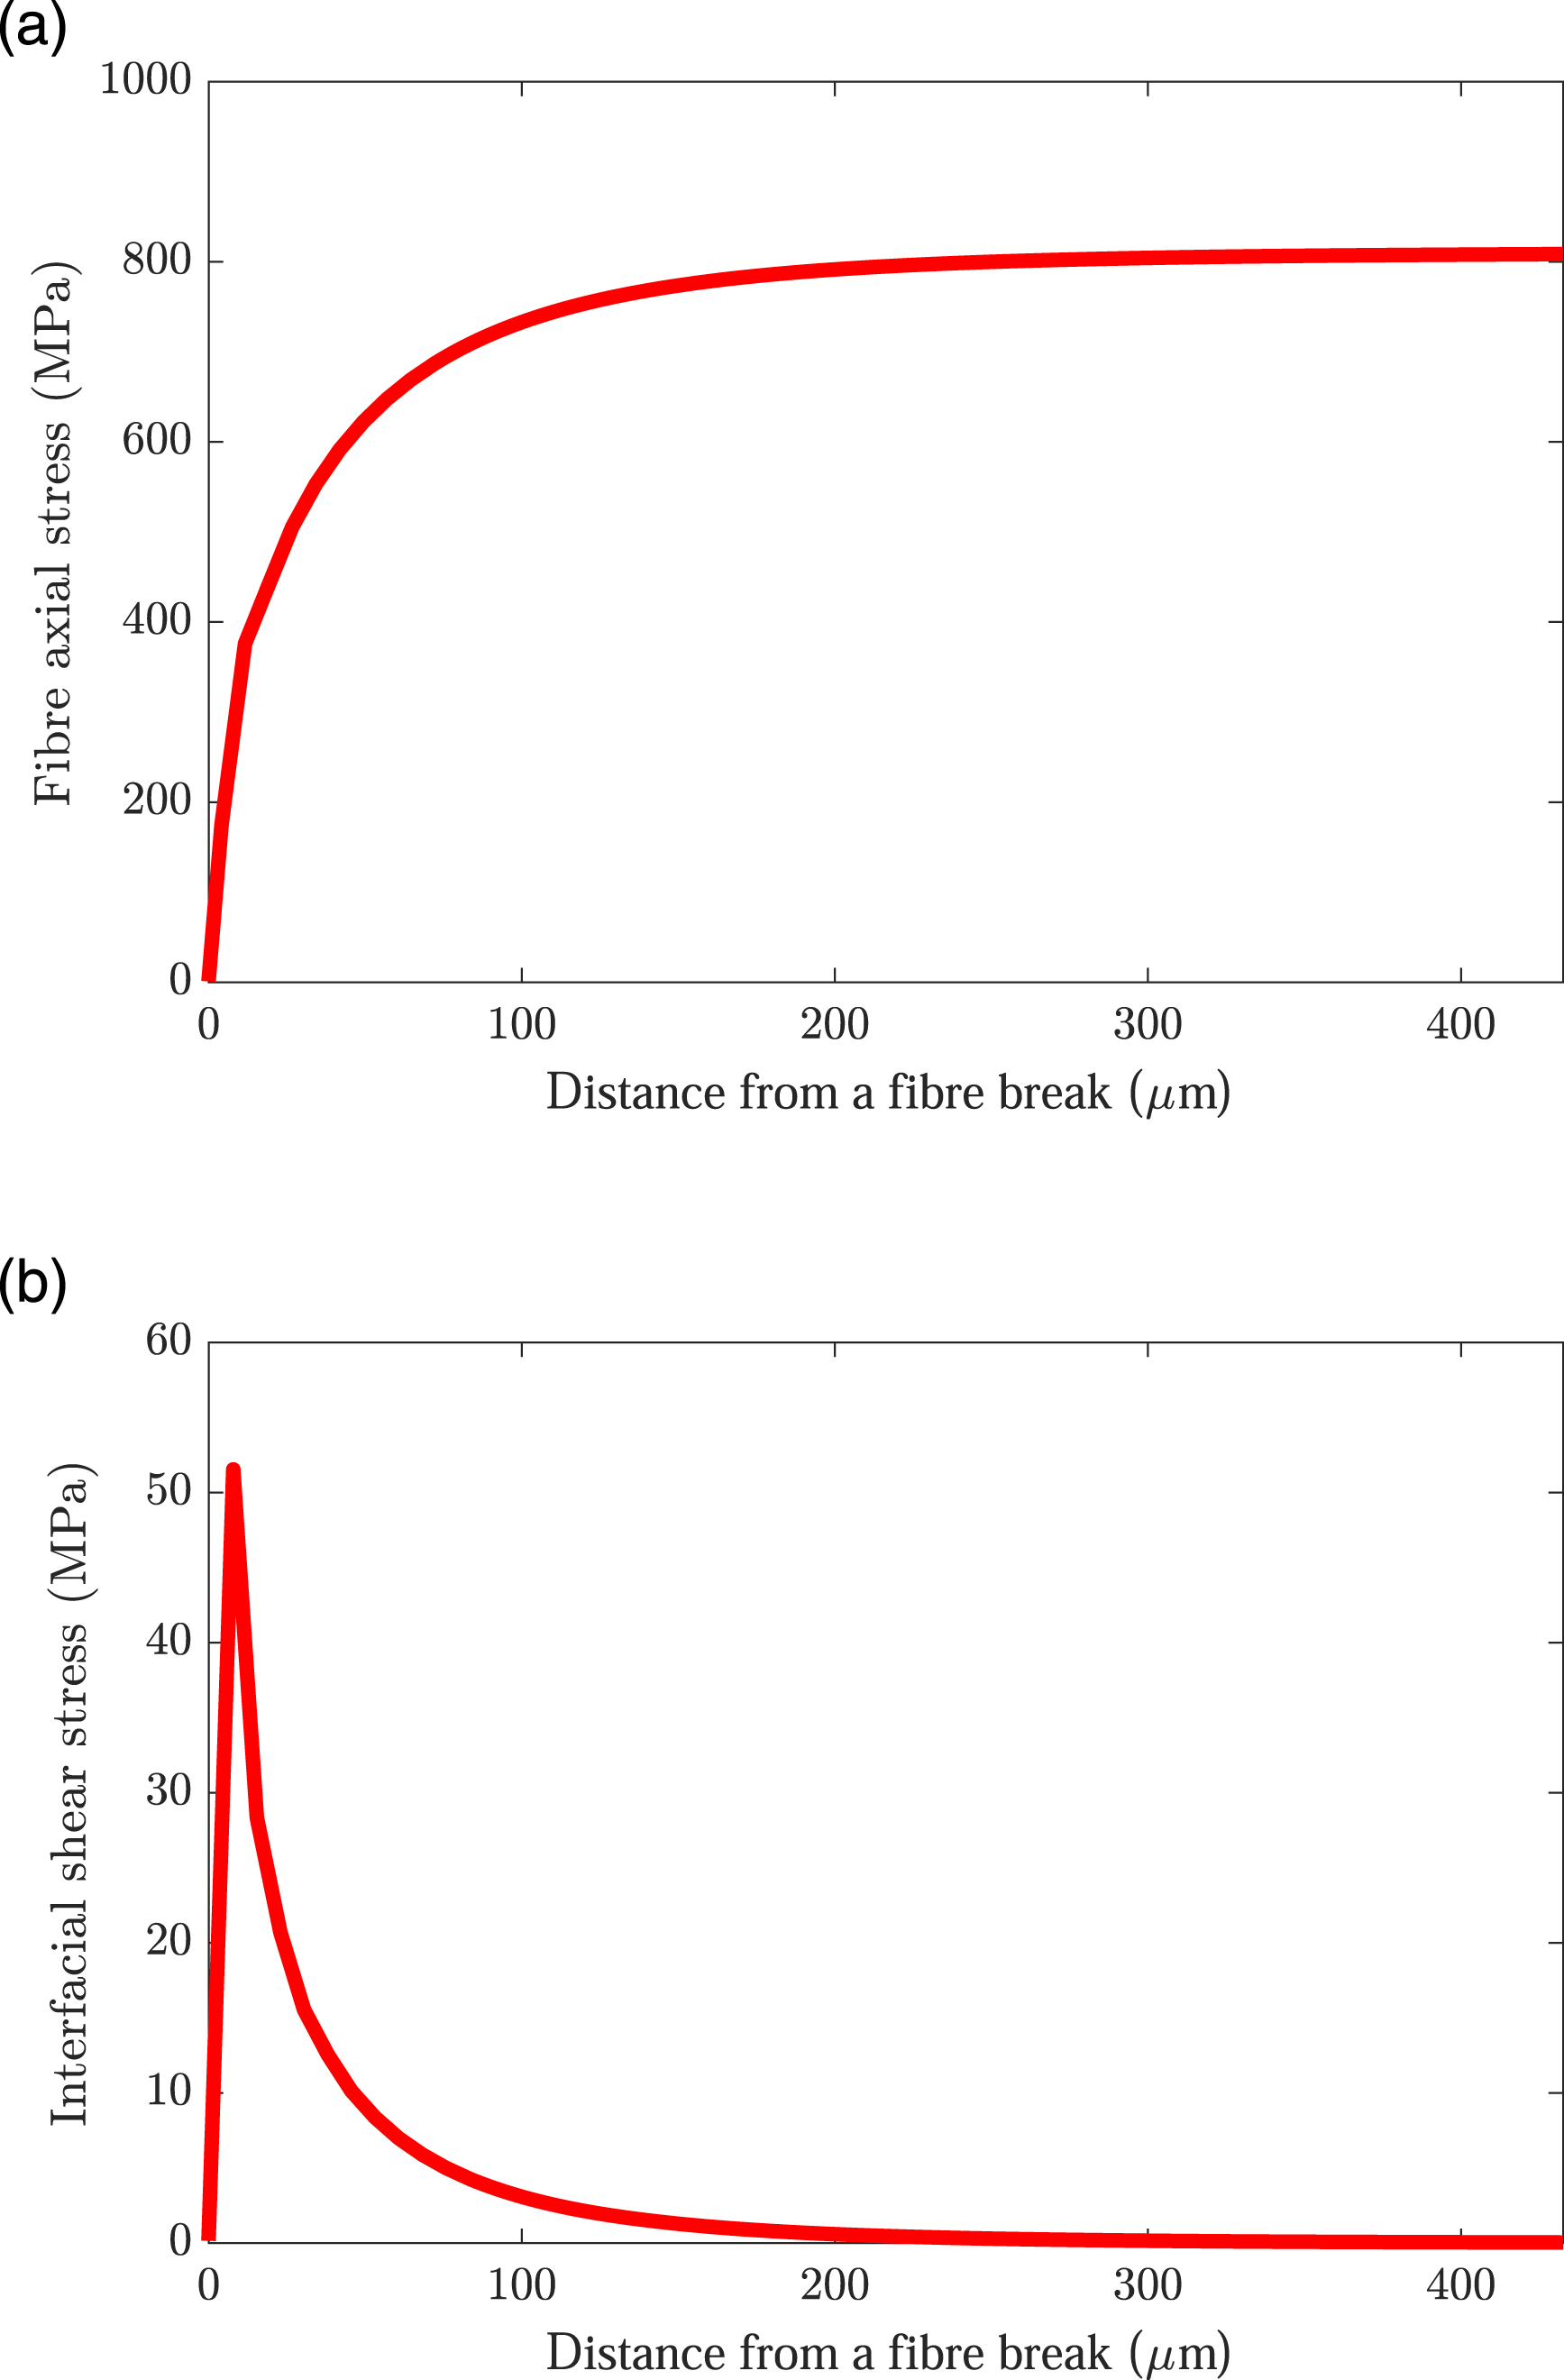
Figure 8 shows the distribution of both fibre axial stress and interfacial shear stress along the fibre gauge length after each of the first three fibre breaks. Instead of breaking at the geometric centre of fibre fragment lengths (as occurred in Wang et al.,22,23 where the fibre had a constant strength), breaks appear at "random" locations along the glass fibre – this is a consequence of the assignment of stochastic fibre strengths along the fibre (consistent with the reality of a stochastic distribution of flaws along brittle fibres). In addition, key aspects of the stress distributions are consistent with experimental observation. To aid the discussion, the local stress distributions near a fibre break are magnified in Figure 9. Shear stress is zero at a fragment end, then rises to a peak before assuming a near zero value along most of the fibre length (Figure 8(b) and Figure 9(b)). The non-zero interfacial shear stresses near the fragment ends induce an increase in fibre axial stress from zero at the ends to a near constant value for the rest of the fibre length (Figure 8(a) and Figure 9(a)). The length over which this occurs is often called the stress recovery length. As elongation increases, the fibre stress becomes sufficient to induce new breaks, and the fibre axial stress redistributes along the fibre fragment, taking on an increased maximum axial stress. The break process saturates when the fragments become sufficiently short, such that the stress recovery regions from each end meet and prevent the fibre stress from reaching the breaking stress in the fragment. The profiles in Figures 8 and 9 are consistent with the fibre equilibrium equation
1
Stress distribution along the fibre gauge length after the first three fibre breaks (a) fibre axial stress (b) interfacial shear stress. Local FE stress distribtions near a fibre break: (a) fibre axial stress and (b) interficial shear stress.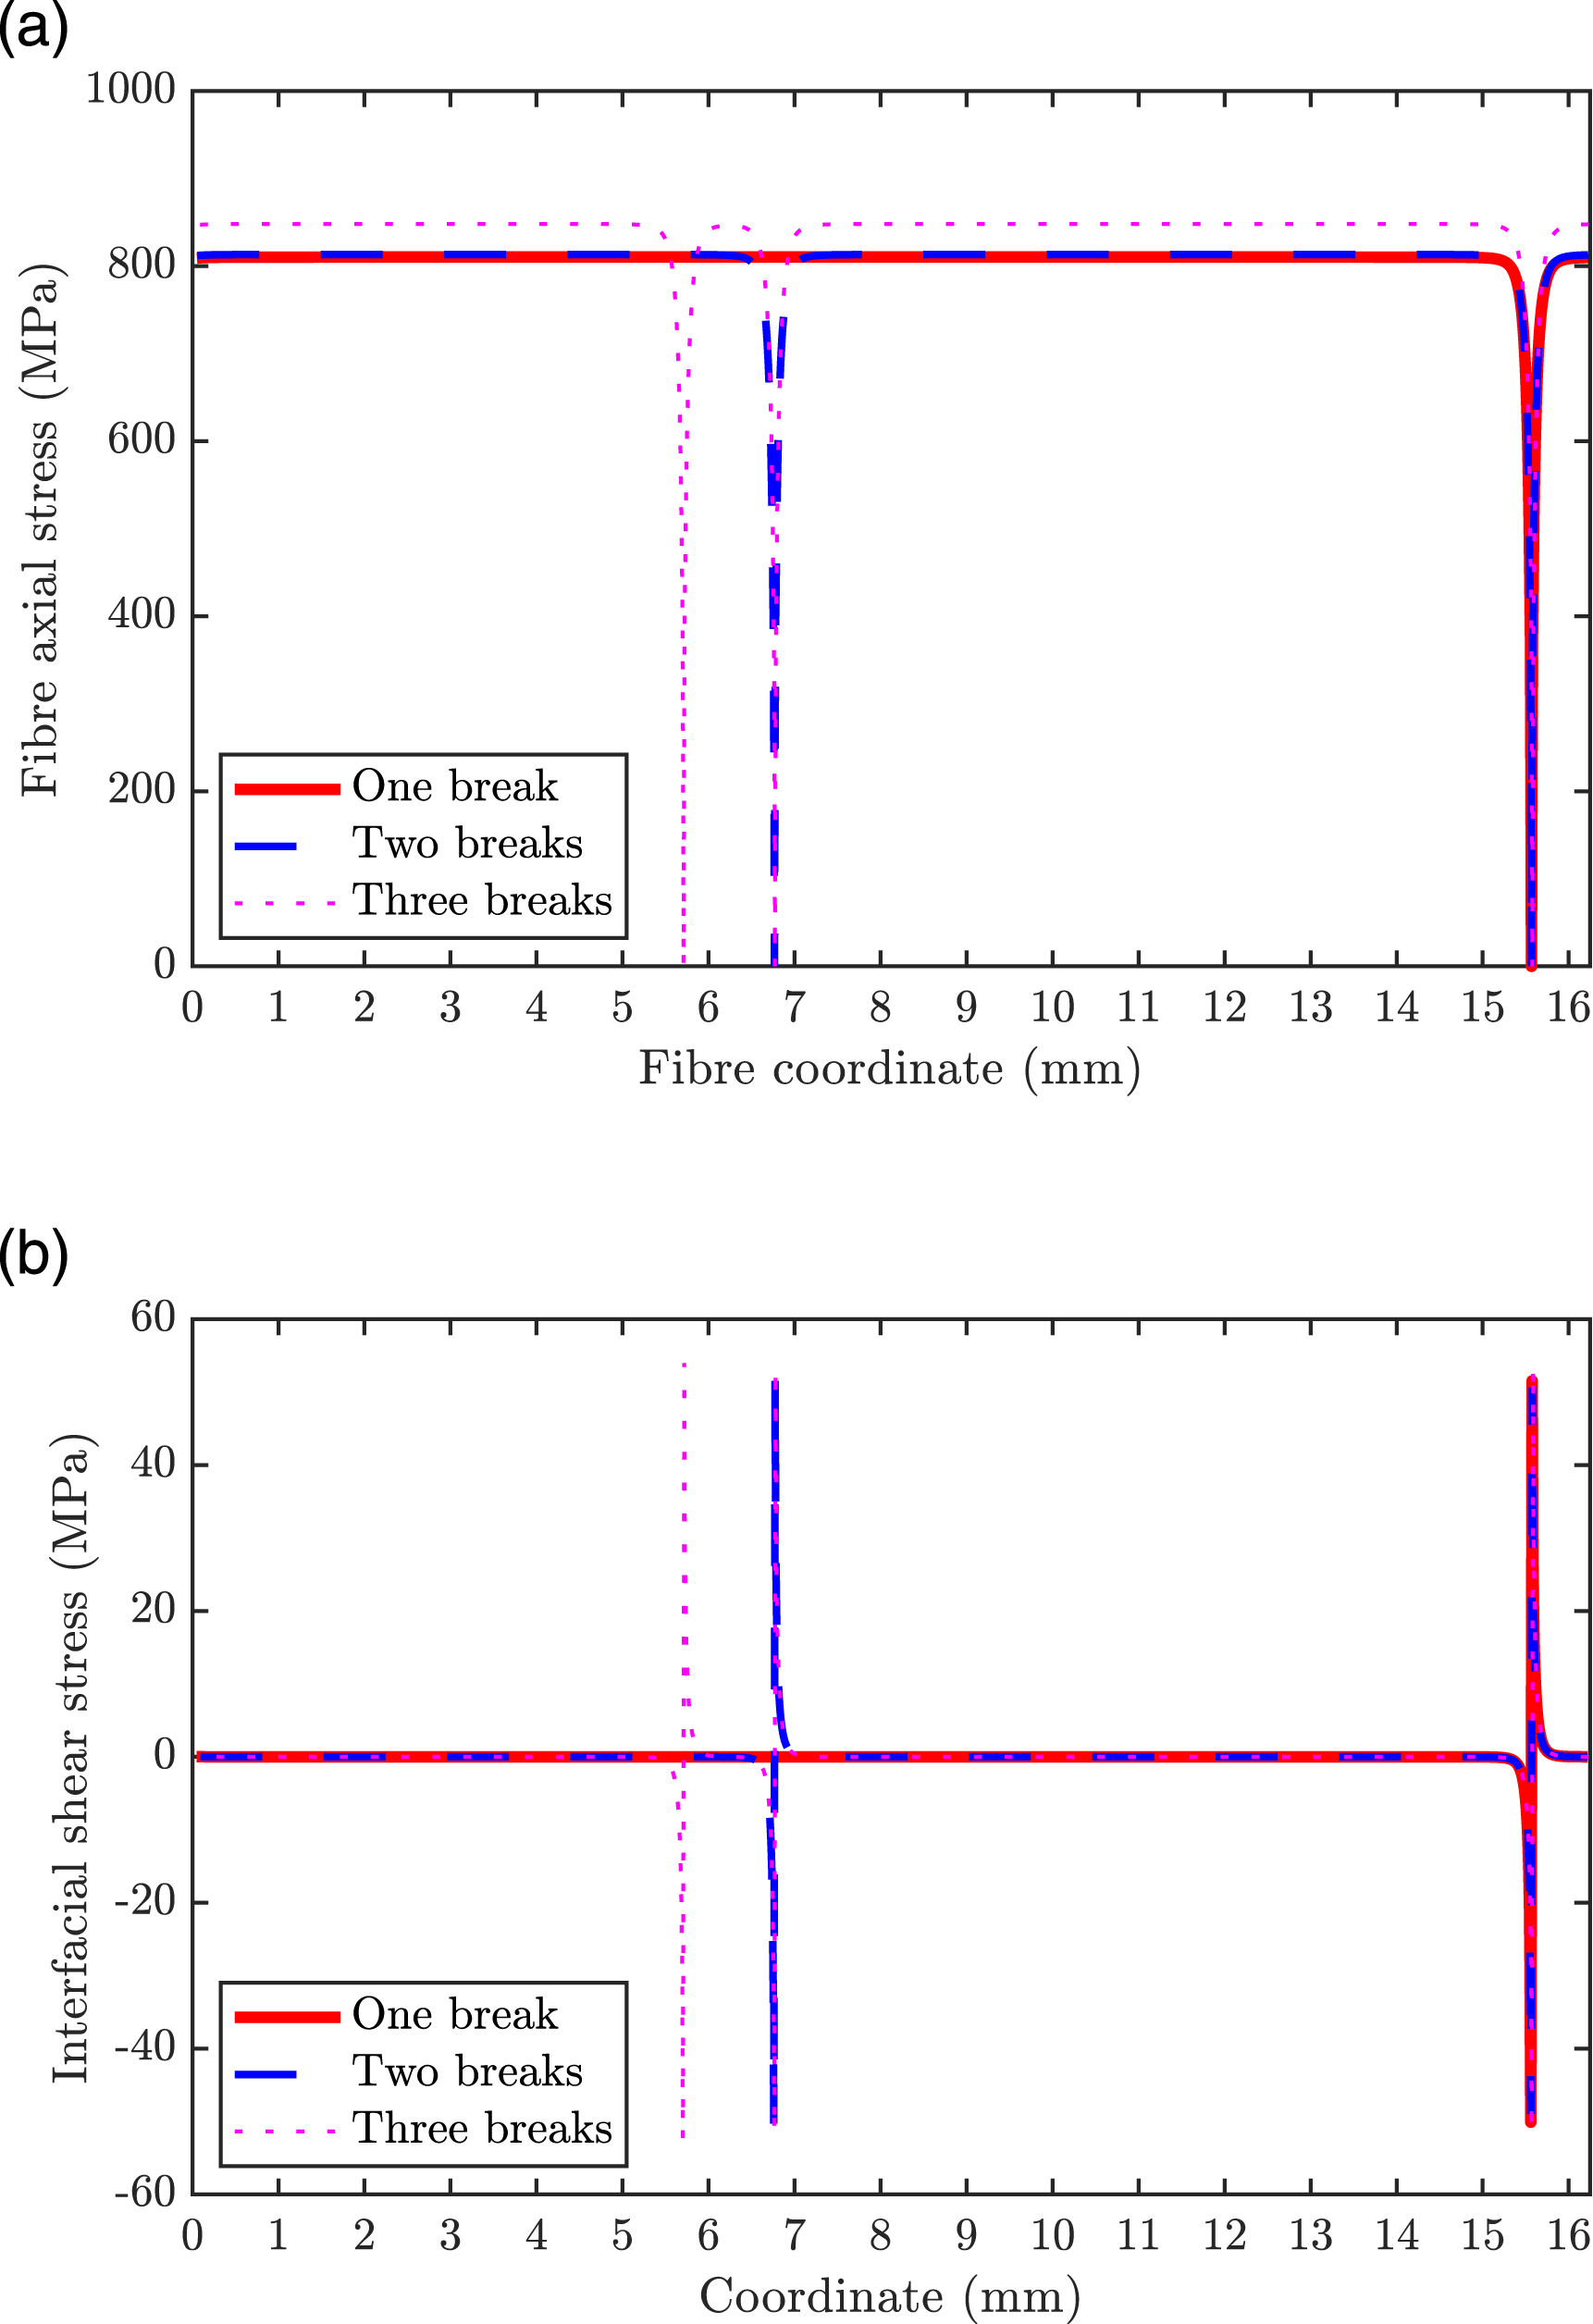
Distribution of fibre break coordinates
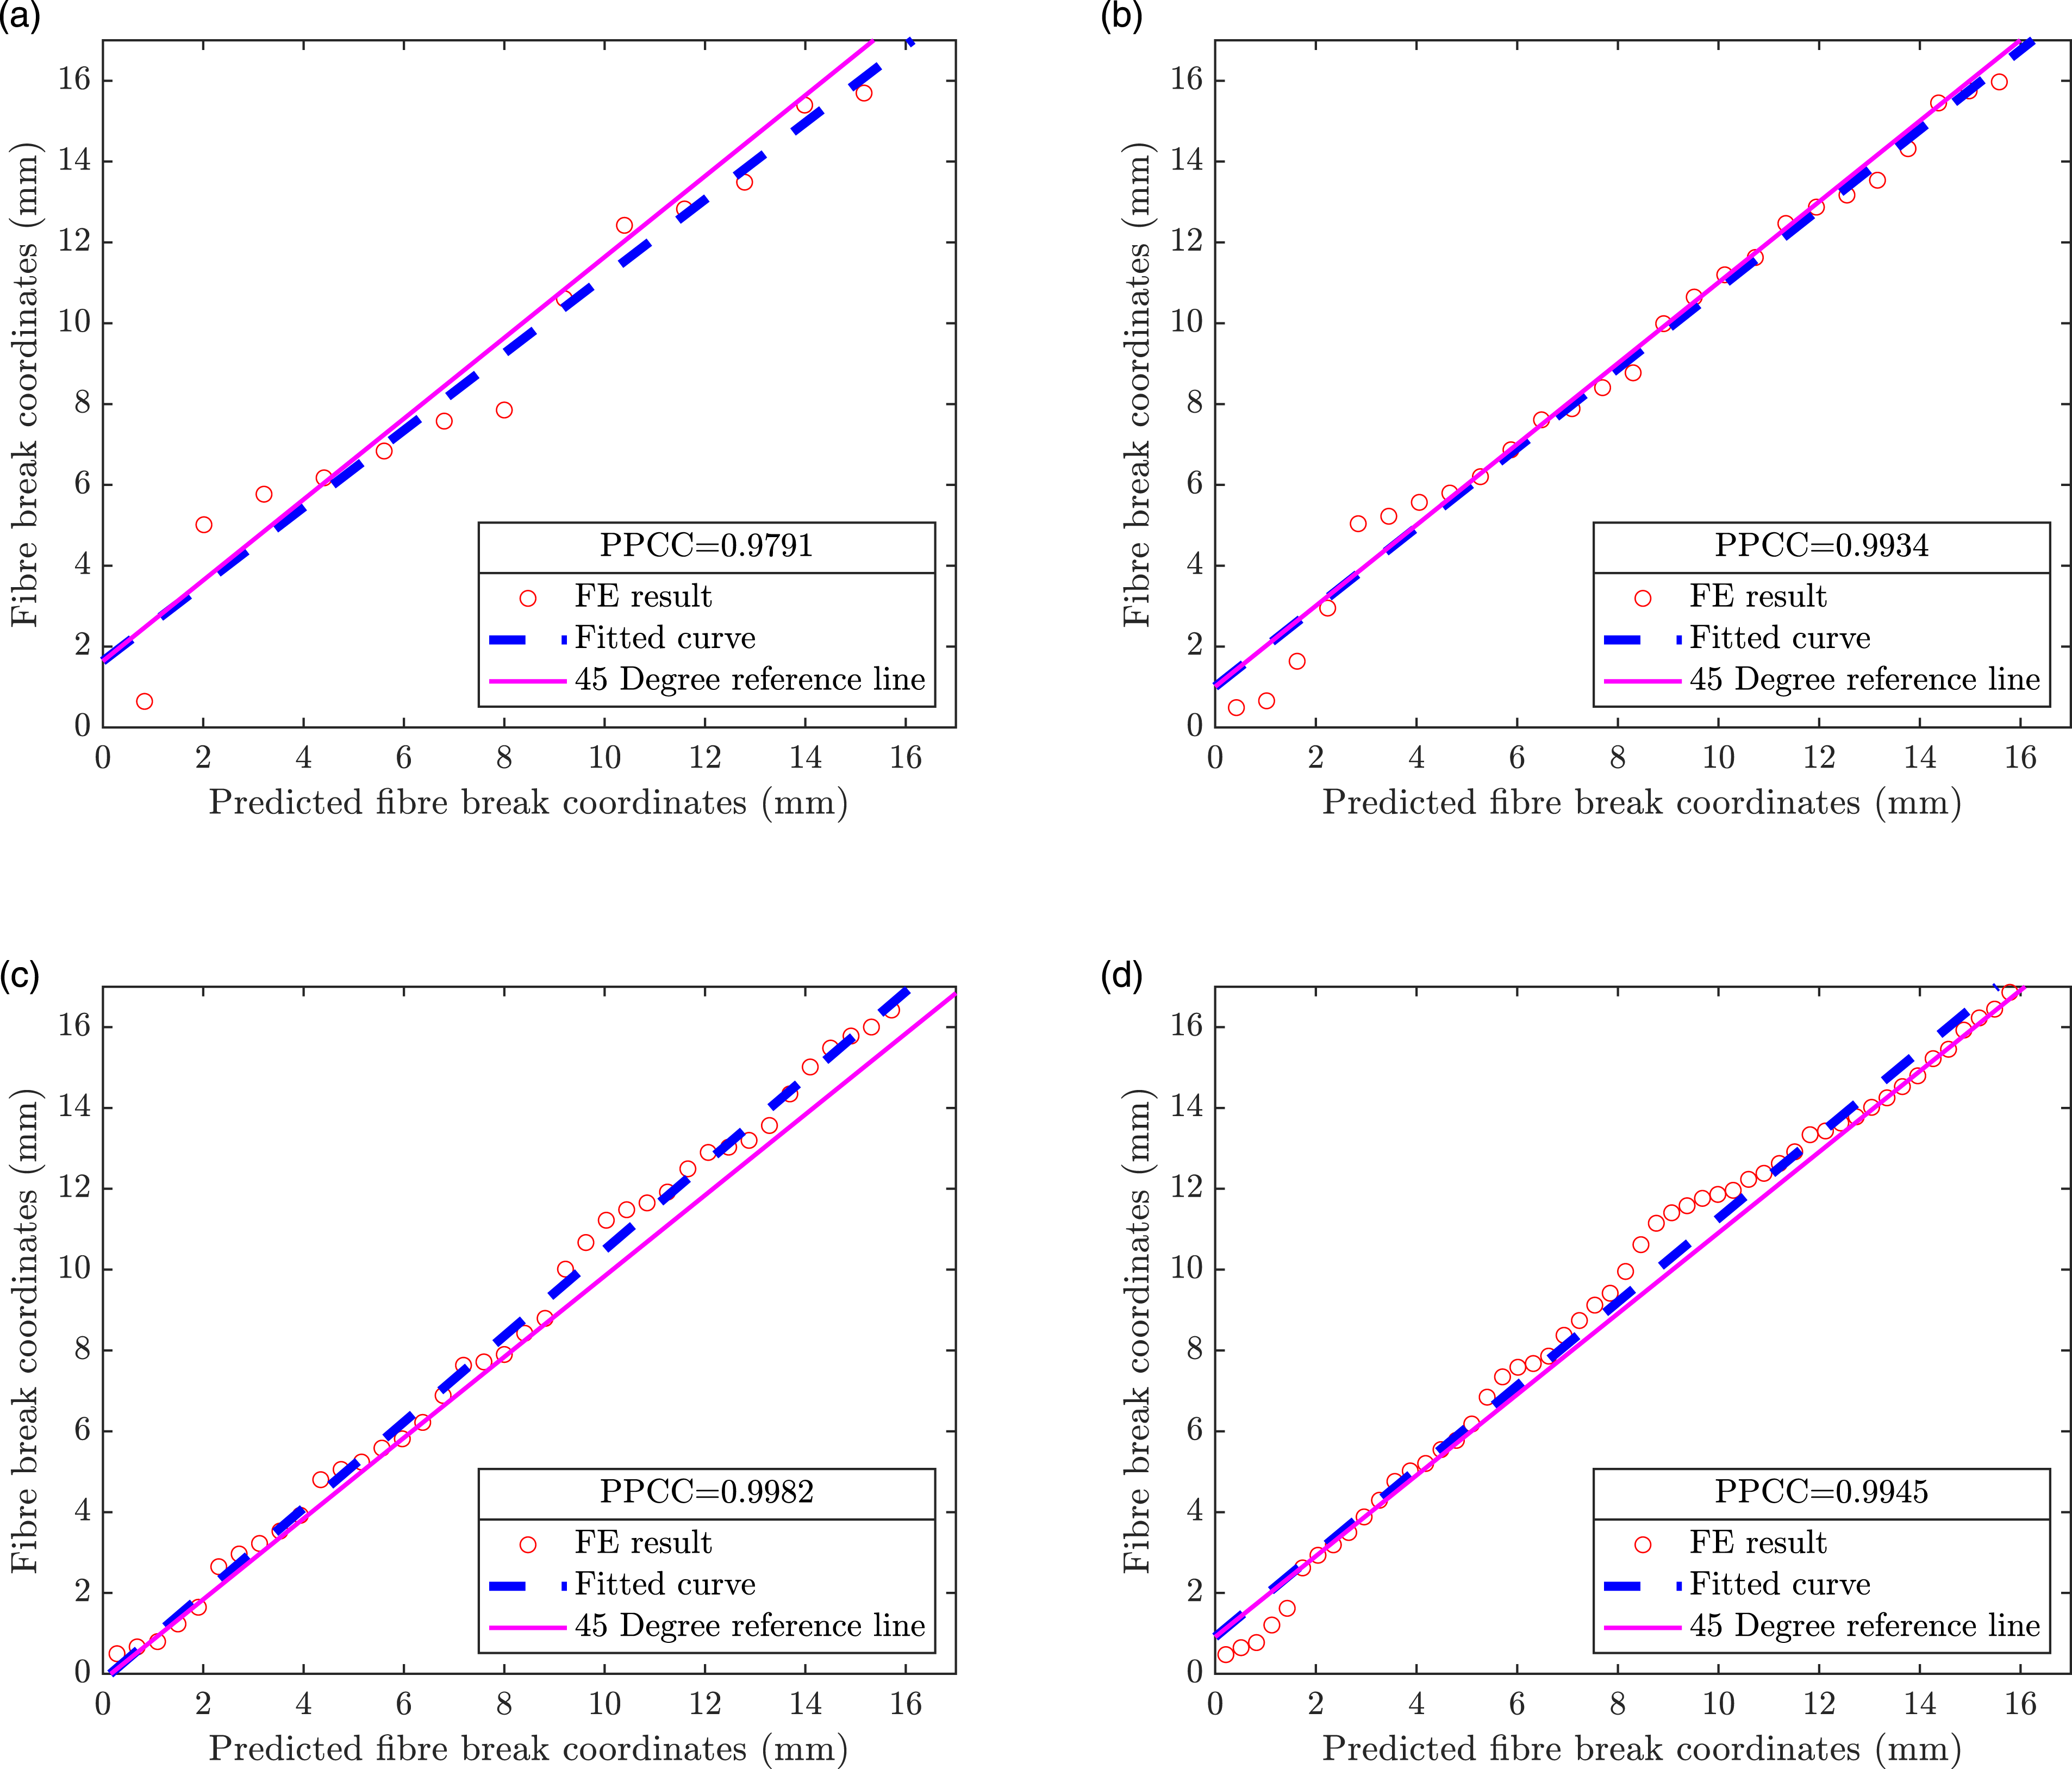
The spatial distribution of fibre break coordinates along the single embedded glass fibre is examined next. This is important as it determines the fragment length distribution. Here, there has been recent experimental evidence10,11 to suggest that the distribution of break locations evolves towards strong correlation with the Uniform distribution after a certain number of breaks (at least for the E-glass/epoxy system in10,11). Therefore, we test the goodness-of-fit of the Uniform distribution to the break data from the FE model at various strain levels. The uniform probability plot which graphs percentiles of the data against percentiles of the standard Uniform distribution is adopted. Figure 10 shows the FE break coordinates plotted against predicted fibre break coordinates having a Uniform distribution (and rescaled to the units of the data). The ordered break coordinates are graphed against standard uniform order statistic medians by using Uniform order statistic medians as: Uniform probability plots of single glass fibre break coordinates from the FE model: (a) 13 fibre breaks at 1.73% strain, (b) 26 fibre breaks at 1.99% strain, (c) 39 fibre breaks at 2.15% strain and, (d) 52 fibre breaks at 2.94% strain. Break coordinates from the FE model (vertical axis) are plotted against predicted break coordinates obtained from uniform median order statistics (horizontal axis).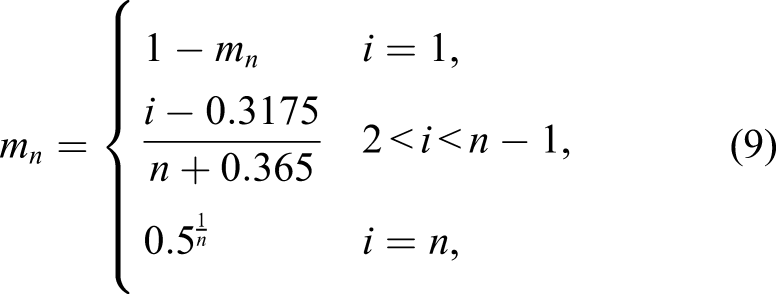
Distribution of fragment lengths
As has already been noted in McCarthy et al.
11
and Kim et al.,
10
the mathematical consequence of a Uniform distribution of break locations is a fragment length distribution due to Whitworth29,54–56 (see Appendix in Kim et al.
10
for the distribution equation). What is interesting for us here is to compare the FE distribution of fragment lengths to experiment. Figure 11 compares cumulative fragment length distributions (at saturation) for the FE model with an experimental glass fibre-epoxy result from McCarthy et al.
11
Although not directly comparable, a glass fibre-polyester result from Feih et al.
57
is also included for comparison. Firstly, the scale of fragment lengths produced by the model (fragments ranging from 15 to 466 µm) is roughly in agreement with the magnitudes in the experiments (see Figure 11). The form of the FE and experimental curves are similar although there is some discrepancy in relation to the position (mean) and spread (variation) of the data. In general, narrow distributions of fragment lengths are thought to be attributable to a narrow underlying fibre strength distribution while lower mean critical fragment length (i.e., a distribution shifted to the left) indicates higher interfacial shear stress transmission.3,4 Here, the FE glass fibre-epoxy result exhibits a wider spread than the experimental glass fibre-epoxy result (McCarthy et al.
11
). This may be due to a wider spread in the fibre strength distribution because the results in McCarthy et al. come from a fragmentation test on a single embedded fibre sample; whereas, numerous (ex-situ) single fibre tests (SFTs) were performed to determine the Weibull strength statistics for the glass fibre in the FE model. The FE result also yields a somewhat shorter mean critical fragment length of 309.2 µm compared to 370 µm for McCarthy et al.
11
This suggests that the interfacial shear strength in the FE model (50 MPa chosen from glass-fibre/epoxy literature39,49,50) may have been somewhat higher than the actual interface strength in McCarthy et al.
11
(which was not reported). The presence of shorter fragment lengths in the FE case also indicates a stronger interface. Turning to the experimental glass fibre-polyester result (Feih et al.
57
), the spread is even larger. Again, this can be attributed to more variation in the fibre strength statistics. In this case, we can assess this directly as the Weibull modulus for the fibres used in the FE model and the fibres in Feih et al.57,54 are both available. The Weibull modulus was 6.8 (see Table 2) for the fibres modelled in the FE study here, but only 4.4 in Feih et al. – a smaller Weibull modulus indicates a wider spread of the fibre strength data.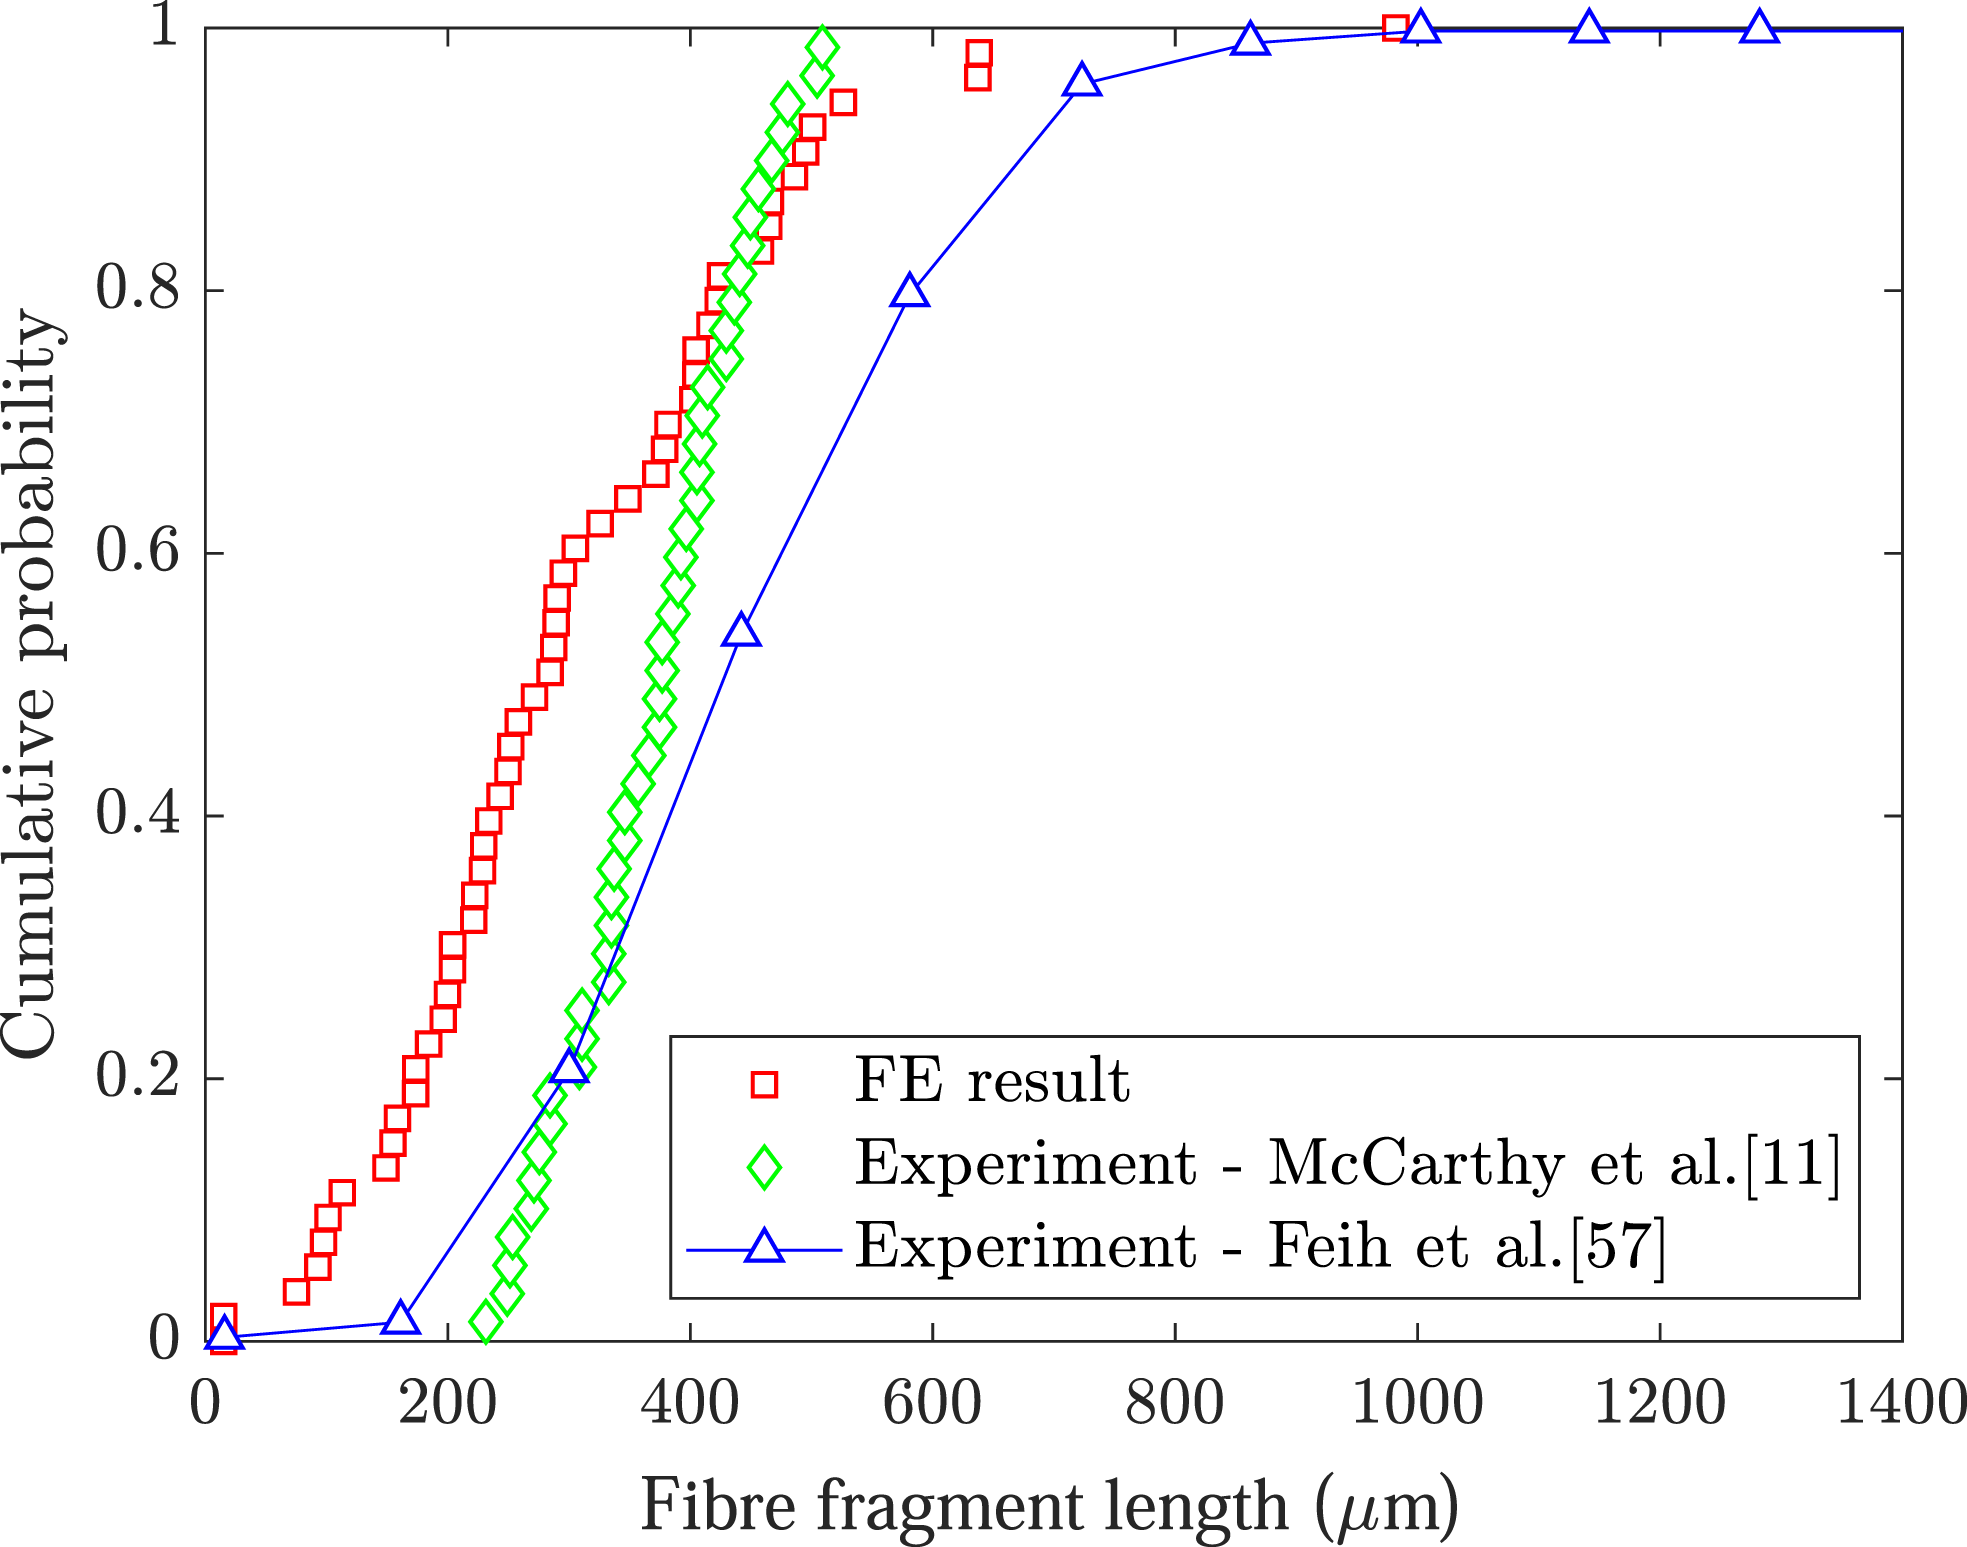
Conclusions
The paper develops an FE model of the single fibre fragmentation test (SFFT) for direct comparison with the experimental results in McCarthy et al. 11 (i.e., an E-glass fibre embedded in an epoxy matrix). A cohesive surface is used to model interface behaviour, and a Weibull distribution of fibre strengths (determined by single fibre tests on the E-glass fibres) is implemented in the model by assigning strengths from the distribution to the elements along the fibre. It remains difficult to access accurate experimental data on all input parameters. In this case, the fracture energy of the interface was not accessible, so this was adjusted to provide an equivalent number of fibre breaks (at saturation) as the experiment. With equivalent break numbers at saturation established, the model was then used to successfully study a number of key aspects of the problem. Of particular interest is the fact that the model correctly captures a number of important experimentally observed outcomes. The form of the evolution of fibre break numbers with strain is roughly in agreement with experiment and fibre breaks occur at random locations along the fibre as required. In addition, the distribution of fibre break locations evolves towards good agreement with a Uniform distribution at some point in the test (26 fibre breaks & 2% strain here), but conforms to different distributions earlier in the test. This agrees with recent experimental observations by Kim et al. 10 and McCarthy et al. 11 The form of the cumulative fragment length distribution from the FE model is also roughly in agreement with experiment. The effectiveness of the model in capturing experimentally observed fibre break statistics confirms the usefulness of the approach taken here to assigning stochastic fibre strengths to elements in the FE model (i.e., the probability of failure being independent at each element and local strength being assigned from the appropriate Weibull distribution of strengths). The fibre axial stress and interfacial shear stress distributions are also consistent with experiments both along the fibre and close to breaks.
Theoretical models are often used to back-calculate interfacial shear strength (IFSSh) from SFFTs in the assessment of the fibre-matrix interface; however, such models cannot capture the range of key behaviours which can be included in an FE model. Correct model predictions on each of the aspects studied here (break statistics, stress distributions etc.) suggest FE modelling can play an important role in the analysis of fibre fragmentation tests including replacing theoretical approaches to aid more accurate calculation of IFSSh. However, much more work is required to experimentally determine sufficiently accurate input parameters (such as interfacial fracture energy) to make these models fully predictive.
Footnotes
Acknowledgements
The authors gratefully acknowledge Owens Corning for providing the glass fibres.
Declaration of conflicting interests
The author(s) declared no potential conflicts of interest with respect to the research, authorship, and/or publication of this article.
Funding
The author(s) received no financial support for the research, authorship, and/or publication of this article.