
Abstract
Calendered nonwovens, formed by polymeric fibres, are three-phase heterogeneous materials, comprising a fibrous matrix, bond-areas and interface regions. As a result, two main factors of anisotropy can be identified. The first one is ascribable to a random fibrous microstructure, with the second one related to orientation of a bond pattern. This paper focuses on the first type of anisotropy in thin and thick nonwovens under uniaxial tensile loading. Individual and combined effects of anisotropy and strain rate were studied by conducting uniaxial tensile tests in various loading directions (0°, 30°, 45°, 60° and 90° with regard to the main fabric’s direction) and strain rate (0.01, 0.1 and 0.5 s−1). Fabrics exhibited an initial linear elastic response, followed by nonlinear strain hardening up to necking and final softening. The studied allowed assessment of the extent the effects of loading direction (anisotropy), planar density and strain rate on the mechanical response of the calendered fabrics. The evidence supported the conclusion that anisotropy is the most crucial factor, also delineating the balance between the fabric’s load-bearing capacity and extension level along various directions. The strain rate produced a marked effect on the fibre’s response, with increased stress at higher strain rate while this effect in the fabric was small. The results demonstrated the differences of the mechanical behaviour of fabrics from that of their constituent fibres.
Introduction
The origin of the term nonwoven can be traced back to a British patent issued in 1853. 1 ISO 9092:2019 2 reports the official definition of nonwoven, introduced by EDANA in 1981, as “a sheet, web or batt of directional or randomly-oriented fibres bonded with mechanical, thermal or chemical techniques, excluding weaving, knitting, tufting, stitch-bonding and traditional felting process”. Due to high versatility as well as faster and cheaper manufacturing processes (as compared to woven materials), nonwovens experienced a rapid growing demand in various sectors. Their applications are diverse, ranging from personal care to hygiene and from automotive to construction applications.3–5
A large number of nonwoven types is available in the market and each of them exhibits a distinctive complex mechanical behaviour depending on the manufacturing process employed. Strength is imparted to the loose microstructure during the bonding process. Thermal bonding, in particular, the calendering one, is one of the most widely used technologies in the nonwoven industry;6–8 this method allows to obtain compact and stronger structures. 9 In this process, the fibrous mat passes through two calenders (rollers), with one or both heated to the melting temperature (calendering temperature) of the polymer used. One roll has a customised embossed bond pattern with nips of desired shape (e.g. diamond, elliptical, rectangular, etc.), size and distribution, pressed against the fibrous network. The result of this consolidation process is a sturdy heterogeneous fabric composed of three mechanically distinct domains: fibrous matrix, bond-areas and interface regions. As a result, two factors of structural anisotropy can be identified in calendered nonwovens. One is related to the orientation of fibres and one to the bond pattern, i.e. its orientation and orientation of bonds.
Most of the studies in the literature focus on the effect of bonding (e.g. bonding temperature, calendering pressure, bond pattern, percentage of bonded area, etc.) on the fabric’s strength, since it has been identified as the most important factor.6,7,10–16 In addition, significant morphological changes occur at the bond periphery (interface region) during the bonding process, where typically damage initiates.12,14,17–22
Currently, only limited studies on the effect of anisotropy on the mechanical response of nonwoven materials are available. This is even rarer for calendered nonwovens. The first and sole work accounting for such effects was carried out by Kim et al.. 23 The authors performed tensile tests on calendered nonwovens at constant strain rate to study in-situ structural changes and microscopic deformations in the bond-area, proposing the concept of the unit cell. Changes in structural features, such as orientation distribution function (ODF) of fibres, bond-area strain, unit-cell strain in the machine and cross directions (MD and CD, respectively) were studied based on the loading direction (0°, ±34° and 90°) through orientation parameters. The authors demonstrated that, besides the bonding temperature, changes in the structure were mainly governed by the initial ODF of fibres, and that variations in uniaxial and shear strains in the unit-cell were similar for all cases with the same initial ODF, as also reported in a recent work. 24 In a study conducted by Moreau 25 conducted on parallel-laid nonwovens, it was observed that fabrics with low planar density (thin fabrics) showed a higher strength in MD than those with a higher planar density (thick fabrics) stretched in CD, revealing that the ODF of fibres had a more considerable influence on the fabric’s strength than the planar density.
Additionally, most of the experimental data available stem from mechanical tests performed only in MD and CD. Hou et al. 26 tested thermally-bonded polypropylene fibre nonwovens in MD and CD, while Kim et al. 23 also included the bond-pattern orientation angle, ±34°. The results indicated that the levels of stiffness, yield and ultimate strength were higher in MD than in CD. Several works reported similar results,17,27–29 apart from the peculiar case of needle-punched nonwovens in which CD behaved like MD.30–32
This work attempts to assess individual and coupled effects of anisotropy and strain rate on the tensile response of calendered nonwovens, accounting also for the variation in fabric’s planar density. To this end, the material microstructure was first characterised with digital imaging techniques and, then, several uniaxial tests were carried out on fabrics with different planar density at various strain rates and loading directions. The result of this comprehensive characterisation provided a detailed picture of the effects that these parameters had on the mechanical response of the selected nonwovens. Moreover, this study could be used either as a benchmark for the calibration of constitutive models or validation of numerical simulations of mechanical behaviour of these materials.
Materials and experimental methods
Nonwoven fabrics
The nonwoven materials considered in this paper were produced with spun-bonding, a one-step process converting a raw polymer into the end product. The raw polymer, or a mixture of polymers, in particulate or granular form, is extruded and passed through tiny nozzles (10–20 µm in diameter) and then through a stretching channel, to increase the degree of crystallinity. 33 To some extent, the produced randomly-oriented filaments are reoriented along a preferential direction (machine direction) and laid down on a conveyor belt. Bonding was obtained through hot-calendering technique.
Variability in material and structural parameters such as polymeric resin, fabric’s planar density (basis weight), fibre typology, orientation distribution of fibres and bond pattern were considered in this study. With this in mind, three types of calendered nonwoven fabrics were selected. The low-density fabrics, with a planar density of 25 g/m2, was manufactured with bi-component core-sheath fibres made of 70% polypropylene (PP) and 30% high-density polyethylene (HDPE). The medium- and high-density ones, with a planar density of 40 and 100 g/m2, respectively, were produced with mono-component fibres made of 100% polypropylene (PP). The 100 g/m2 fabric was a bi-layer nonwoven. Based on their planar density, the selected fabrics are designated as F25, F40 and F100 throughout this study. The raw polymer, polypropylene, was manufactured by Total and had a density of 0.905 g/cm3, whereas no information was provided by the producer about the high-density polyethylene.
Microstructural characterisation
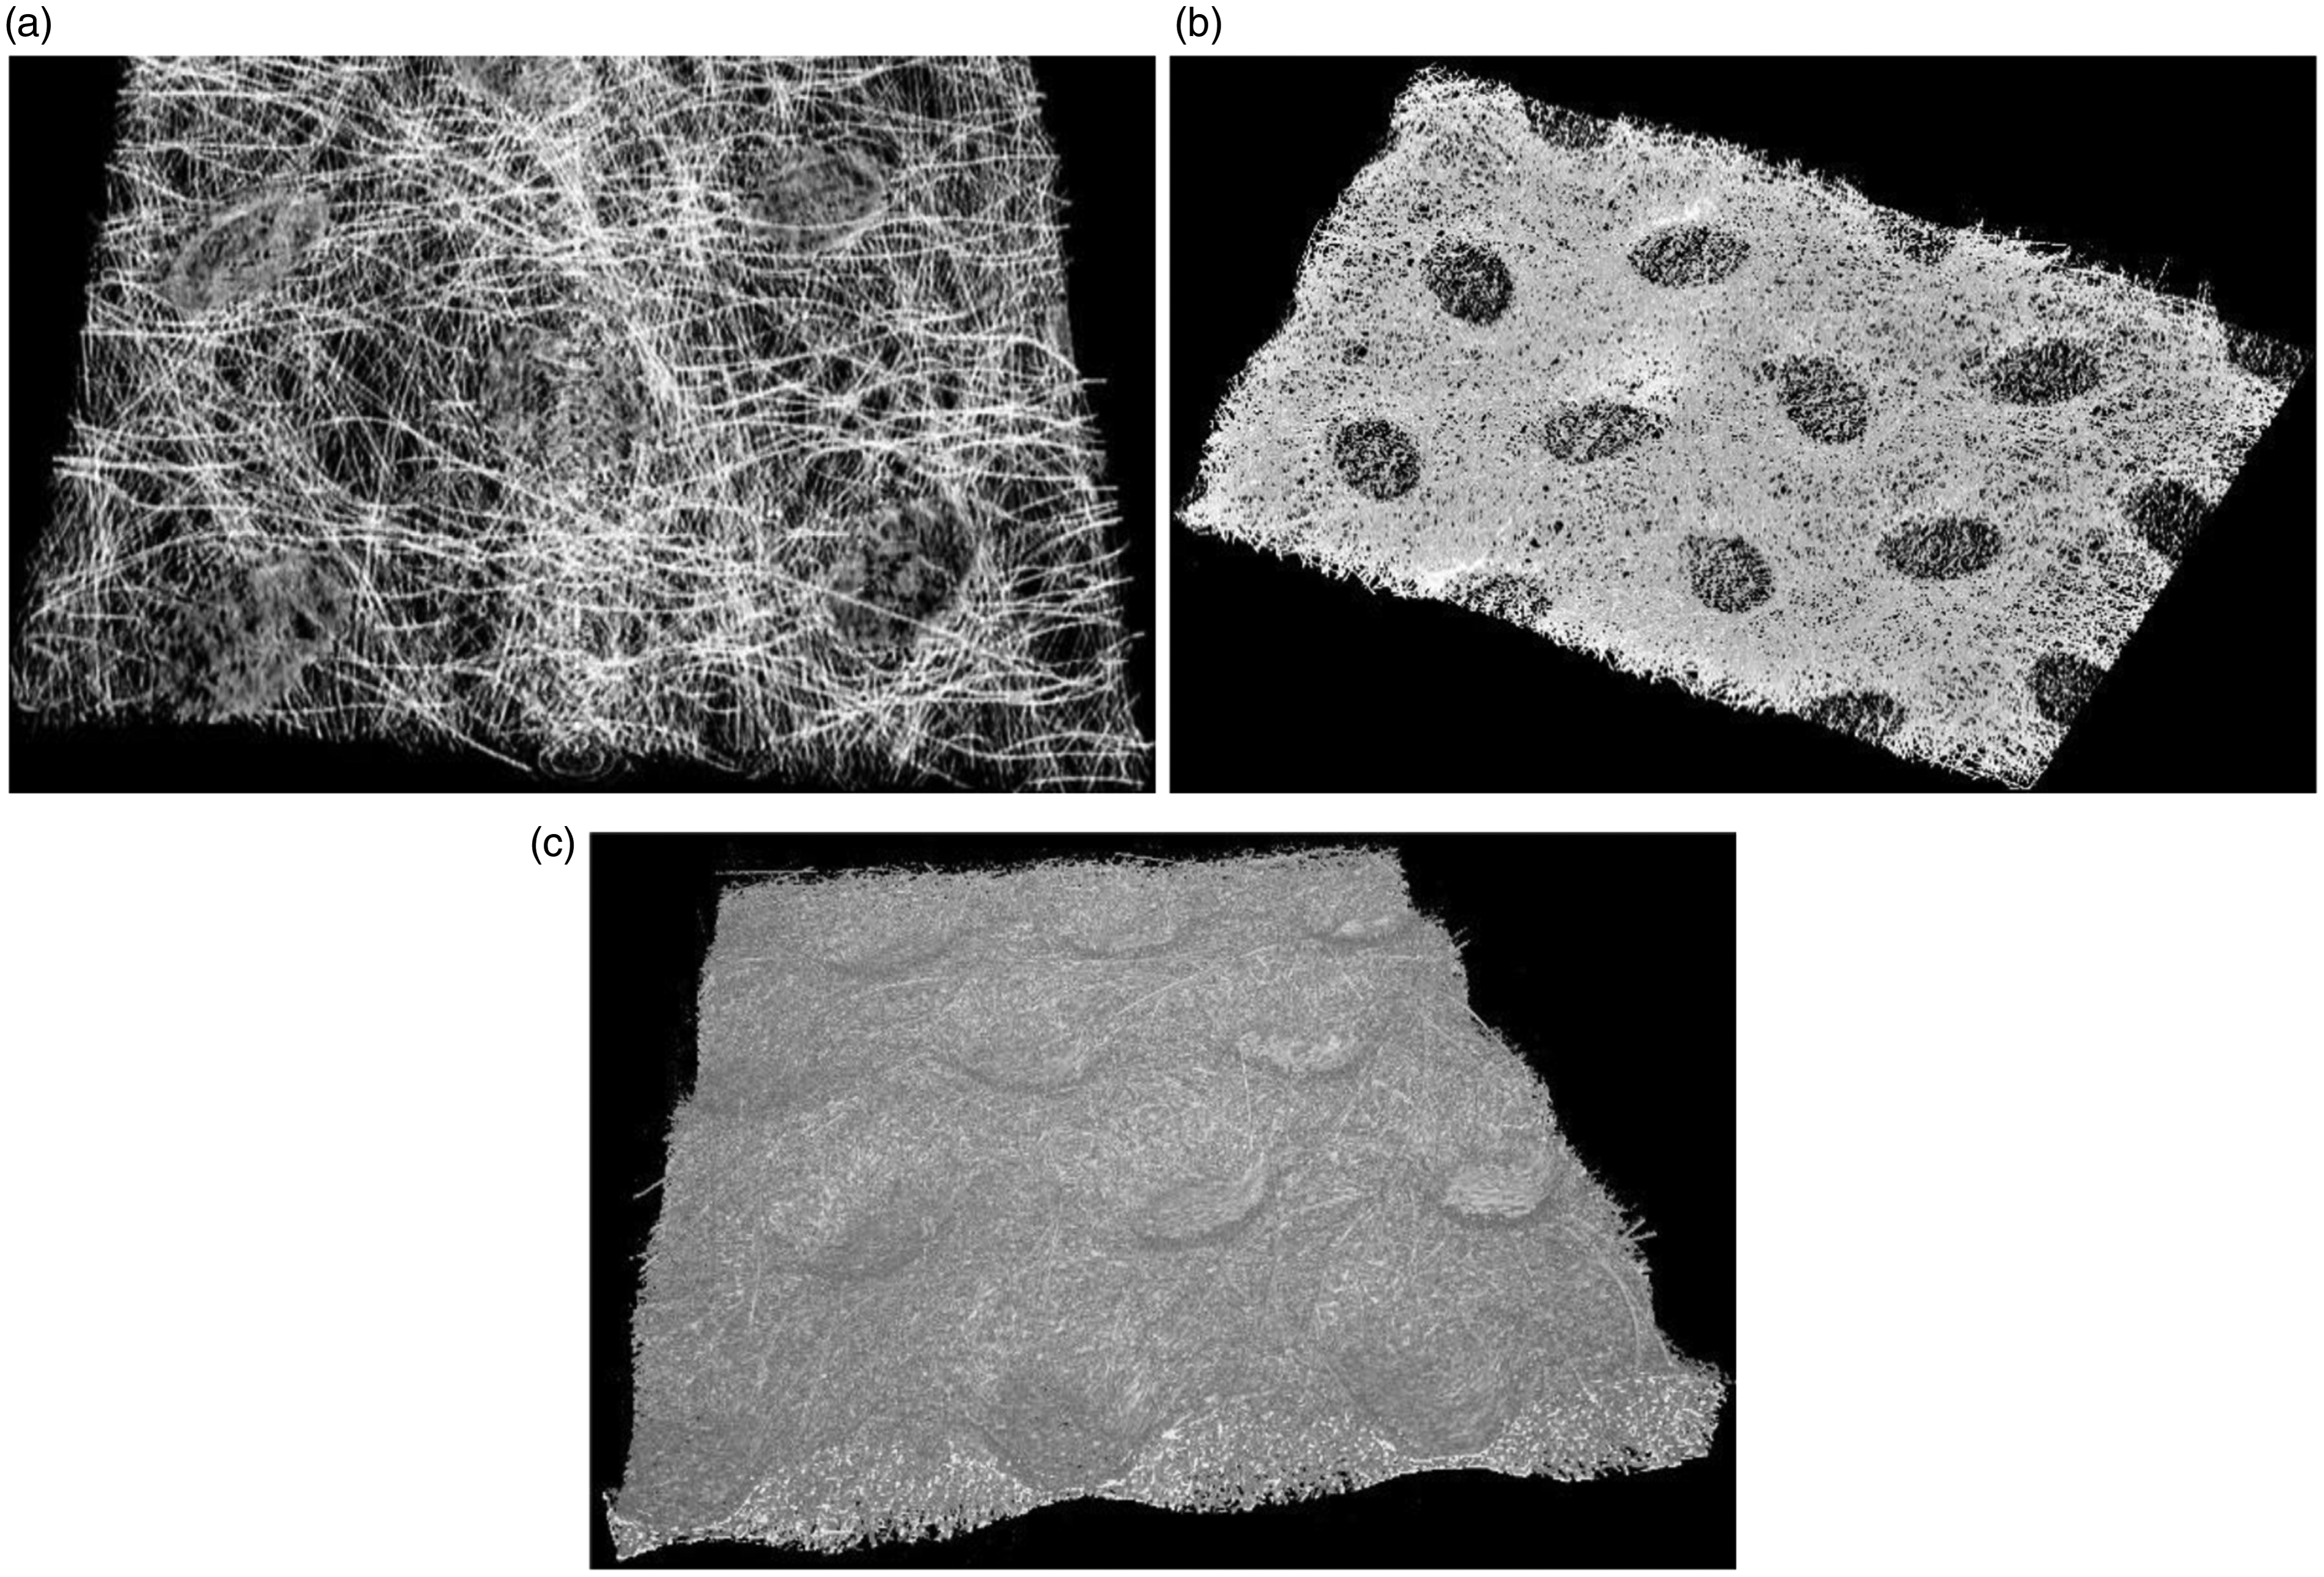
Microstructural characterisation was performed on the selected fabrics. Three small samples (
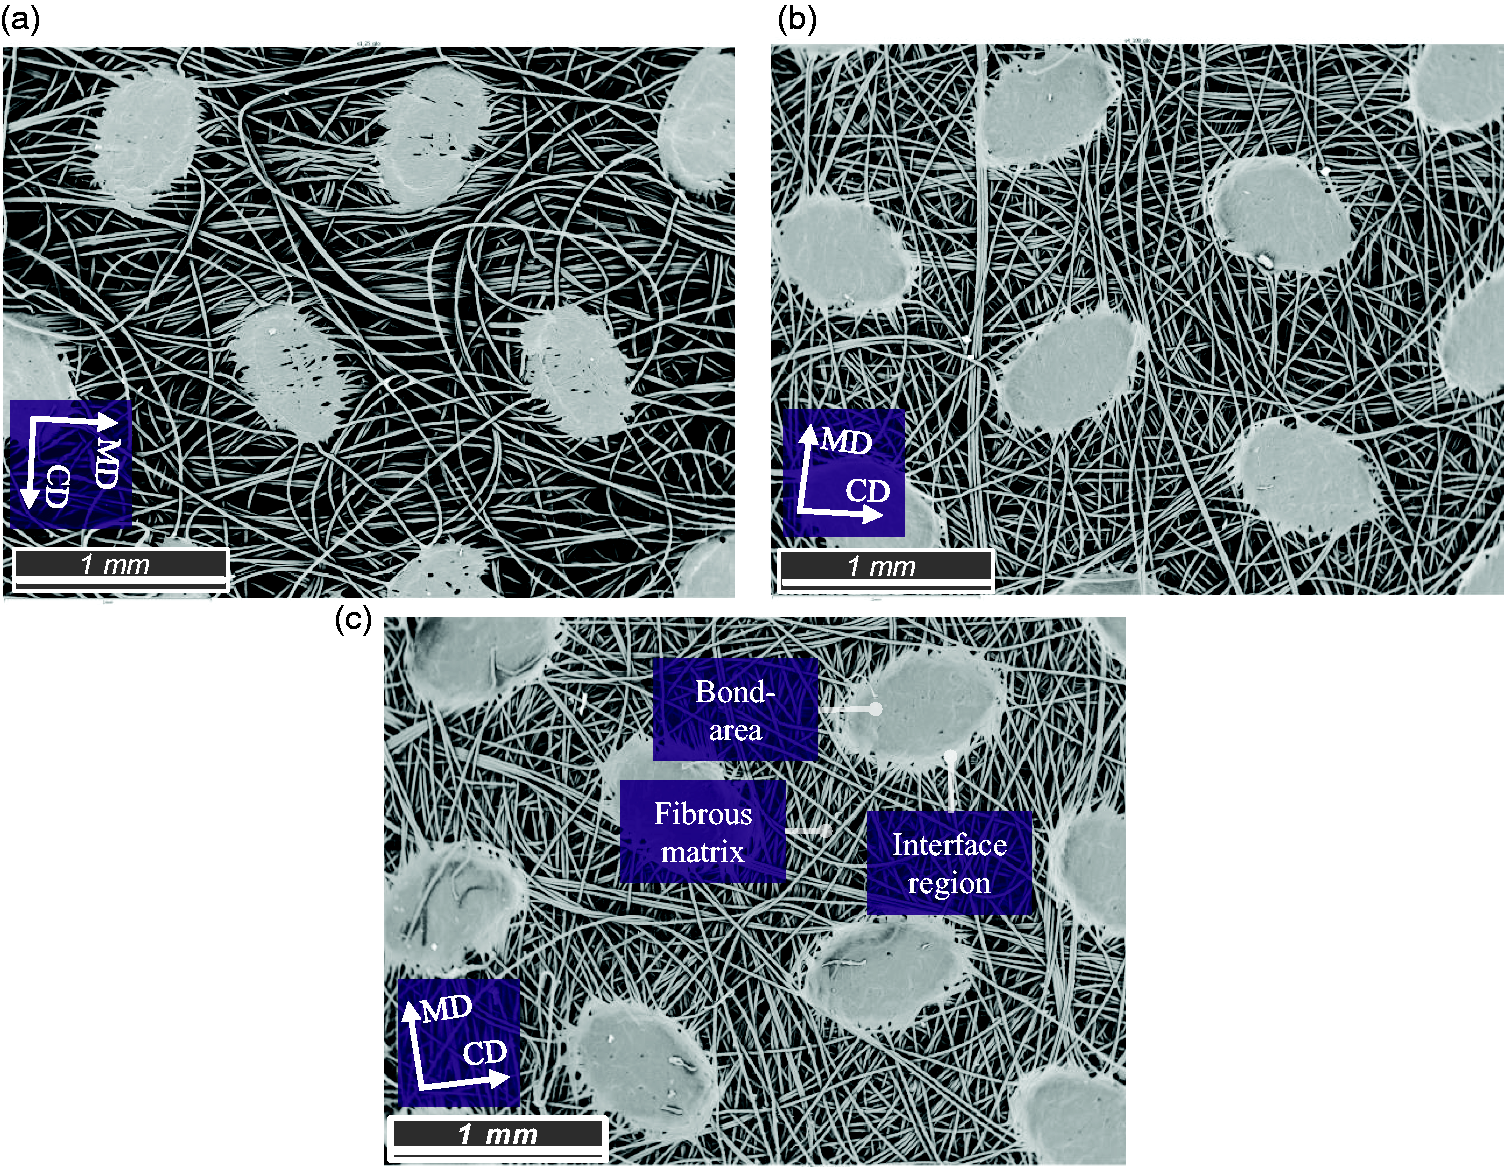
SEM micrographs of F25 (a), F40 (b) and F100 (c) fabrics.
Due to the manufacturing process of PP fibres of the F100 nonwoven fabric (Figure 2), their diameter varies along the fibre length. Furthermore, some squeezed and damaged fibres can be found. This is particularly true for fibres situated in and near the interface region, where thermal-structural effects are more pronounced as a result of the manufacturing process. A partial fusion between fibres was also observed. The fibre diameter is an important measure of the fabric strength: it was found that it had a considerable influence on the maximum bonding strength achievable at a certain bonding time. 34
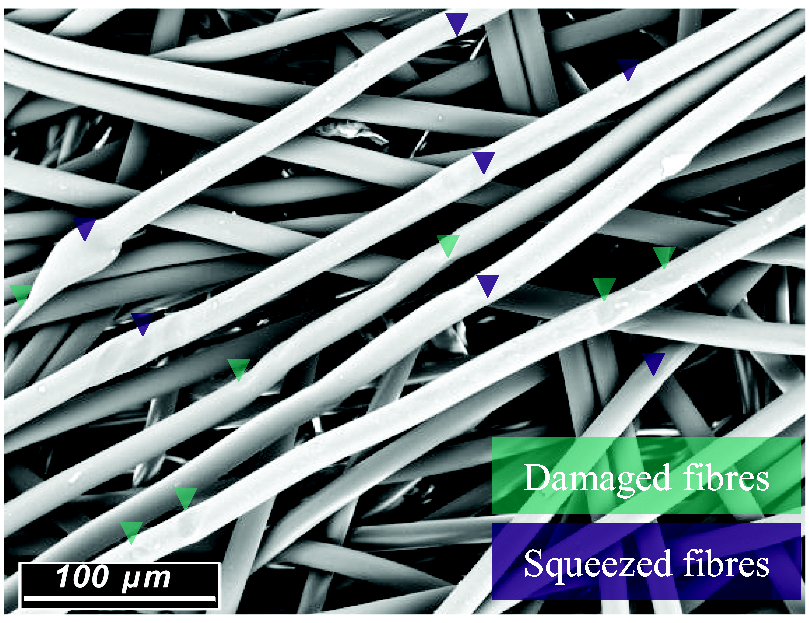
SEM micrograph of PP fibres of F100 nonwoven fabric.
A measurement dataset was generated by analysing 8 different sets of fibres taken from each sample (50 measurements from each image for a total of 400 manual measurements performed in AutoCAD®). These data were used to assess the fibre-diameter distribution, its mean,
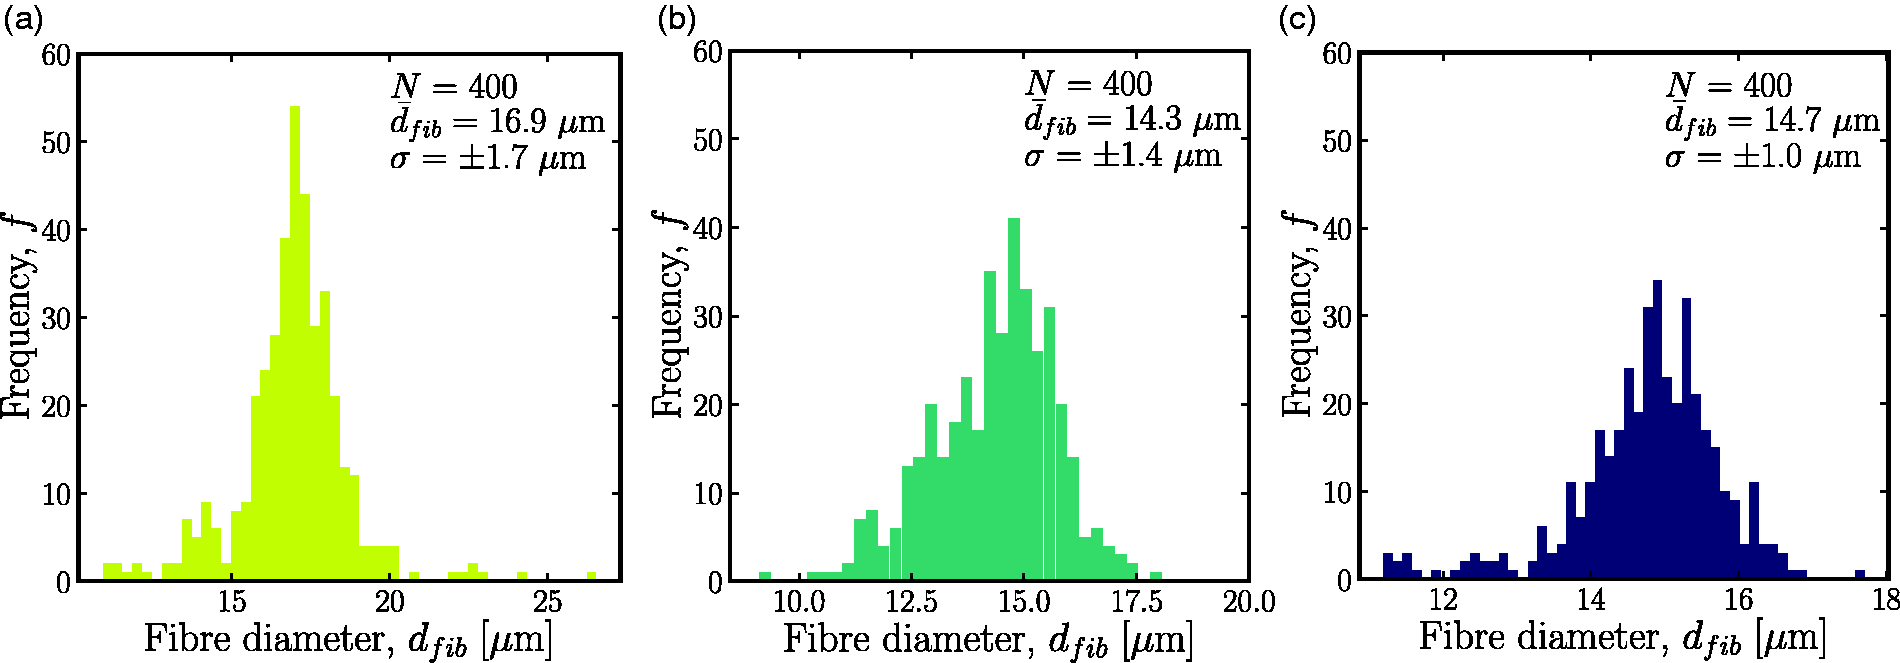
Fibre-diameter distribution for F25 (a), F40 (b) and F100 (c) fabrics.
Orientation distribution of fibres
The level and the character of the orientation distribution of fibres, in the field of nonwoven materials, is conventionally represented by the orientation distribution function (ODF), first introduced by Cox. 35 Two main approaches are used in the literature to obtain ODF: Fourier- and Hough-transform-based methods.23,36–38 These approaches, mainly used in the case of calendered nonwovens, present at least four common limitations. First, the methods split a certain domain (image) into subdomains, which do not guarantee the continuity of the analysed microstructure. Second, they are highly scale-dependent. From this limitation stems an additional one, related to the inability to account for fibre curliness. Last, in the particular case of calendered nonwovens, the presence of bond-areas makes the tracking of fibres impossible. These limitations were overcome by developing a parametric block-based CAD algorithm in CAD software, Rhino® 6.0 + Grasshopper® (Figure 5). In the first step, SEM images of the analysed nonwoven microstructures were rotated to align MD to the y-axis in Rhino®. Splines, non-uniform polynomial curves, were used to mark the central axes of fibres in the SEM images. The algorithm started with the selection of the generated fibres (Figure 4). Then, a number of operations were executed. First, the end points of the selected splines were extracted. A user-defined step size was set to determine the interval by which the splines were discretised into segments with an equal length. The length of such segments was summed to compute the total length of discretised splines (fibre length). The points on the splines and their respective tangent vectors were evaluated. The angle between two consecutive vectors was computed with respect to MD. The angles computed in radians were converted into degrees, averaged and stored in a list. The averaged angles larger than 90°, were decreased by 90°. In this way, all the obtained averaged angles (fibre orientation) were in the interval [0°, 90°] with respect to MD. This choice was made because the material presents three preferential directions: machine, cross and through-thickness directions (MD, CD and TD, respectively). Finally, an array containing the averaged angles and fibre lengths was constructed, with the accuracy manually adjustable with the step size. The first advantage of using this method was its attainable accuracy. In fact, splines followed exactly the shape of the fibres, meaning that their curliness was accounted for in the resulting ODF. This also implies that the method is independent of the scale of the image and, therefore, capable of accommodating better representative micrographs of the material microstructure.
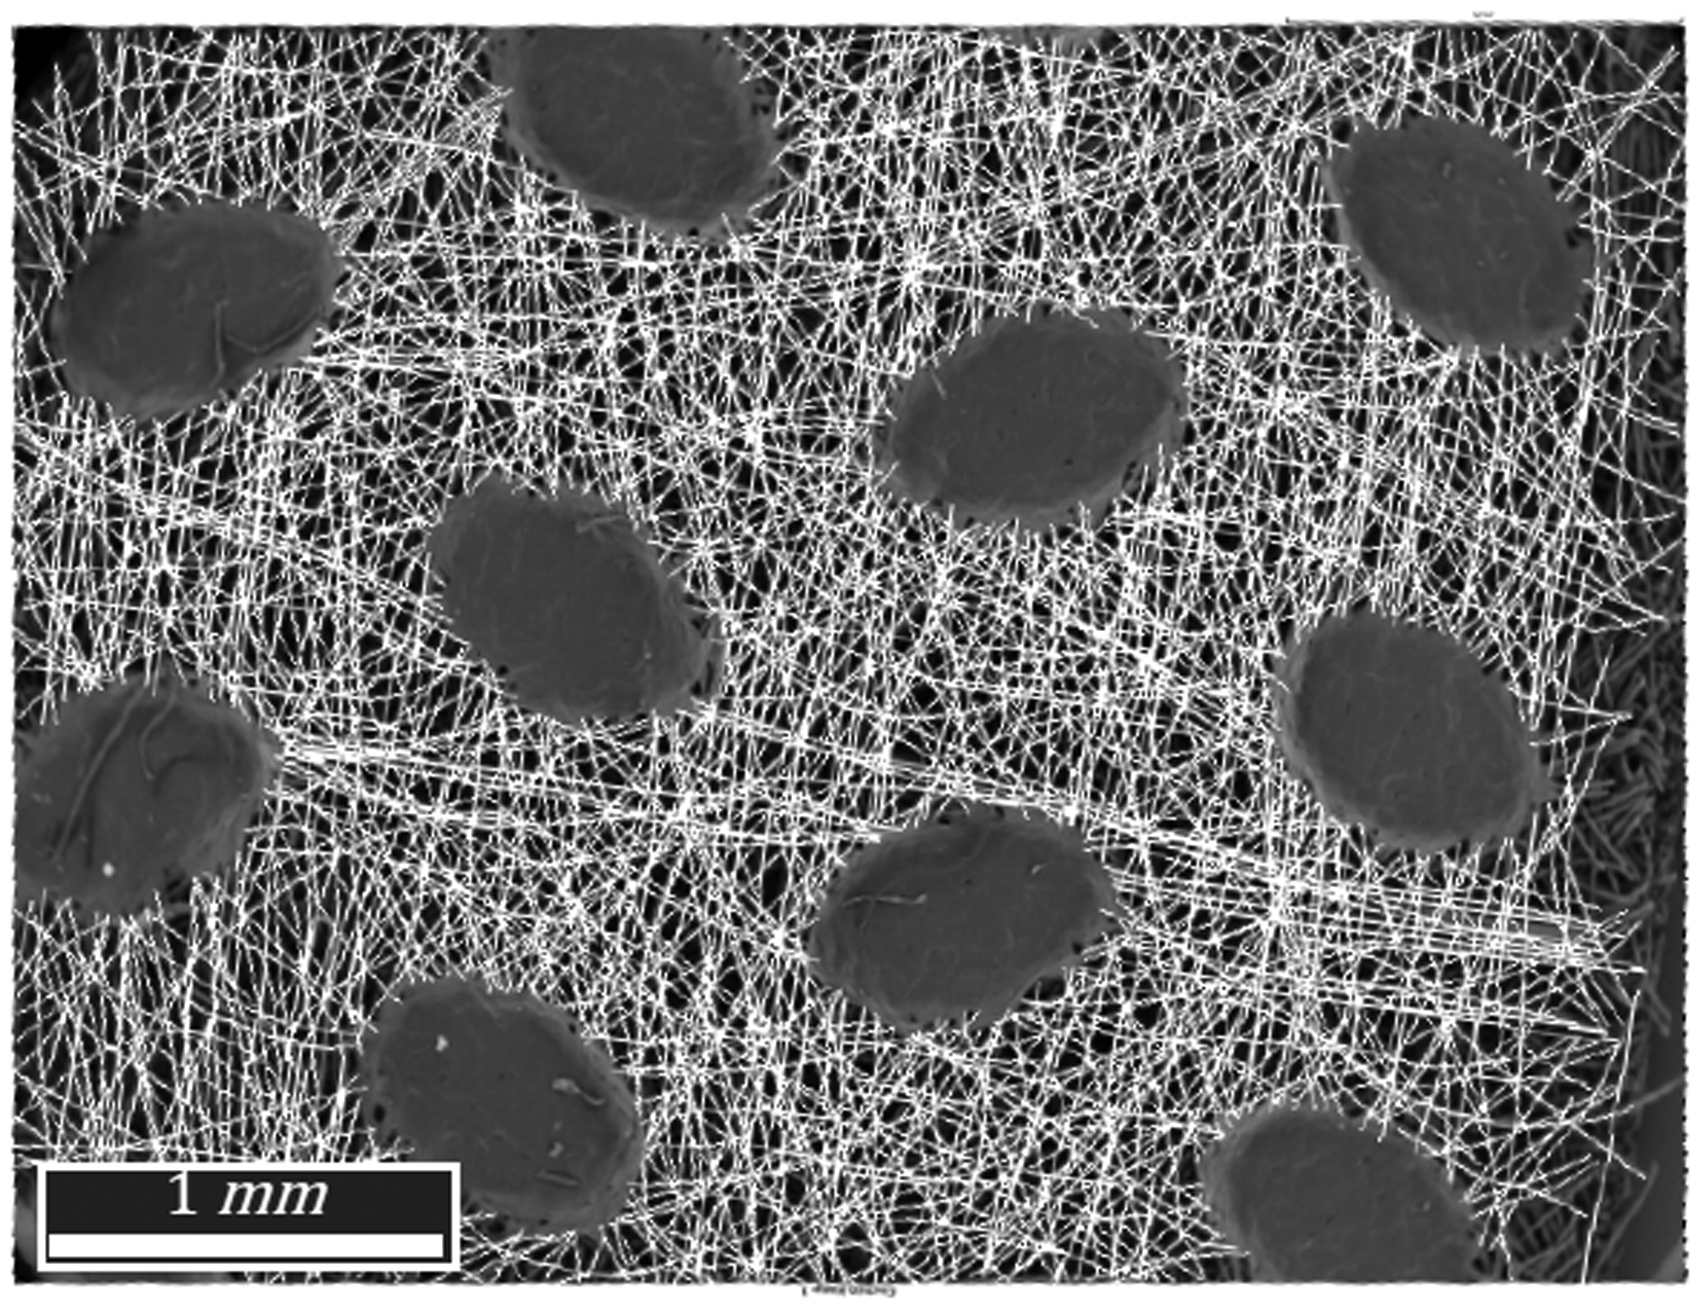
Generated splines (white lines) for fibrous networks of F100 fabric.
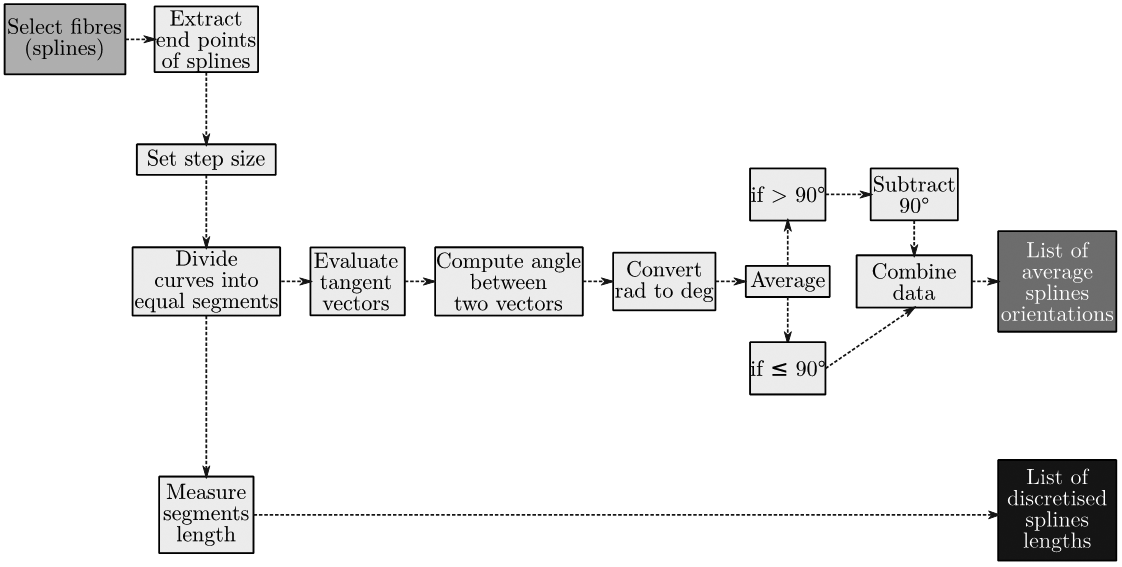
Algorithm for computation of orientation distribution of fibres.
Once the fibre orientation angles were collected for the corresponding generated fibrous networks, their distributions were computed and represented in the form of histograms (Figure 6). The number of measured fibres,
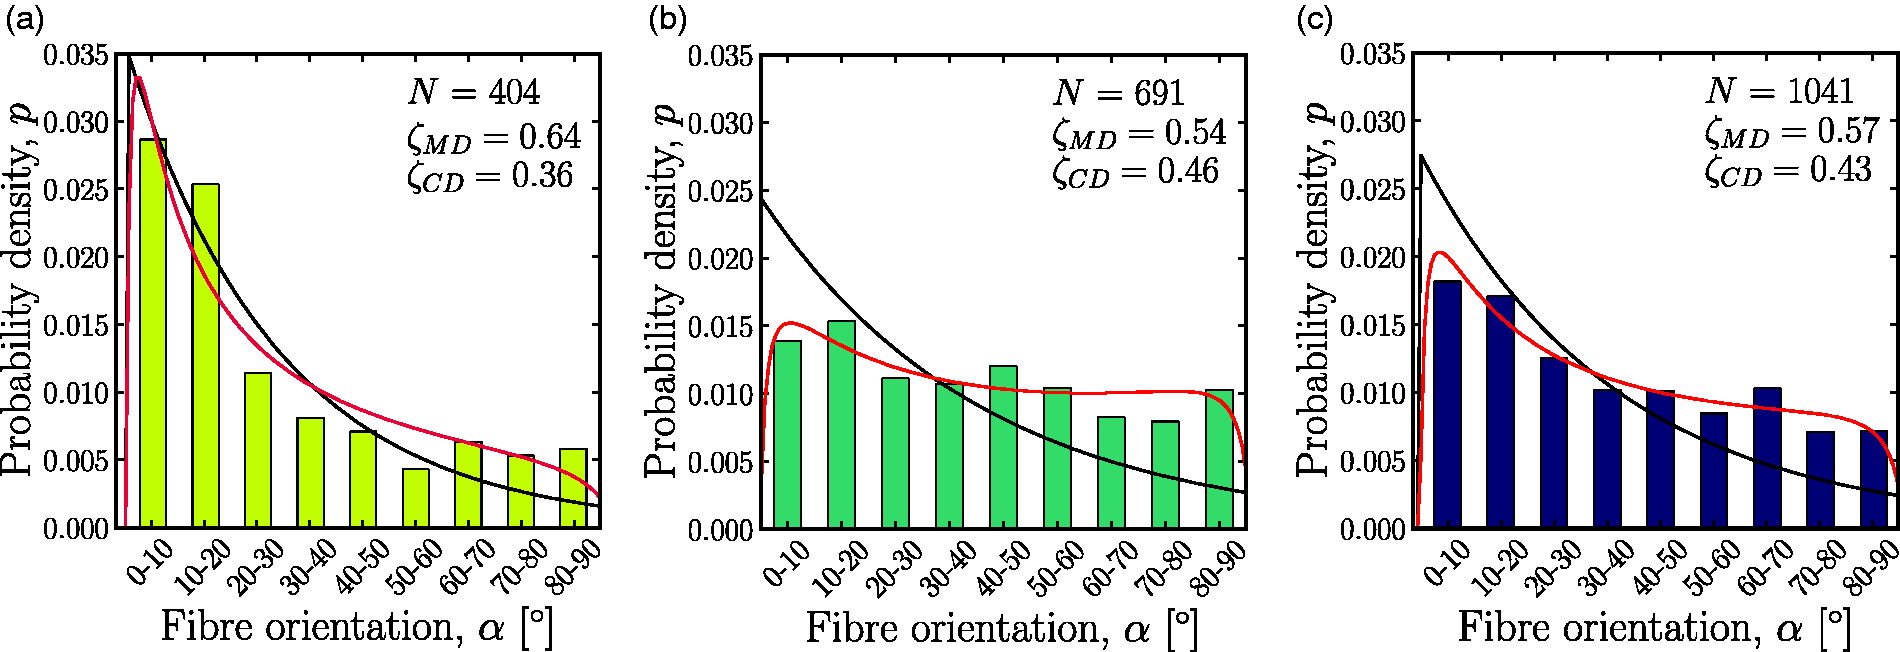
Orientation distribution of fibres with respect to MD in F25 (a), F40 (b) and F100 (c) fabrics.
The Johnson SB probability density function is expressed as:

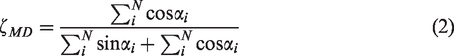
The histograms revealed that a preponderant part of fibres was oriented in MD, but as the planar density increased, more fibres were found to be aligned along CD. The presence of preferential material directions in calendered nonwovens allows to reasonably assume the material to be orthotropic. Then, it is plausible to quantify the level of orthotropy within the material in MD and CD with two ratios:

X-ray micro-computed tomography (CT)
X-ray micro-computed tomography (X-ray µ-CT) was used to gather information about out-of-plane geometric properties of the studied fabrics. Small nonwoven strips were prepared from the selected nonwoven sheets and glued to a thick cardboard sample-holder with a window of 4 × 4 mm2 to avoid movement during scanning. The coupons were placed vertically into an X-ray µ-CT device (XTEK XT-H 160Xi) and scanned for an average time of 9 hours. The obtained 3 D models provided valuable information about the material microstructure as well as their inner structure, see Figure 7.
3 D X-ray µ-CT models of F25 (a), F40 (b) and F100 (c) fabrics.
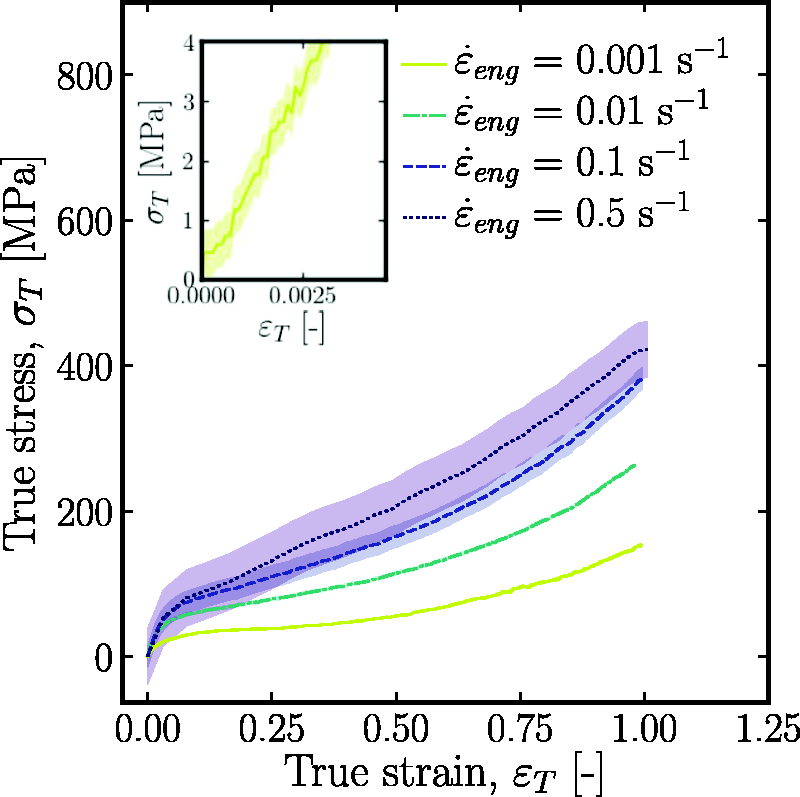
The models were carefully sliced digitally along MD and CD to obtain sectional views for a through-thickness direction of the fabric. From Figure 8, a clear difference in thickness between the consolidated bond region and the fibrous matrix is apparent. In fact, unlike the fibrous matrix, bond-areas are solid, continuous and thinner. A transition zone, referred to as interface region, is also visible between the two regions, in particular, in SEM images. It should be emphasised that most structural and material imperfections take place here as a result of the calendering process.
39
Therefore, damage is likely to initiate from this region and propagate through the fibrous matrix. The averaged geometric properties of each region of the calendered fabrics are reported in Table 1. It should also be highlighted that the dimensions of the interface region should be measured from µ-CT models rather than SEM images as the latter may give erroneous indications. Finally, it is interesting to note that the relation of between the ratio of the bond and matrix thicknesses,
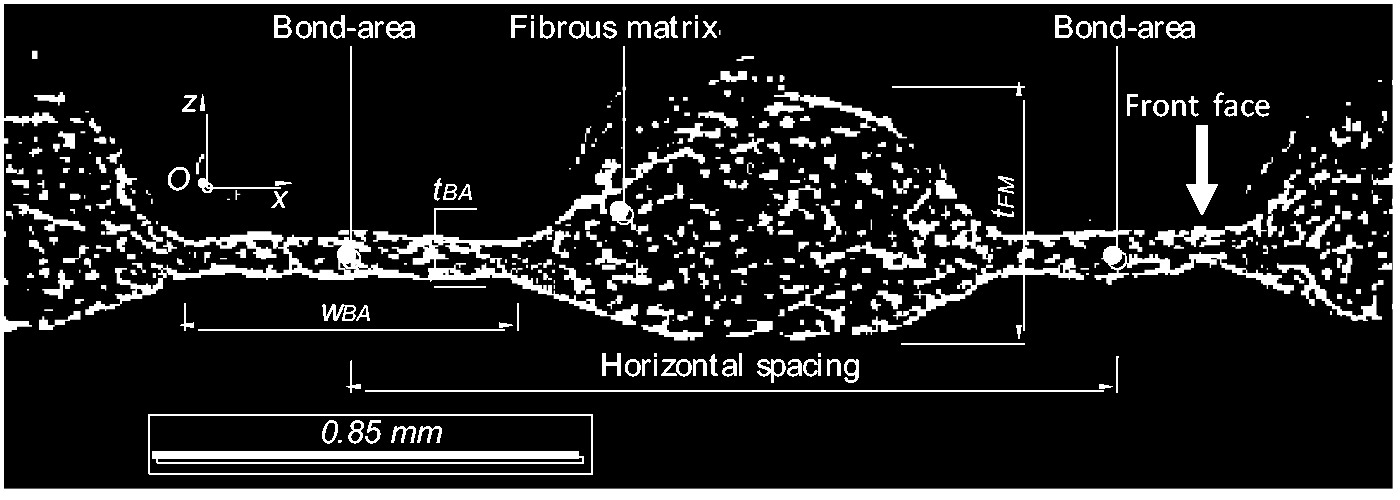
Transversal profile of F100 nonwoven fabric.
Averaged geometric properties of selected nonwovens.
Mechanical behaviour of fibres
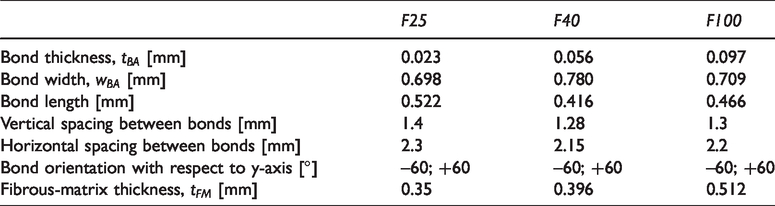
Molecular orientation and degree of crystallinity of fibres change during the bonding process. In fact, the mechanical properties of virgin fibres drastically differ from those of the processed ones. 39 So, it is not possible to use the material properties of virgin fibres, especially for damage analysis of the fabric. In order to analyse the elastic-plastic and rate-dependent behaviour of fibres under uniaxial-tensile loading, a number of tensile tests were conducted. Individual fibres were extracted from the edge of the studied nonwoven fabrics by carefully pulling them with tweezers. Fibres with different lengths were attached to double-layered sticky labels to their ends to enhance the adhesion between them and the clamping device (Figure 9). The gauge length was varied accordingly to the fibre length, measured at each test. Displacement-controlled tensile tests were performed using an Instron Micro-tester 5944 equipped with a high-precision load cell with a load capacity of ±5 N.
Setup of single-fibre tensile test.
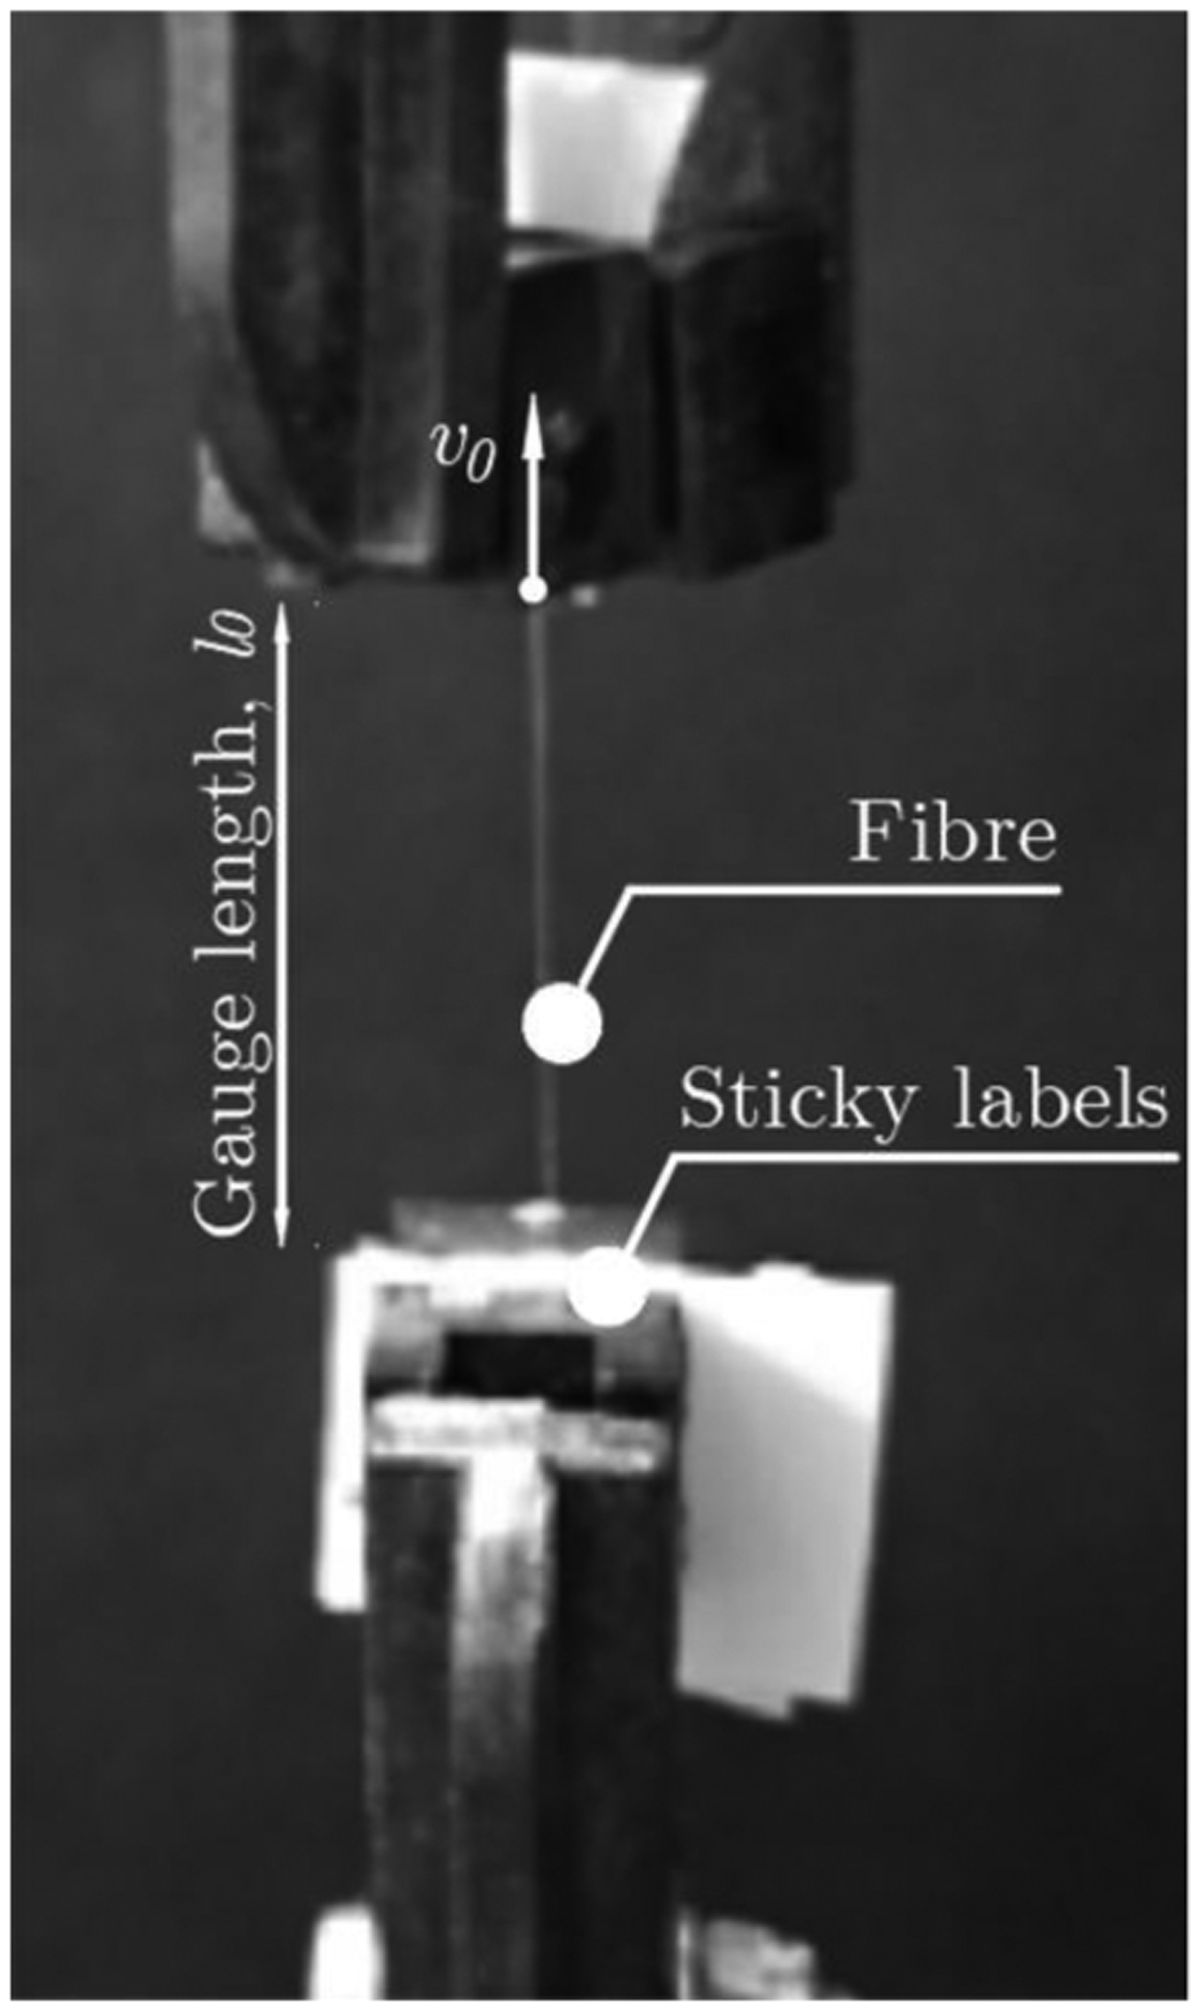
For a study focused on understanding and quantifying the elastic-plastic material properties of fibres, quasi-static tensile tests were conducted at four constant engineering strain rates,
True stress-strain curves of (70/30) PP/PE fibres at various strain rates.
An example of mean stress-strain curve obtained from tests conducted at 0.001 s−1 is shown in Figure 11. Determination of the Young’s modulus,
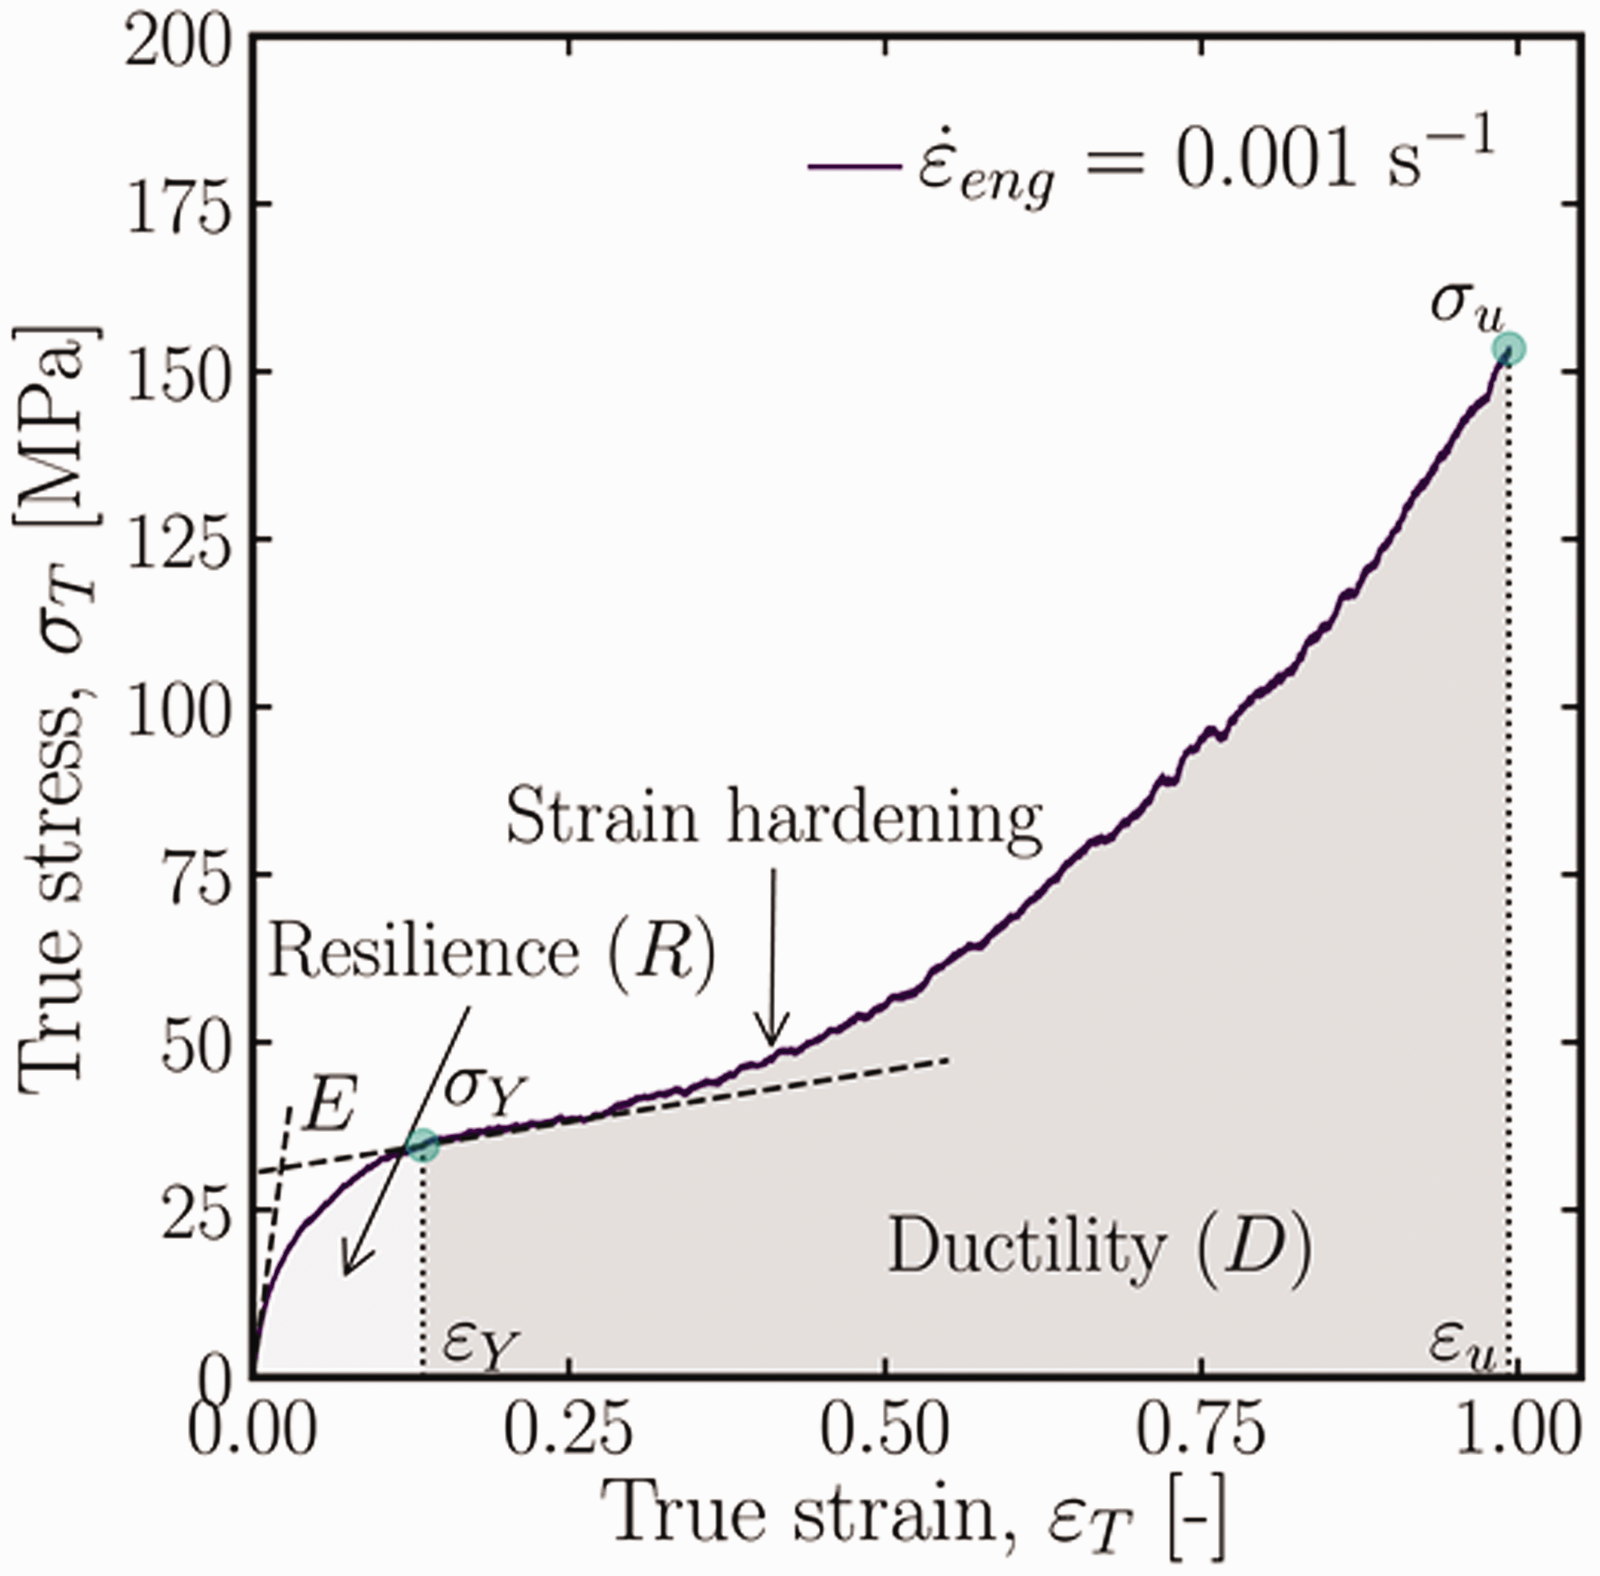
Mean mechanical properties of (70/30) PP/PE fibre at strain rate 0.001 s−1.
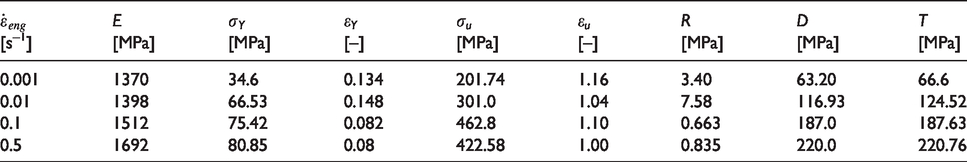
The mean mechanical properties of (70/30) PP/PE fibres tested at various strain rates are provided in Table 2. As expected, an increase in strain rate led to an increase in the yield strain and the ultimate (fracture) strength
Mean mechanical properties of (70/30) PP/PE fibre at various strain rates.
Mechanical behaviour of fabric
As discussed, the tensile behaviour of nonwoven fabrics was studied in various works, but insufficient attention was given to calendered nonwovens. Hou
42
found that specimens with an aspect ratio − length to width − smaller than 1 were not representative of the fabric and also affected by edge effects. So, in our study, rectangular strips of dimensions 25 mm (width) and 100 mm (length) were cut out from the nonwoven sheets of F25, F40 and F100. This size guaranteed the adequate specimen clamping with a gauge length of 40 mm. A fine layer of sandpaper was attached to the serrated rubber clamps to enhance the sample-to-grip contact and prevent specimens from slipping, in particular, those characterised by low density − F25. A 2-kN load-cell was mounted on the testing machine (Instron 5944) to record the load continuously. A DSRL camera (Canon EOS 200 D) was placed in front of the sample to record the tests (Figure 12). Particular attention was taken to ensure that the sample’s front face was always kept in front of the camera. This task was eased by the fact that the back face of calendered nonwovens is typically flatter than its front face (Figure 8). In order to improve and enhance the sample-to-background contrast for subsequent image processing, a diffused-light panel was placed at the rear of the sample. Due to nonuniform thickness of calendered nonwovens, the normalised force,
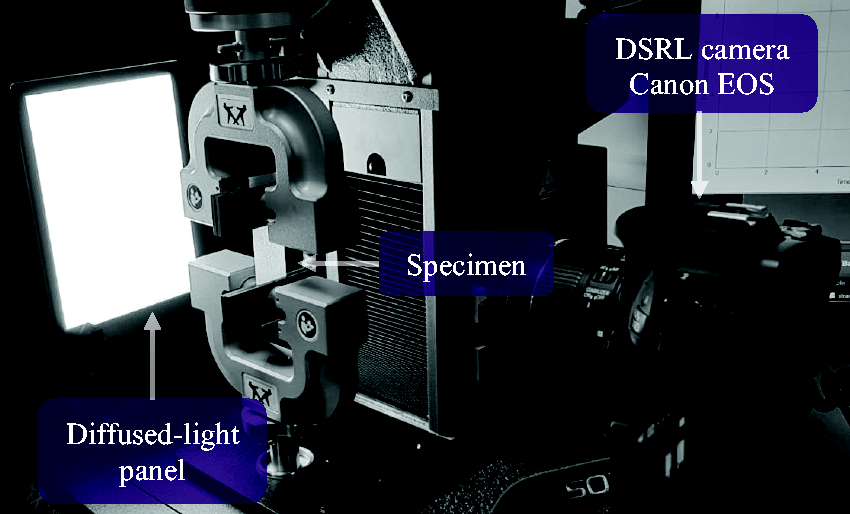
Setup of uniaxial-tensile test.
The study was designed to gain insight into the effects of the planar density, loading direction (0°, 30°, 45°, 60°, and 90°), strain rate (0.01, 0.1 and 0.5 s−1) and planar density on the mechanical response of the fabrics. A minimum of 10 tests were performed for each loading case, leading to a rather substantial total number of experiments.
Effect of fabric planar density
The planar density in calendered nonwovens is nonuniform throughout the fabric, like the fabric’s thickness. These two design parameters impart the fabric’s nonuniform and heterogeneous character. Related to heat transfer during the bonding process, variation in planar density changes the mechanical behaviour of fibrous mats drastically. For this reason, this work focussed on three calendered nonwovens with different planar densities. The mechanical response of the selected fabrics is depicted in Figure 13(a). Four main conclusions can be drawn here. First, the uniaxial-tensile response of calendered nonwovens is mainly nonlinear elastic, with strain hardening up to the onset of damage and softening up to complete failure. Second, apparently, as the planar density increased, the fabric’s stiffness increased drastically. In particular, while the ultimate strength decreased with a decrease in the planar density, the strain increased significantly. This mechanism can be ascribed to the fact that the fibres between the bonds are relatively long in low-density fabrics due to their curvature. 10 Furthermore, the elastic response, that in the F100 fabric was nearly linear, became nonlinear in the F25 and the F40 fabrics. Local deformations in high-density fabrics were found to develop in a more uniform manner (approximately affine deformations) compared to their counterparts (non-affine deformations), as also demonstrated in. 43 Third, a peculiar aspect was that the behaviour of fabrics differed from that of individual fibres. This phenomenon could be attributed to the fibres’ reorientation mechanism. According to experiments conducted by Hou et al. 29 on low-density calendered nonwovens, the deformation mechanism of the material also depends on the bond pattern and its nonuniform microstructure. Finally, it was found that, as the density increased, the fabric rupture was quasi-brittle, showing a flat rupture surface compared to the (ductile) cup-and-cone one in low-density fabrics (Figure 13(b) to (d)).
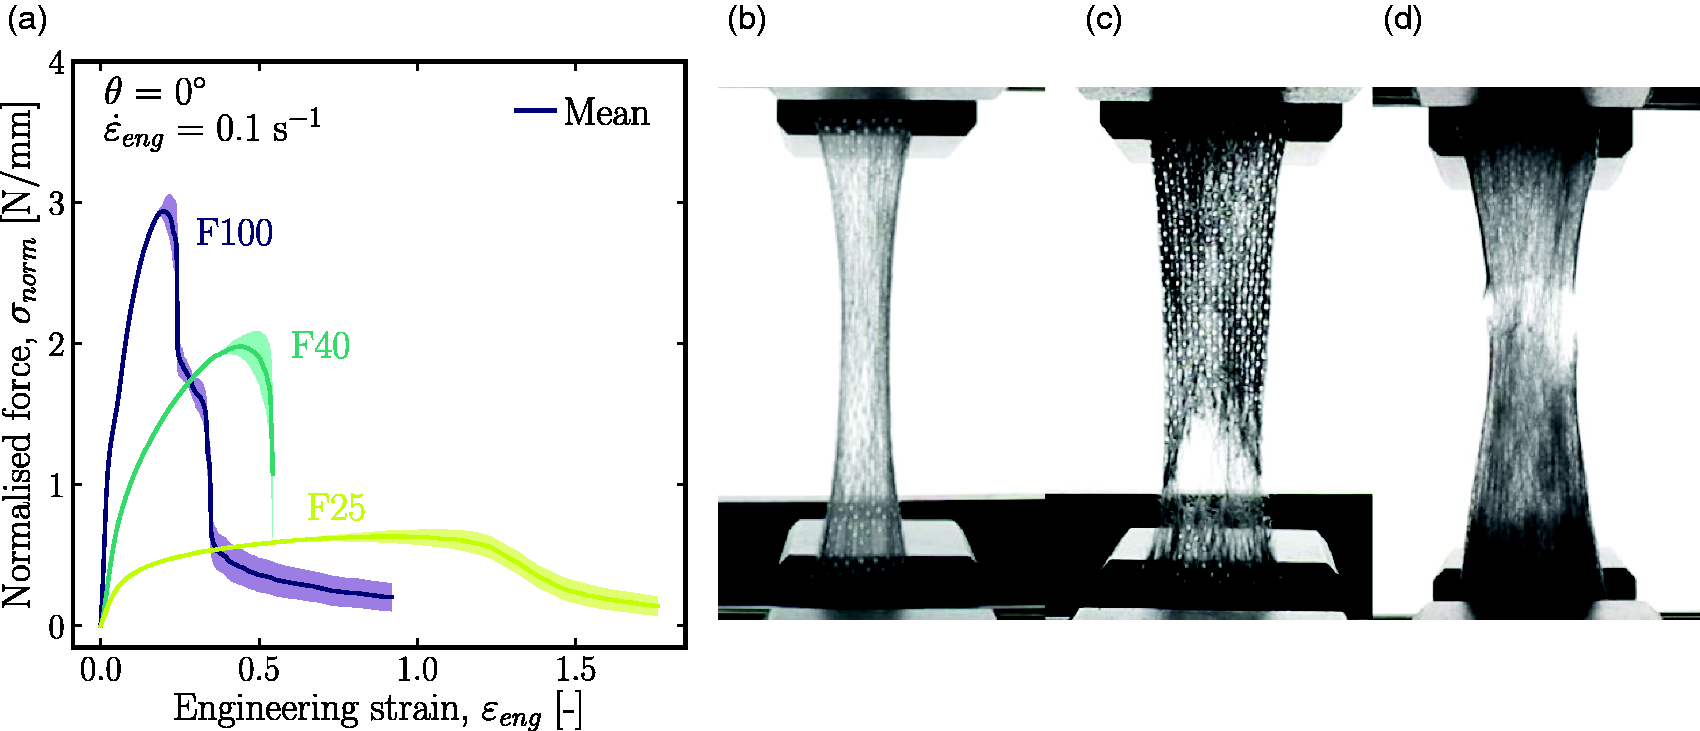
Normalised force vs. engineering strain curves of studied fabrics in MD at strain rate 0.1 s−1 (a). F25 (b), F40 (c) and F100 (d) fabrics stretched at 120%, 100% and 80%, respectively.
Specifically, the deformation, damage and failure behaviours in tension of nonwovens were observed to develop as in Figure 14. Such complex mechanical behaviour includes unfolding and straightening of curly fibres together with the activation of their axial stiffness in carrying the applied load, development of large deformations and rotations of fibres, transfer of load from fibres to interface regions and bond-areas. In our experiments, it was observed that damage initiated at the bond periphery, as this is the weakest phase in calendered nonwovens. This mechanism favoured the detachment of bonds from the fibrous matrix (fibre pull-out) and their consequent disintegration.
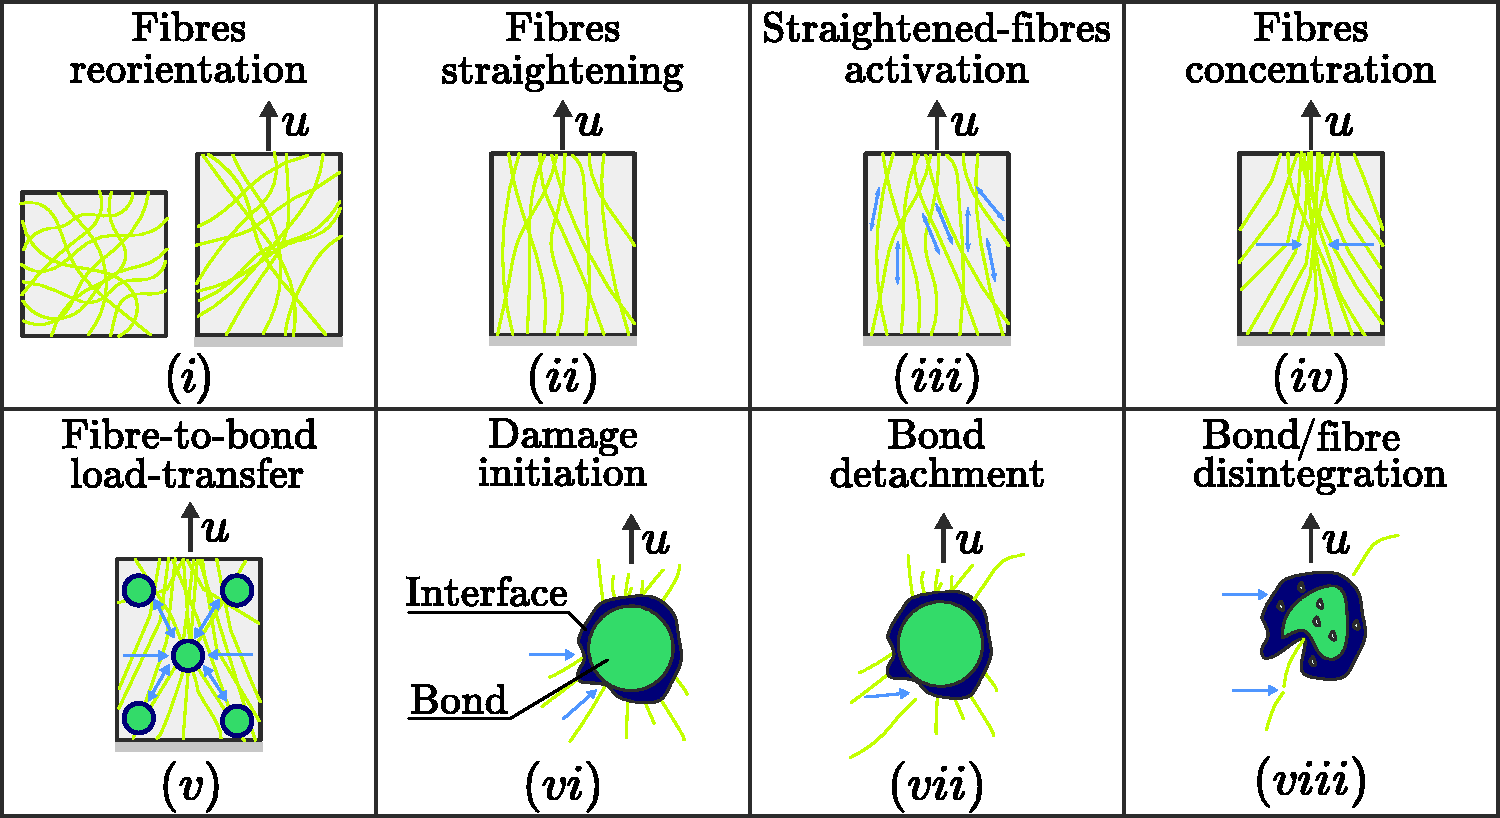
General deformation, damage and failure mechanisms of nonwoven materials.
Effect of fabric planar density and loading direction
Nonwoven fabrics are manufactured with fibres having random orientations. As a result of the manufacturing process, these fabrics exhibit anisotropic mechanical properties. In order to observe the effects that anisotropy exerts on the mechanical response, the fabrics were tested in various loading directions −0°, 30°, 45°, 60° and 90° with respect to MD for the strain rates reported earlier. Potential load-transfer mechanisms in fabrics subjected to loading in various directions could develop in the configurations schematically illustrated in Figure 15.
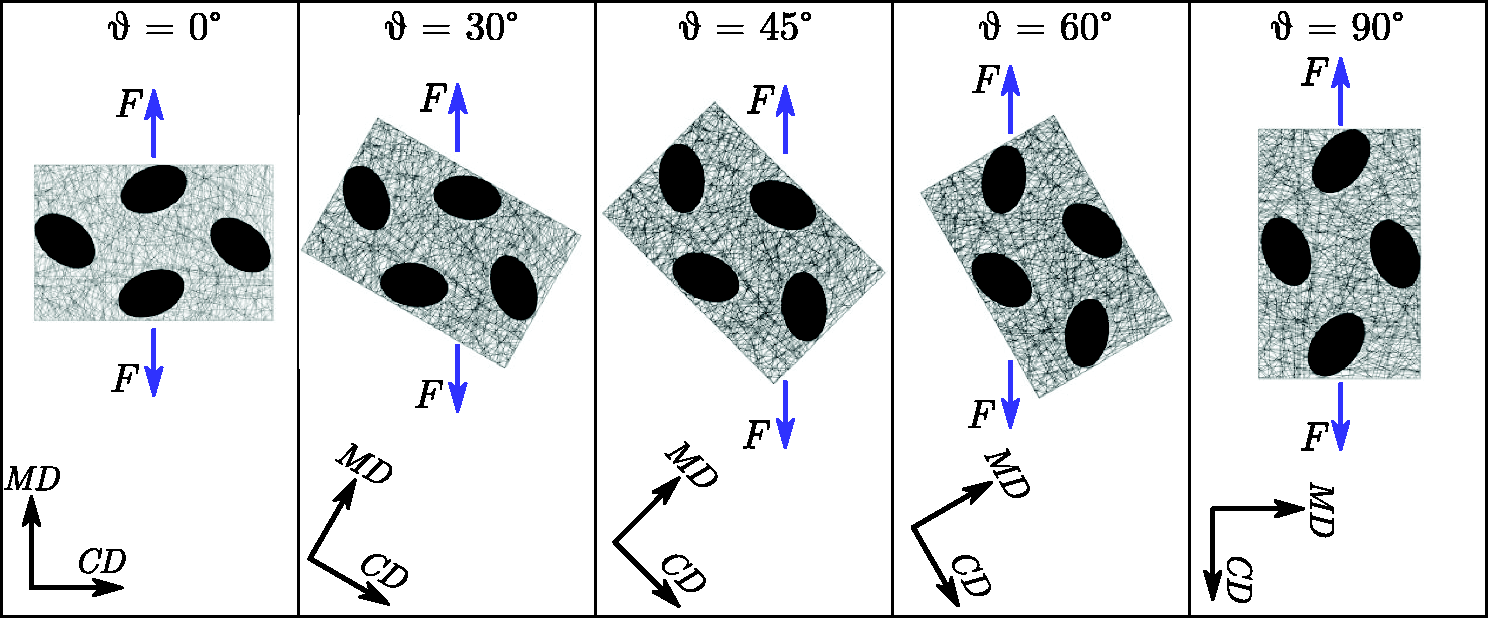
Microstructures of F100 fabric oriented in various directions.
In this section, only the mechanical responses obtained at strain rate 0.01 s−1 are shown for brevity. Further details can be found in Supplementary Material. The mechanical response of fabrics, as function of the loading direction, is shown in Figure 16.
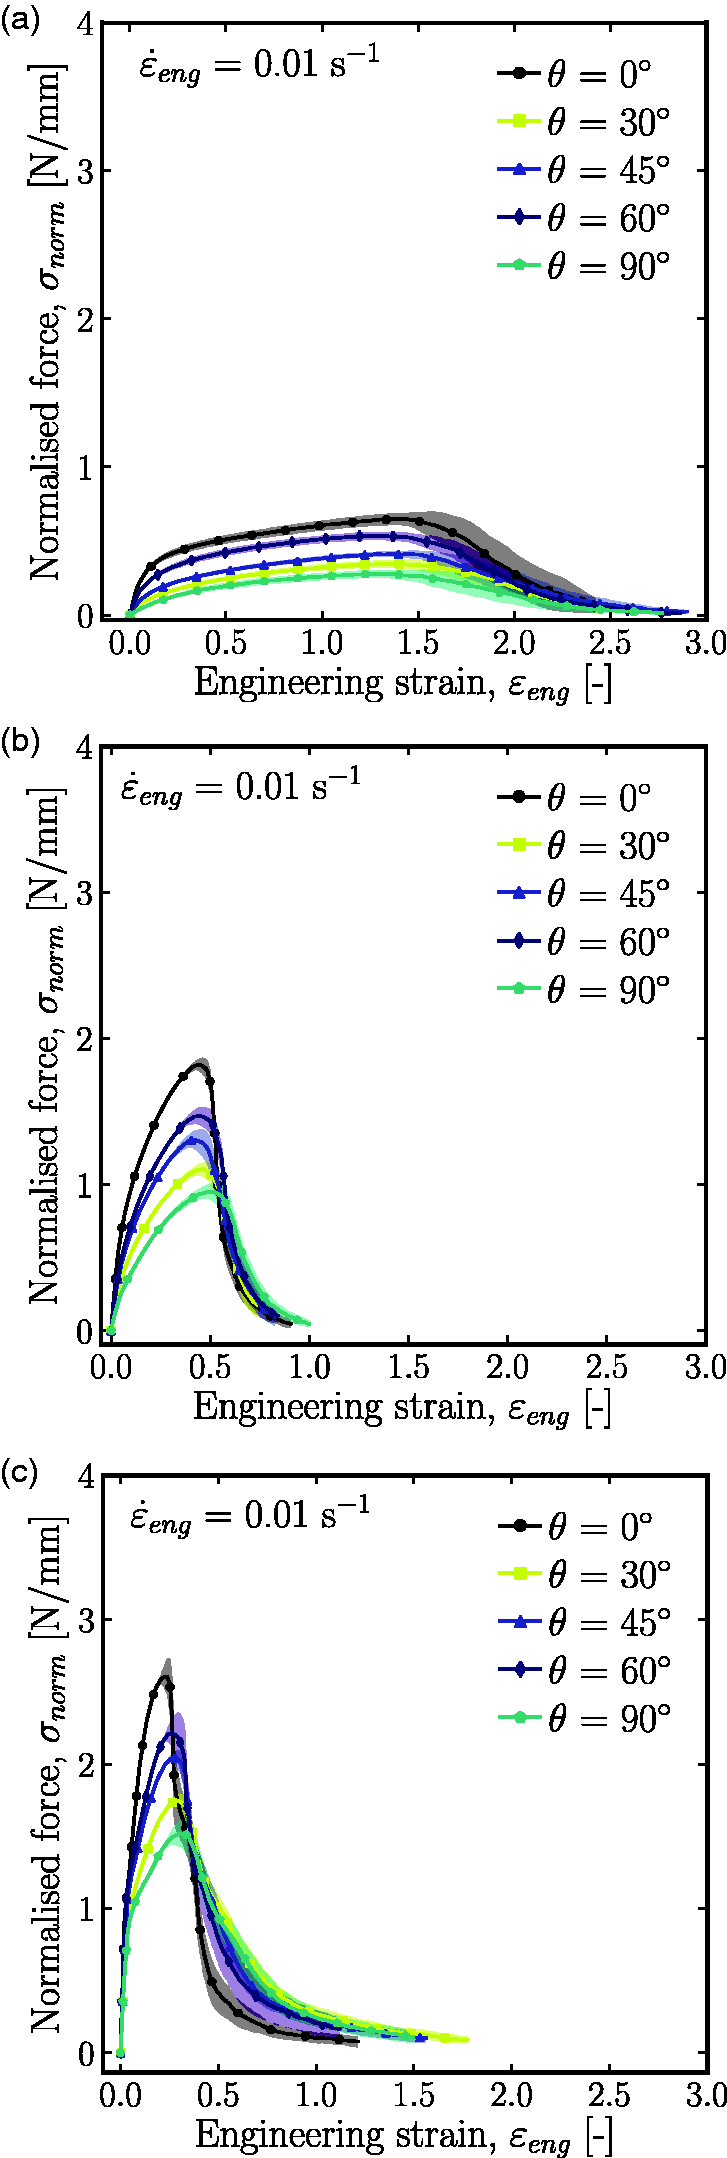
Normalised force vs. engineering strain curves of F25 (a), F40 (b) and F100 (c) fabrics stretched in various directions with respect to MD at strain rate 0.01 s−1.
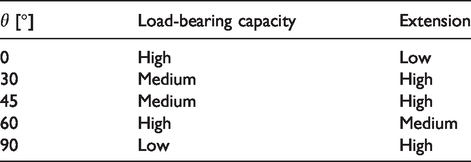
The results revealed the existence of a pronounced difference in the mechanical behaviour of the fabrics tested in various loading directions. As expected, the fabrics stretched in MD exhibited a considerable ability to withstand a high level of loading and relatively modest stretchability. In contrast, the specimens tested at 60°, demonstrating the second highest strength, were the least prone to stretching, as the orientation of some of the bond-areas coincided with that of the loading direction, partially limiting their rotation and contributing to development of high strength. In the same way, the mechanical response of the fabrics stretched at 30° demonstrated excellent ability to deform, but poor strength. A behaviour intermediate to those of the last two cases was found in the samples tested at 45°. Finally, the lowest value of strength was observed in the fabrics loaded in CD together with high strain due to reorientation of fibres. These findings are summarised in a qualitative manner in Table 3. The results revealed the existence of a balance between the load-bearing capacity and the extension level.
Effect of loading direction on mechanical performance of studied nonwoven fabrics.
The tests were filmed and processed in order to illustrate evolution of the mechanical behaviour of the fabrics at various levels of extension. For the sake of simplicity, only the case of the F100 fabric stretched in MD and CD at strain rate 0.01 s−1 is presented here (further information is reported in Supplementary Material). A graphical presentation of deformation and failure evolutions of the tensile-loaded nonwoven is shown in Figure 17. The illustration was accurately scaled to help take measurements of the deformed samples. At 20% extension, the fabric showed some necking behaviour and, as the extension level progressed, the failure of the back layer (layer II) occurred. Subsequent stretching led to the rupture of the front layer (layer I), with a significant drop in force. At this stage, the softening behaviour set on, with the formation of a bundle of fibres resulting from their disentanglement and progressive re-alignment of fibres. Softening was found to dominate for almost half of the deformation process until the last fibre ceased to carry the load. A similar mechanical behaviour was observed in the F100 fabric stretched in CD. However, in this case, the necking effect appeared to be more pronounced as compared to the previous case. This phenomenon can be simply explained by the fact that fibres, mainly laterally oriented, did not have enough flexural stiffness to counteract the transversal contraction forces. Moreover, fibres underwent an important reorientation process that delayed the fabric failure. From a microscopic standpoint, it was found that the mechanical behaviour of the fabrics was mainly controlled by the properties of fibres and bonding regions. The former determined the nonlinear behaviour before the peak load, while the bond-areas and interface regions controlled the localisation of damage after this peak. The stiff bond regions underwent deformation before their disintegration. Finally, the interface regions were found to be the weakest zones in the material and, therefore, loci of damage initiation. After a crack developed in a stretched material, it kept growing as the material deforms. The shape and the orientation of the crack in a nonwoven changed continuously during the deformation process, making impossible any measurement. Therefore, the rupture paths illustrated in Figure 17, are only an approximation of the reality, especially in low-density nonwovens, where the conversion of cracks into straight fibres (remaining fibres) is overt. For this purpose, it must be pointed out that measurements should be made in situ to avoid the material’s spring-back effect as soon as it is unclamped. This graphical presentation could also serve to validate numerical simulations.
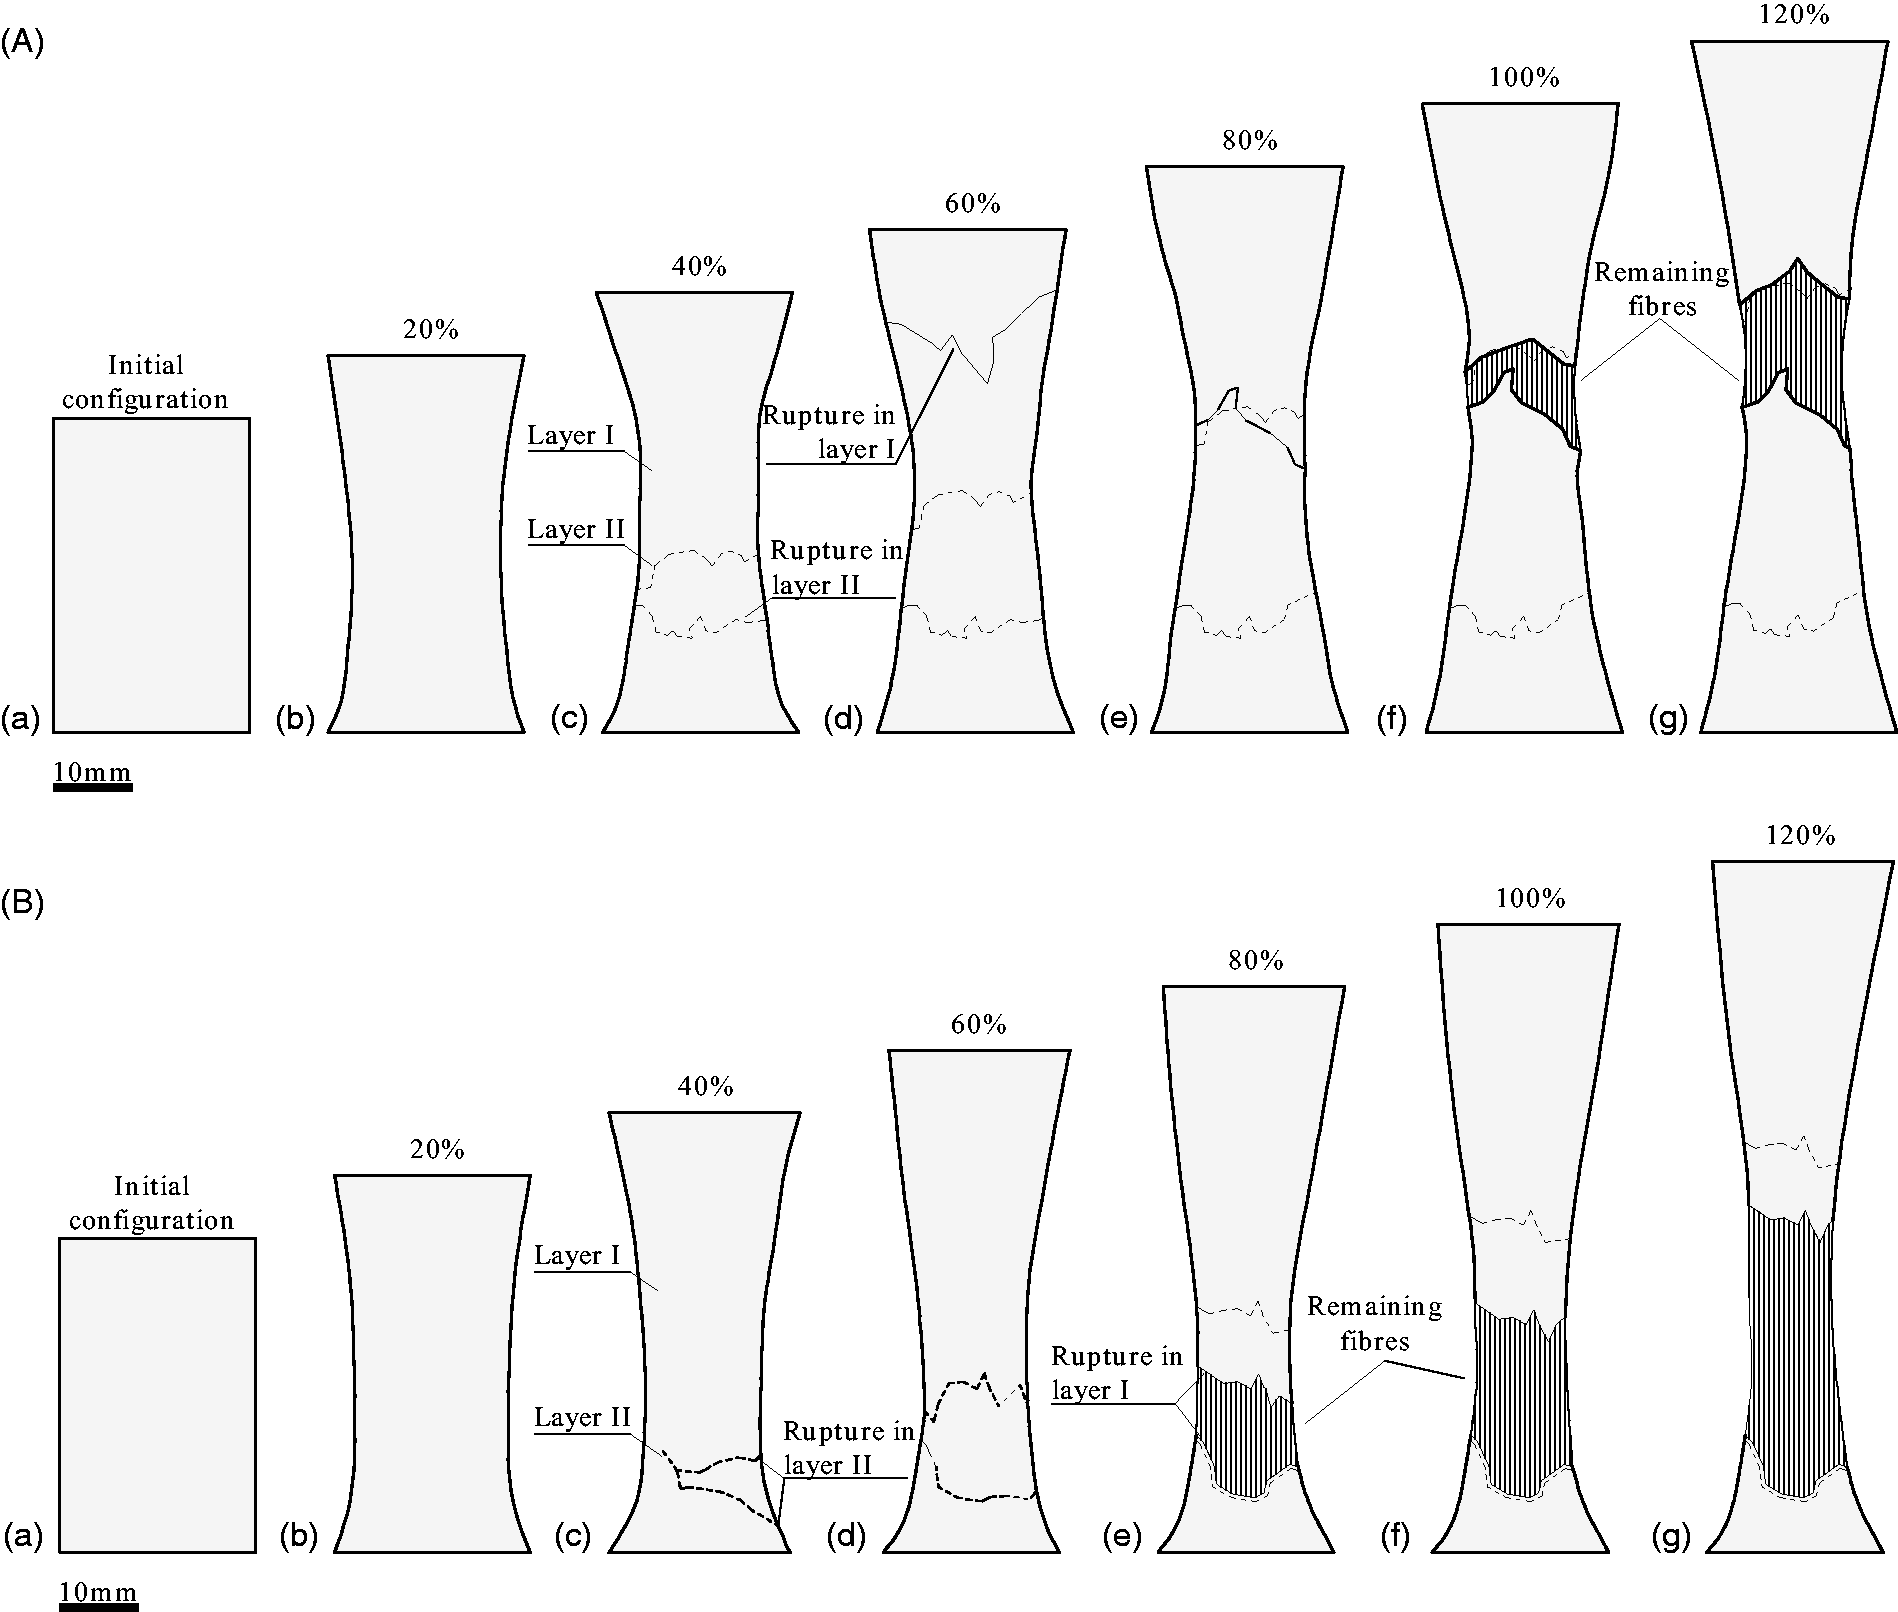
Deformation, damage and failure evolution of F100 fabric stretched in MD (A) and CD (B) at strain rate 0.01 s−1.
Effect of loading direction and strain rate
As shown in ‘Mechanical behaviour of fibres’ section, the strain rate strongly affected the mechanical response of fibres. An attempt was made to see whether this phenomenon occurred in fabrics as well. The fabrics were tested at various strain rates −0.01, 0.1 and 0.5 s−1 (see Supplementary Material). For the sake of brevity, only the results obtained for the F100 fabrics loaded in various directions are reported therein. Regardless of the applied strain rate, all the curves demonstrated the same trends of the mechanical response (Figure 18). As the strain rate increased, higher stress and lower strain levels were observed. This reflected the viscous behaviour of polymer-based fibres. However, this effect appeared to be rather minimal compared to that in individual fibres. This peculiar aspect may be attributed to the level of anisotropy in the material’s microstructure and, once again, the marked contribution of the fibres’ reorientation mechanism.
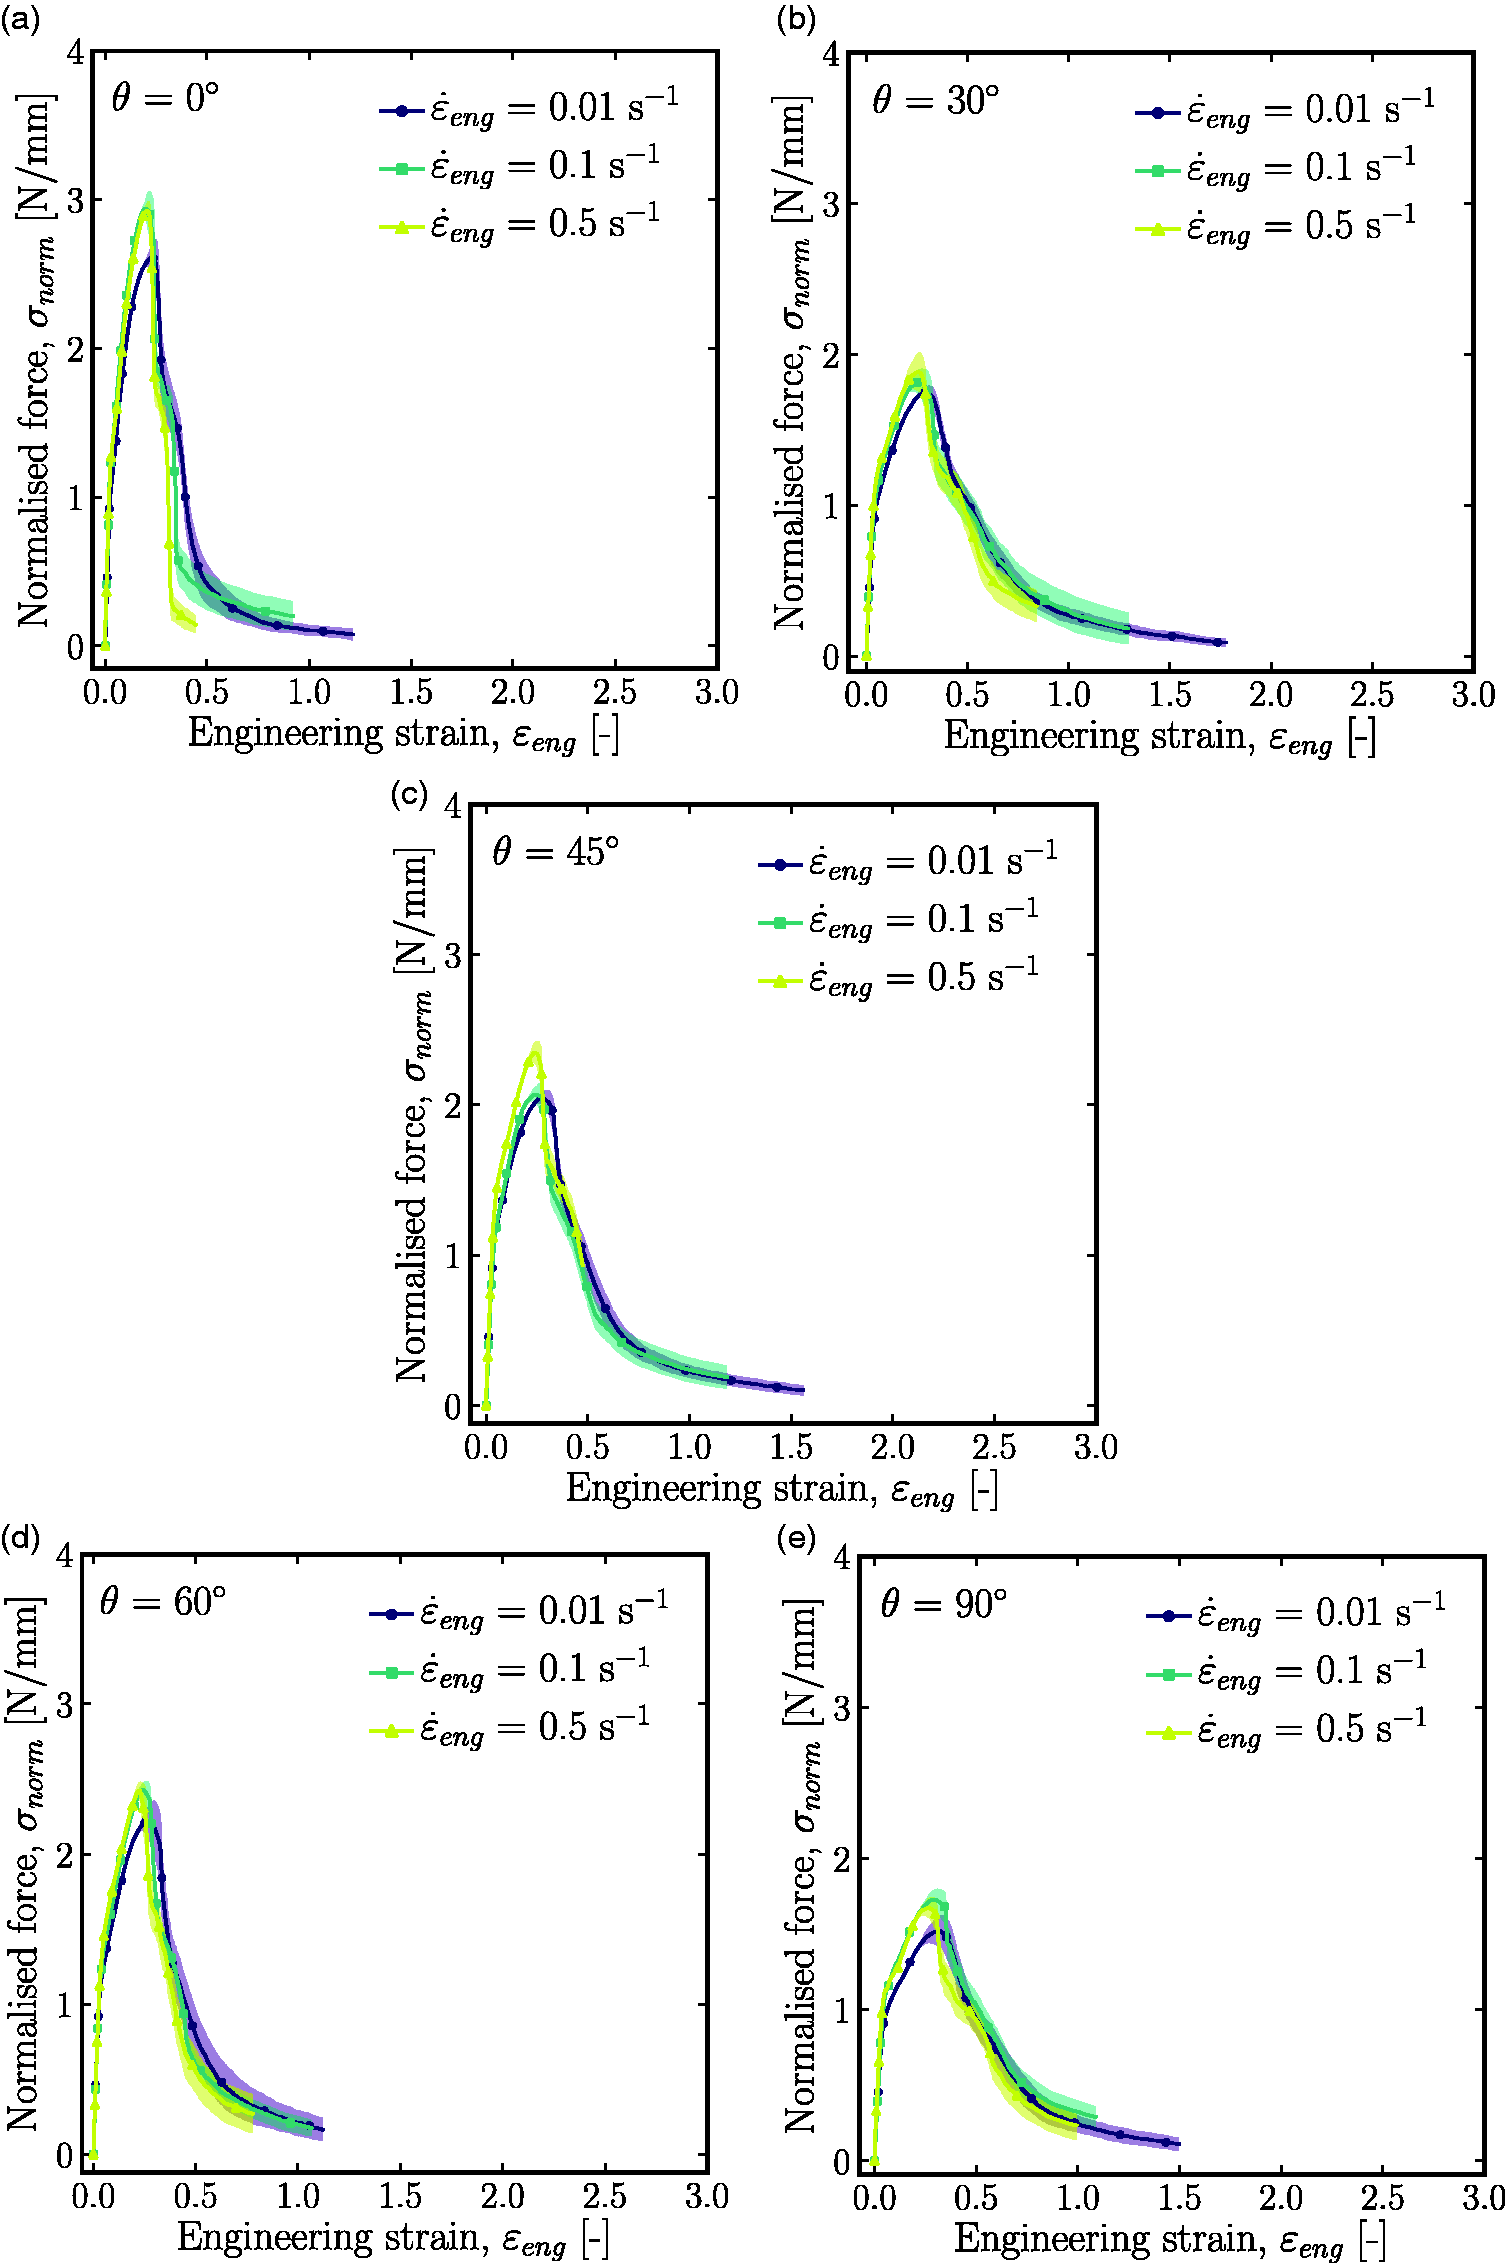
Normalised force vs. engineering strain curves of F100 fabrics stretched at 0° (a), 30° (b), 45° (c), 60° (d) and 90° (e) with respect to MD at various strain rates.
Anisotropic effects as function of strain rate
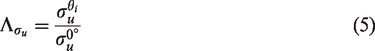
The experimental observations presented in ‘Effect of fabric planar density and loading direction’ section revealed that as the loading direction varied, the fabric’s mechanical response drastically changed as well. The basic form of anisotropy in nonwoven fabrics is determined by the way the fibrous web is originally laid down. The classical approach for quantifying anisotropy is to use the so-called anisotropy ratio. Since the effect of anisotropy manifests in elasticity, plasticity and failure of the fabric, the Young’s modulus and ultimate stress were considered to quantify such mechanism, both in the elastic and plastic domain. The machine direction (0°) was chosen as the reference direction. The anisotropy coefficient referring to elasticity, 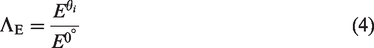
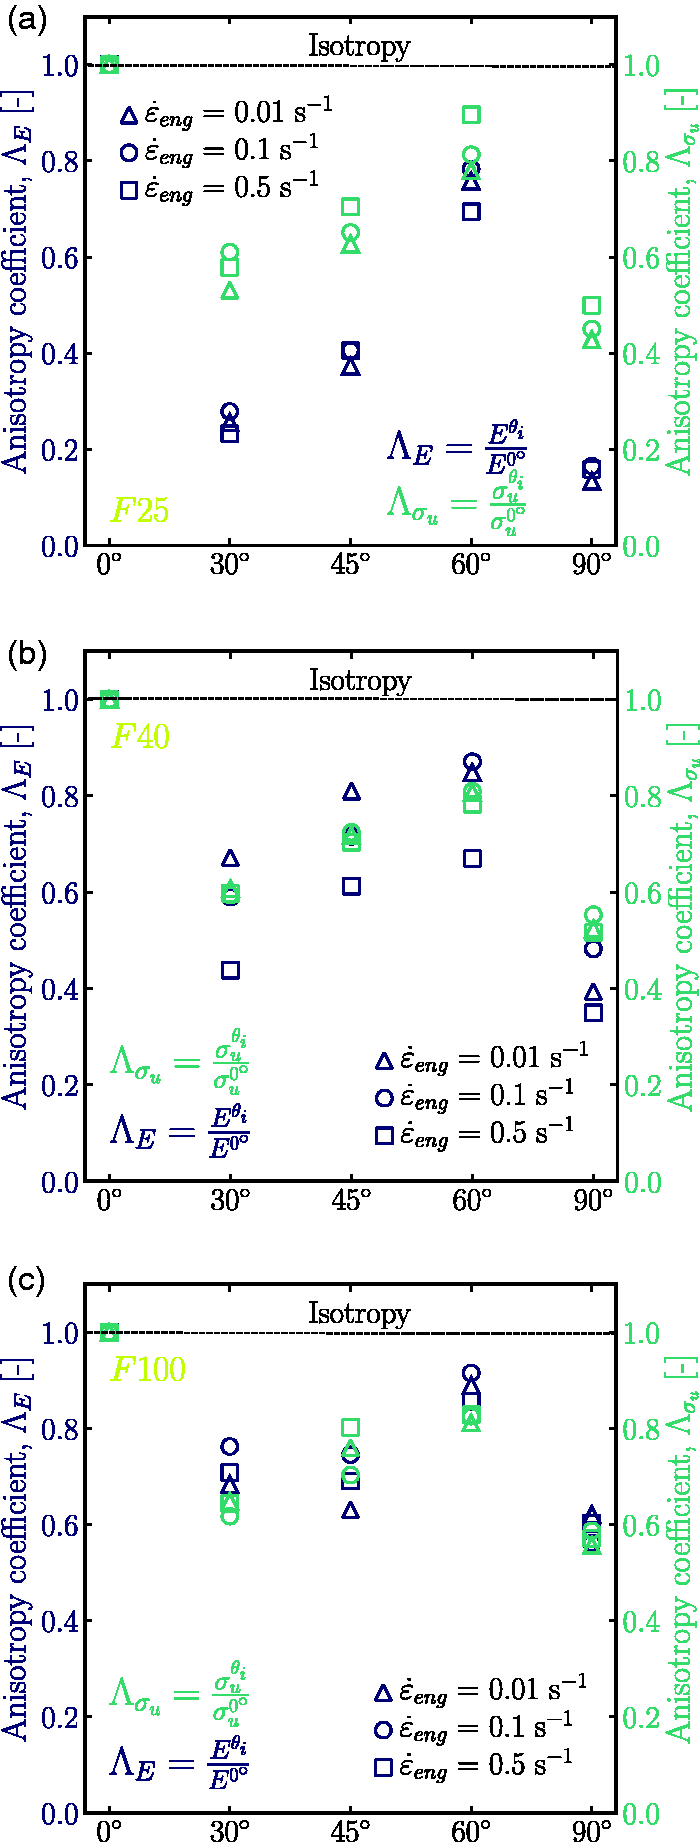
Anisotropy coefficients of F25 (a), F40 (b) and F100 (c) fabrics.
Conclusions
Individual fibres were tested at various strain rates to study their rate-dependent effects. Fibres displayed nonlinear elasticity followed by plastic strain hardening for almost the entire deformation process up to failure. The strain rate was found to play a significant role in the mechanical response of individual fibres, with an increase in stress as the strain rate increased.
Fabrics were stretched uniaxially along various directions and at various strain rates to study the anisotropic and rate-dependent effects on the mechanical response of the material. Deformation, damage and failure mechanisms were observed experimentally. The deformation behaviour of fabrics comprised three regimes: nonlinear elastic, elastic-plastic with strain hardening up to necking and, finally, softening. Differences were found in the mechanical behaviour of fabric compared to that of individual fibres. Unlike in fibres, the strain rate had a minimal effect on the fabric’s response, while the loading direction played a substantial role. This phenomenon could be attributed to the level of anisotropy within the material, which is mainly a function of the orientation distribution of fibres and bond pattern. Furthermore, the balance between the load-bearing capacity and the extension level of fabrics was also demonstrated. Specific mechanical features, for instance, higher toughness, could be achieved by optimising design parameters, i.e. planar density. Although the planar density played a relevant role in the mechanical response of uniaxially-stretched calendered fabrics, the loading direction (anisotropy) was found to be the most crucial parameter in this study.
These findings would lend themselves well for development and validation of a numerical model that will be presented in a forthcoming publication.
Supplemental Material
sj-pdf-1-jcm-10.1177_0021998320976795 - Supplemental material for Anisotropic mechanical behaviour of calendered nonwoven fabrics: Strain-rate dependency
Supplemental material, sj-pdf-1-jcm-10.1177_0021998320976795 for Anisotropic mechanical behaviour of calendered nonwoven fabrics: Strain-rate dependency by V Cucumazzo, E Demirci, B Pourdeyhimi and VV Silberschmidt: SIMS study group in Journal of Composite Materials
Footnotes
Authors’ contribution
Declaration of Conflicting Interests
The author(s) declared no potential conflicts of interest with respect to the research, authorship, and/or publication of this article.
Funding
The author(s) disclosed receipt of the following financial support for the research, authorship, and/or publication of this article: This work was supported by The Nonwovens Institute of North Carolina State University, Raleigh, NC [grant no. 16-196, 2017]. Reicofil GmbH & Co. KG (Germany) and Fibertex Personal Care A/S (Denmark) generously provided materials for this study. This support is gratefully acknowledged.
Supplemental material
Supplemental material for this article is available online.
References
Supplementary Material
Please find the following supplemental material available below.
For Open Access articles published under a Creative Commons License, all supplemental material carries the same license as the article it is associated with.
For non-Open Access articles published, all supplemental material carries a non-exclusive license, and permission requests for re-use of supplemental material or any part of supplemental material shall be sent directly to the copyright owner as specified in the copyright notice associated with the article.