
Abstract
A numerical process simulation framework is introduced in this paper to describe and predict the process temperature evolution during the laser-assisted tape winding (LATW) process of a type-IV pressure vessel made of glass-reinforced high-density polyethylene (G/HDPE). A local optical-thermal model is fully coupled with a global thermal model for the simulation of continuous adjacent hoop winding cases. The predicted tape and substrate temperatures are compared with the experimental data to validate the process model’s effectiveness. The inline temperature was measured by an infrared thermographic camera during the continuous winding. The continuous process temperature of the substrate is affected significantly due to the previously wound layers including the pressure vessel, and a gradual increase of the temperature of the roller and the air inside the liner. A considerable temperature increase calculated as 80-120°C takes place for the substrate during winding of two consecutive layers of (G/HDPE) prepreg tape at the liner ends. The influence of pressure vessel size on the tape and substrate temperatures is investigated for different liner radii using the validated process model. The peak substrate temperature is found to increase approximately 45°C by reducing the radius of the pressure vessel from 272 mm to 68 mm while maintaining all other process conditions constant.
Keywords
Introduction
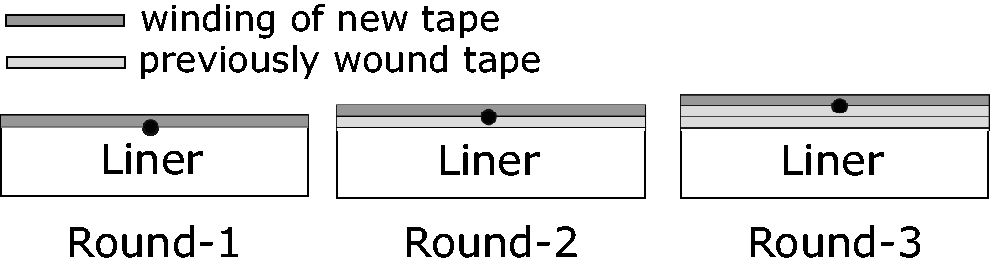
Laser assisted tape winding (LATW) is an automated and efficient method to manufacture pressure vessels out of fiber reinforced thermoplastic composites (FRTPCs) for the storage of hydrogen 1 or compressed natural gas (CNG). 2 The in-situ consolidation of the FRTPCs during the LATW process provides a considerable time saving without an additional consolidation step.3,4 Similar to laser-assisted tape placement (LATP) processes, the application of a laser as heat source implies some possible advantages including higher accuracy, repeatability, quality and reduced cycle time compared to conventional methods using hot air, gas or flame.5–7 The incoming fiber reinforced thermoplastic prepreg tape is bonded to a liner or an already placed substrate by means of a laser heating and compaction roller during the LATW processes. 8 A schematic view of a LATW process and a picture from a hoop winding process as an example are shown in Figure 1. The incoming prepreg tape and substrate come into contact at the so-called nip point. A proper consolidation of the tape and substrate at the nip point requires optimum process settings to keep the consolidation pressure, time and temperature at the nip point at desired levels which is a challenging task in the LATW processes. The inherent variations in geometry and material properties makes the process difficult to control often leading to deviations of the desired temperature at the nip point.9–12 In addition, non-constant process temperatures are present during continuous LATW of tape layers on top of each other which was studied extensively in literature 13 for manufacturing of type-IV pressure vessels made of continuous glass fiber reinforced high density polyethylene (G/HDPE). It was shown that the local heating and cooling cycles during the LATW process significantly affected the process temperature. The characteristics of the tape and substrate temperature developments near the nip point for the continuous LATW process reported in literature 13 are summarized in Figure 2. The previously deposited layers’ temperature as well as the heat accumulation during the transition from one round to another round in a continuous LATW process had an influence on the tape and substrate nip point temperatures.
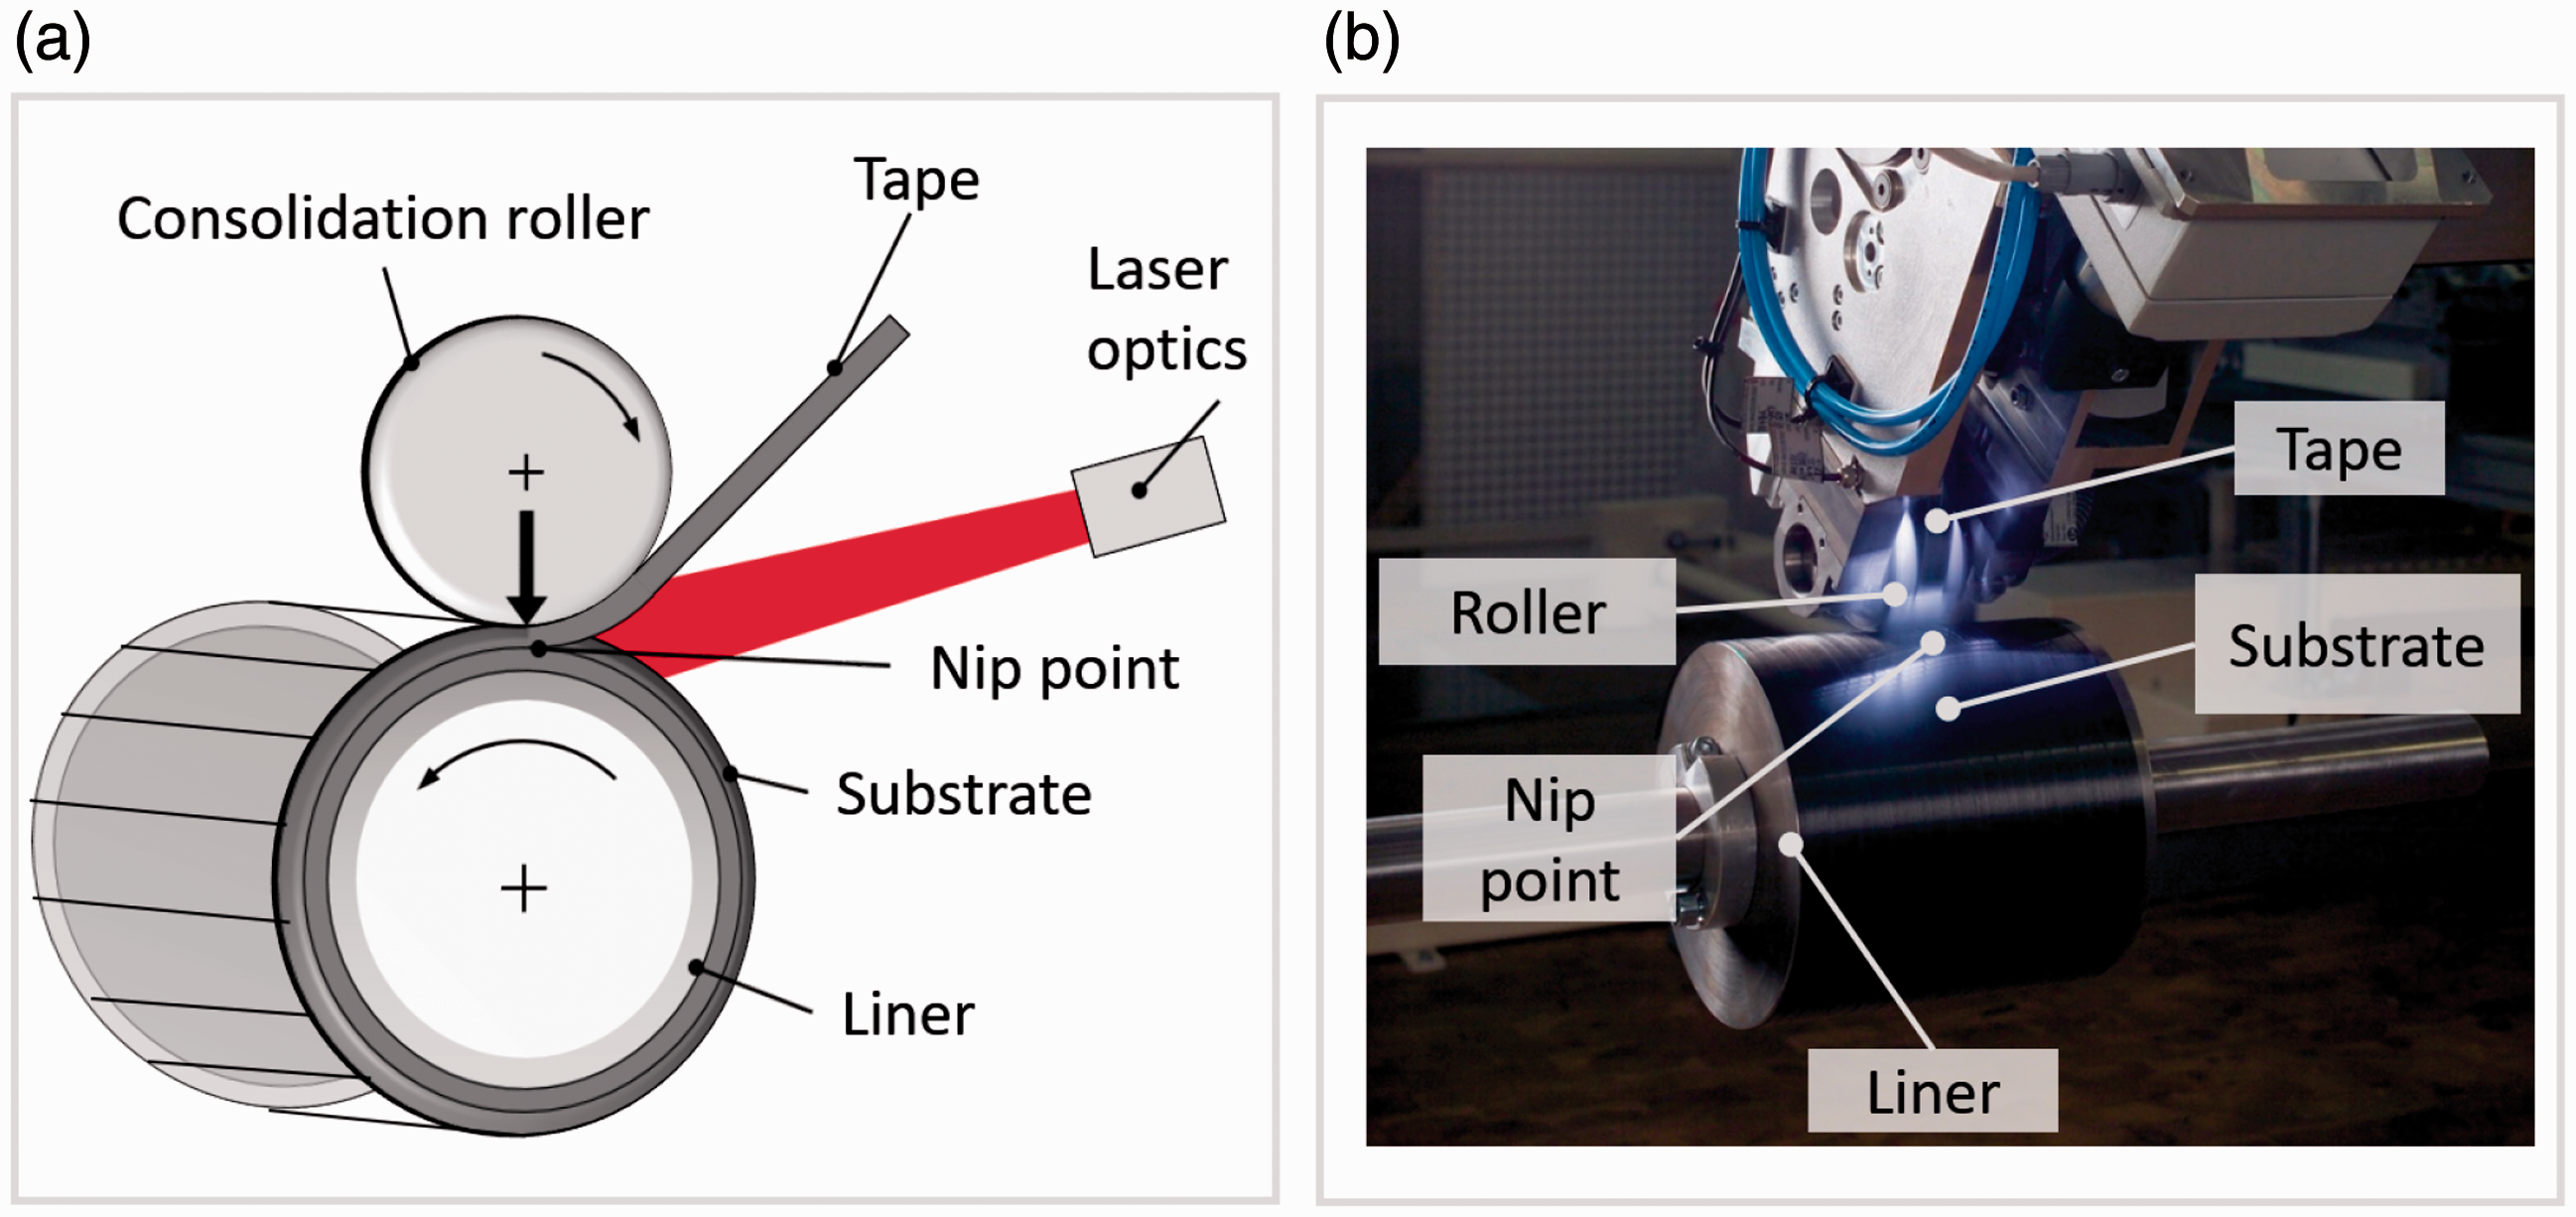
Description of: (a) the principle and (b) the system technology of the LATW process of adjacent hoop winding (detailed view on the experimental set-up employed at Fraunhofer IPT, Aachen, Germany). The main elements of the LATW process are the laser optics, substrate, tape, roller and liner/mandrel.
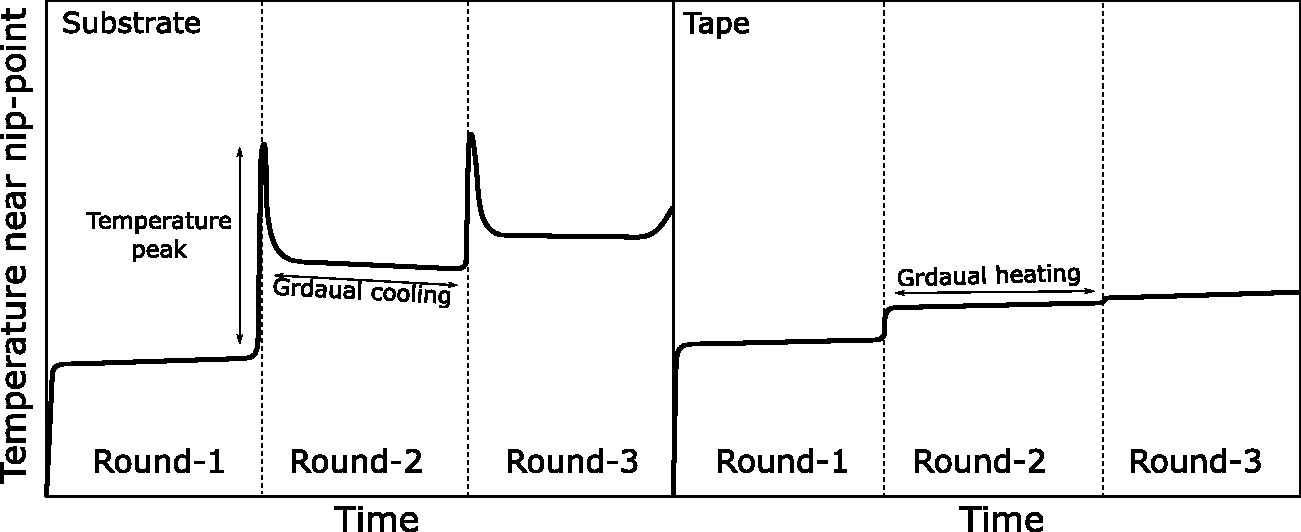
The trend of the substrate (left) and tape (right) temperature developments during continuous LATW process of type IV pressure vessels with three rounds of adjacent hoop layers. Round-1: placing tape on a pure thermoplastic liner. Round-2 and 3: placing tape on the already wound layers. The peaks in substrate temperature are due to the heat accumulation during winding on a previously deposited round. The gradual heating is due to an increase in roller and inner air temperature. 13
In order to tackle the challenges mentioned above and control the processing temperature in continuous LATW processes, computational process models are needed next to experimental observations to describe and predict the physical phenomena taking place during the manufacturing process. Several studies were conducted in literature to understand the relation between the heat input and the resulting temperature distribution in the tape, the liner/substrate and the compaction roller for thermoplastic automated tape placement (TP-ATP) processes.14–21 In those works a uniform heat flux was considered as a boundary condition in the thermal model for the tape and substrate temperature predictions. An analytical thermal model was used in literature 14 for the laser assisted tape placement (LATP) process to correlate the tape placement speed with the through-thickness temperature distribution in the substrate. The roller temperature was reported to have the most significant impact on the nip point temperature and incoming tape temperature distribution in literature. 15 Thermal models were coupled with crystallization models for the LATP in literature.18,19 The sensitivity of the temperature with respect to the placement speed and laser power was investigated in literature 17 for tape laying of continuous carbon fiber reinforced PEEK laminates. The temperature distribution along the length and through the thickness of the flat composite laminate during a tape laying process was predicted in literature. 16 The tape lay-up processing speed, nozzle exit temperature, and cooling rate were found to be the major process variables. The effects of preheating the consolidated flat laminate, temperature distributions and thermal histories were investigated for varying consolidation speeds and the overall feasibility of the proposed process was discussed in literature. 21
Further studies employed a combined optical-thermal model for the LATP process in literature.15,22 A ray tracing approach was implemented to estimate the heat flux distribution on the tape and substrate. It was shown in literature15,22 that there was a shadow region which caused a significant temperature drop immediately prior to the nip point. More advanced heat flux description was introduced in literature23,24 by incorporating non-specular laser reflections from the tape, substrate and roller in an optical process model. The scattering reflectance behavior of a unidirectional thermoplastic prepreg tape was formulated in literature 23 through a developed bidirectional reflectance distribution function (BRDF) model for LATW and LATP processes. A micro half cylinder (MHC) approach was presented in literature 24 to simulate the scattering of laser irradiance via a commercial software (OptiCAD10) for a flat substrate in the LATP process. Both approaches enabled capturing the shadow regions of the tape and substrate prior to the nip point where the input laser heat flux cannot be received. The same optical model reported in literature 24 was used in literature 25 to include the laser power distribution in a two-dimensional (2D) thermal analysis performed by a commercial finite element package Ansys. The tape and substrate temperature distributions were studied comprehensively.
Next to the numerical modeling studies focusing on the LATP processes on flat tooling as in literature,15,22,24,25 optical-thermal models for curved coolings were developed in literature26–29 by the current authors. The laser radiation on circular surfaces was investigated in literature 27 based on a three-dimensional (3D) ray tracing optical model combined with a 1D through-thickness thermal model. The effect of non-specular reflections on the process temperature was studied for different laser power distributions. A 3D optical model was presented in literature 29 to consider the effect of out-of-plane winding on the substrate and tape temperatures in the LATW process. The effect of different winding orientations on the nip point temperature was studied in literature 28 for curved geometries.
The mentioned combined optical-thermal process models achieved a realistic temperature prediction, however, they only dealt with modeling discontinuous winding/placement on either flat or curved geometries. The lack of in-depth numerical optical-thermal models for continuous LATW processes on curved geometries still leads to unwanted temperature variations as shown in Figure 2. One of the most important aspects not covered comprehensively by the current models is the influence of the previously deposited layer’s temperature on the nip point temperature when a new layer is deposited during continuous LAWT/LATP processes.
The objective of the present work is to critically analyze the temperature evolution near the nip point during continuous LATW processes by means of a comprehensive computational model. The focus is on the the process modeling of adjacent hoop winding of a type-IV pressure vessel made of G/HDPE composite. A fully or two-way coupled local and global process models is introduced for the process simulation of continuous LATW processes. More specifically, a local optical-thermal model is combined with a global thermal model to incorporate the global cooling and local heat accumulation as described in Figure 2. 13 The conducted experiments of three consecutive rounds of adjacent hoop winding from current authors in literature 13 are used as the basis of this paper for validating the developed process model. After validating the model with the measured tape and substrate temperature distributions, the effect of liner radius size on the peak temperature and gradual cooling/heating behavior is addressed by the developed process model for continuous LATW processes. The performed experiments by current authors are briefly discussed in Section “Experimental work”. The local optical-thermal and global thermal models are presented in Section “Modeling of continuous LATW process”. The local optical-thermal and global thermal models are part of the comprehensive OTOM (Optical Thermal Optimization Model) simulation tool developed by using MATLAB at the University of Twente for the simulation of the LATW/LATP processes. The optical model includes a generic 3D ray tracing model to simulate the laser intensity distribution on the tape and substrate surfaces. The local thermal model comprises a 2D/3D fully implicit transient advection-diffusion thermal model to calculate the temperature distribution of the tape and substrate near the nip point. The global thermal model employs a 2D heat conduction model to calculate the temperature of the pressure vessel during the cooling period, i.e. non-irradiated locations. The studied case studies are presented in Section “Process model parameters and case studies”. The obtained results are discussed in Section “Results and discussion”. The final part of the paper presents the conclusions and recommendations for further research in Section “Conclusions and outlook”.
Experimental work
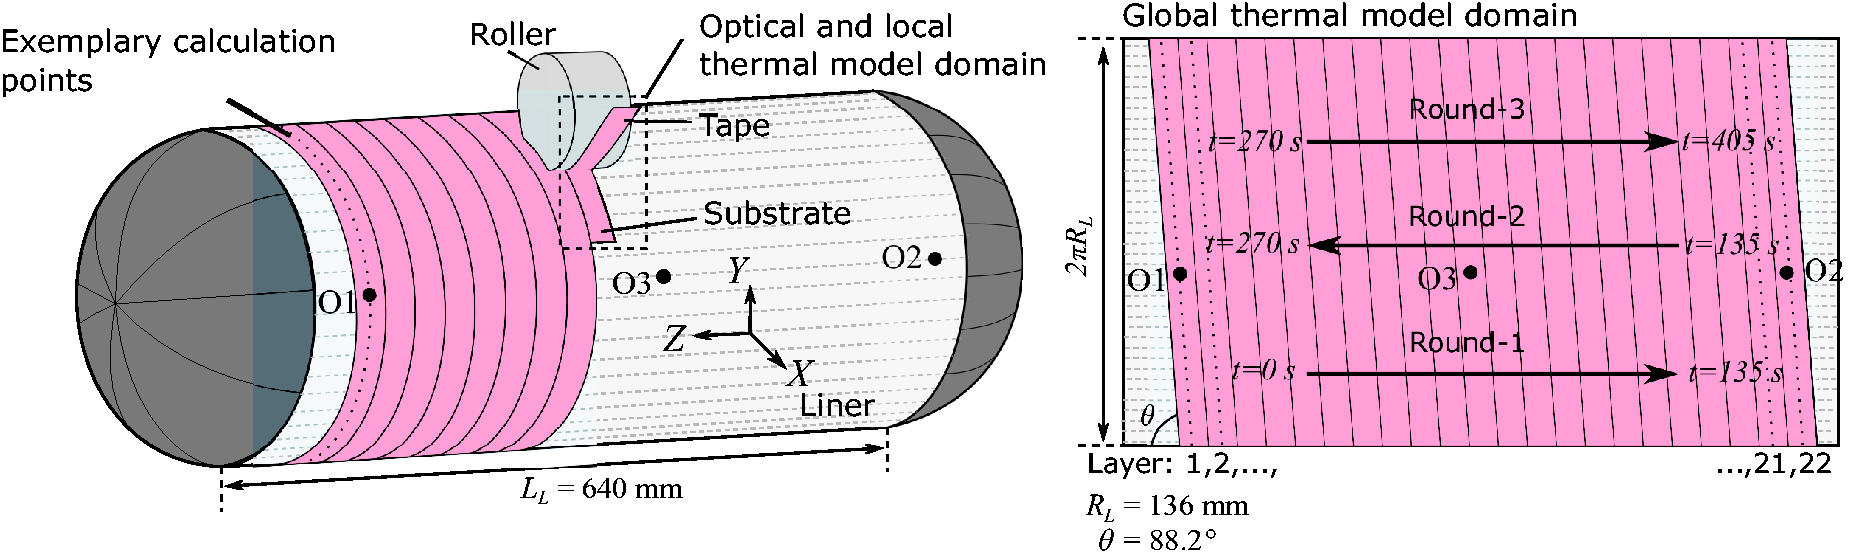
The continuous adjacent hoop winding of pressure vessels experimentally studied by current authors in literature 13 was the basis of the present process modeling. The summarized process of adjacent hoop winding of the pressure vessel is depicted in Figure 3 from the neat thermoplastic liner to adjacent hoop winding procedure and then finished adjacent hoop winding (left to right). The prepreg tapes were made of G/HDPE with 47% fiber volume content and the liner was made of pure HDPE with pigments. A schematic view of the continuous LATW process for winding of three rounds is depicted in Figure 4. The length (LL) and radius (RL) of the cylindrical part of the liner were 640 mm and 136 mm, respectively. The winding angle (θ) was set to 88.2° to obtain proper layers adjacently wound. Total of 22 layers were adjacently wound for each round, i.e. Round-1, Round-2 and Round-3 as seen in Figure 4. The winding of a single layer took approximately 6.2 s corresponding to approximately 135 s for each round. The layers of Round-1 were started and ended at point O1 and O2, respectively, as illustrated schematically in Figure 4. A deformable roller was used to consolidate the incoming prepreg tape with the substrate locally. An infrared thermographic camera was utilized to measure the temperature on the tape and substrate surfaces during the continuous hoop winding process. Further details can be found in literature. 13
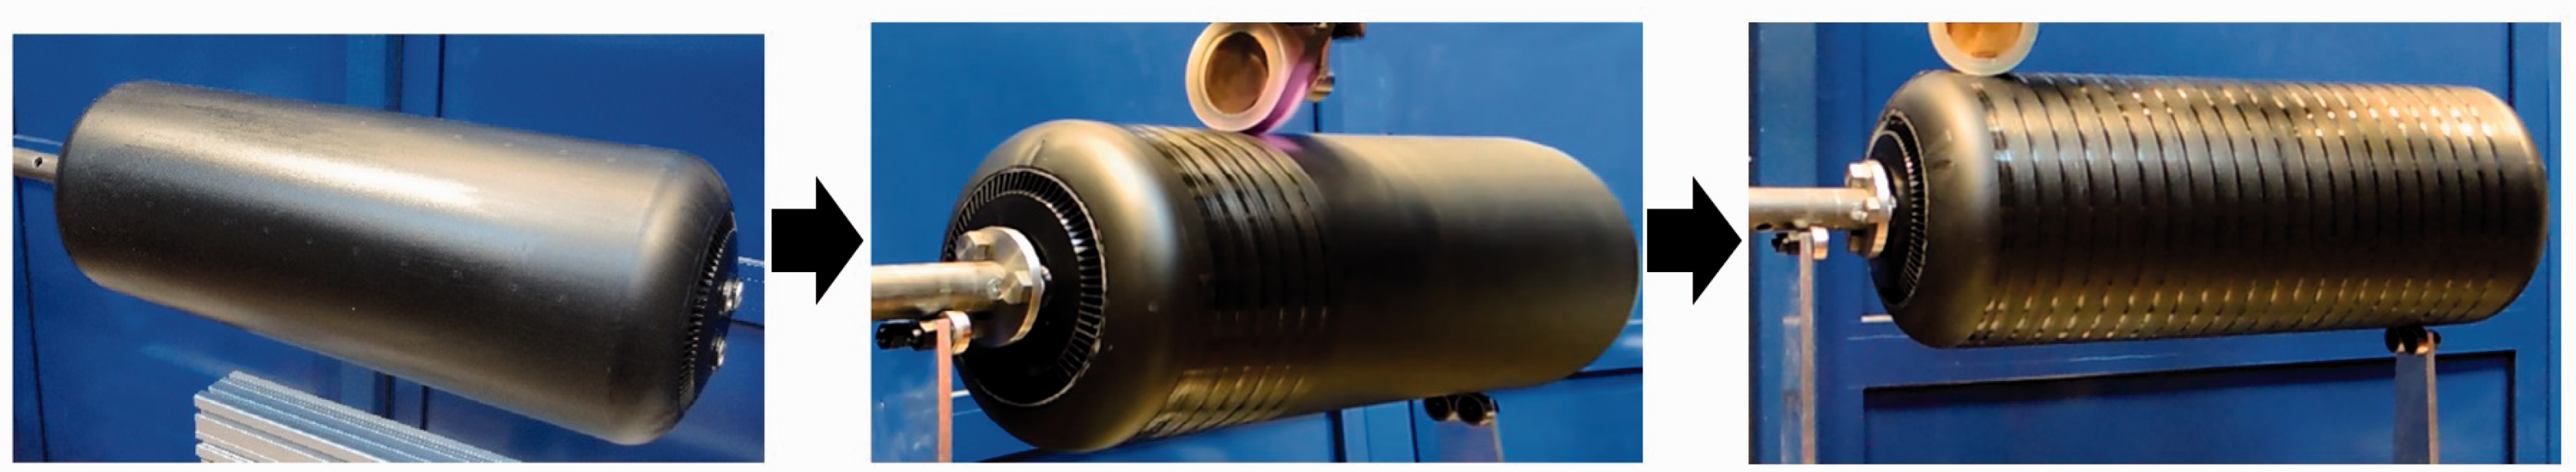
Adjacent hoop winding on a neat 40-liter blow-molded HDPE type-IV composite pressure vessel via LATW process performed by the Fraunhofer IPT. In this picture (from left to right), the neat thermoplastic liner, adjacent hoop winding procedure and then finished hoop winding tank liner are represented.
Modeling of continuous LATW process
A local optical-thermal process model domain was developed near the nip point to predict the substrate and tape temperatures. On the other hand, a global thermal model was employed to predict the cooling of the substrate after the nip point as well as the heating of the roller and the air inside the pressure vessel. The process simulation of the continuous adjacent hoop winding of FRTPCs therefore followed a fully coupled local optical-thermal and global thermal modeling procedure in the present work. The flowchart of the process modeling framework is presented in Figure 5. The corresponding equations are also represented in this figure to clarify flow of the implemented method. The laser irradiation was calculated by the optical model and the obtained heat flux distribution was transferred to the local thermal model. The heat loss in the substrate after the nip point was calculated using the global thermal model and the updated substrate temperature was used as a boundary condition (BC) in the local thermal model. Similarly, the time dependent temperatures of the roller and air inside the vessel were updated in the global thermal model and transferred to the local thermal model as a BC. This coupling was done when the local thermal domain passed the calculation points defined for each layer as shown in Figure 4. This procedure was applied for three rounds of adjacent hoop winding with a total process time of approximately 405 s. The details of the optical, local and global thermal models are presented in the following.
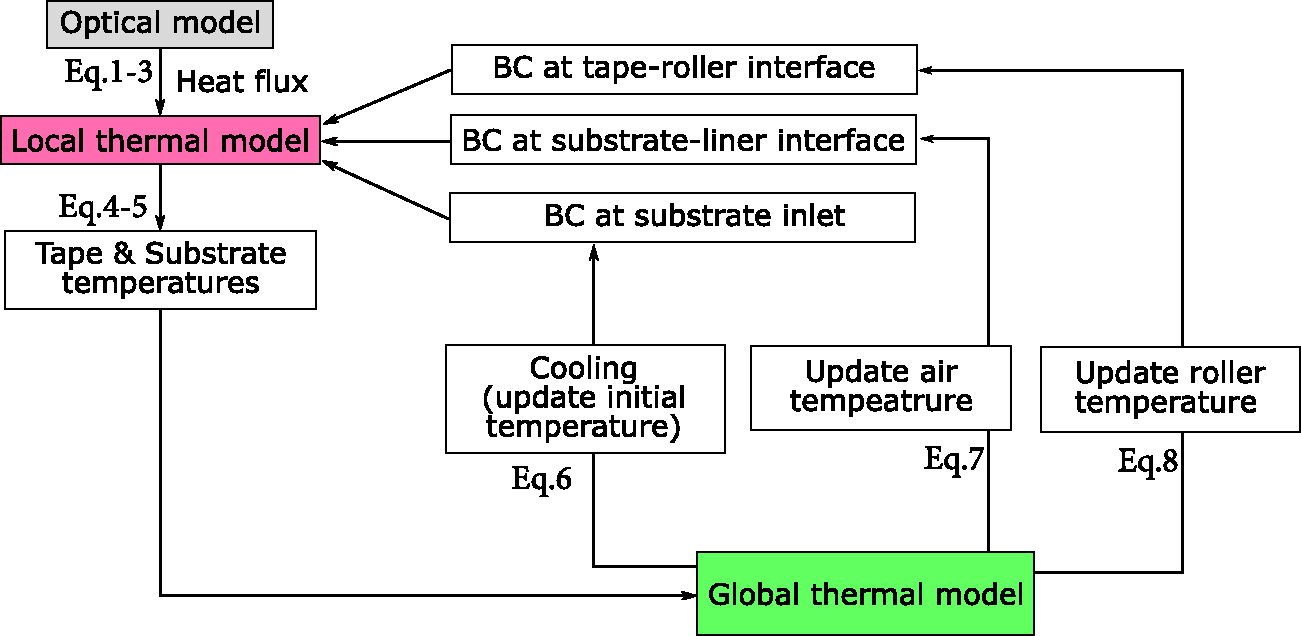
The flowchart of the coupled local optical-thermal and global thermal modeling approach for the process simulation of continuous LATW of FRTPCs. The corresponding equations are also shown.
Optical model
The optical model compromises the liner, roller, incoming prepreg tape and substrate which were defined in a 3D global coordinate system as a reference. Each object in the global axis system had its own local coordinate system. A schematic view of the 3D optical model domain is seen in Figure 6. The deformable roller was assumed to have a contact with the liner at the line
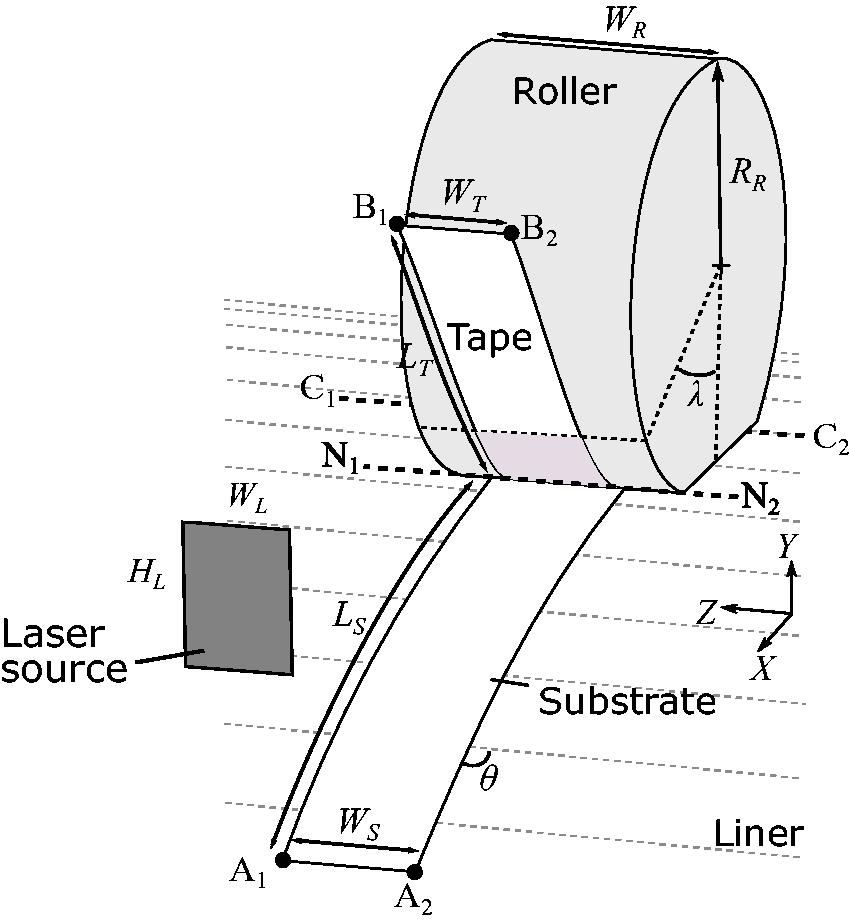
Schematic view of the 3 D optical model domain consisting of liner, roller, tape and substrate geometry.
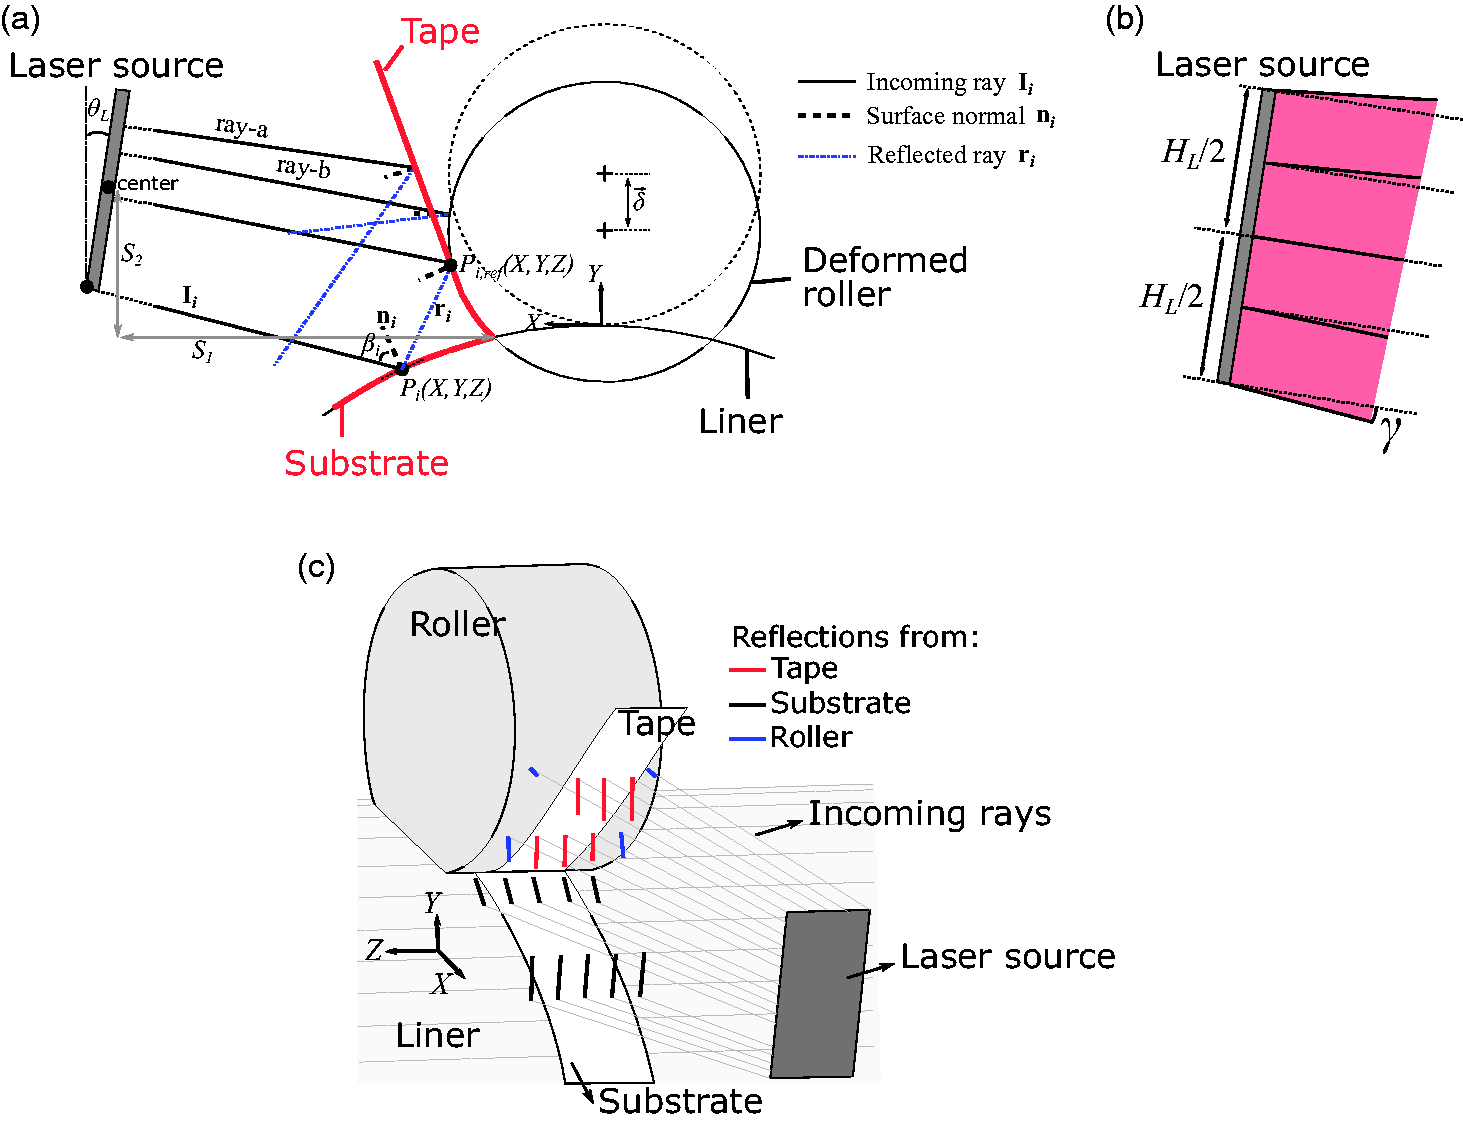
(a) Schematic view of the roller indentation (
The procedure used on the optical model started with irradiating diverged rays from the laser cross-sectional plane with dimensions

Similarly, the intersection point of


Local thermal model
The local thermal model employed the optical model output (power intensity distribution) as a heat flux boundary condition (see Figure 5). A schematic view of the local thermal model domain for the tape and substrate is given in Figure 8. The curved tape and substrate geometries defined in the optical model were unfolded to the computational domains seen in Figure 8 in order to handle the numerical implementation in an easy manner. Since the incoming tape thickness was relatively thin and remained constant during the process, a 2D thermal domain was used for the tape. On the other hand, a 3D thermal model was employed for the substrate in order to account for the thickness increase during the continuous winding process of three rounds as illustrated in Figure 4. The corresponding transient heat conduction equations for the tape and substrate are given in equations (4) and (5), respectively
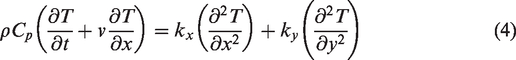
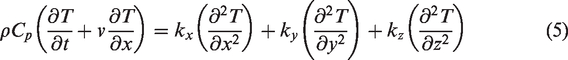
Schematic view of the local thermal model domains for the tape and the substrate which were unfolded from the optical domain defined in Figure 6. The applied boundary conditions are also indicated.
The control volume based finite difference method was employed to solve the governing equations with the upwind implicit scheme as described in.35,36 A structured control volume based mesh was employed using the local coordinate system (x, y, z). Total of 40 × 23 control volumes were used in the x- and y-direction, respectively, for the tape and 30 × 23 × 14 control volumes in the x-, y- and z-direction, respectively, for the substrate.
Global thermal model
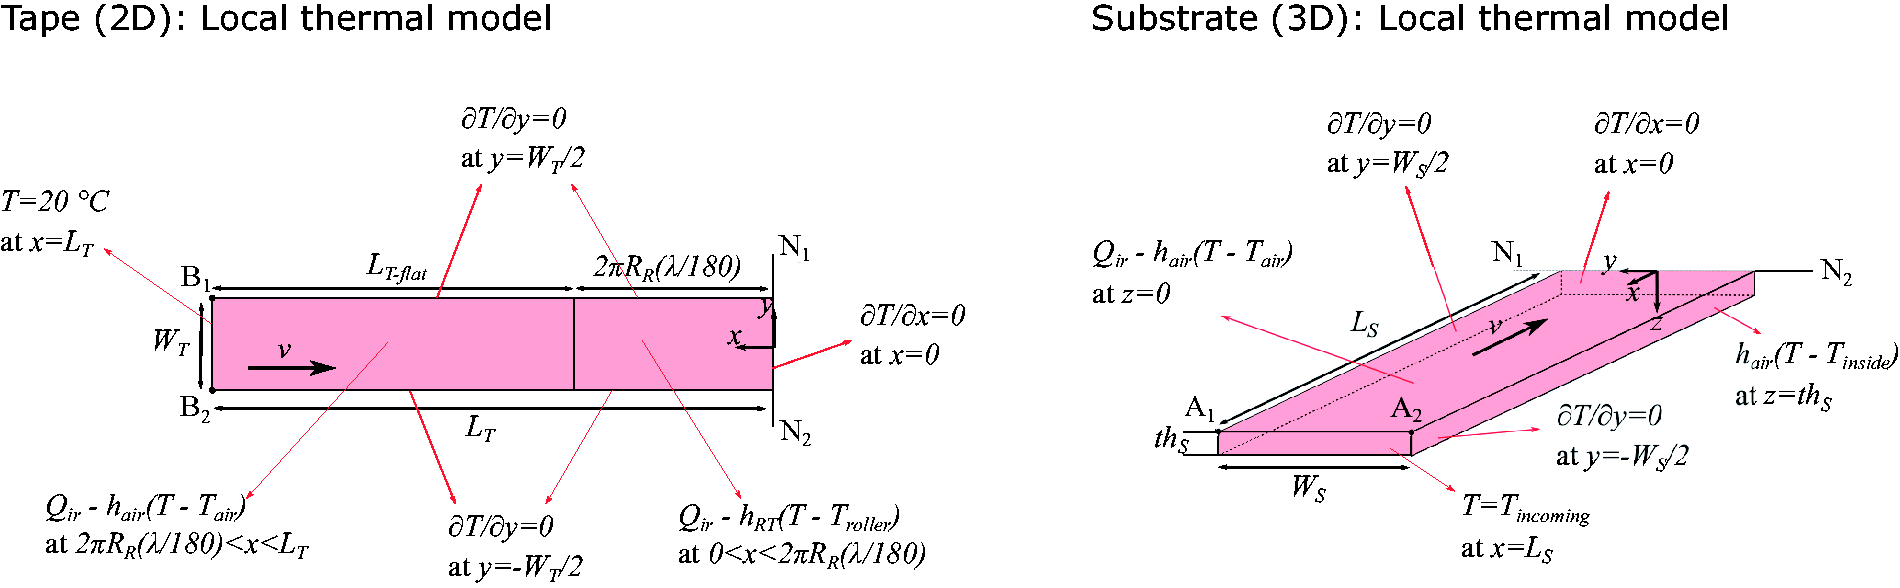
The global thermal model employed the predicted tape and substrate temperature distributions from the local thermal model. Accordingly, the cooling of the substrate as well as the heating of the roller and the air inside the pressure vessel were estimated. A schematic view of the global thermal model is depicted in Figure 9. The calculation domains are illustrated in Figure 9(left) during winding of a single layer which can also be seen in Figure 4(right). Each calculation point which was located on the liner had a unique temperature history. Heat conduction was allowed between the tape and substrate at the nip line
Representation of the calculation domains together with the side-view of time-position relation in the global thermal model (left) and the considered 2D cross-sectional domain with the employed boundary conditions (right).
The applied BCs are shown in Figure 9(right). Convective heat transfer was defined at the top surface of the cross-sectional domain (z = 0) for


Process model parameters and case studies
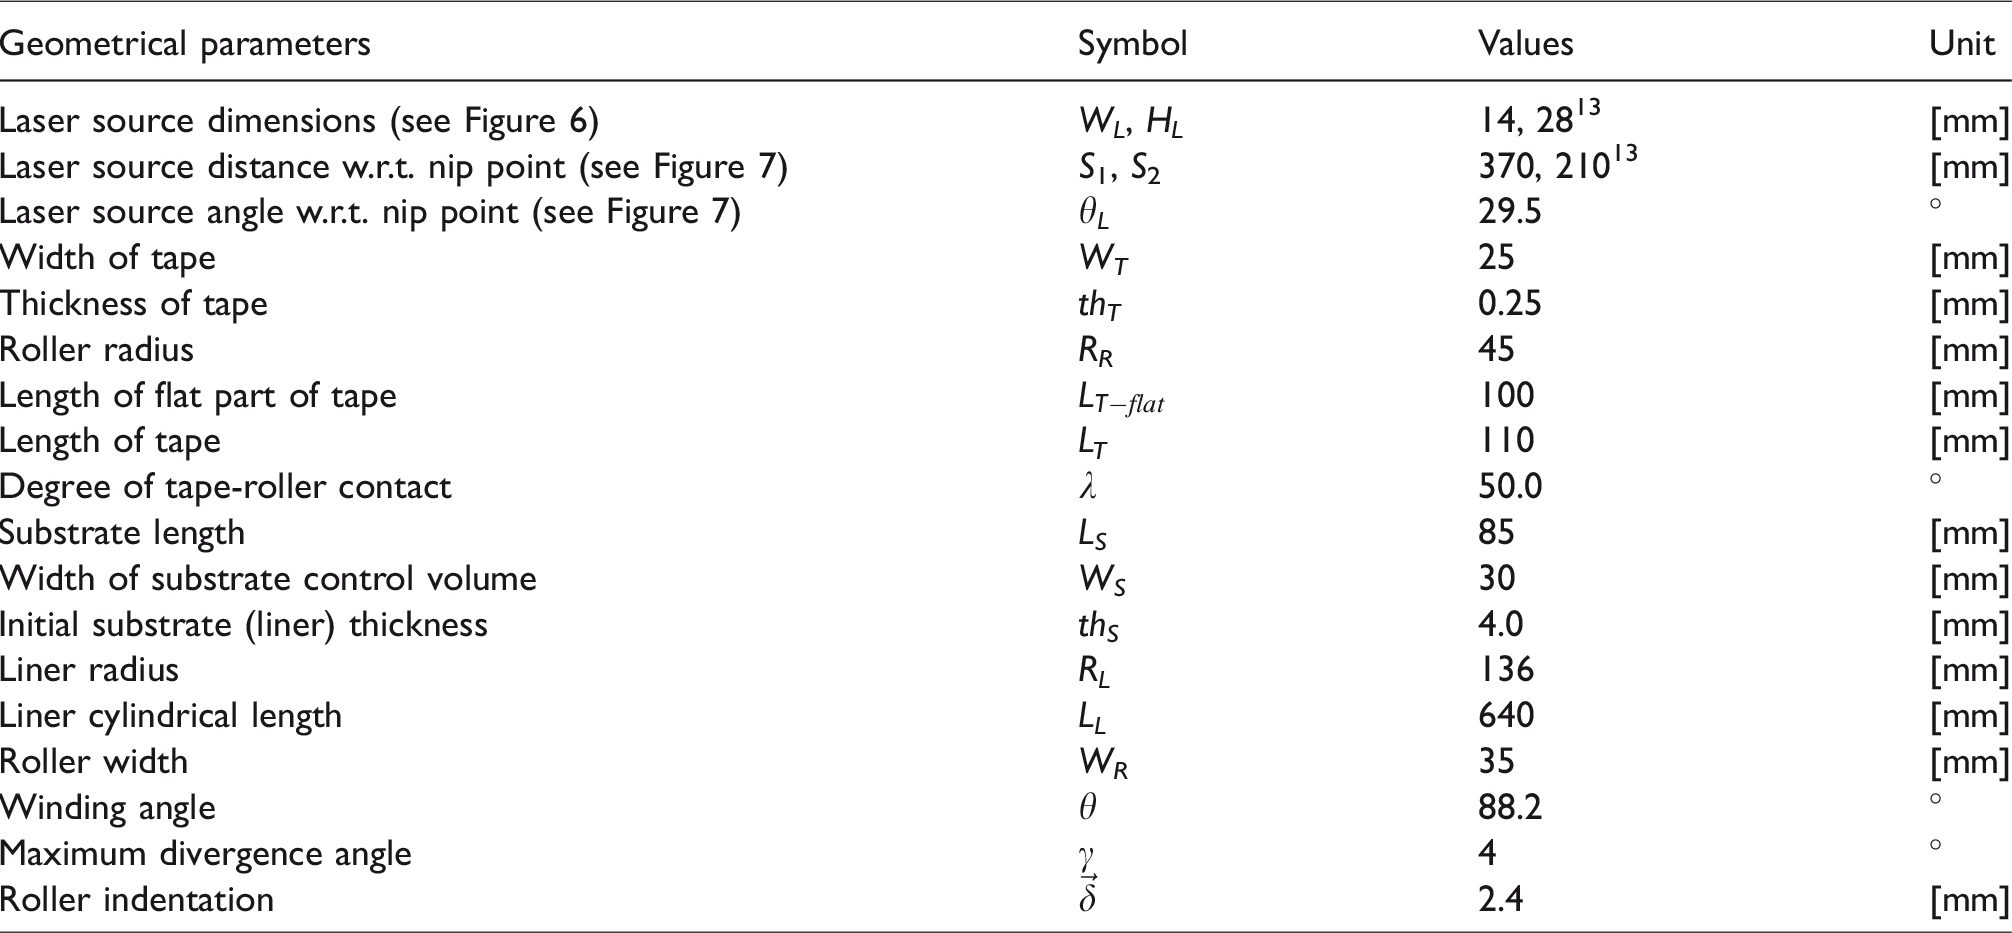
The geometrical parameters used in the optical and thermal models were defined based on the experimental work in literature 13 and are listed in Table 1. A wider substrate control volume than tape width was considered in the process model which was also the case in the thermographic images. The tape feeding velocity was 140 mm/s. The laser distribution at the laser source had a uniform power distribution with a total power of 900 W. The material properties utilized in the process modeling are given in Table 2. Since the temperature-dependent material properties of the HDPE tape and liner were not known and in order to clearly understand the continuous characteristic (location- and time-dependent) of the adjacent hoop LATW process, constant thermal material properties were considered as also used in literature.22,38 The refractive index of the prepreg tape was assumed as 1.8 as in literature. 22 The refractive index of HDPE polymer liner was taken from literature 39 as 1.5. The higher refractive index indicates a lower absorption of the incoming laser rays by the material. In addition, the effect of mandrel size on the process temperature evolution was studied for two other mandrel radii of 272 mm and 68 mm (default radius was 136 mm 13 )
Geometrical parameters considered in the optical and thermal models.
Material properties used in the optical and thermal model.
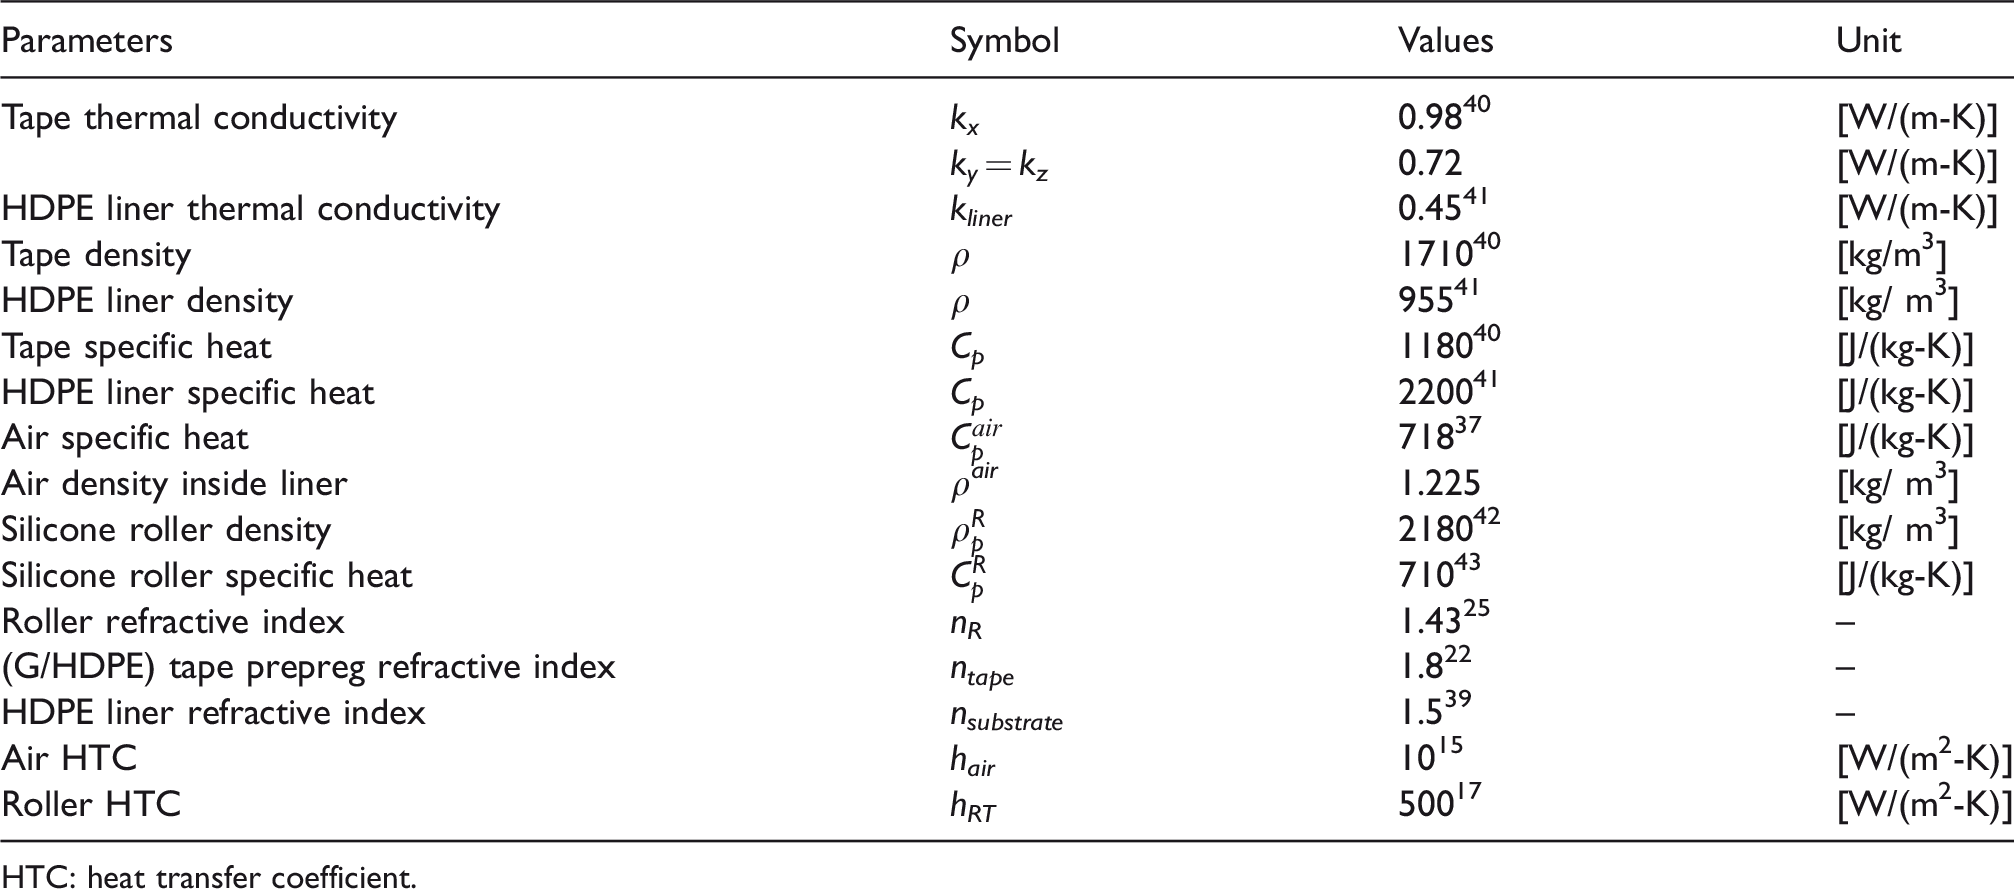
HTC: heat transfer coefficient.
Results and discussion
Process model predictions
The laser intensity distributions on the tape and substrate surfaces were first predicted using the optical model and the results are shown in Figure 10 for Round-1 and Round-2. The maximum power intensity was obtained far away from the nip line as indicated in Figure 10 for the selected incident angles of the incoming and reflected laser rays. The maximum value of the power intensity was estimated approximately as 3.2×
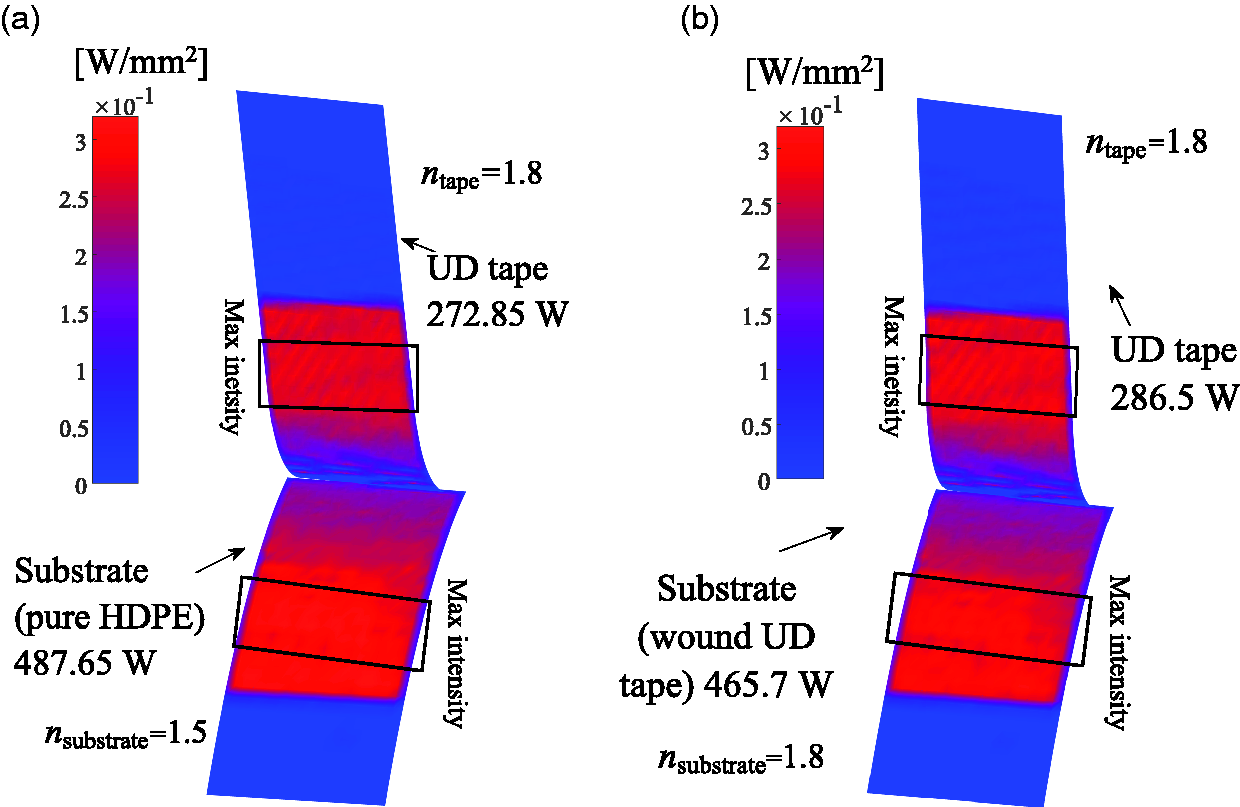
Simulation contour of absorbed power intensity distribution (optical model output) on the tape and substrate in adjacent hoop winding at: (a) Round-1, (b) Round-2. The total absorbed energy by the tape and the substrate are indicated as well. (for interpretation of the references to color in this figure legend, the reader is referred to the web version of this article).
The corresponding predicted temperature distributions by the local thermal model are depicted in Figure 11 for Round-1, Round-2 and Round-3. Note that the square boxes indicated on the tape and substrate were the locations at which the temperature was measured during the process in literature.
13
These boxes were defined at the centerline of the tape and substrate and 10 mm prior to the visible nip line
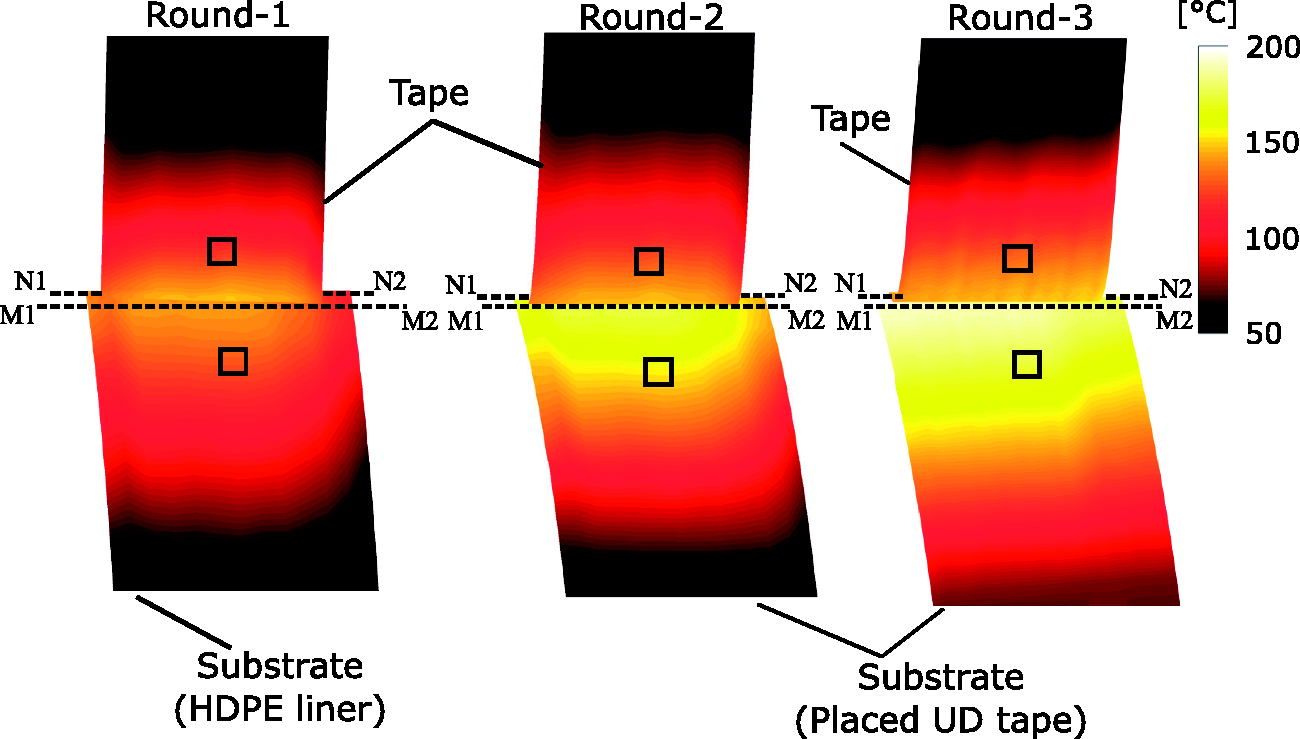
Local thermal model output: The predicted contour plots of the temperature distribution on the tape and substrate surface during continuous winding of Round-1, Round-2 and Round-3. The presented results were extracted during winding of layer-11 (see Figure 4). Here,
Schematic of the locations at which the temperature evolution was reported using the global thermal model.
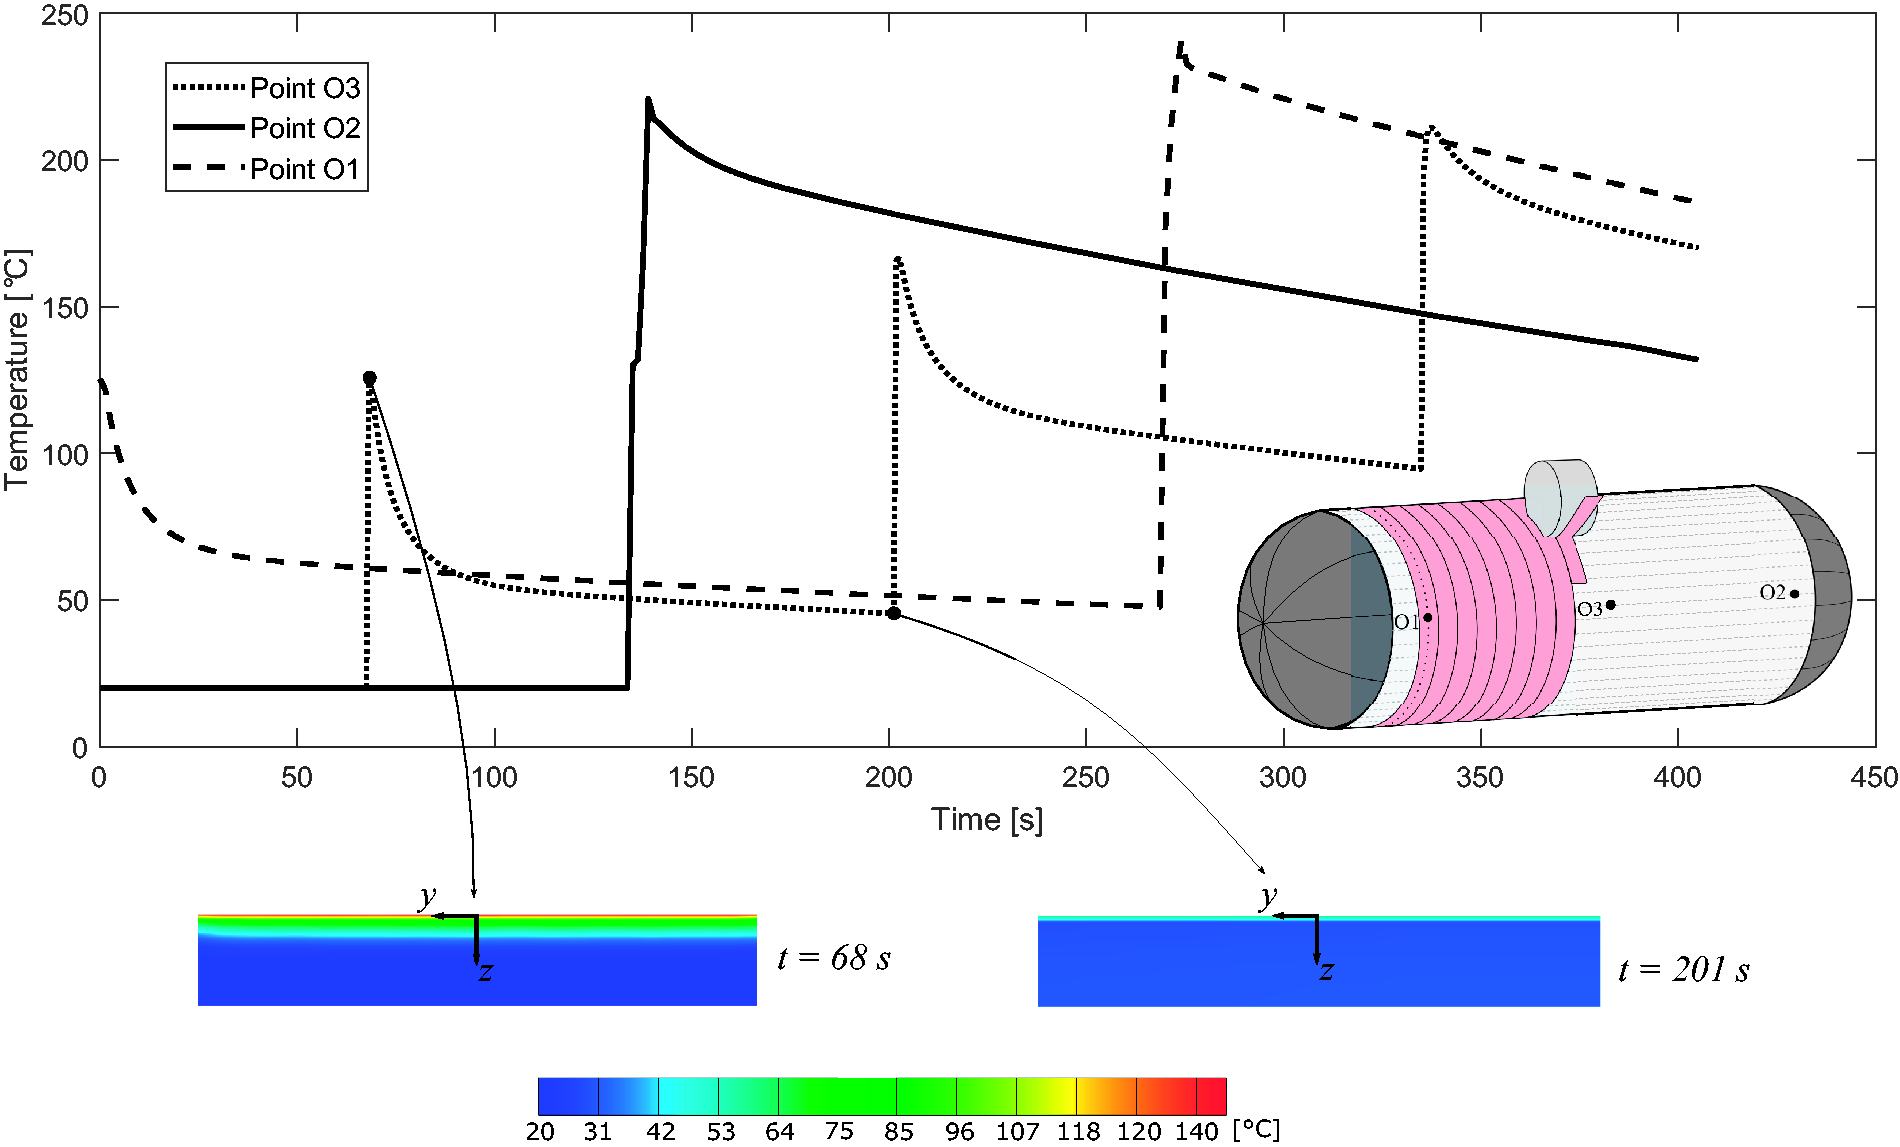
Top: The evolution of the average substrate temperature at the actual nip line at points O1 (layer 1), O2 (layer 22) and O3 (layer 11) during winding of three rounds. Bottom: Exemplary temperature distributions for point O3 at t = 68 s after the laser head passed in Round-1 and at t = 201 s before the laser head passed in Round-2.
Analysis of the process temperature - comparison with experiments
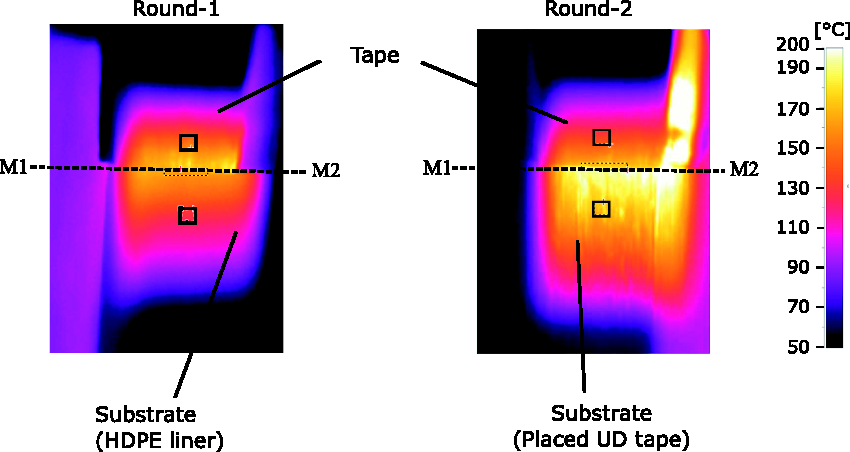
The predicted local temperature distribution shown in Figure 11 was compared with the thermographic images measured by the thermal camera in literature
13
which are depicted in Figure 14.
a
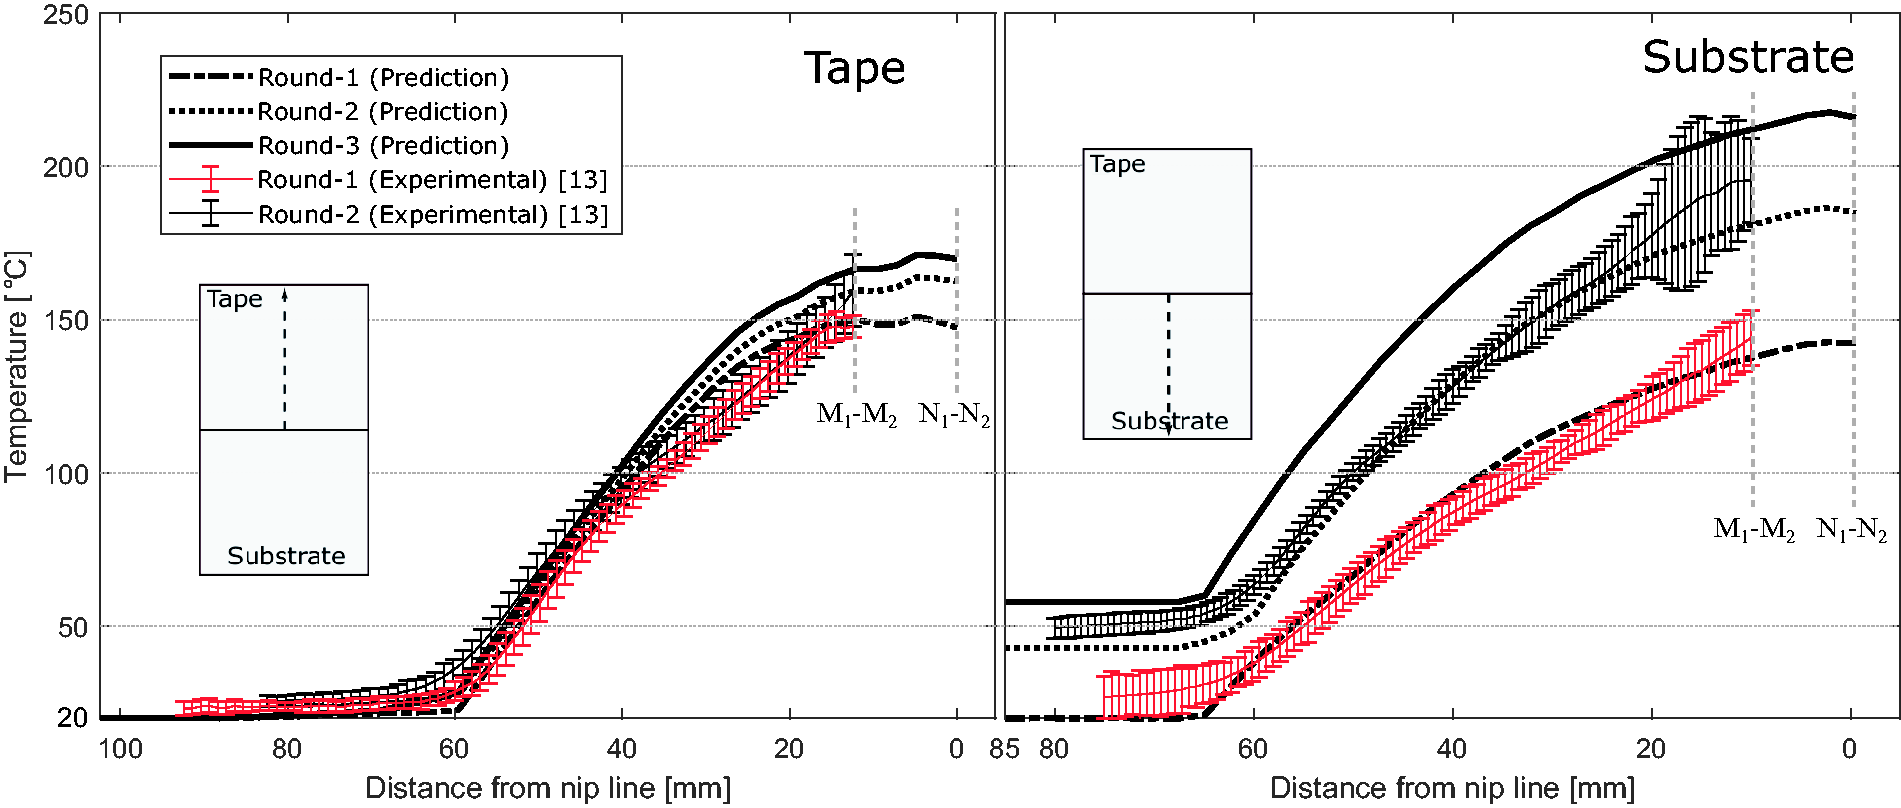
A good agreement between the measured and predicted local temperature distribution was obtained for Round-1 and Round-2. The maximum difference in mean temperature between the experiments and simulations was found to be approximately 3% and 10% for tape and substrate, respectively. A more detailed comparison between the predicted and measured temperature distributions was made by extracting the temperature values along the length and width direction as seen in Figure 15 and Figure 16, respectively. A total of 20 thermographic frames from the experimental measurements at the middle of Round-1 and Round-2 was extracted of which the mean values and corresponding standard deviations were shown. The extracted frames were obtained from the thermographic recorded video with 50 frames per second (50 Hz) to investigate the main trends of the temperature history as described in literature.
13
The temperature distributions at the centerline along the length or winding direction are depicted in Figure 15. Overall a good agreement was found between the predicted and measured temperature distributions. The increase in the tape and substrate temperature at the center of the nip line (
Predicted and measured tape (left) and substrate (right) temperature profiles at the centerlines of the surfaces along the winding direction, i.e. along the x-direction seen in Figure 8.
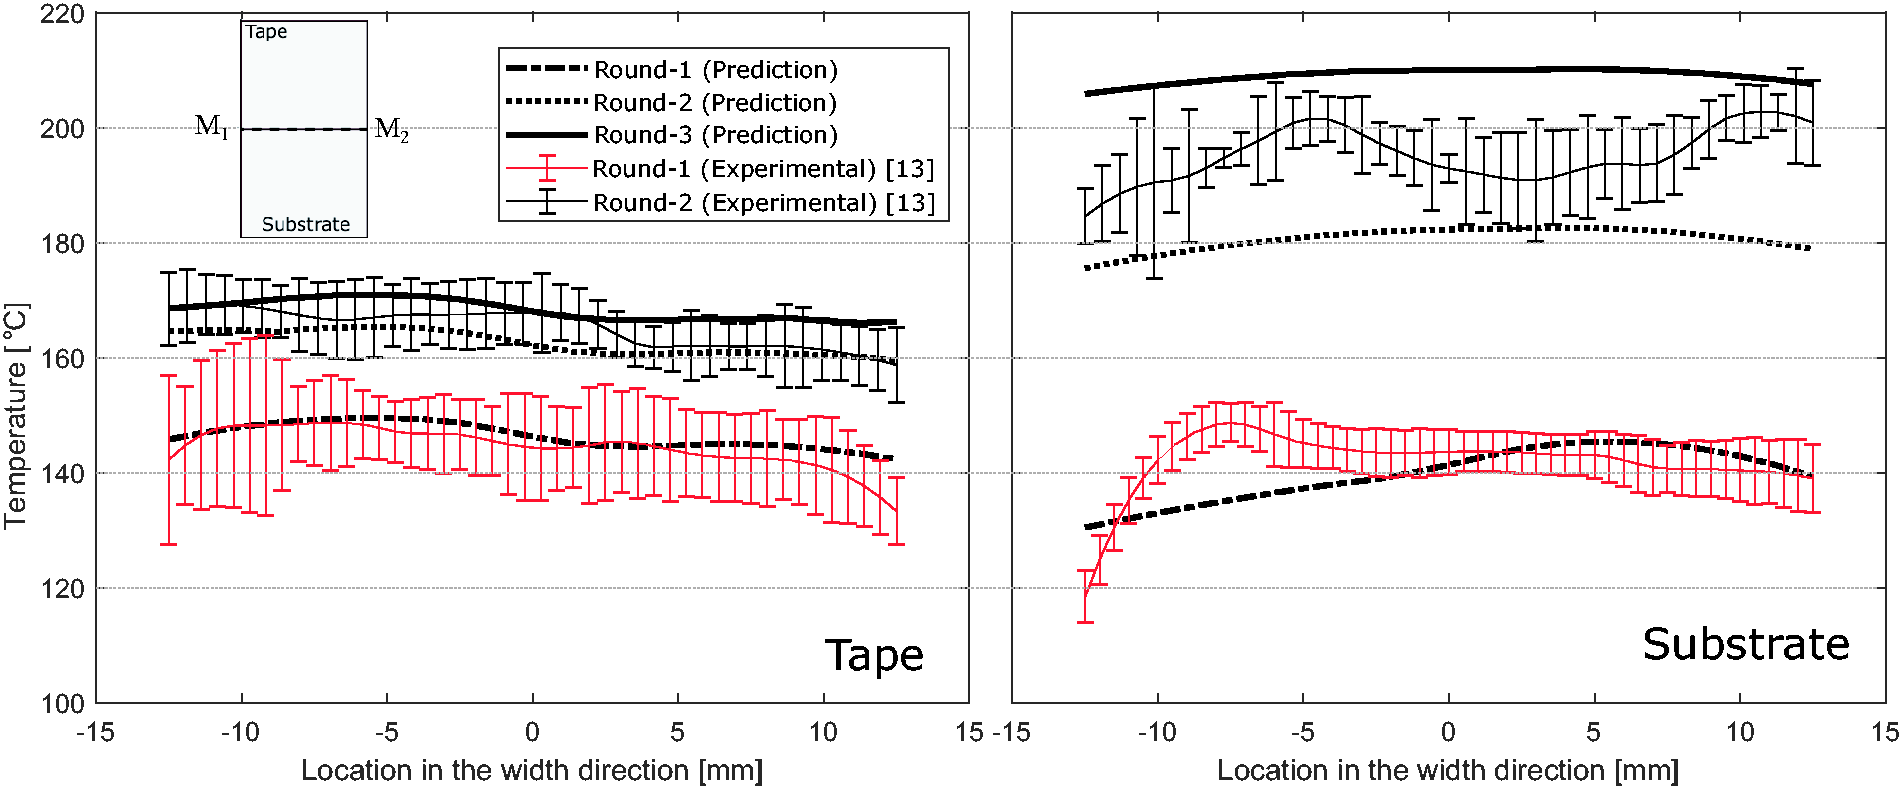
Predicted and measured tape (left) and substrate (right) temperature profiles at the centerlines of the surfaces along the width direction, i.e. along the y-direction seen in Figure 8.
In addition to the temperature distributions, the evolution of the average temperatures within the measurement box (see Figure 11 and Figure 14) for tape and substrate are shown in Figure 17. It is seen that there was a good match between the predicted and measured temperature for tape and substrate. The tape temperature followed a relatively simple profile since the heat convection in the control volume of the tape was constant through the process except for the heat transfer with the roller. The roller temperature calculated in the global thermal model was found to increase from
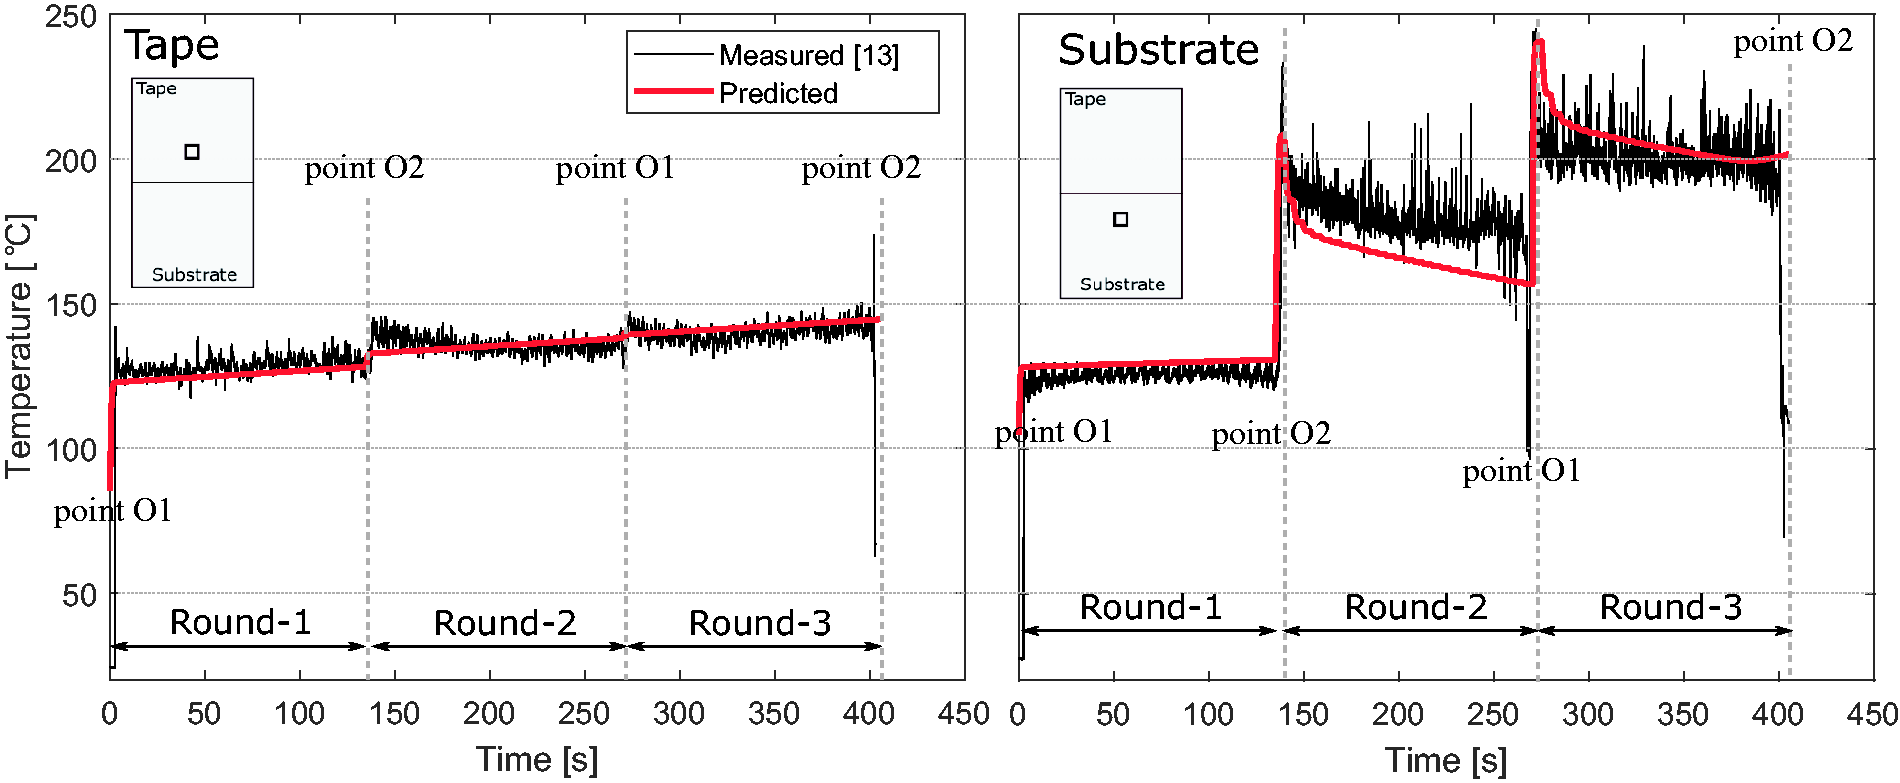
Predicted and measured tape (left) and substrate (right) temperatures near the nip point during continuous adjacent hoop winding of three rounds of G/HDPE composites based on Figure 4.
Effect of pressure vessel size
The effect of pressure vessel radius (RL) on the evolution of process temperature was analyzed using the proposed process model. The developments of the average temperature within the measurement box for RL = 68 mm, RL = 136 mm and RL = 272 mm are shown in Figure 18. A slight increase in the tape temperatures as a function of the liner diameter can be observed, for example, from 0 to 60 s in Figure 18(left). The increase can be ascribed to a stronger contribution of laser light reflection by the less curved substrate. The tape temperature gradually increased during continuous winding of three rounds for every liner radius due to the continuous increase in the roller temperature. At the end of Round-3 the tape temperature was already close to
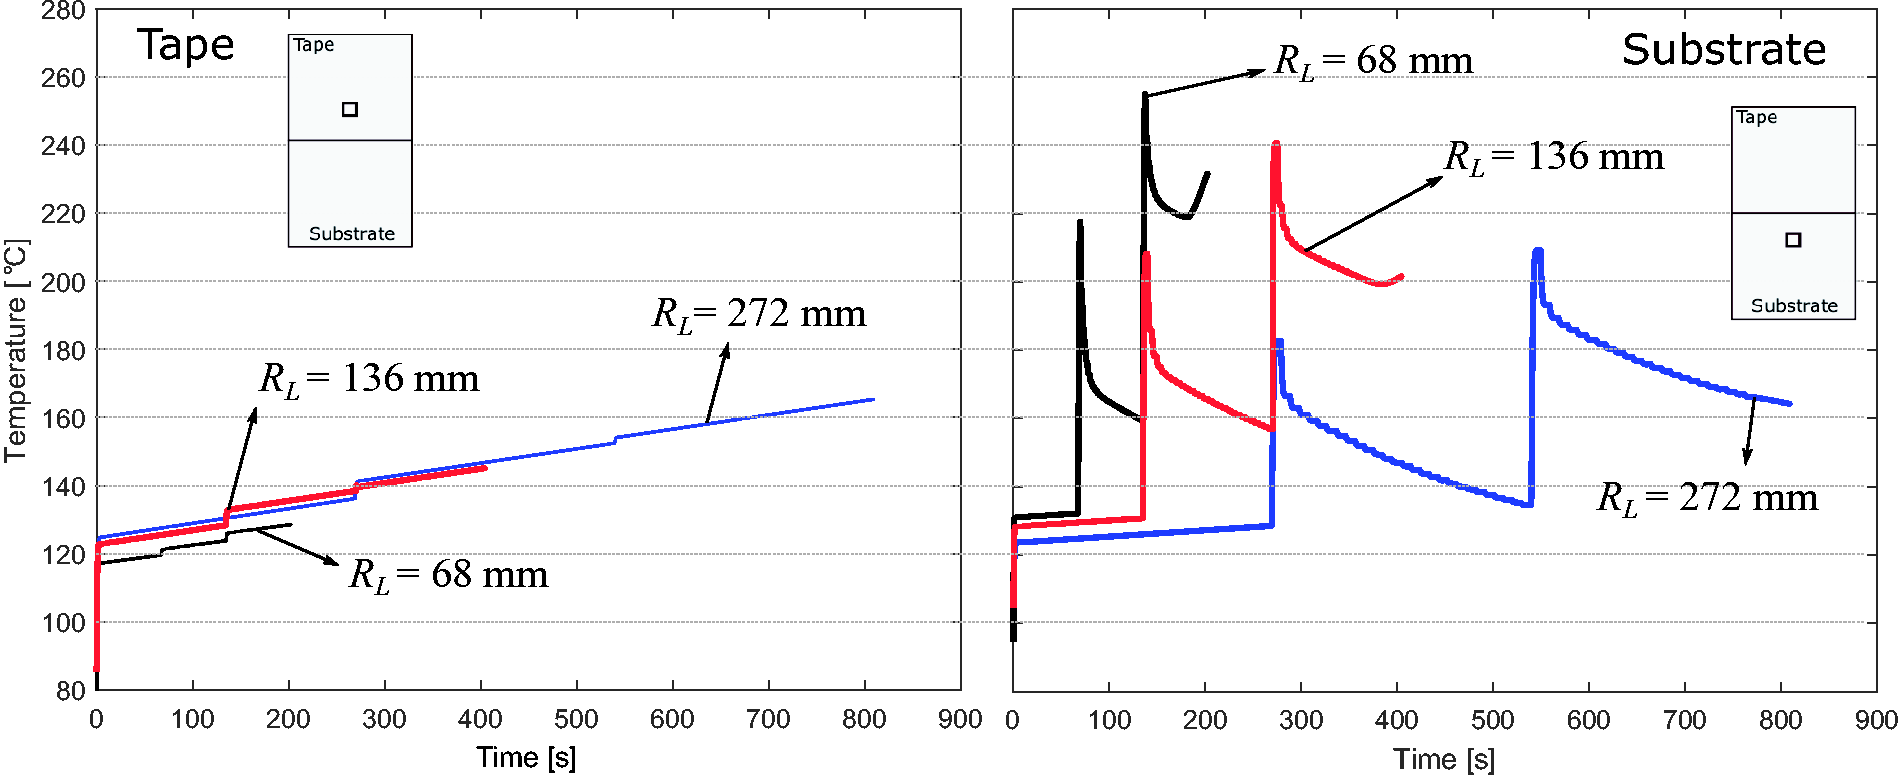
Predicted tape (left) and substrate (right) temperature evolutions near the nip point for different pressure vessel radii. The duration of the winding process is proportional to the liner radius at constant winding speed.
The substrate temperature decreases as a function of the liner diameter as can be observed in Figure 18(right), see for example the range from 0 to 60 s. The larger the substrate radius the lower the temperature level at which the substrate temperature develops over time. When more laser light is reflected from the substrate to the tape, as described above, less heat remains for the substrate, explaining the altered temperature developments. However, two more aspects play a role here explaining the lower substrate temperatures. Firstly, the volume of the vessel liner increases with the liner radius leading to a slower heating of the air inside the vessel. Secondly, a larger vessel needs more time to be covered by tape, which means that the cooling time is increased if the tape winding speed is maintained constant. The peak temperatures at point O2 at the end of Round-1 and at point O1 at the end of Round-2 were also strongly affected by the liner radius. More specifically, the average peak temperature at point O1 went up to approximately
Conclusions and outlook
This study was performed in order to critically asses the temperature evolution during the continuous LATW process. A fully coupled local and global process models was developed based on the type-IV pressure vessel manufacturing experiment performed in literature. 13 Unidirectional G/HDPE tapes were continuously wound through adjacent hoop winding on an HDPE liner. The laser power intensity distributions were calculated by the 3D optical model for the tape and substrate illuminated by the laser. Differences in the refractive index of the substrate’s HDPE liner and the wound tape had a significant influence on the power intensity distributions. The local temperature distribution near the nip point was captured by the thermal model. The global cooling and heating of the pressure vessel was estimated by the global thermal model. The predictions of the process temperature distributions and evolution on the tape and substrate surfaces were found to agree quite well with the experimentally measured temperatures in literature. 13
The effects of the heat accumulated during winding of the vessel liner by a number of layers and the gradual increase in roller and air temperature inside the liner on the process temperature were found to be very important to predict the continuous temperature evolution and possible temperature peaks. The variation in the substrate temperature was found to be more severe than the tape temperature mainly due to local overheating of the substrate at locations where the translational movement of the winding head changed direction, i.e. from Round-1 to Round-2 and from Round-2 to Round-3. Here, a temperature increase of approximately
It was observed that even with constant input parameters, a complex processing temperature evolution was obtained as a function of time, location and local liner geometry. Thus, the heat flux obtained from the optical model needs to be optimized via the laser power distribution as a future work to achieve a desired process temperature in each round. In addition, the development of a more comprehensive statistical ray tracing approach is considered as a future work. To have an even more accurate process model, the experimental characterization of the roller deformation, optical and thermal material properties as a function of surface topology, temperature and fiber orientation is required. Nevertheless, the fulfilled work within this paper has already the potential to eliminate expensive trial and error based experiments through the physics-based process simulations that are well capable of predicting the major trends in the time and spatial temperature distributions of the tape and the substrate as a function of process conditions.
Footnotes
Declaration of Conflicting Interests
The author(s) declared no potential conflicts of interest with respect to the research, authorship, and/or publication of this article.
Funding
The author(s) disclosed receipt of the following financial support for the research, authorship, and/or publication of this article: The ambliFibre project has received funding from the European Union’s Horizon 2020 research and innovation programme under grant agreement No 678875. The dissemination of the project herein reflects only the authors’ view and the Commission is not responsible for any use that may be made of the information it contains.