
Abstract
In modern lightweight structures, the use of fasteners is preferred to other joining techniques. An approach to increase the bearing strength is the local metal hybridisation, where carbon fibre-reinforced plastics layers are substituted locally by metal foils of the same thickness. The local replacement leads to a transition zone between the hybrid region and the pure carbon fibre-reinforced plastics region. The present work deals with the investigation of different transition zone patterns of carbon fibre-reinforced plastics-steel hybrid specimens in combined tension–bending tests and accompanying non-linear static simulation. The simulation includes delamination and intralaminar damage with the use of a cohesive zone model and Cuntze’s failure mode concept. Furthermore, residual thermal stresses are considered. A satisfying agreement of test and simulation is achieved, which allows the identification of beneficial transition zone configurations and also validates the numerical model for further parametric studies.
Keywords
Introduction
For aerospace applications, it is common practice to use fastener-based joining techniques like bolting or riveting as parts can easily be detached. The increased use of modern lightweight materials such as carbon fibre-reinforced plastics (CFRP) is not in compliance with these techniques. In contrast to metallic materials, bearing strength and tensile strength of a laminate are not positively proportional, as shown in Figure 1.
Relation between bearing and tensile strength for metals and CFRP laminates.
1
CFRP: carbon fibre-reinforced plastics.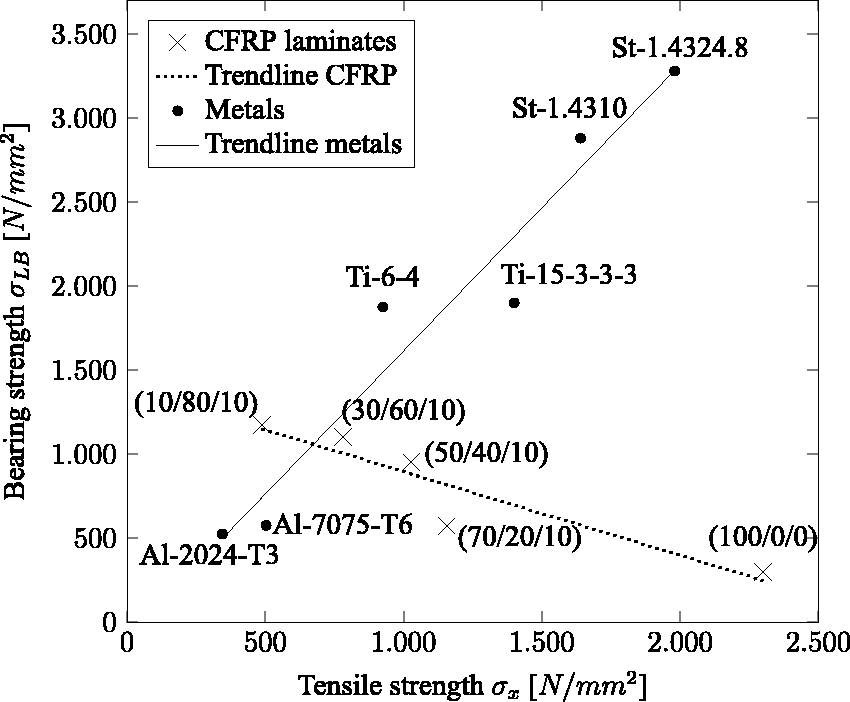
On the design side, this leads to the following conflict: Layers that contribute to the global load transfer (tensile strength) can only contribute to a small extent to the load-carrying capacity in the area of the load introduction (bearing strength) and vice versa. A highly directional laminate designed for global loads therefore usually exhibits only a low load-bearing capacity of the joints. This inevitably leads to an increase in weight through compensating methods.
There are different techniques to increase the bearing strength: e.g. inserts2–4 or externally applied patches 5 are used. These seem to be mechanically suitable methods to increase the load-carrying capacity but have to be applied in an additional manufacturing step and also change the geometric proportions. The use of steered fibre material around the load introduction area6,7 and the insertion of thin pins into the laminate 8 also represent possibilities for local strength increases, but from a production point of view, they are classified as complex and expensive. There are also approaches to influence the stress state, e.g. by changing the hole geometry 9 or by using additional holes as softening measures. 10 The latter approaches have the aim to homogenise the stresses occurring in the joining area and to reduce the maxima. There are also approaches to combine the properties of composites and metal, e.g. in the form of the insertion of metal meshes into the laminate, which can achieve an increase in the bearing strength at high hole deformations.11,12
A widely used approach to compensate the low bearing strength is the local addition of layers with a gently inclined ramp-up. This technique is especially used, if very high loads have to be transferred. Hereby, eccentricities often cannot be avoided, as in general, the outer surface must keep its contour. Thus, the ramp-up concept is always associated with unwanted secondary bending moments, which have to be compensated in the design process and lead to additional weight.13–15
A different approach to deal with the challenge of low bearing strength in composites is the local metal hybridisation. It is based on the use of metal foils to substitute CFRP layers locally in the load introduction region. The metals stiffness and bearing strength yields a high exploitable bearing strength of the fibre metal laminate (FML).16,17 The metal foils and the CFRP layers have the same thickness in the technology regarded here; hence, the volume is kept equal and the bearing strength is increased. Therefore, the unwanted eccentricities and resulting side effects can be avoided. Figure 2 shows the scheme of the local metal hybridisation.
Scheme of local metal hybridisation.
18
CFRP: carbon fibre-reinforced plastics. Scheme of the resulting normal stress σx for homogeneous material.
1
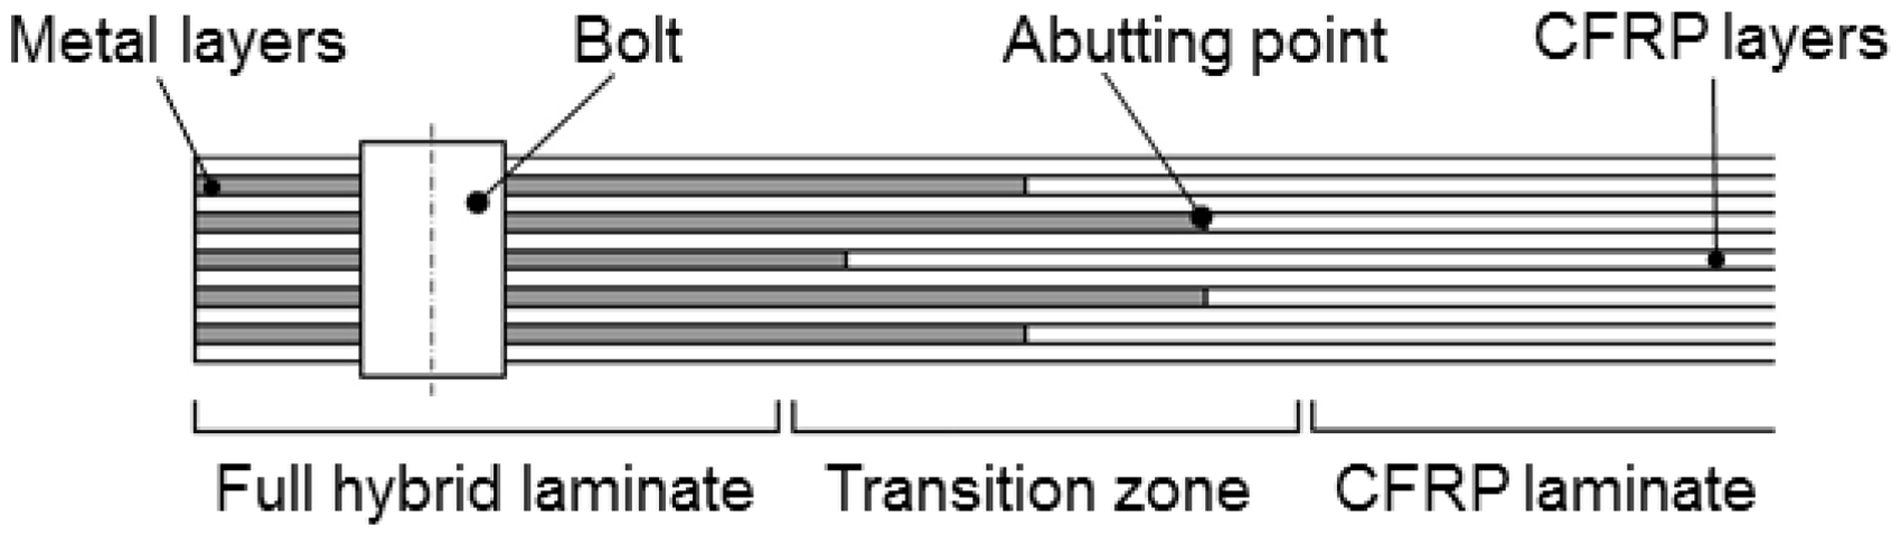
In the vicinity of the load introduction, there is a full hybrid laminate with continuous metal layers. These metal layers end at a certain distance from the bolt. In this way, the density increase in the laminate is limited to a narrow area and the good weight specific properties of the CFRP material can be exploited in the remaining structure. As implied here, the metal layer endings are arranged in a staggered pattern to realise a gradual decrease of the stiffness and the metal volume fraction (MVF). This can be realised by different patterns in the transition zone (TZ).
The technology of the local metal hybridisation was first introduced by Kolesnikov in a patent in 2000. 19 Comprehensive investigations were conducted, e.g. by Fink 20 and Kolesnikov et al. 21 and applied to a spacecraft payload adapter 22 as well as a launcher booster connection. 23 Mainly, investigations focussing on the load introduction region were conducted, where especially the load redistribution after plasticity, delamination and matrix failure were described in numerical models.24–26
Fewer investigations were performed on the TZ, e.g. by Kolesnikov et al., 21 who experimentally showed that the strength of monolithic reference specimens is achievable by titanium substitution. The reinforcing effect of different titanium foil patterns placed additionally into CFRP laminates was investigated by Nekoshima et al. 27 To obtain information about matrix failure and load redistribution, Camanho et al. 24 used cohesive zone elements to model separations at the metal ply endings. Furthermore, numerical investigations already showed a higher CFRP material stressing effort in the vicinity of closely positioned metal ply drop-offs. 28
A previous study investigated the TZ under isolated tension and bending loading in static experiments with CFRP steel specimens. 29 The results revealed that a beneficial TZ design depends on the layup and load case. In general, a gradual staggering leads to higher bearable loads as stress interactions at metal ply drop-offs can be avoided. Under bending, it is also crucial to define whether longer metal layers are placed in the specimen centre or near the top and bottom. An increased load-carrying capacity can be achieved by outer drop-offs for quasi-isotropic laminates at which ‘outer’ describes metal layer ends close to the top and bottom layers of the laminate. On the contrary, for pure 0°- and steel-laminates, those configurations lead to decreased load-carrying capacities as peel stresses lead to early delamination in the interfaces between outer steel layers and CFRP. From this study, the question of the structural behaviour under a combined load case raised.
Aim of this publication is hence the identification of beneficial TZ patterns under combined bending–tension loading and a representative layup. Therefore, static tests are conducted using specimens in a special test set-up with a load block applied on one side, which allows rotation of the specimen and therefore specimen bending. Furthermore, a non-linear static finite element (FE) simulation is validated by the comparison with the test results. It includes an intralaminar damage model as well as a cohesive zone model to take into account CFRP failure and the effect of metal ply delamination. As thermal residual stresses (RS) occur in the layers and interfaces of steel–CFRP hybrids, 30 these stresses are considered by a global temperature decrease. Based on this, the simulation can be employed to investigate arbitrary TZ designs and to define further parameters as the step distance between single metal ply drop-offs.
Application background
The investigations are carried out based on a centre wing box-to-wing connection for a generic long-range aircraft. A preliminary sizing of a hybrid joint was presented in Koord et al.31,32 using a method specifically developed for that purpose. From this application, the load and boundary conditions as well as layup and required metal content are derived. The design of the hybrid steel laminate leads to 40% MVF that is required to introduce the load by 24 steel bolts. 32
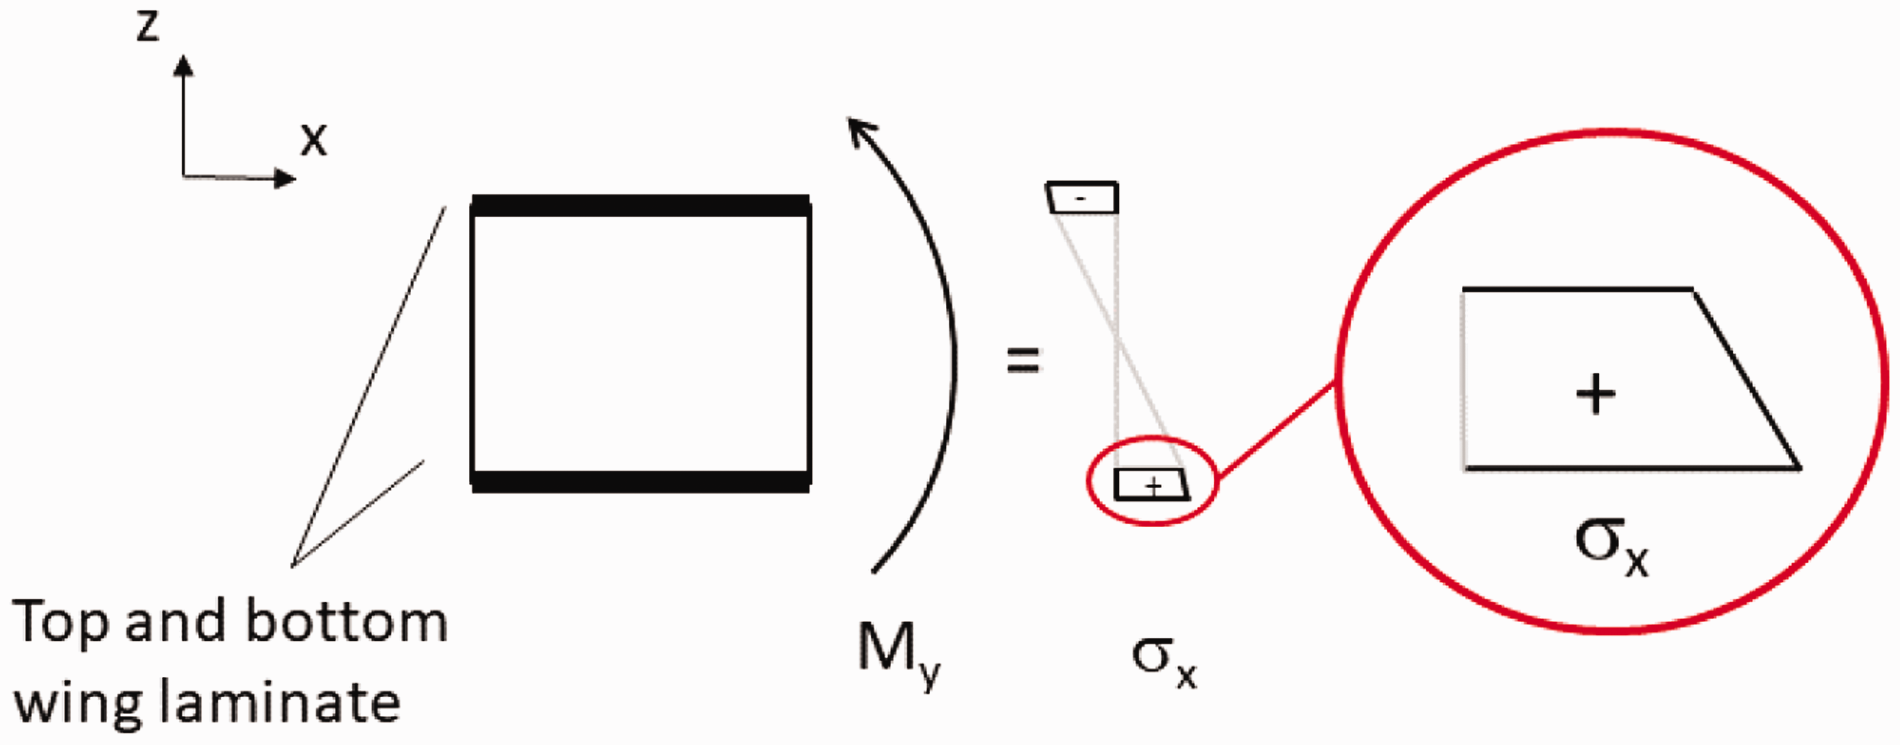
The stress distribution in a wing laminate is considered. As a global load case, a dominant bending moment acts on the wing, which generates a stress distribution in the laminates of the upper and lower shell, as illustrated in Figure 3.
This longitudinal stress distribution can be superimposed by a normal and a bending component, as shown in Figure 4. In the considered application, the ratio of bending stress to normal stress is roughly 1:10.
33
The normal load dominates here and the bending component is more likely to occur as a parasitic load. Due to the experimental feasibility, only the load case of the lower shell from tensile load and bending is investigated and not the interaction with a compressive longitudinal stress.
Superposition of normal stress distribution σx from tensile and bending components for homogeneous material.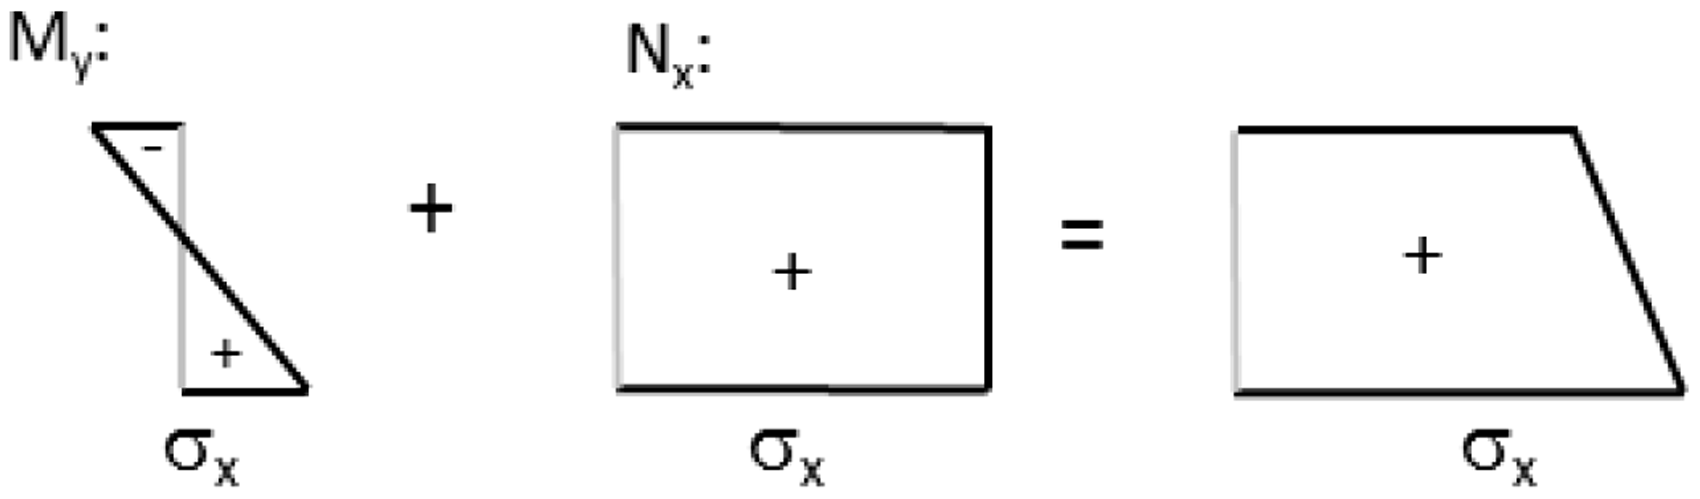
The applications original laminate measures t = 16.25 mm and has an orientation layer ratio of (60/30/10), which represents the layer percentage of the total laminate in 0°, ±45° and 90° orientation. In order to enable a mechanical test with the available equipment, but also a numerical simulation with a manageable computing effort, the laminate is reduced to a thickness t = 2.9 mm while approximately maintaining the ratio of the layer orientations.
Experimental set-up
Application of a combined tension–bending load
To investigate the effect of a combined load case by experiment, a feasible realisation to introduce the loading is required. In general, an eccentricity as occurring in a single lap joint test leads to a combined tensile and bending load case as shown in Figure 5.
Principle of single lap joint test set-up for the combination of tension and bending.
34
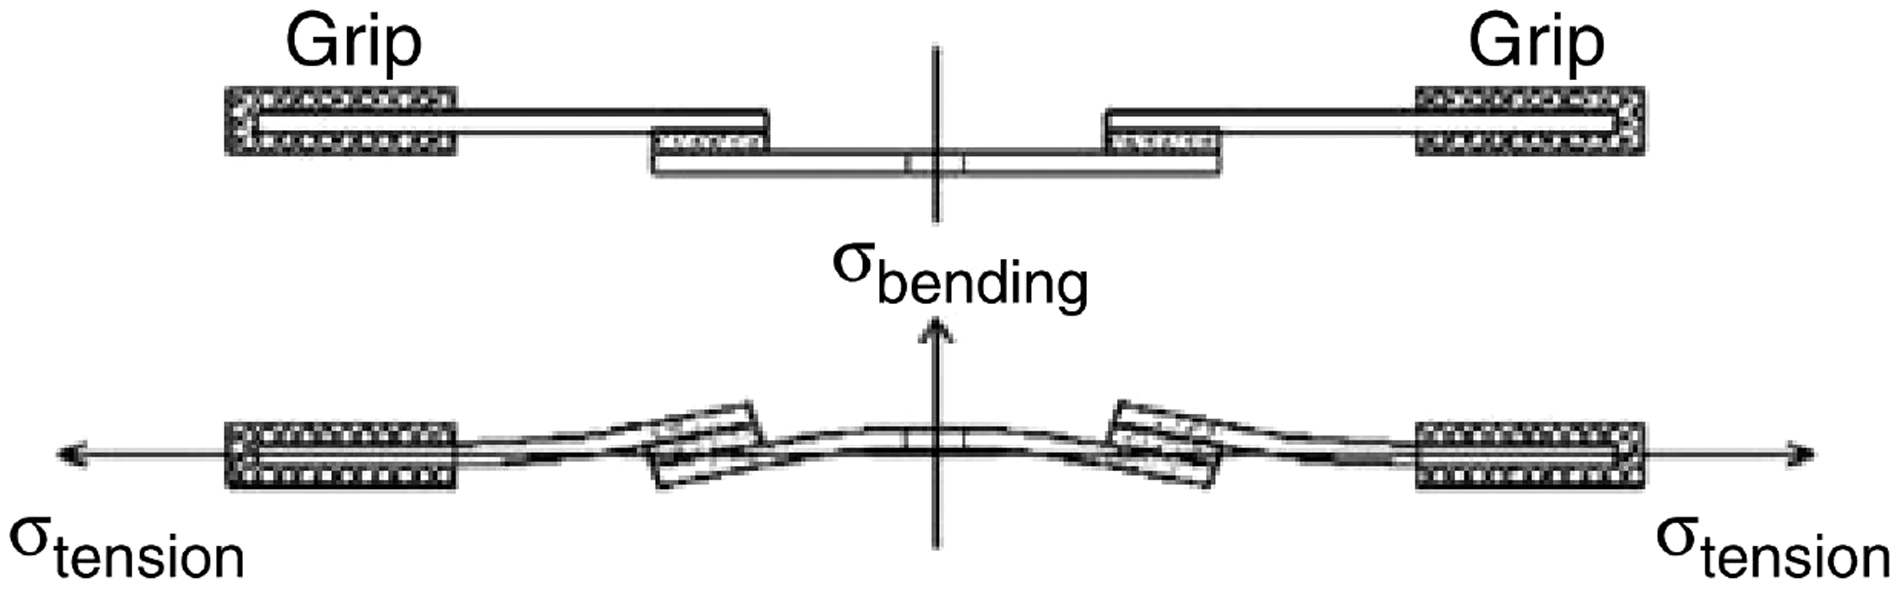
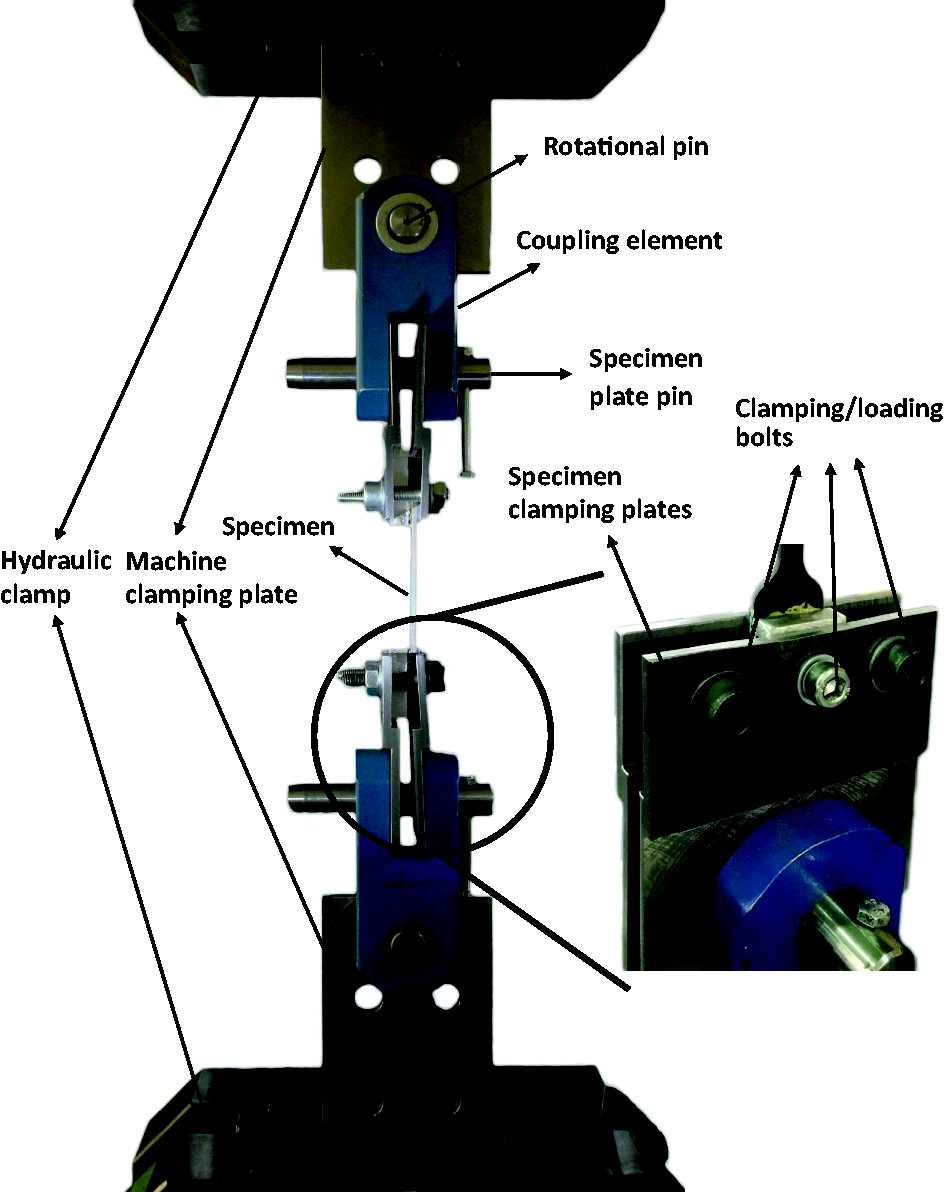
This principle follows the otherwise undesired eccentricity of single-sided connections to generate the bending moment.34–36 In an adapted configuration, a tensile specimen is provided with an eccentricity by a spacer block directly at the support.33,34,37 A major challenge is to enable the rotation at this load introduction into the test specimen and thus the bending in the specimen. As a result, the specimen cannot be clamped in the test device under high contact pressure as it would otherwise be the case. Instead, a specially designed load introduction is required to transfer the required load into the specimen. Figure 6 shows the apparatus used including a detailed view on the load introduction on the right. It is based on two principles: On the one hand, the specimens and the load introduction blocks are clamped between two steel plates by applying a torque to two M10 screws. On the other hand, load transfer takes place via hole bearing of an M8 screw, which requires drilling through the specimen and load introduction block. A tightening torque is also applied to this bolt.
Test set-up to enable tensile force and moment (l) and load introduction into the specimen (r).
33
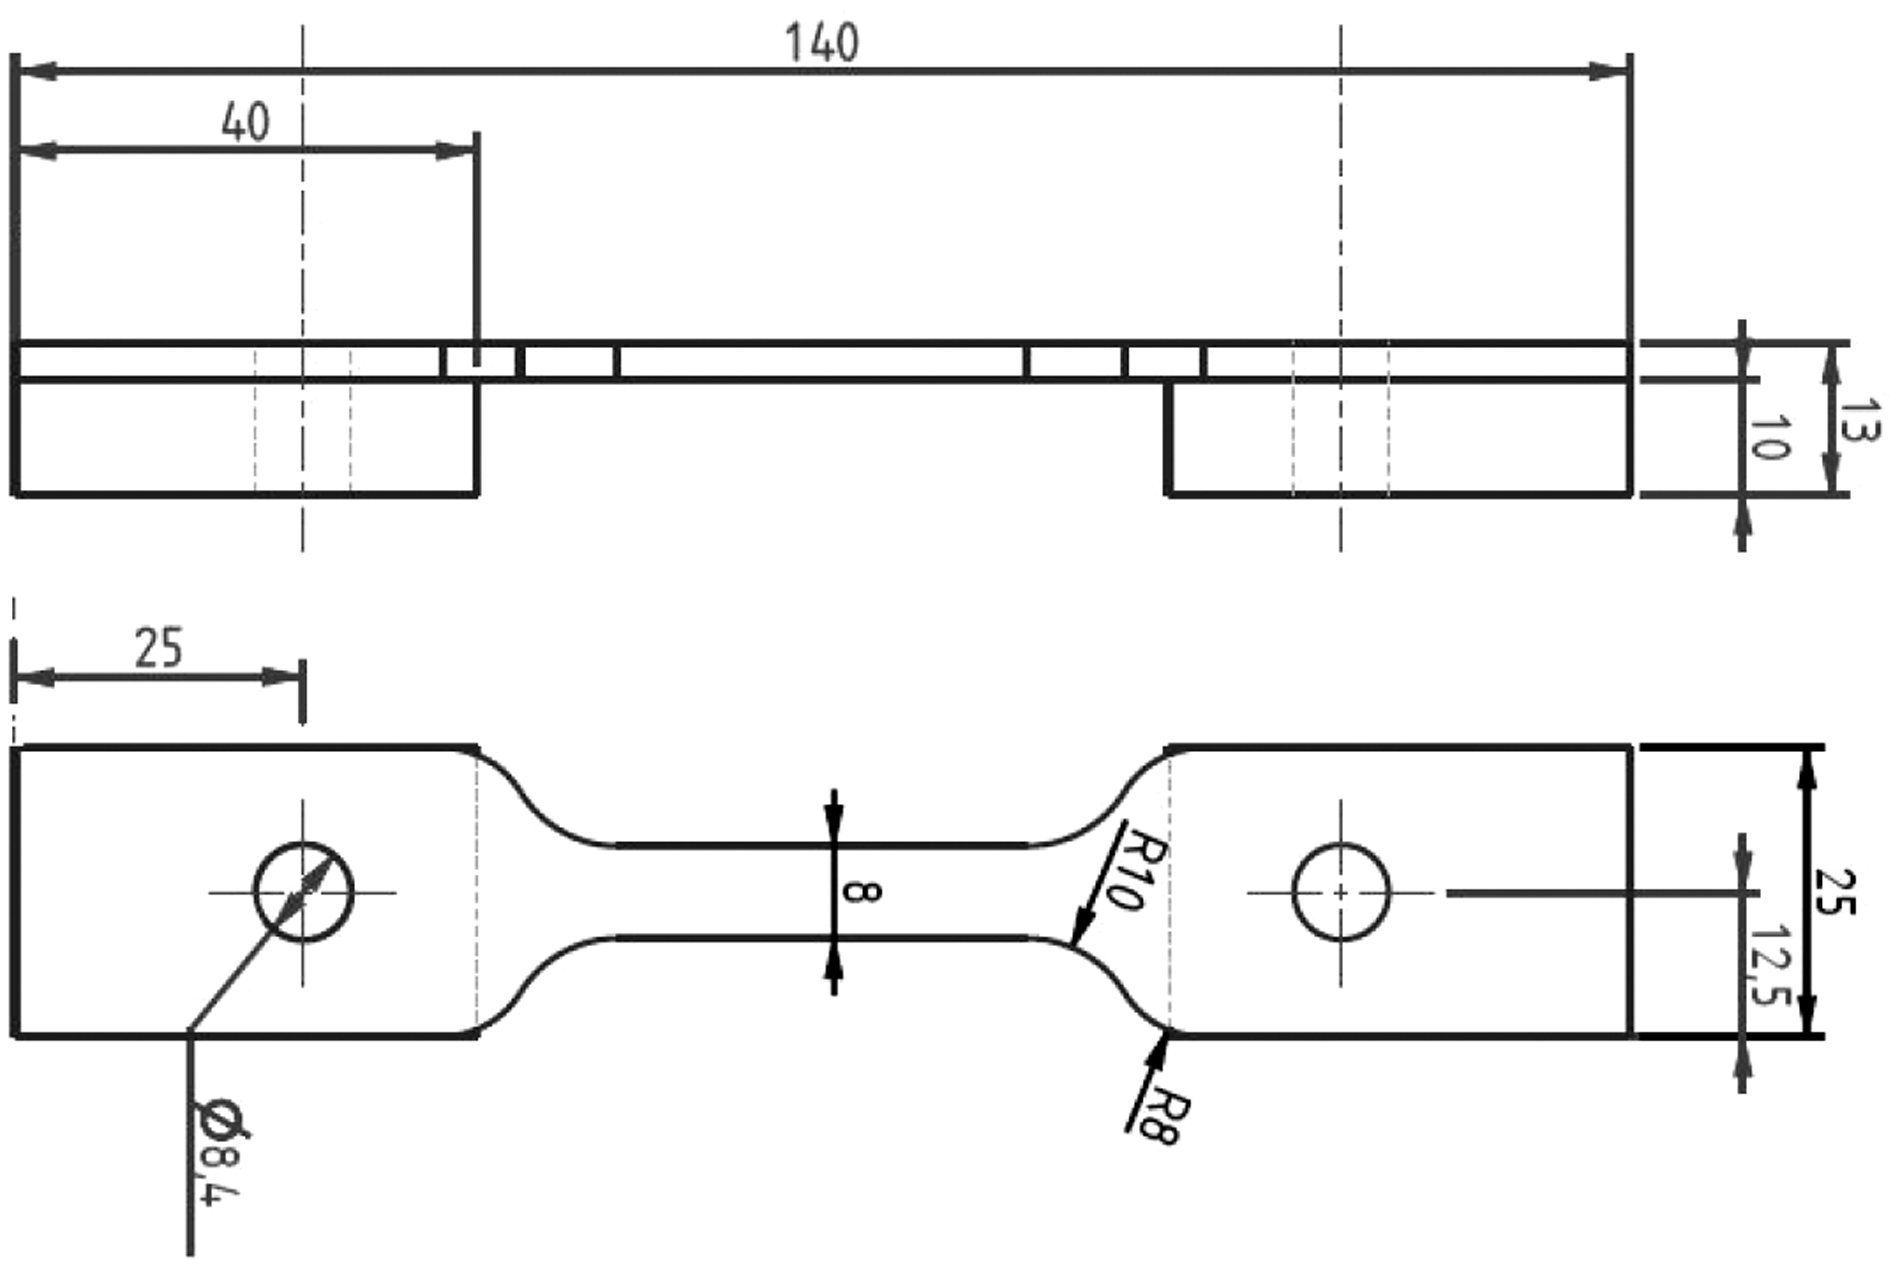
In addition, dog-bone-shaped specimens are necessary to induce failure in the free test length. Therefore, the maximum possible radius is selected with the aim of keeping stress concentrations as low as possible. The specimen geometrical dimensions are shown in Figure 7. These were determined in an iterative process which is described in detail in a previous study.
33
Dimensions of considered specimens in millimetre.
1
An exact prediction of the bending ratio is difficult due to the following points: As the tensile load increases, the bending ratio decreases again, since the bending stiffness hinders the rotation of the specimens. Furthermore, the deflection of the specimen leads to a lower eccentricity, which also leads to a reduction of the bending portion with increasing load. This results in a non-constant moment over the free test length, which has a minimum in the centre of the test specimen. Moreover, the friction in the rotational pins results in a force dependence of the resulting rotational stiffness.
Overall, there is a non-proportional relationship between the bending component and the applied load, and an analytical approximation is only possible in a simplified manner. One possibility for determining the bending ratio is the measurement of the angle of rotation at the load introduction in the test. 34
Digital image correlation
In order to identify the bending portion, the digital image correlation (DIC) system ARAMIS by the GoM Company is used for the experiments. Therein, the strains are measured sidewise over the specimen thickness. In order to achieve a high resolution, a two-dimensional measurement set-up with the smallest possible measuring field is used. However, large movements of the specimen during testing have to be considered and reduce the usable measuring field size. Since large settlements occur in the test set-up, a preload of 600 N is applied before the strain measurement is started.
Complications with the applied stochastic pattern have occurred during the DIC measurements and in some of the tests, the strain measurement was not possible or only possible with considerable loss of measurement accuracy. Some tests also result in partial or complete loss of the DIC measurement after sudden settlements or damage, as a fine, unbound powder is applied to achieve the desired resolution. 38
Specimen manufacturing and design
The specimens are manufactured with thermosetting prepreg technology (M21/T700GC) by hand layup. As substitution material the austenitic spring steel 1.4310 of the same thickness as the CFRP prepreg is used (t = 0.13 mm). The foil’s rolling direction is aligned with the longitudinal direction of the specimens. Before laying, a pre-treatment of the steel foil is necessary to achieve the required bonding strength. Vacuum grit blasting is used to remove the contaminated oxide film on the steel foil, followed by a patented sol-gel process.39–41 An autoclave is used for curing following the manufacturers’ recommended curing cycle. Glass fibre tabs are applied on the cured CFRP laminates with a film adhesive. The specimens are then cut to their final geometry by water jet. A dog-bone shape is chosen to guarantee a failure position in the free length. Finally, 10-mm-thick aluminium blocks are applied on one side by a pasty epoxy adhesive to realise an eccentricity, as illustrated in Figure 7. Holes are drilled by solid carbide drills through specimens and spacer blocks.
The following base laminate is considered as it represents a (60/30/10)-laminate like in the chosen application from ‘Application background’ section
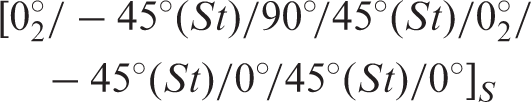
To build the FML layups, the marked CFRP layers (e.g. Investigated transition zones shown in cut-outs of the specimens.
1
TZ: transition zone.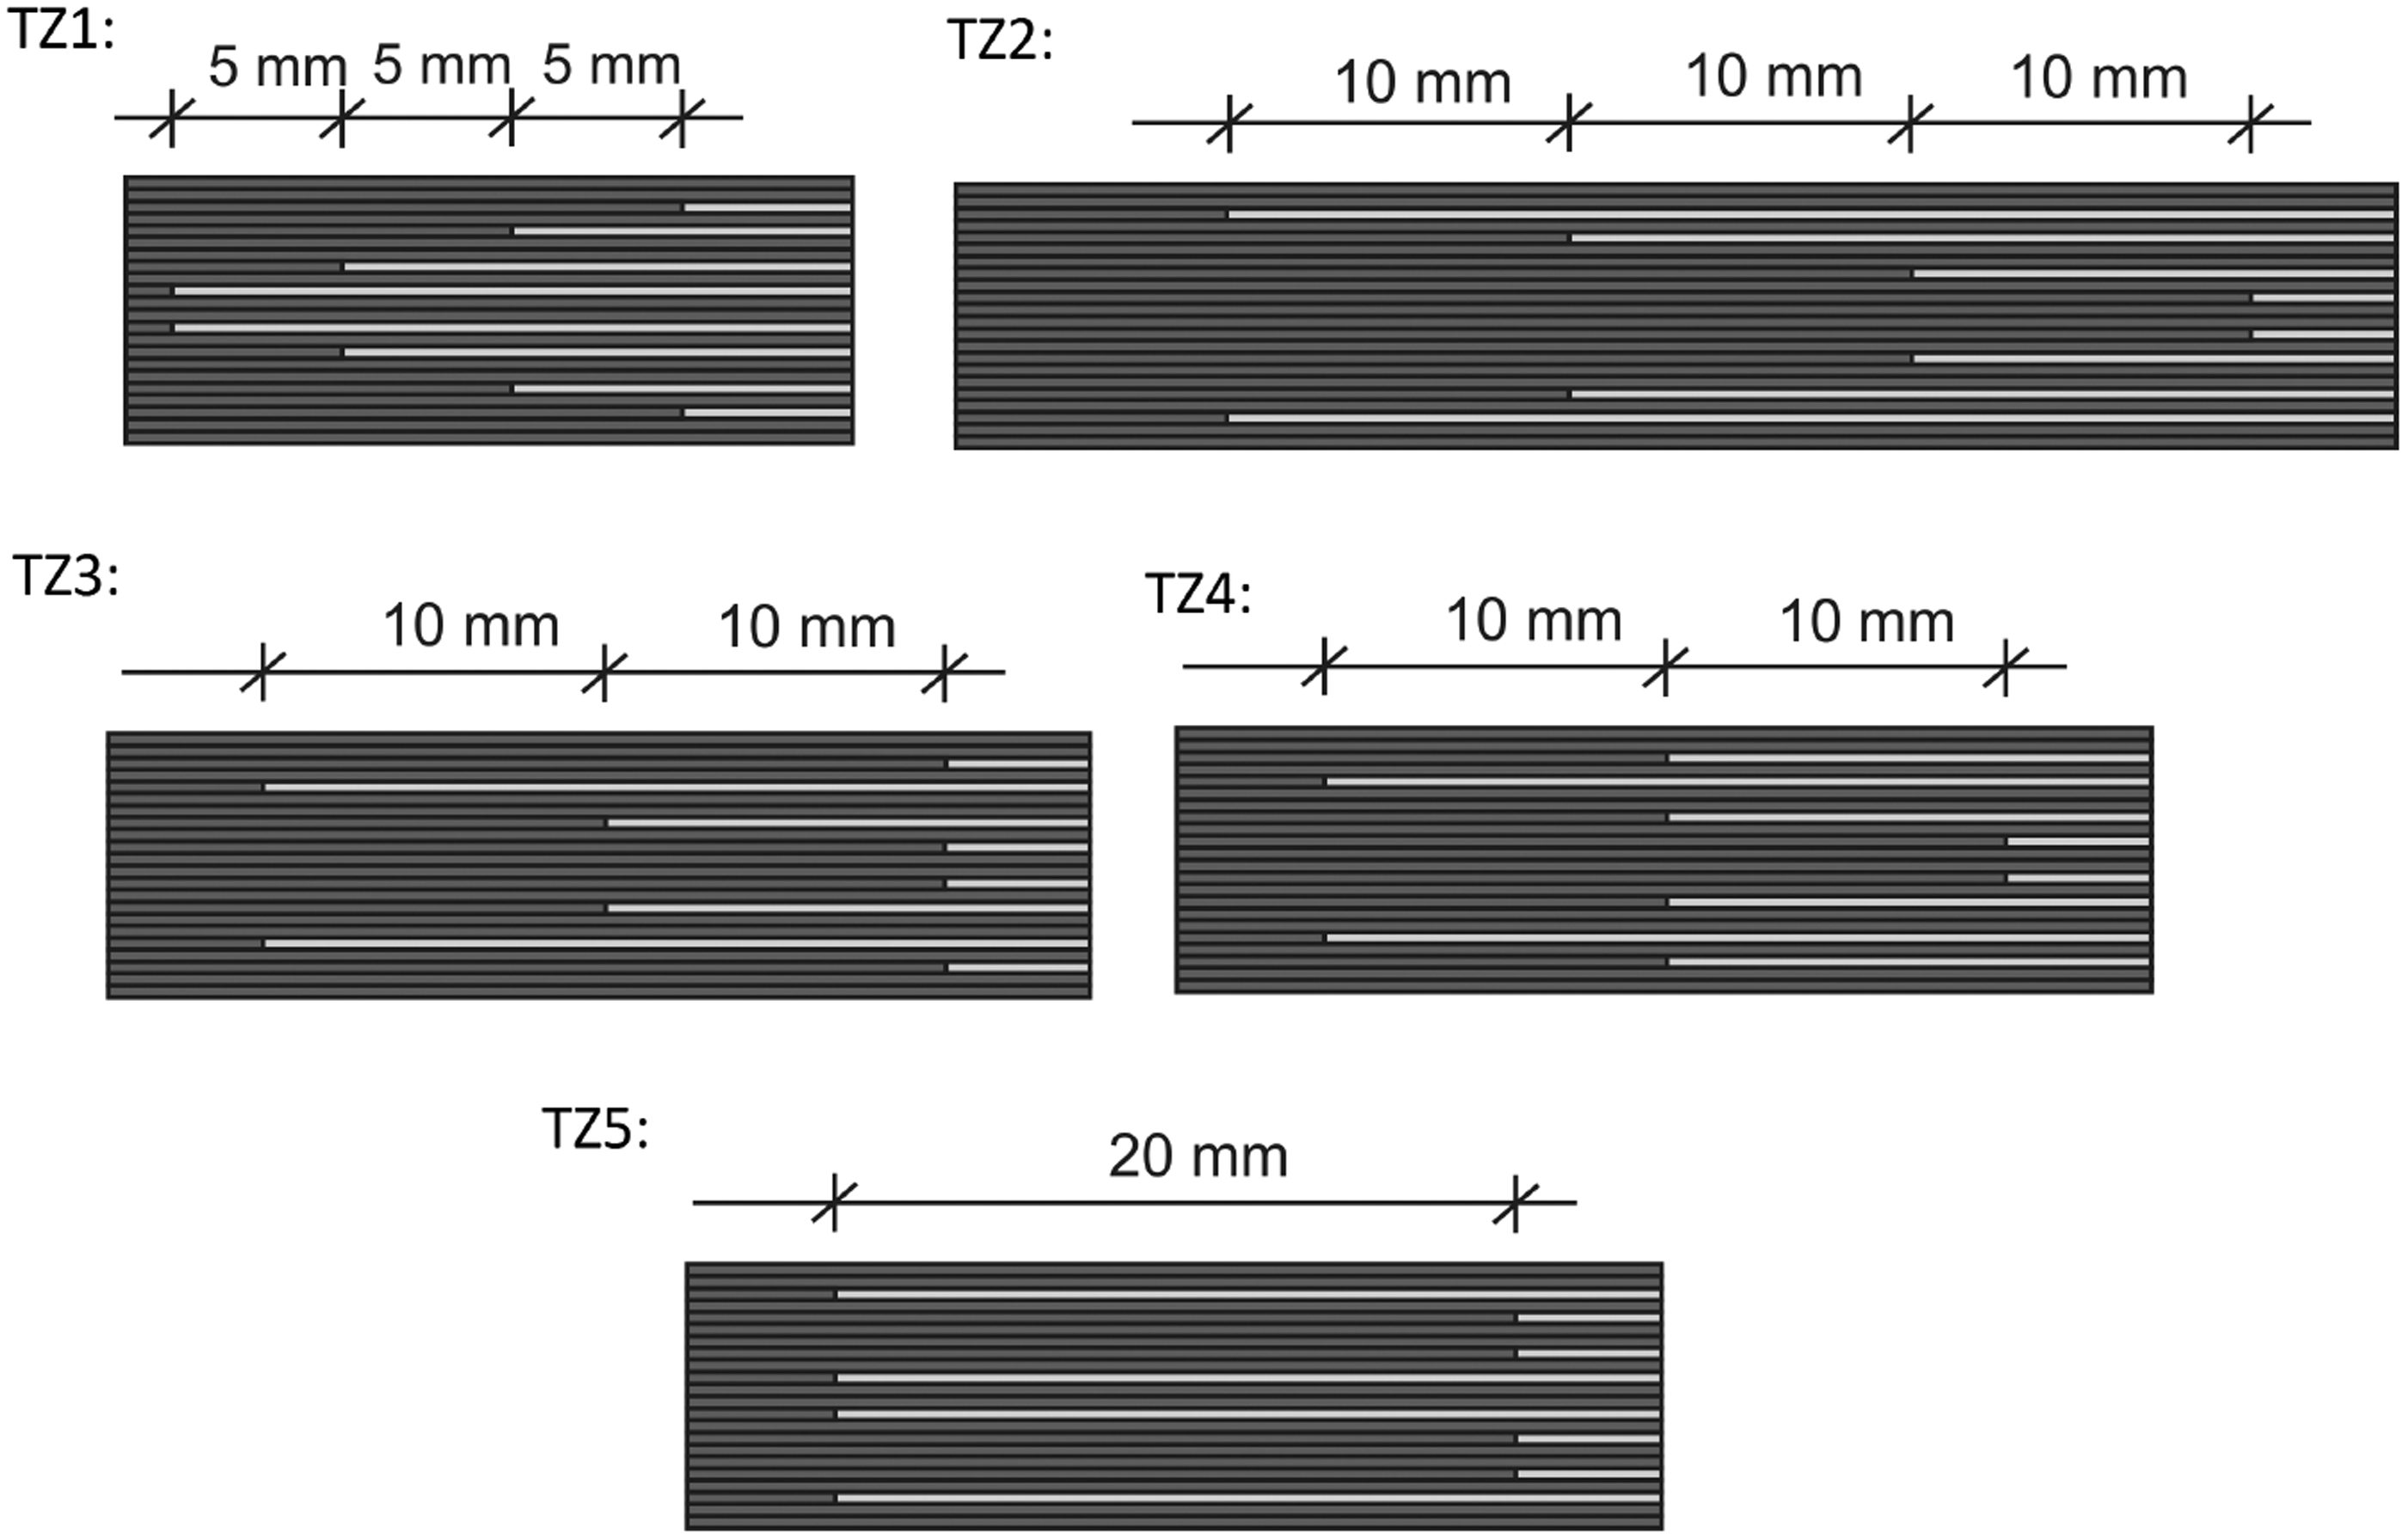
The selection includes metal ply drop-off distributions of more theoretical interest and those for which a particularly good suitability under the considered tension–bending load case is expected. Thus, the transition zones TZ1 and TZ2 represent the optima for tension and bending, respectively, as identified from previous investigations. 18 When designing, preliminary distances between metal drop-offs must be selected. These can in principle be chosen shorter for tension than for bending. 18 For TZ1, a 5-mm step distance is selected as the initial length, since the load in pure tensile configuration does not contain any Mode I portion. Hence, a shorter distance compared to the others can be chosen. TZ5 is unsuitable for both bending and tensile loading due to the high delamination tendency of the outer layers and the high stiffness jump between monolithic and hybrid areas. For the transition areas TZ3 and TZ4, a good suitability for the considered load case is expected. In addition, a CFRP reference without metal is investigated.
Numerical modelling
FE model of combined loading case
A non-linear static implicit simulation with the software Abaqus/Standard is conducted. The combined tension–bending load is applied by using an eccentric reference point (e = 6.5 mm) from which the load is transferred into the laminate. Hereby, the ends of the specimen can rotate freely. For simplification, only a central 70 mm area of the specimen is modelled, which contains the metal layer drop-offs. Tailoring and load introduction areas are also left out. With this approach, the deformation of the recessed areas is neglected and a rather constant bending moment is generated.
In addition to the mechanical load, the influence of RS is considered by a global temperature load case
To avoid outer stresses resulting from thermal elongation and outer boundary conditions, a temperature decrease is applied first in a separated load step without any constraint degrees of freedom (Step 1). These boundary constraints (BCs) are applied in a second load step (Step 2) using multi-point constraints and reference points (RPs), see Figure 9(a) for the load application scheme. In this procedure, thermal expansion occurs mainly in the longitudinal direction. It has no influence on the tensile–bending ratio and is therefore accepted. The model uses linear solid elements (C3D8) with one element per layer in thickness direction and is shown in Figure 9(b). At all, the Abaqus solver estimates 137,928 degrees of freedom in the model.
Load application scheme (a) and FE model (b) for the generation of residual stresses as well as combined tensile and bending load cases. BC: boundary constraint; RP: reference point.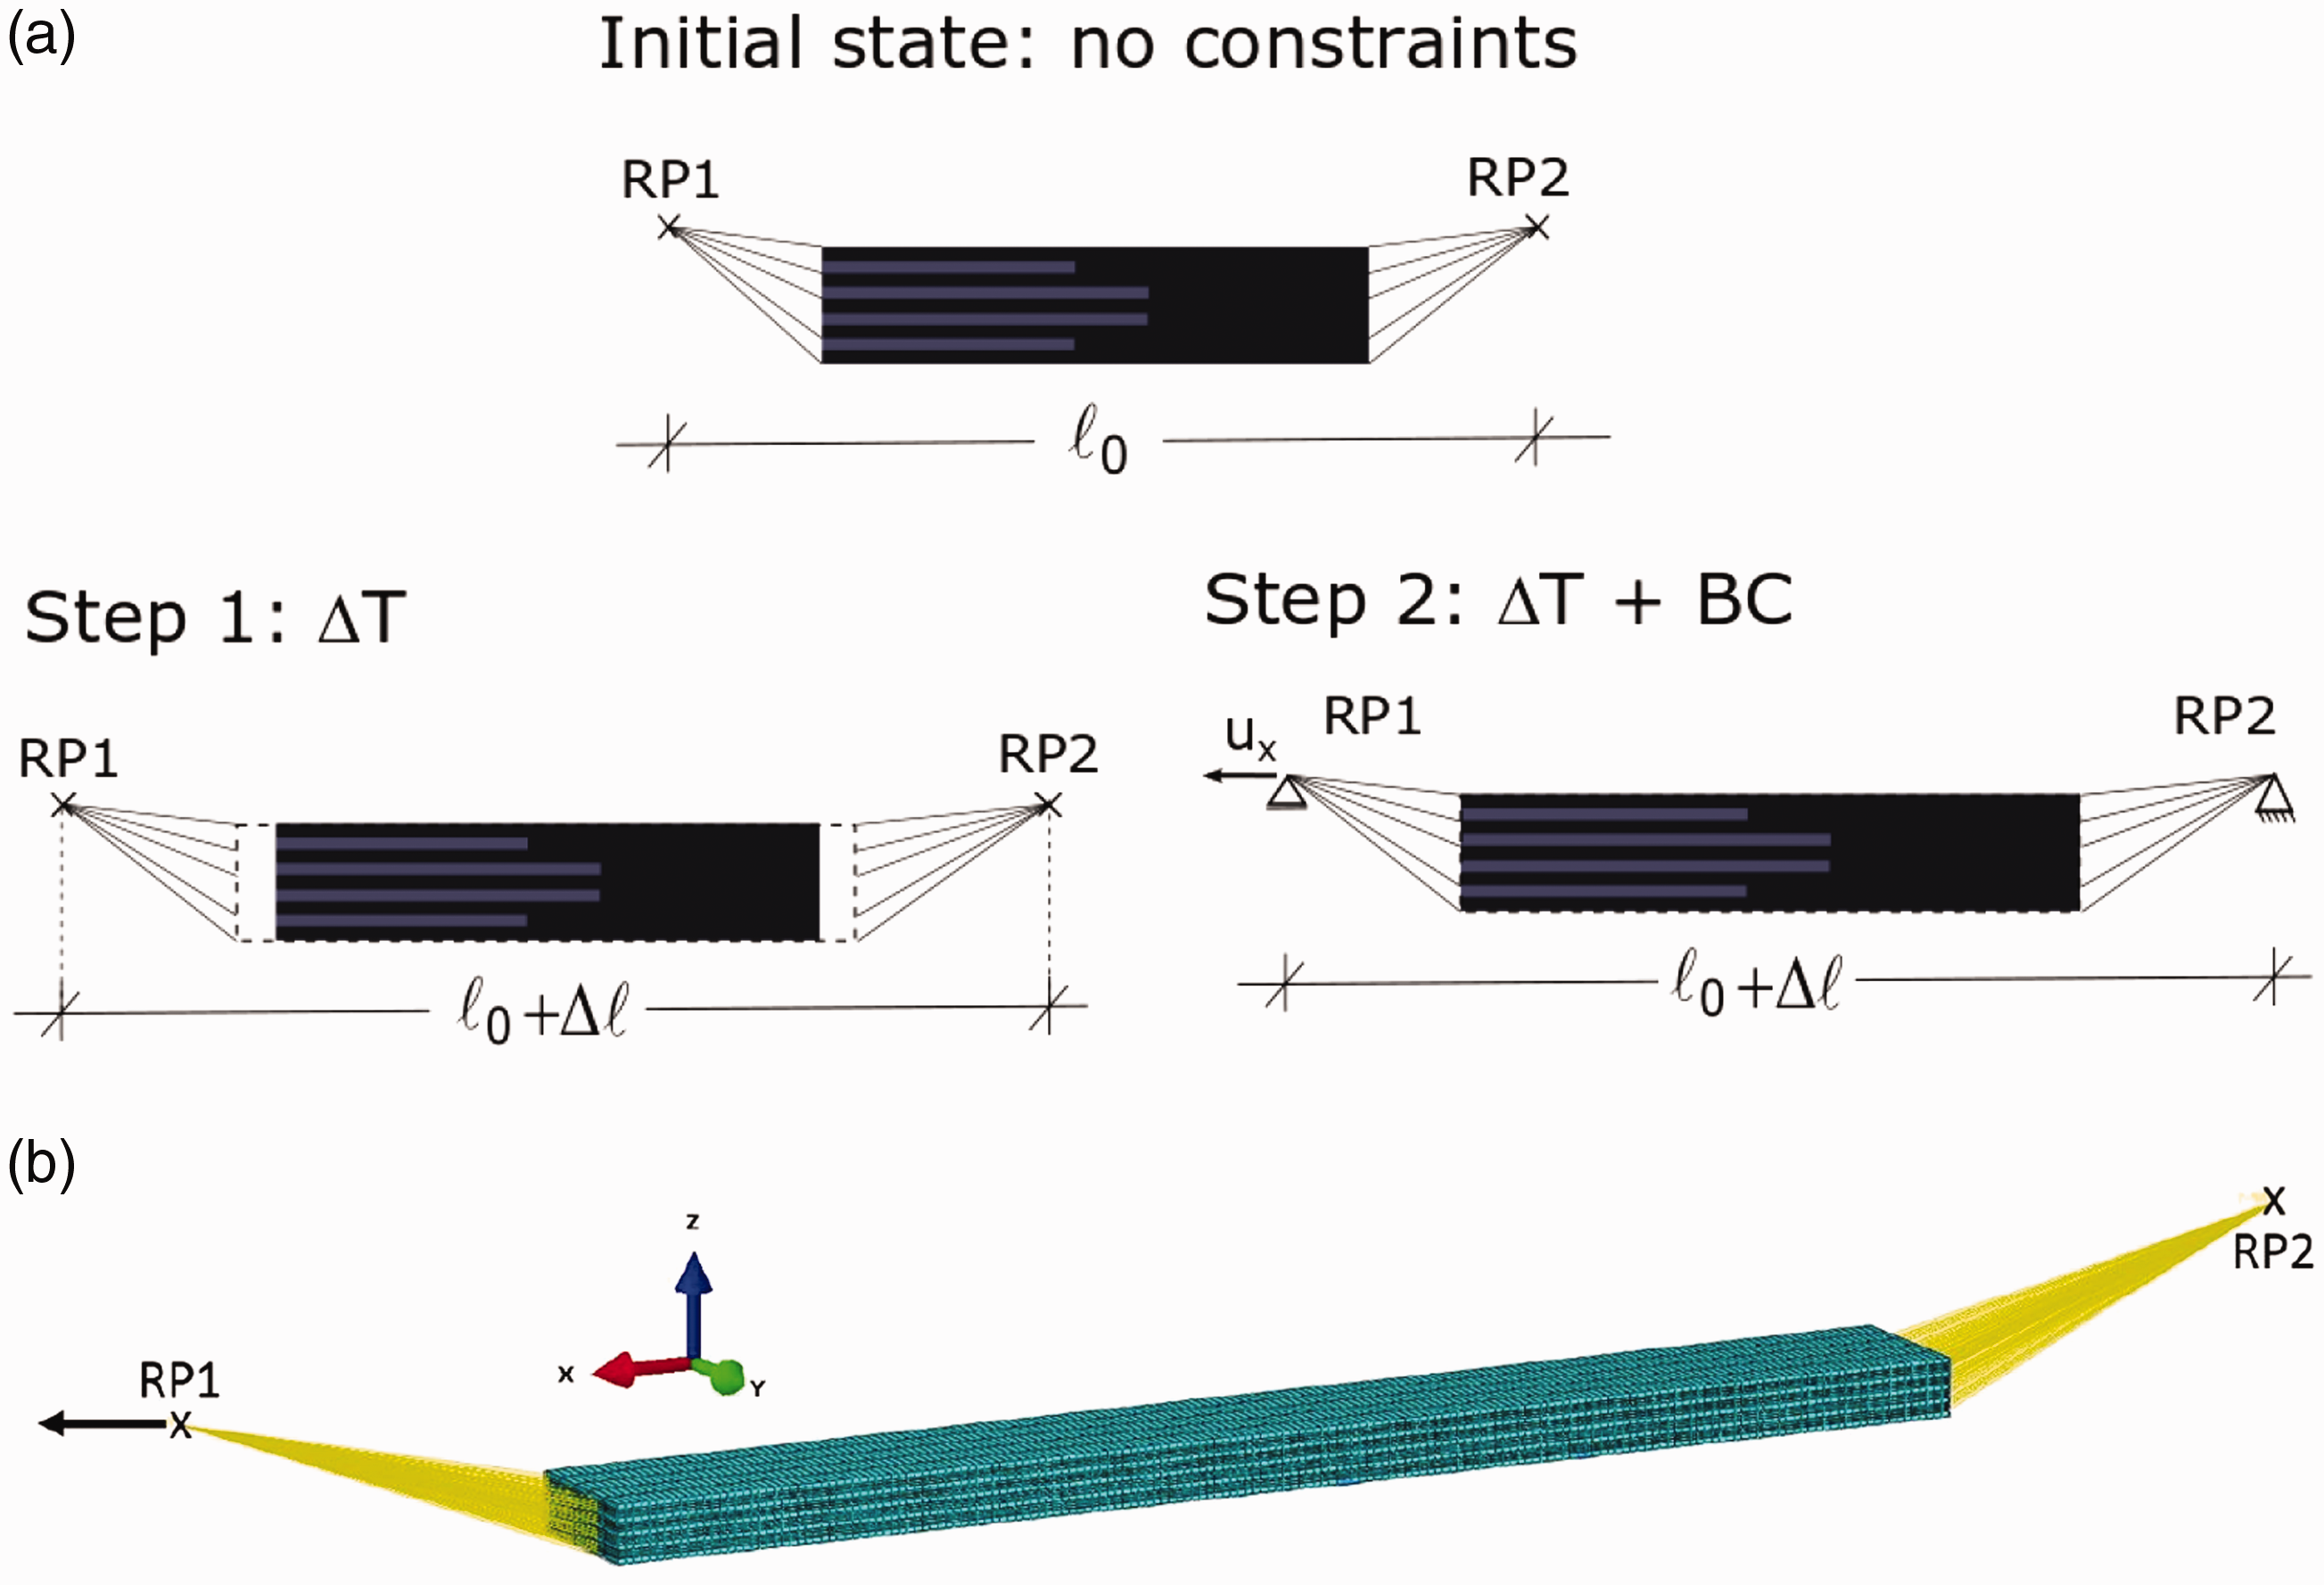
Interlaminar damage model
In general, when talking about delamination, it is distinguished between three different fracture modes known from fracture mechanics: Mode I (peel mode), Mode II (shear, in plane of crack propagation) and Mode III (shear, transverse to crack propagation). Combinations of the three modes are possible. The occurrence of delaminations is implemented via cohesive zone contacts between the layers. If a load is applied, the behaviour is initially linear, as shown in an example for Mode I in Figure 10.
Scheme of linear cohesive zone model illustrated for pure peeling load.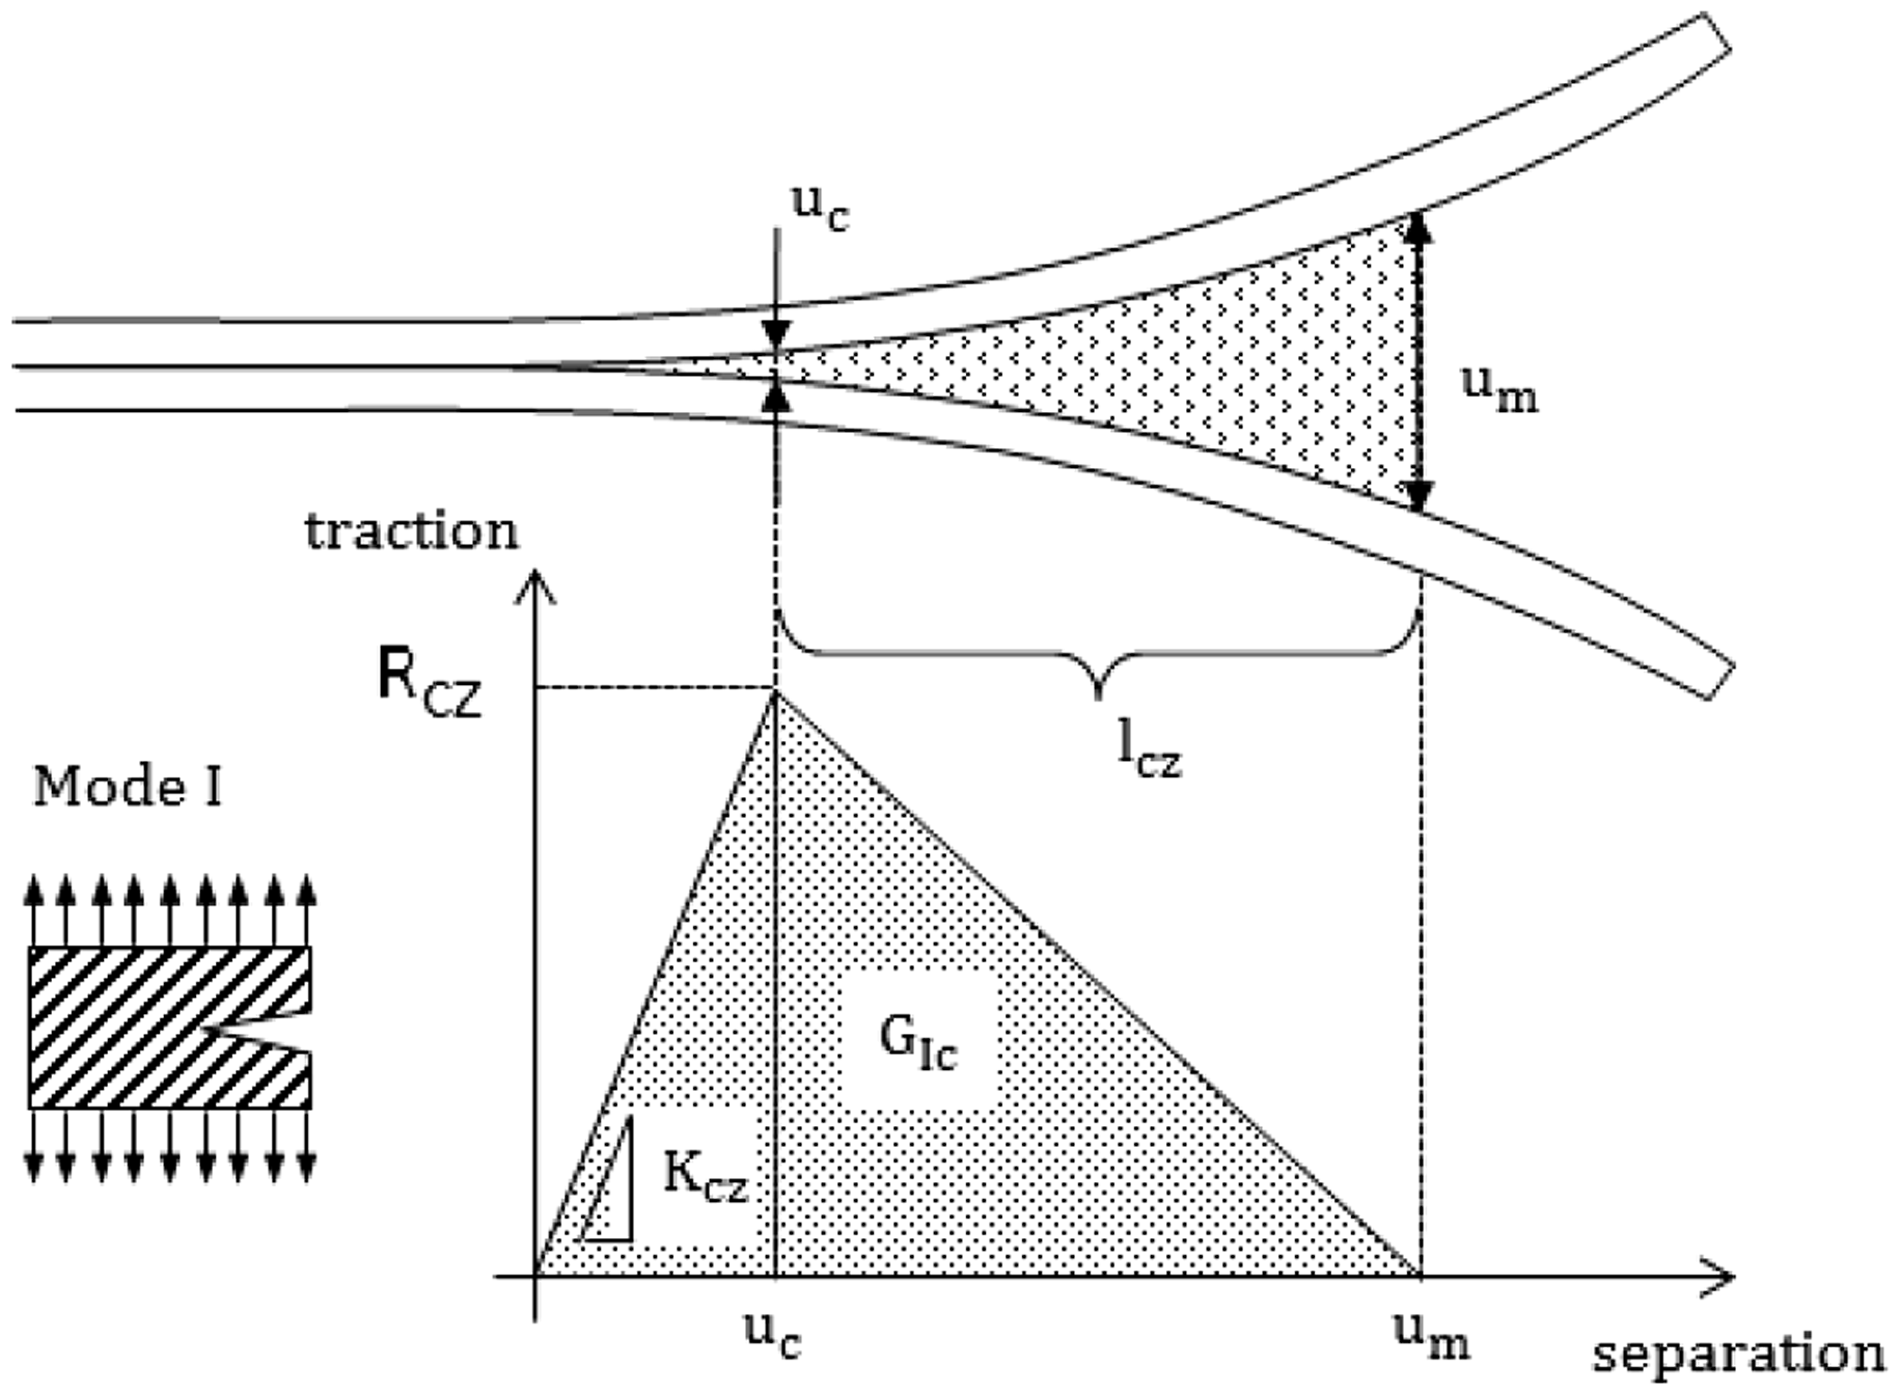
If the maximum value of an applied load is exceeded, a degradation mechanism is activated. This maximum value represents a critical stress Rcz (traction, interface strength). For multiple loads, a combination is made to form a resulting stress σres or displacement ures

After the critical loading is reached

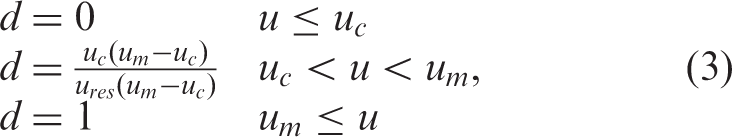
Hereby, uc and um are the critical and maximum opening as depicted in Figure 10.
Furthermore, the Reeder law
43
is considered to take into account simultaneous acting fracture modes by
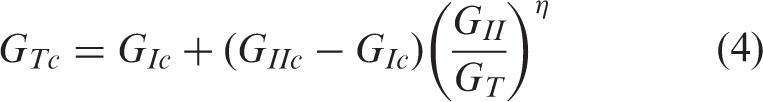
The required critical energy release rates Gc and the mixed-mode-parameter η are taken from Petersen et al., 42 which are corrected by the amount of the residual thermal stresses according to the Yokozeki method. 44 These are listed in Table 3.
Based on parametric studies and recommendations by Turon et al.,
45
further numerical parameters are chosen: The interface stiffness is
In the course of the investigations, it has been shown that separations occur almost exclusively between steel and CFRP and can usually be limited to these interfaces in order to save computing time.
Intralaminar damage model
Isotropic behaviour is assumed for the steel foil. The steel foil’s plasticity, as determined in static tests, 18 is considered by the definition of a plastic strain component. Results of the steel foil characterisation are listed in the annex in Table 2.
To identify the intralaminar failure in the CFRP layers, the three-dimensional Cuntze failure mode concept (FMC) is employed.46,47 Five intralaminar failure modes are considered, which can be distinguished into two fibre failure (FF) modes and three inter fibre failure (IFF) modes. The concept assumes transversely isotropic material behaviour (one plane in fibre direction
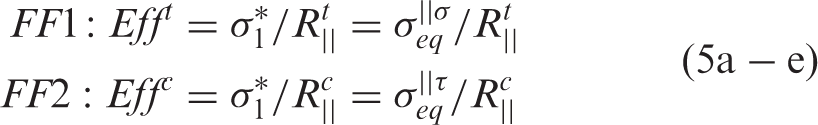
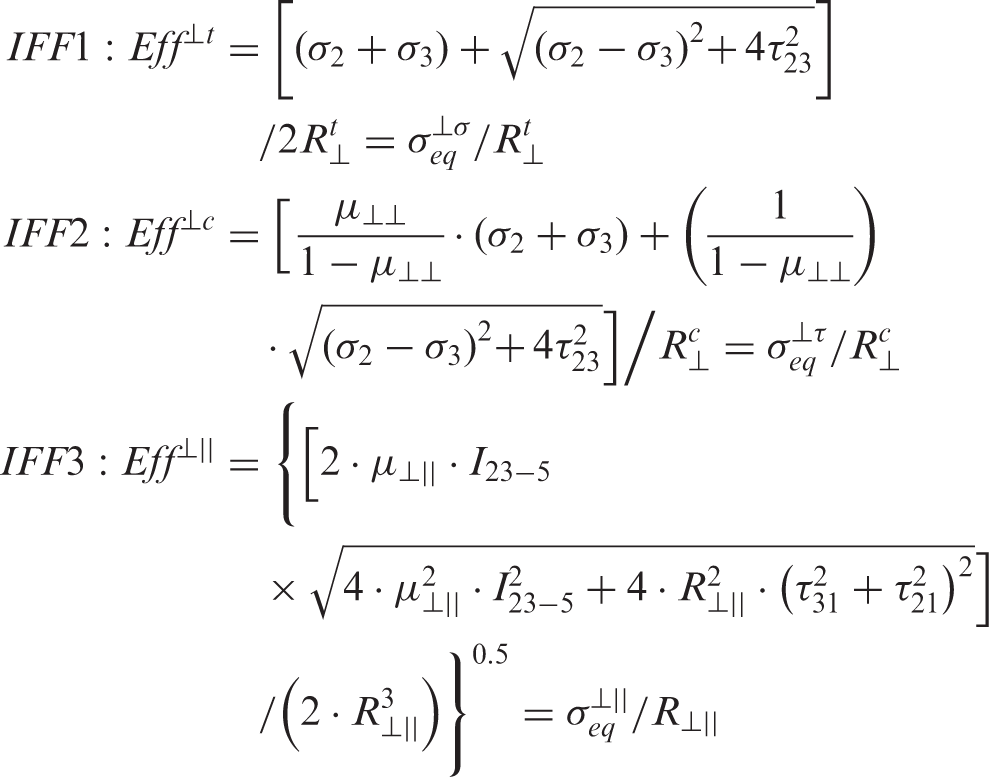
A further special feature is the FF condition

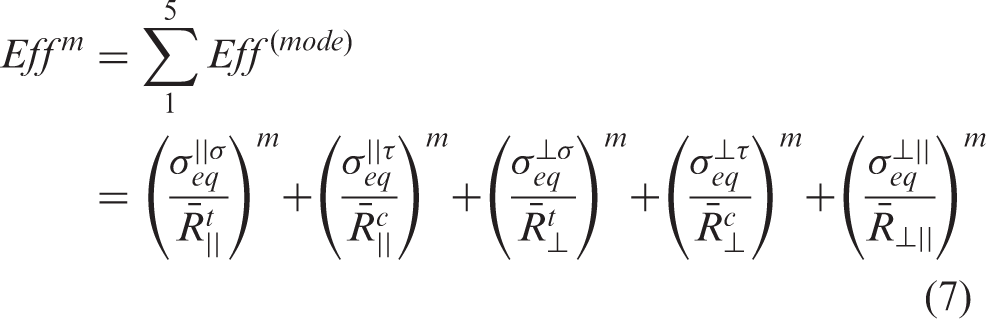
Failure or better said, first material overexertion is indicated by
If failure is detected the element’s elastic modulus is degraded. A user subroutine ‘User Defined Field’ within the commercial FE software Abaqus/Standard is used, since its suitability was proven in several publications.48–50 The degradation is activated by failure initiation defined by the FMC and then a degradation scheme is activated, which reduces the stiffness constantly at the integration points.
Therefore, so-called ‘solution-dependent state variables’ (SDVs) and ‘field variables’ (FVs) are used. SDV1 to SDV5 are the failure indices of the FF1 to IFF3 modes according to Cuntze. If an SDV becomes 1, the corresponding FV is set to the value 1, otherwise they are 0. A value of 1 leads to a reduction of the corresponding elasticity. Hereby, combinations of FV lead to a higher reduction and are therefore taking into account the interaction of failure modes. Thus, the FVs fulfil the function of storing the damage state, which is determined by the failure criterion. This prevents ‘self-healing’ of the material after reduction of the elasticity and subsequent load redistribution.
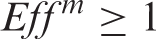
Verification is performed using a unit cell with a volume element with an edge length of 100 mm. To check FF1, FF2, IFF1 and IFF2, the unit cell is constrained translatorically on three sides in one direction so that it cannot move freely in space and at the same time no transverse contraction effects can occur. Subsequently, a quasi-static load is applied via displacements, resulting in the desired stress state. The stress–strain curves, which were determined from reaction forces and displacement, are shown in Figure 11. Under uniaxial loading, degradation occurs when the corresponding strength is reached and failure index of 1 can be determined. In case of a compressive load, the remaining load-carrying capacity can be seen.
Stress–strain curves determined with unit cell model: (a) FF and (b) IFF. FF: fibre failure; IFF: inter fibre failure.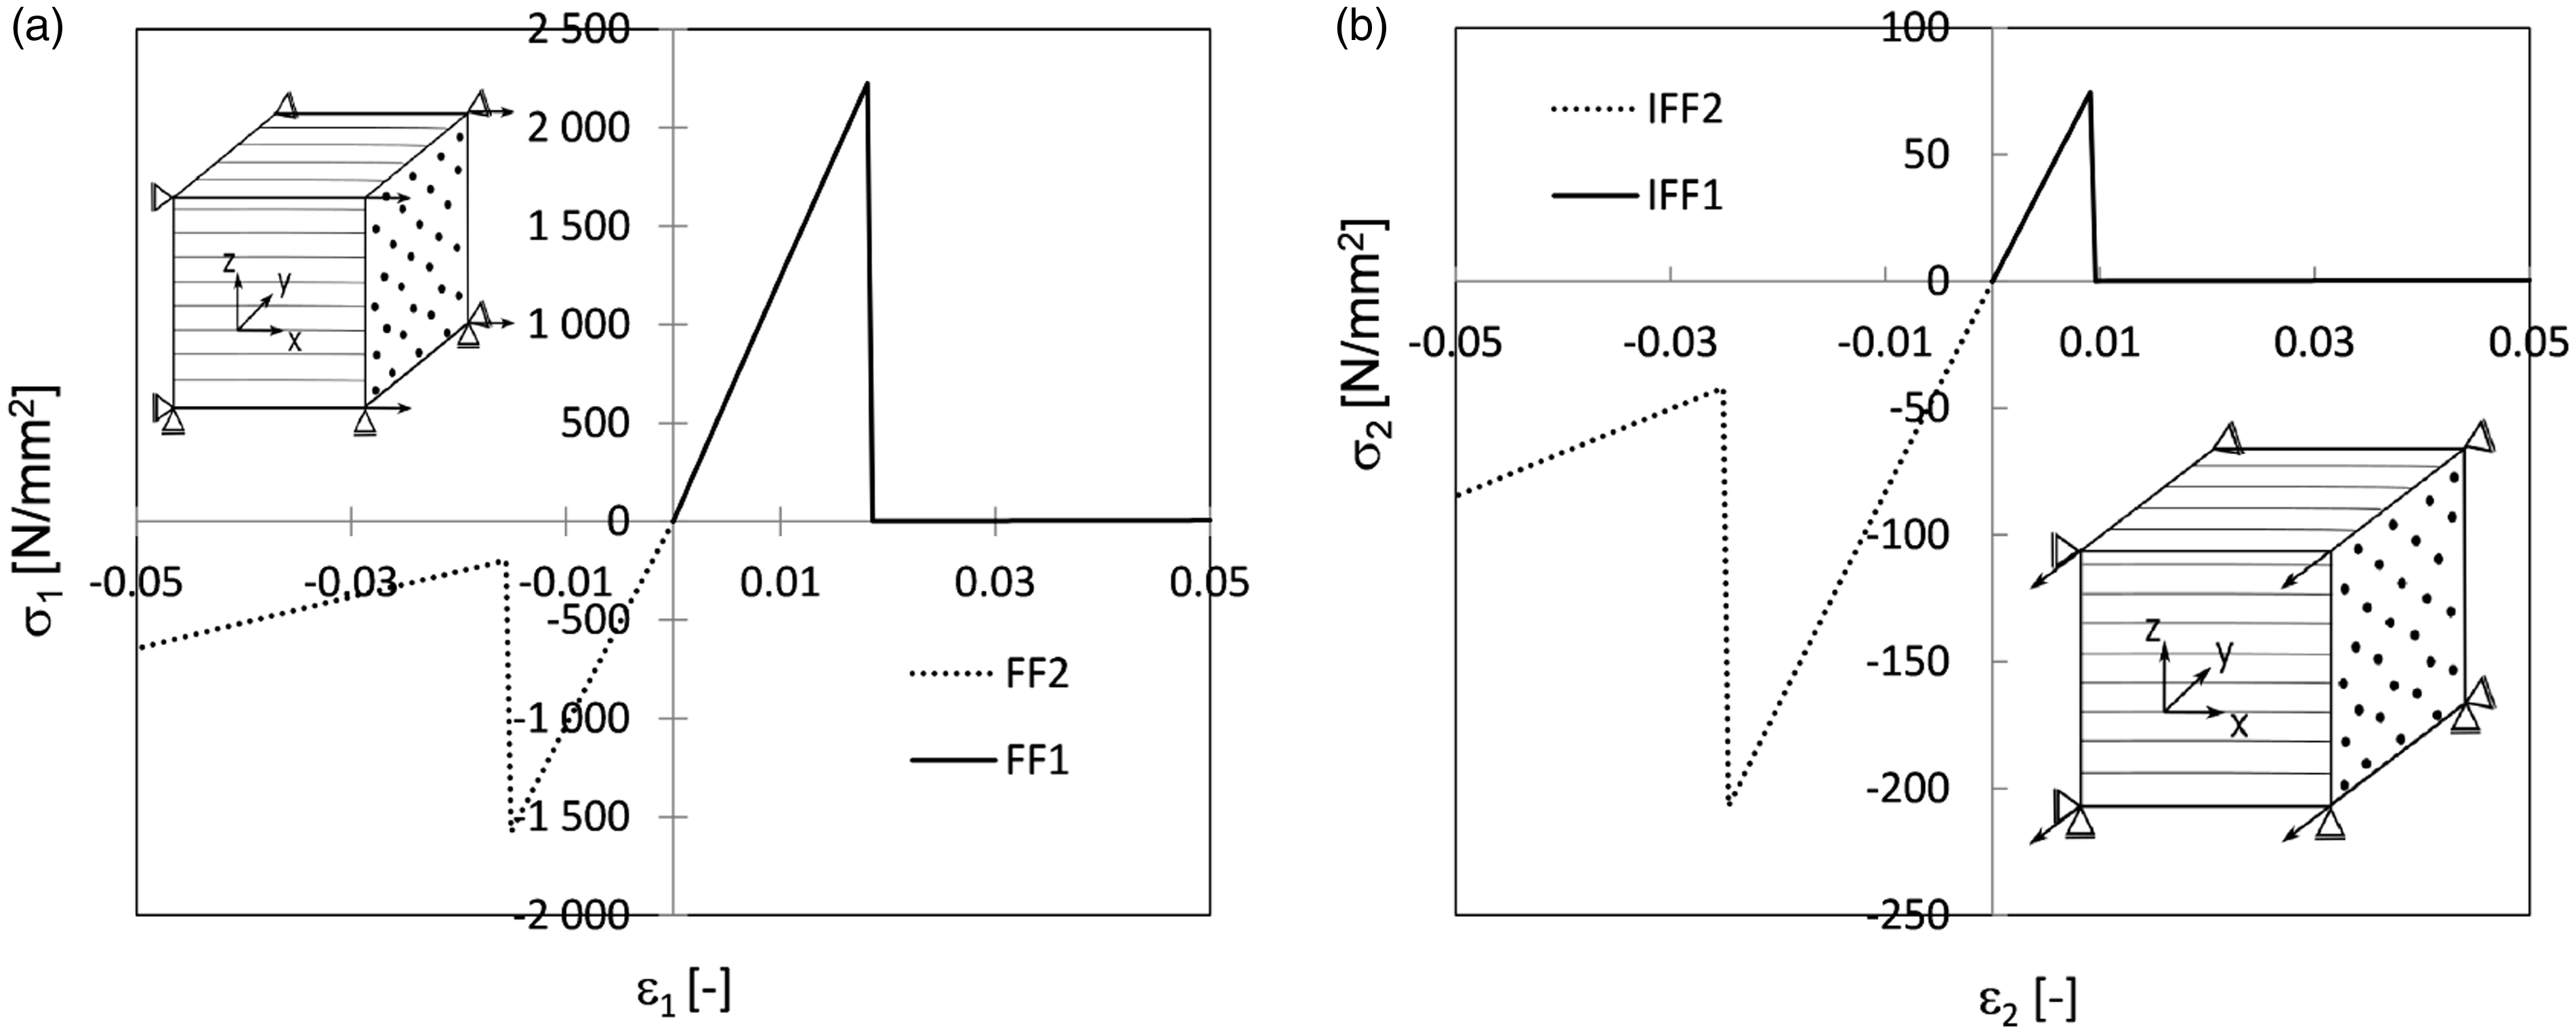
Results and discussion
Determination of bending portion
To determine the bending ratio, strains are used at two points near the surface of a TZ3 specimen. Figure 12 shows both strains from simulation and test. In the test, the distance from the surface is evaluated at about 0.15 to 0.35 mm in order to avoid edge disturbances. The FE data show the strain in two elements on the corresponding surfaces at the edge. The position as well as the area used for the evaluation in experiment and simulation is therefore not exactly identical and due to the proximity to the edge, the strains in the simulation are in principle higher.
Strains 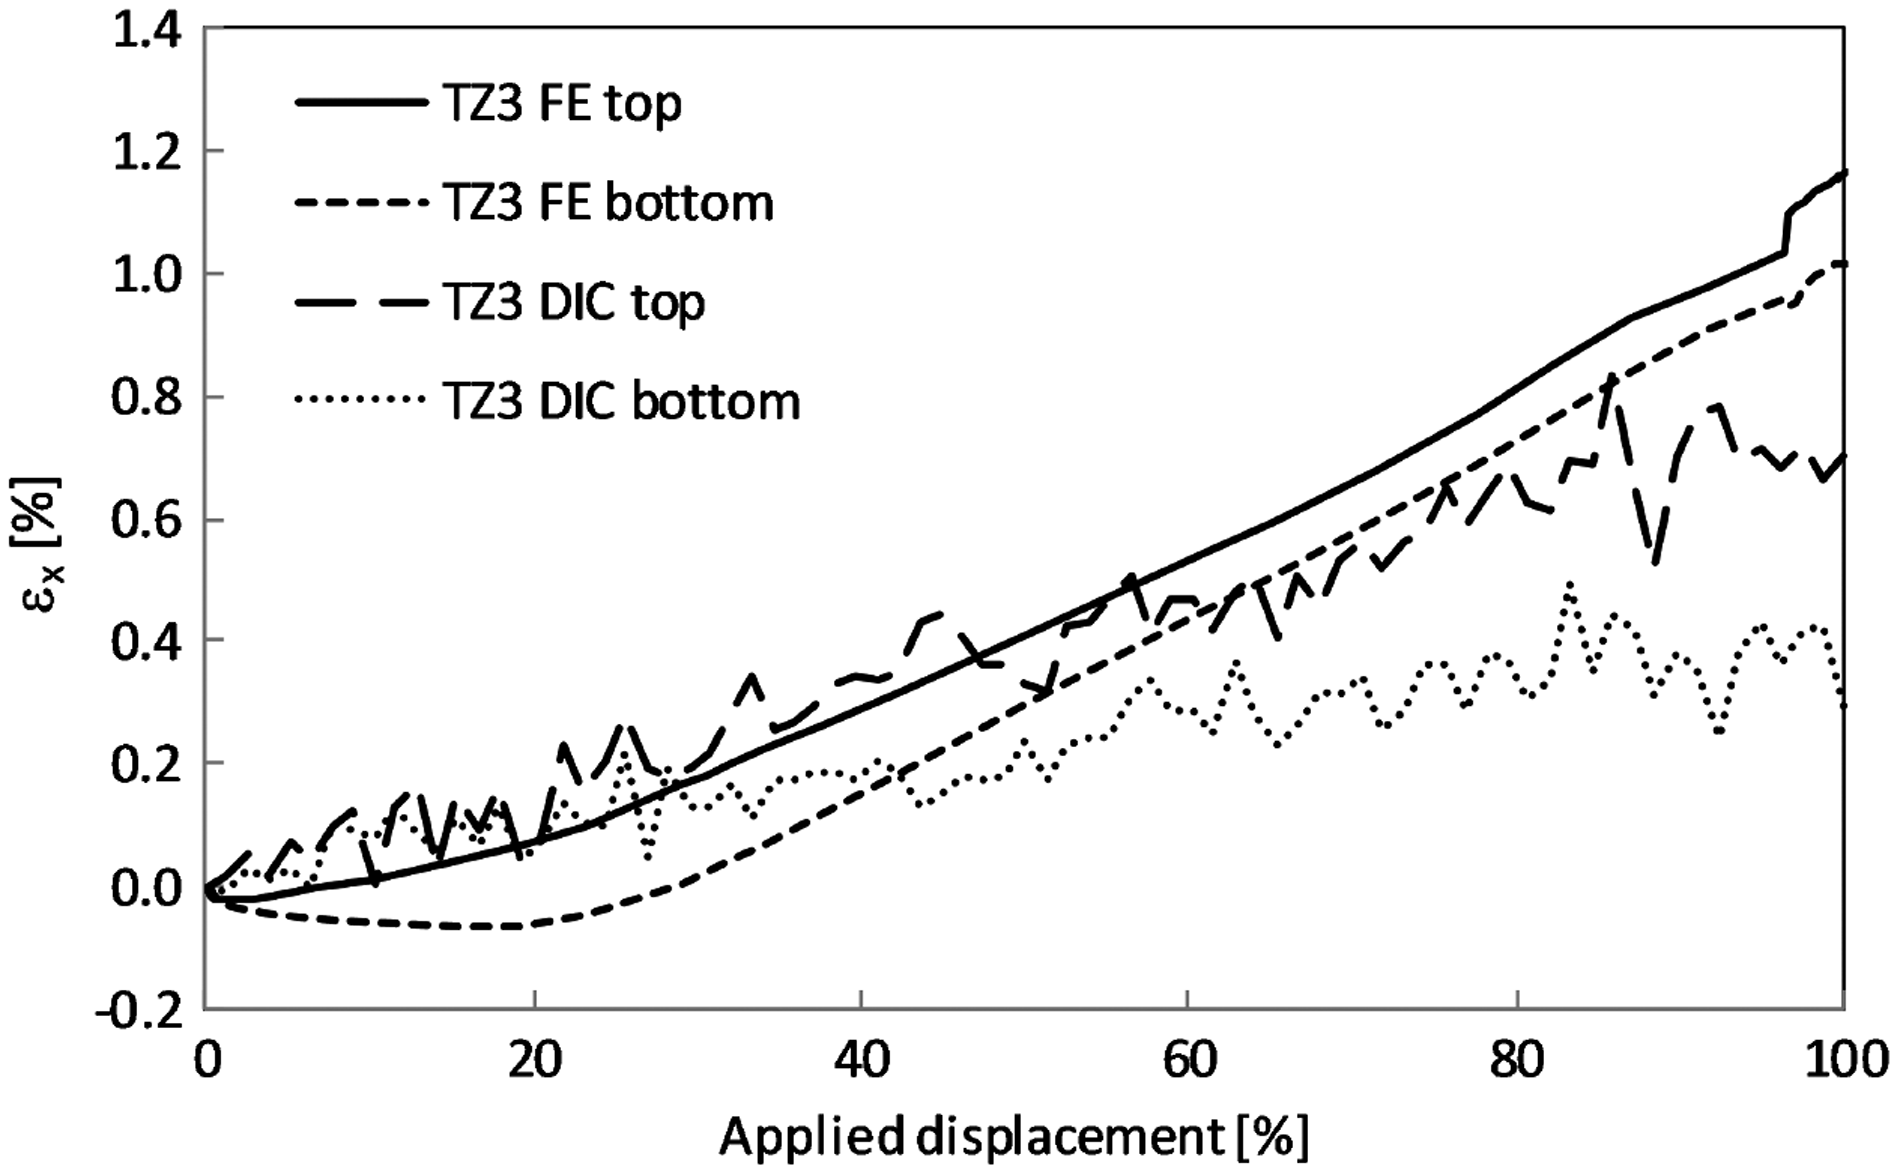
At about 20% load, a negative longitudinal strain is clearly visible in the simulation results, caused by the bending portion. With increasing load, this negative value becomes positive. In the experiment, the negative strain may have occurred during the preload (2.5% of Fmax), but in the recorded area, it is not recognisable. At the first onset of damage at approximately 80% load, there is a bending proportion of approximately 9%. In case of total failure, the bending percentage is about 13%. At all, the simulative estimation of the bending portion lies in the intended range.
The experimental strain curves obtained by DIC show scattering, what makes it difficult to determine quantitative information. Especially in the area till 25% load, it is difficult to determine a clear bending portion. The strains are higher than in FE and no negative strain component is visible. A possible explanation lies in the constrained rotation by the friction to be overcome. However, after 20% load bending is clearly visible, but the scatter makes it difficult to determine its portion. Till 50% load, the comparison of experiments and simulation reveals lower strains in the simulation than in the experiment. After 50%, this reverses. On the other hand, the difference between the strains on the top and bottom is much higher after 25% load describing larger bending. As in FE, there is a change in the strains at about 80% applied displacement, which suggests damage. The bending portion also increases with increasing load. For comparison, this can be determined at 80% load between 40% and 45% and at 100% load between 35% and 40%.
Values of this magnitude appear implausible and since the difference of the longitudinal strains increases with increasing load, it is assumed that an uneven out-of-plane shift has occurred. A slight rotation around the longitudinal axis of the specimen and the resulting deviation of the necessary parallelism between objective and measuring plane have a large effect on the magnitude of the measured strains. It has to be stated that the chosen measuring method does not allow the determination of the bending ratio in case of failure load reliably. However, it can prove the occurrence of bending in experiment.
Load-carrying capacity
Figure 13 shows the results of the simulation compared to the test results. In the load introduction, stress concentrations occur which are associated with an early failure in FF1. These are avoided in the tests by the specimens’ dog-bone shape. For this reason, the degradation is omitted in FF1 and the load when displaying the FF1 error index = 1 in TZ is defined as Fmax. The TZ FE models show a certain weakness in the middle of the specimen due to the transition area, where delamination starts and leads to further material failure. Otherwise, the CFRP reference does not show this ‘weak spot’ and therefore the propagation of a clear FF in the free test length is used as Fmax. A detailed discussion of failure types and sequences follows in ‘Failure analysis’ section.
Maximum force achieved in the combined tension–bending load case from simulation and experiment (specimens n = 5). FEM: finite element method; RS: residual stress; CFRP: carbon fibre-reinforced plastics; TZ: transition zone. Failure index of interfaces in TZ5 models, at 2.5% and 76% of Fmax, from top to bottom.
In the experiment, the hybridised series TZ3 and TZ4 exceed the result of the pure CFRP sample. Series TZ2 and TZ5 show clearly lower values and TZ1 lies slightly below the CFRP sample. The variant TZ4 shows the best result, surpasses the CFRP sample by 9%, and still shows a 6% higher value than TZ3 with the following highest result. The maximum forces obtained from the simulation are in the range of the experimental results. Largest deviations occur for the CFRP reference in the form of an overestimation (+7%), an overestimation for TZ1 (+5%), and an underestimation for TZ3, which force is underestimated by −7%. In the experiment, there is a greater difference between TZ1 and TZ4, whereby the higher scatter with TZ1 must be taken into account.
Failure analysis
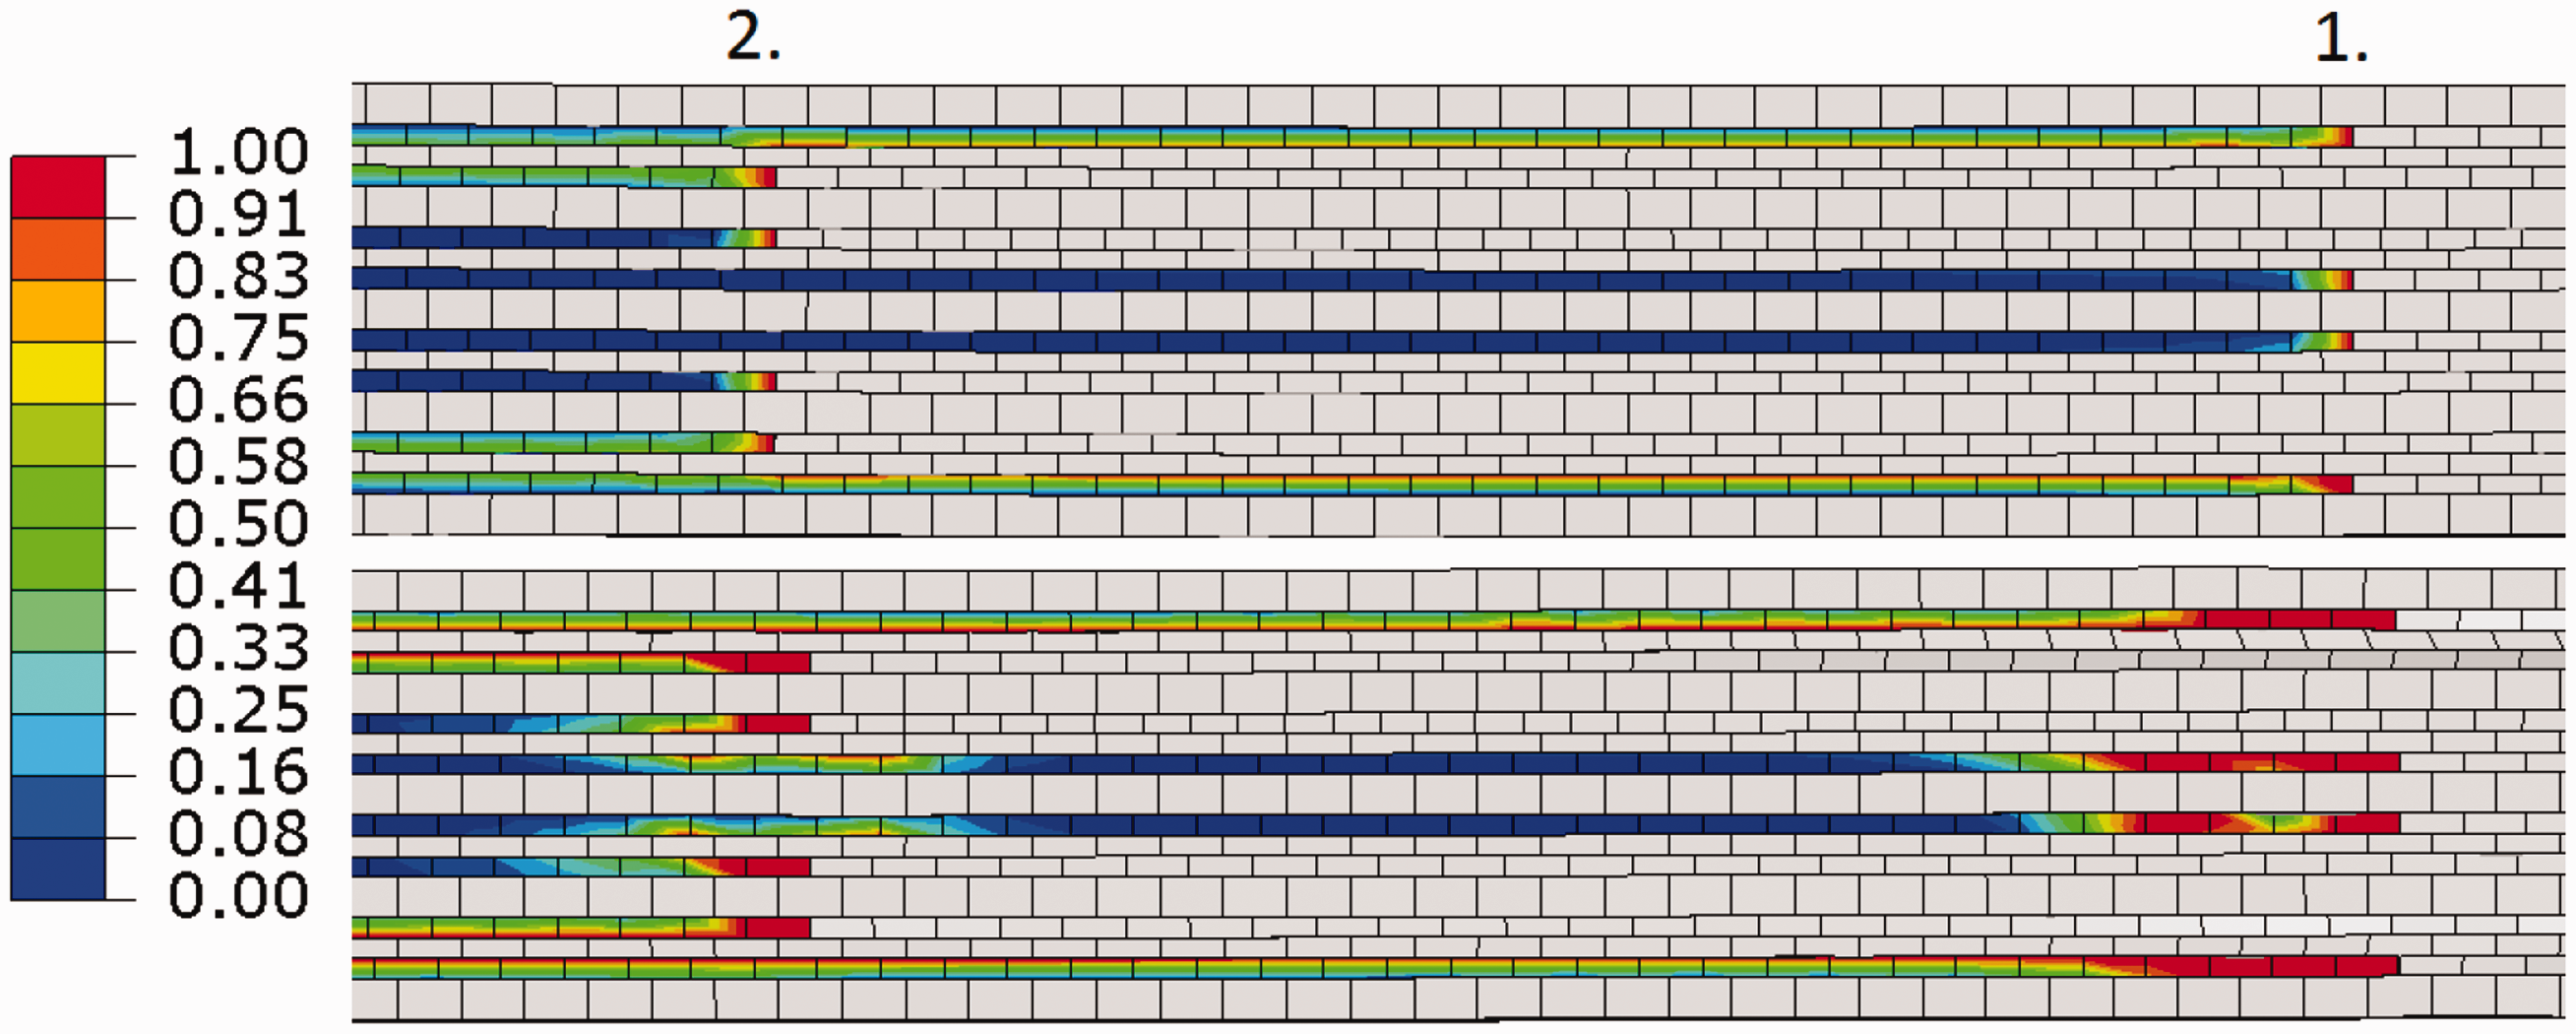
TZ5, which has only two positions in the longitudinal direction for the metal layer drop-offs, is regarded as a negative example. At the drop-offs in the transition to the monolithic as well as to the fully hybrid area, delaminations occur on the inward and outward steel interfaces, as shown in Figure 14. These delaminations spread inwards into the TZ and thus lead to a relatively early loss of load-carrying capacity.
Figure 15 shows the failure index of the interfaces in selected sections of TZ2. First delamination occurs at the first and second drop-off in the transition to the monolithic region. These are more pronounced on the specimen side with excessive normal stress and on the inner side of the steel foils. In the vicinity of closely adjacent steel foils on the second drop-off, there is an increase due to the stress interaction with the adjacent outer foils.
Failure index of interfaces in TZ2 model in cut-outs, at 4.2%, 46% and 100% of Fmax, from top to bottom.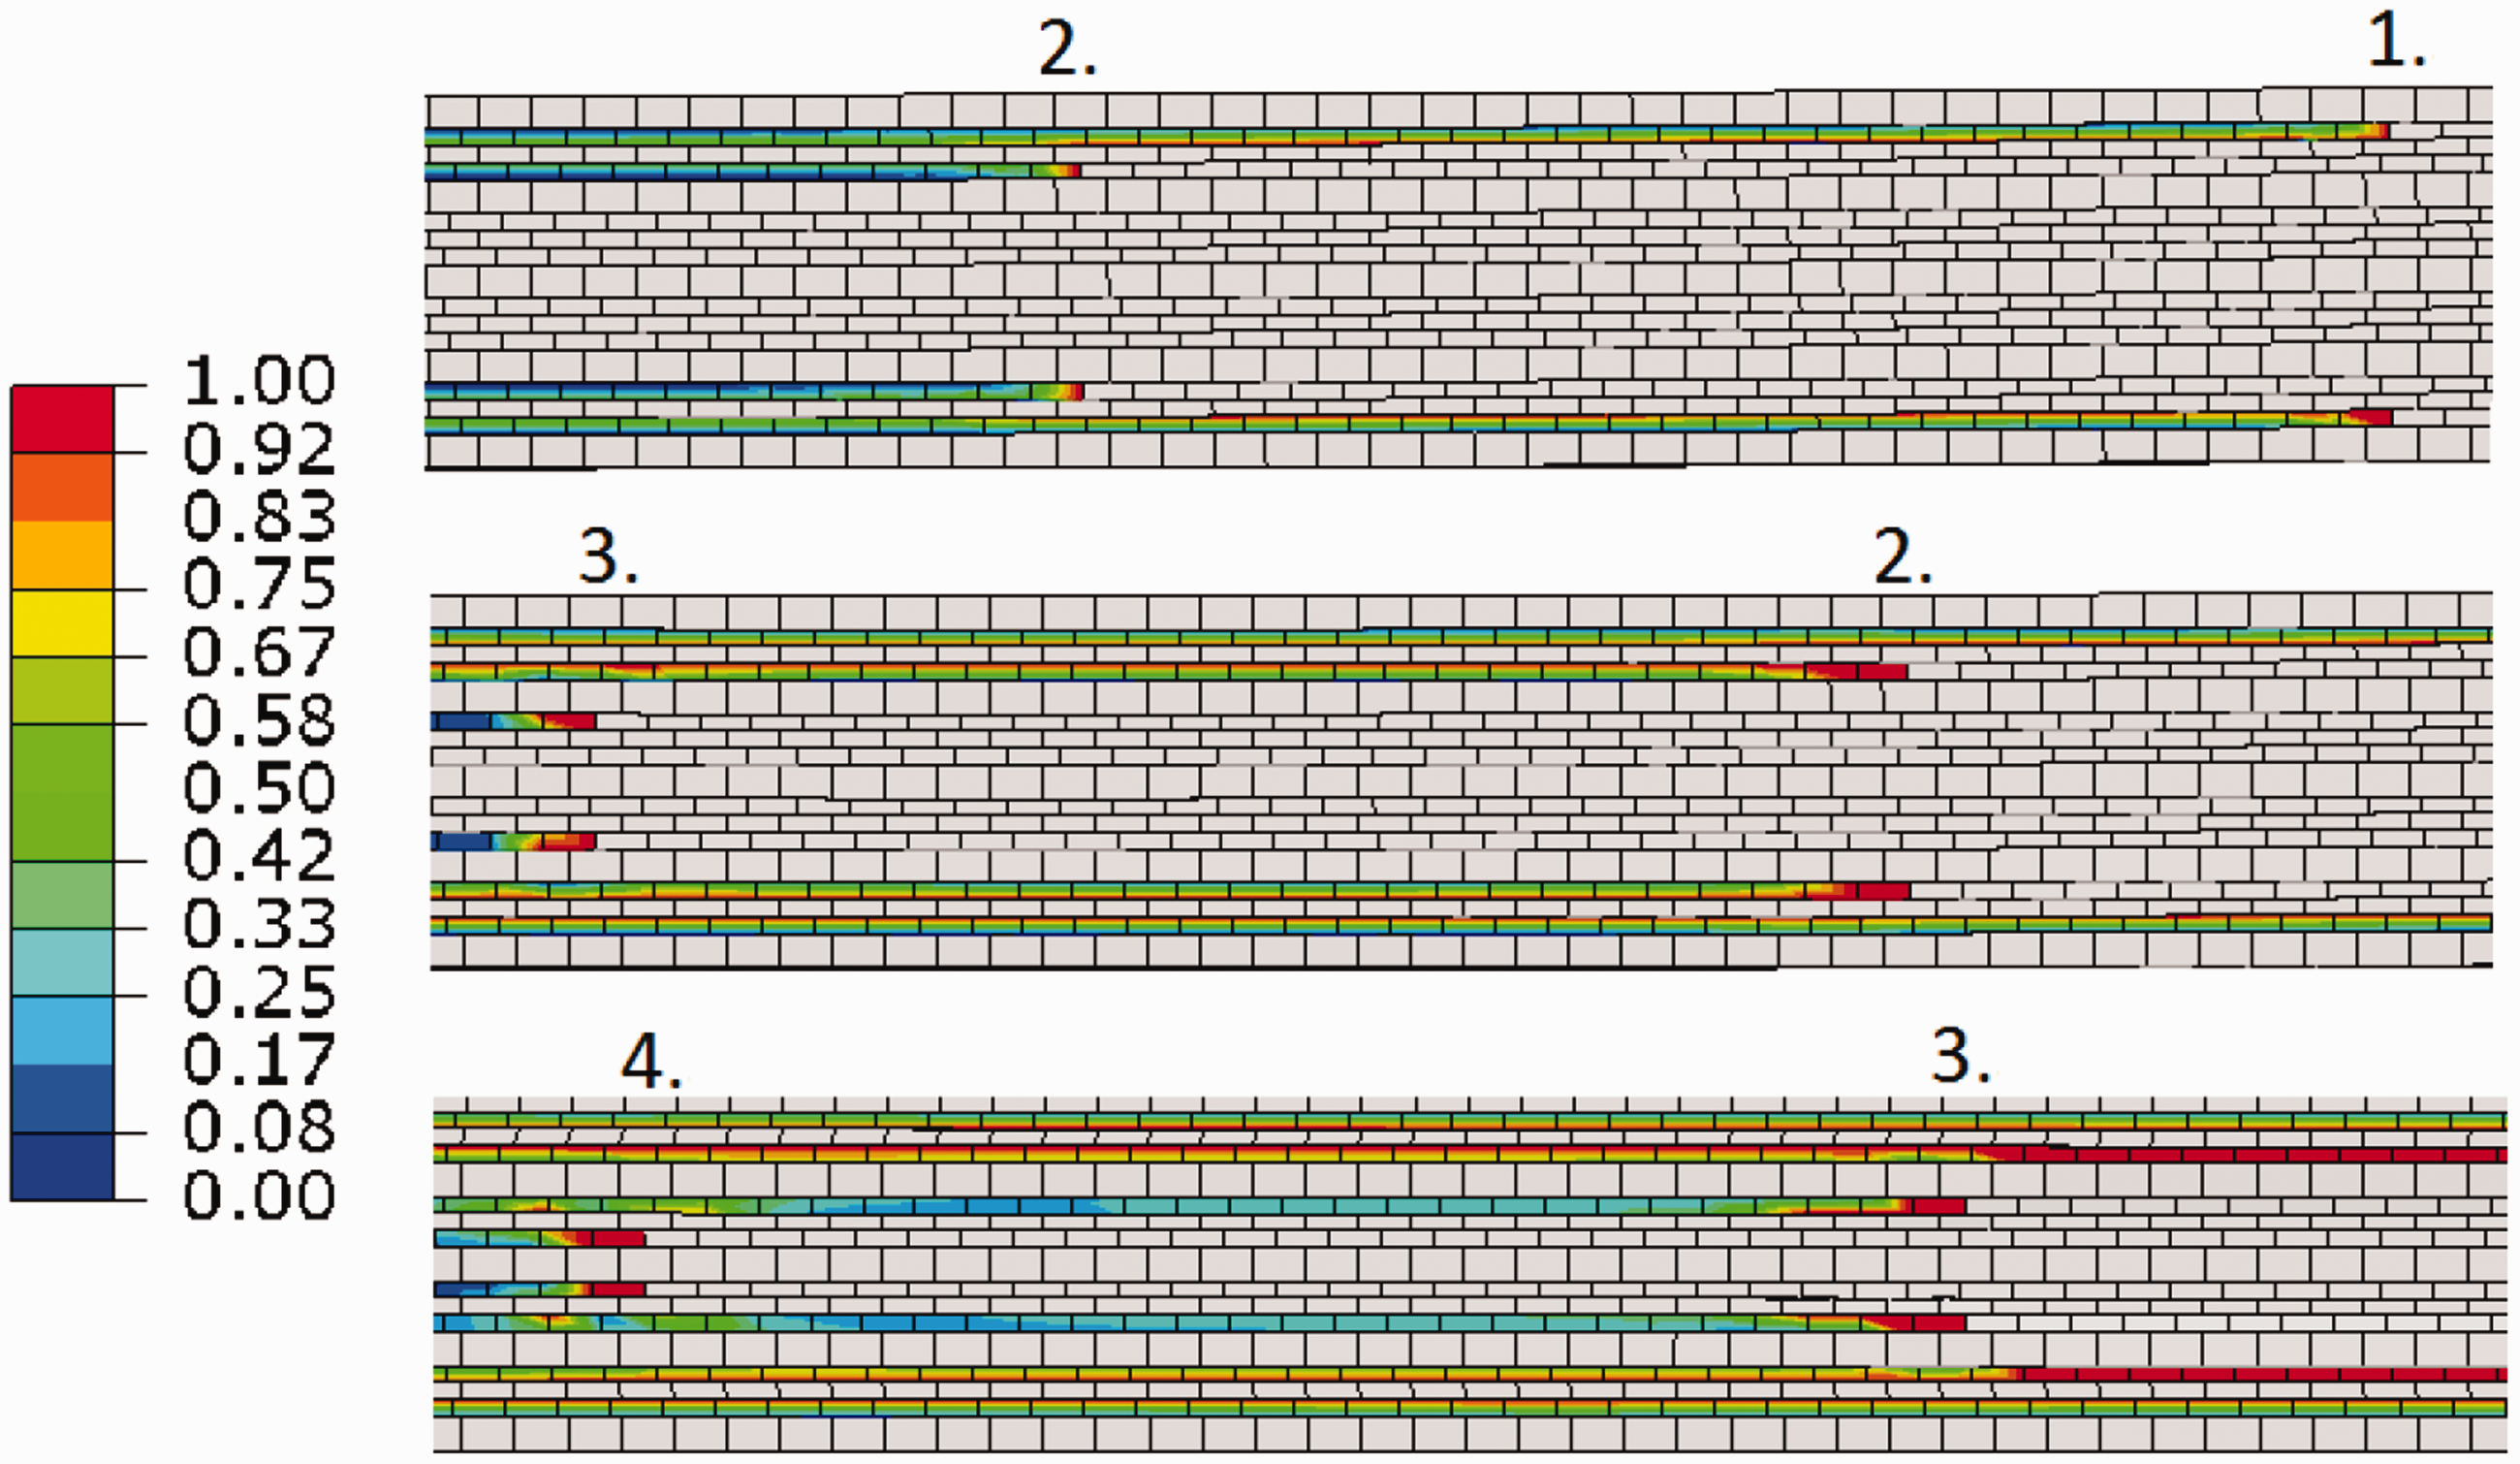
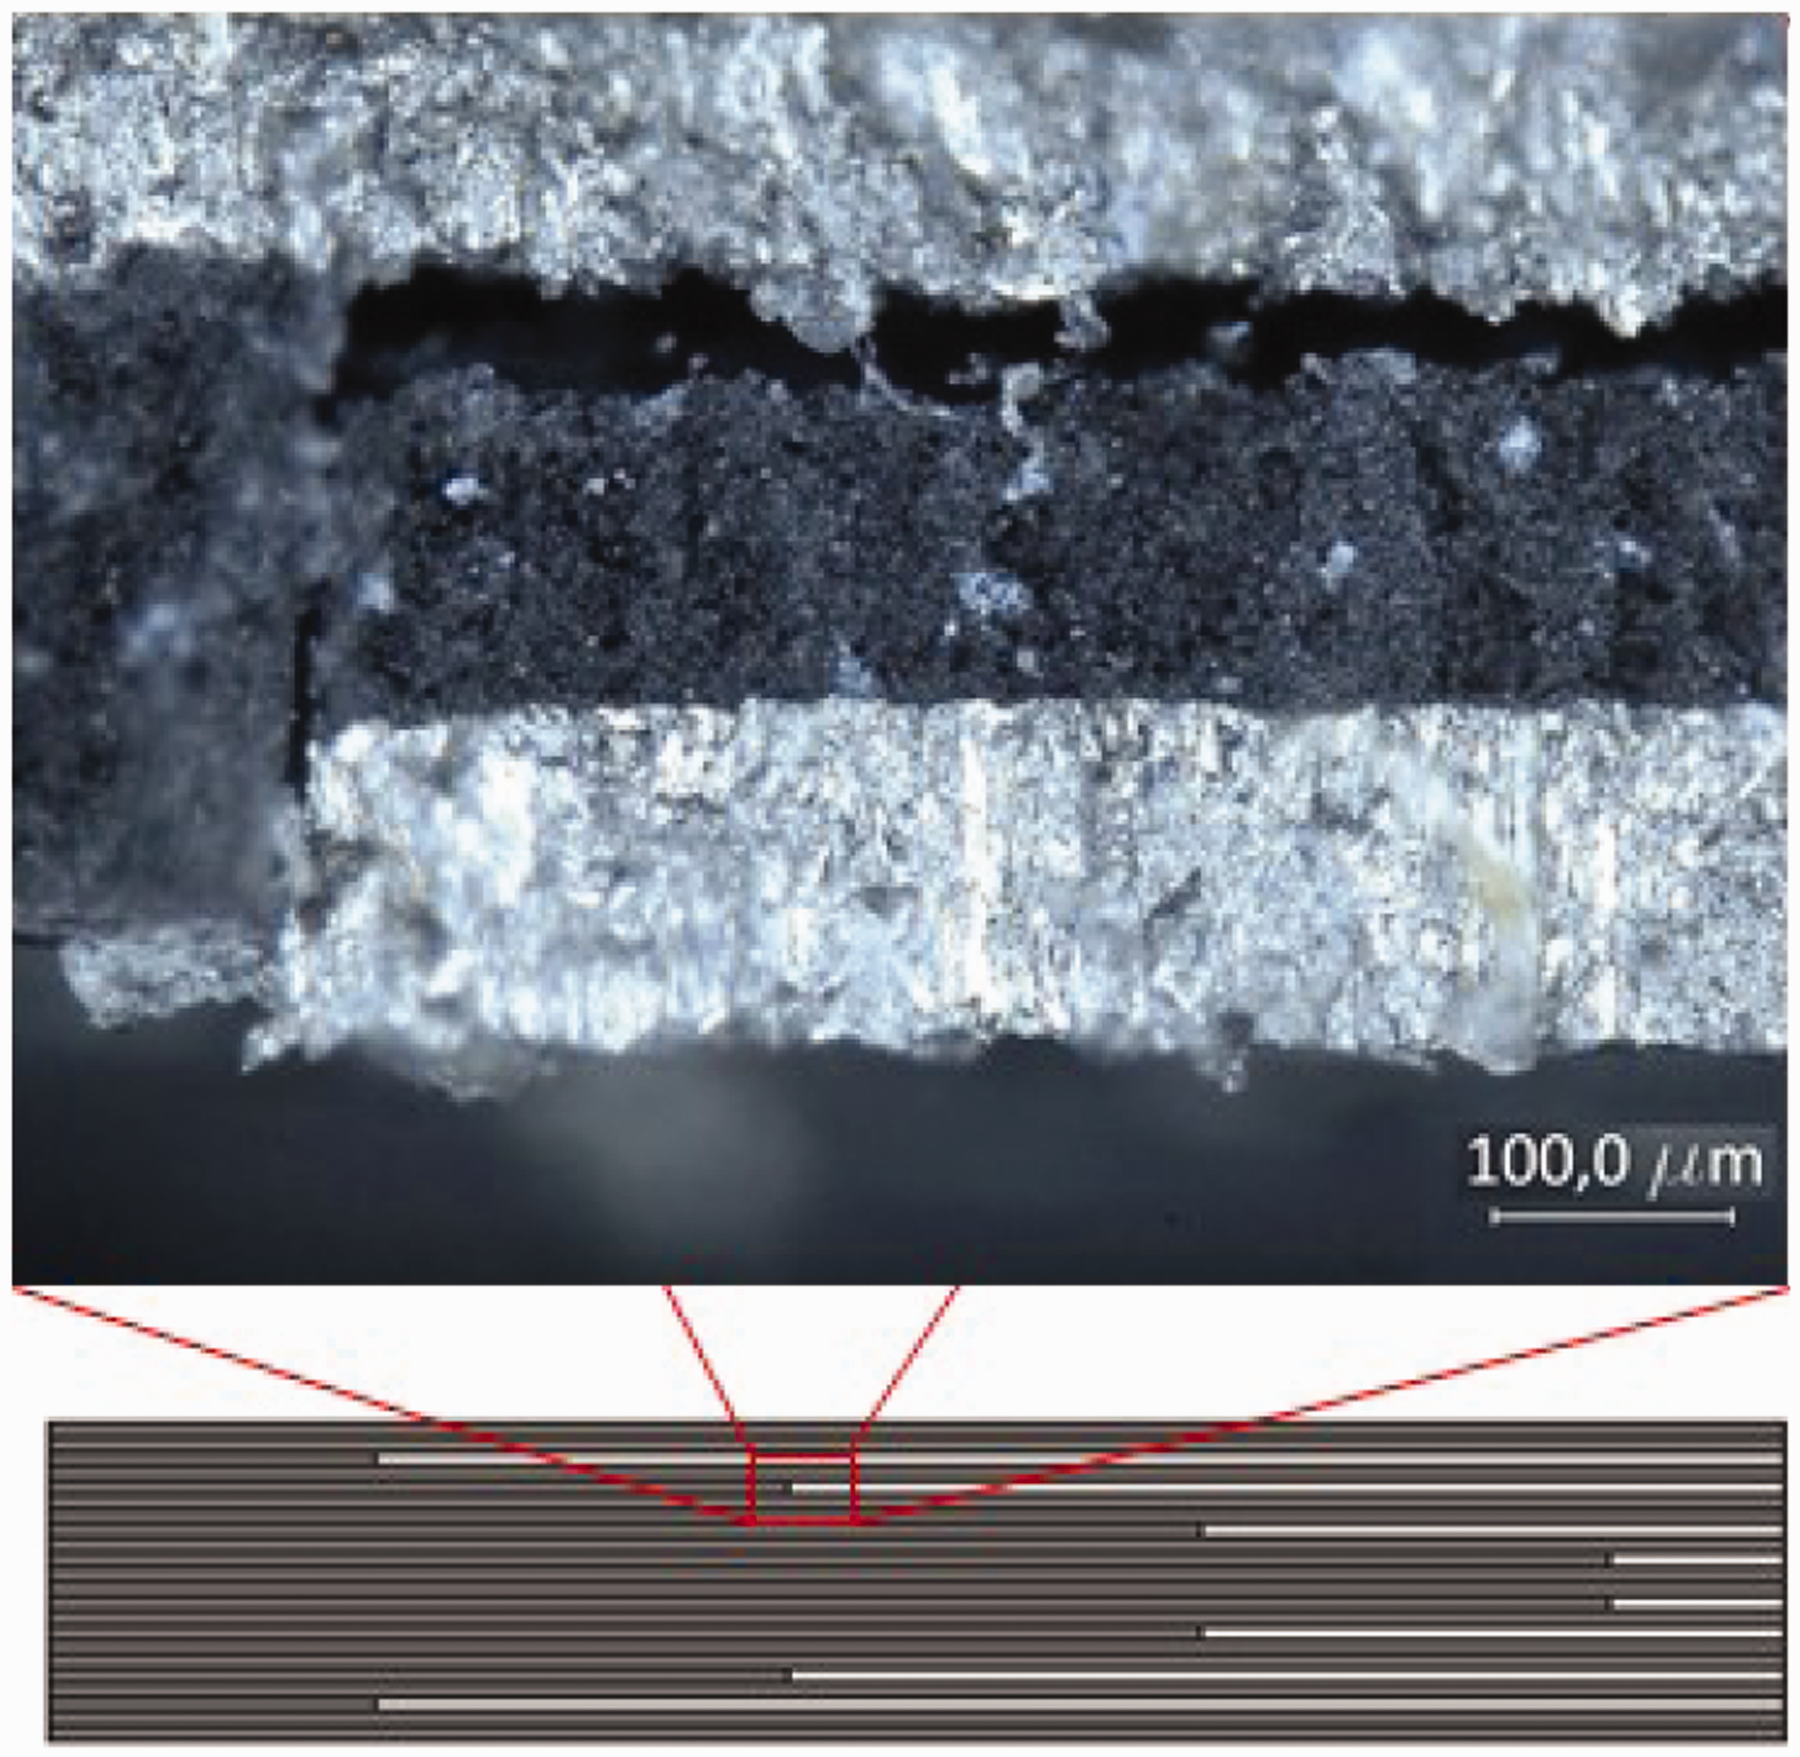
In the experiment, the jumping of a delamination to an adjacent steel–CFRP interface can partly be observed at these positions (Figure 16).
Microscopy of a TZ2 specimen in the area of the second upper drop-off. Experiment stopped at about 80% of Fmax.
33
As the load increases, further separations occur on the third drop-off, while the delamination of the steel foils continues to progress between the first and second drop-off, both internally and externally. First, FF occurs in the load introduction as the dog-bone shape is omitted in the simulation. Finally, FF1 failure occurs with higher stresses in the delaminated area on the first drop-off (Figure 17). The simulation shows that the delaminations grow rapidly from the outer steel layers into the fully hybridised area and lead to a relatively low load-carrying capacity of TZ2.
Failure index FF1 in TZ2 model at Fmax.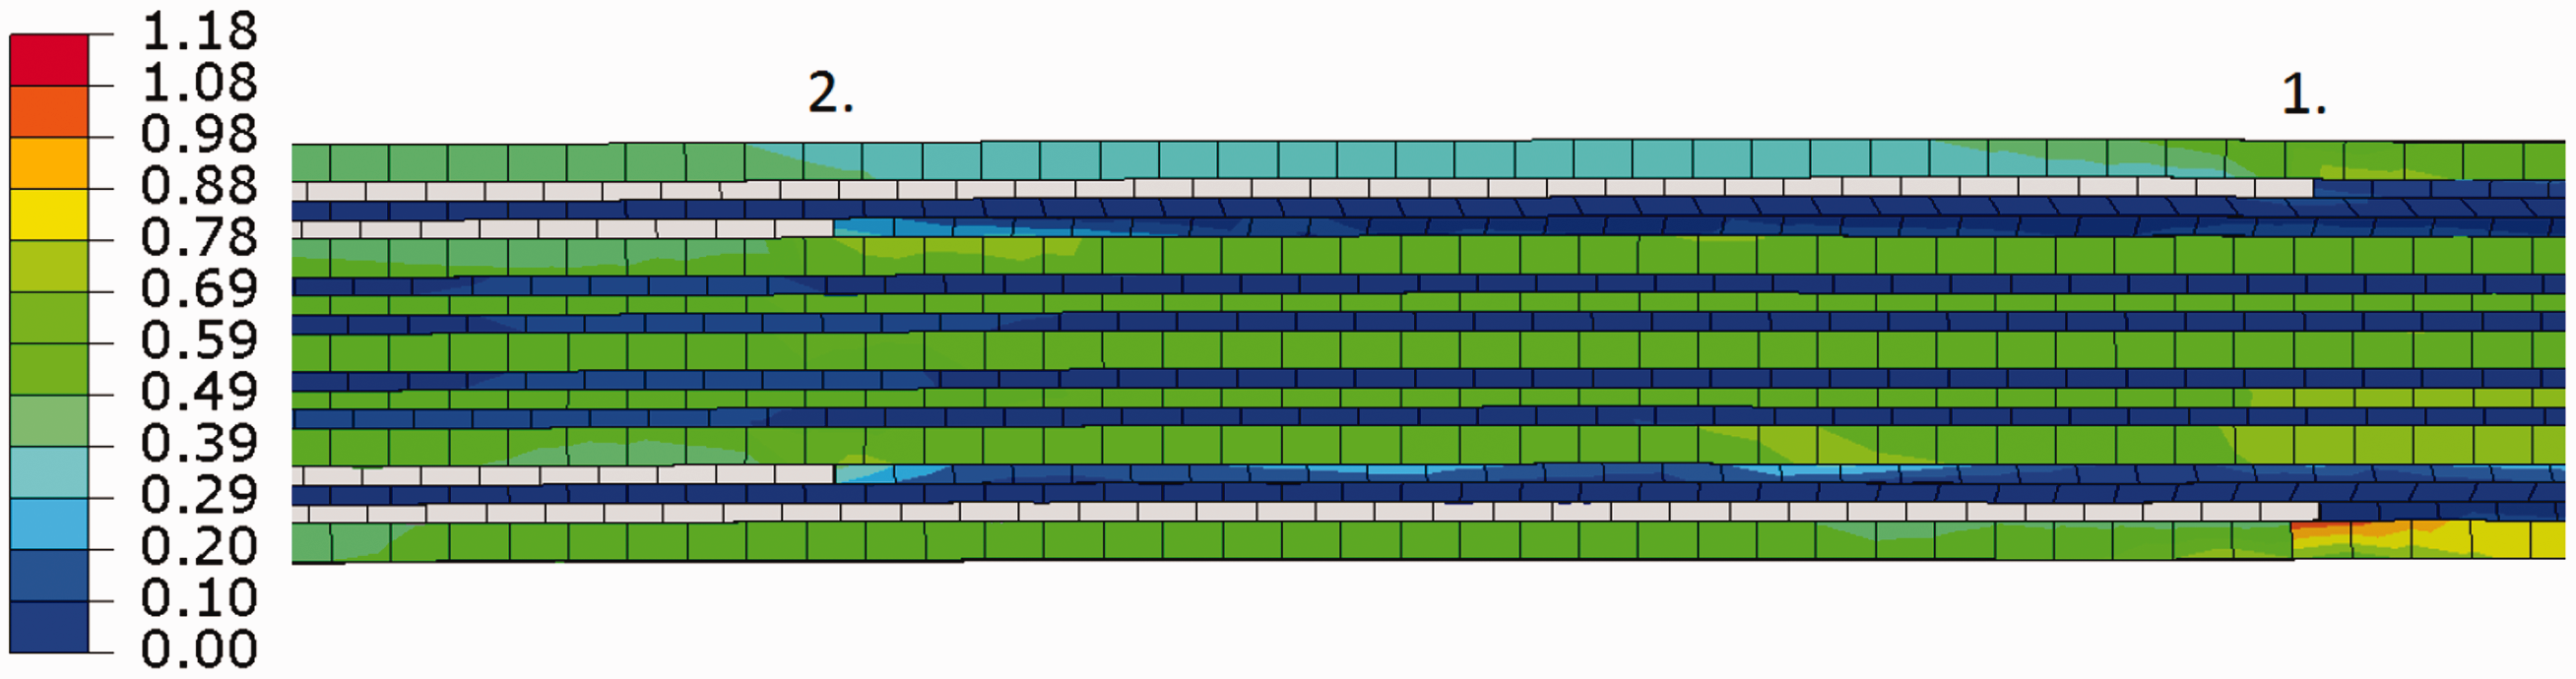
Figure 18 shows the interface failure index at TZ3. As with TZ2, the delaminations at the steel interfaces basically grow from the outside to the inside and from the monolithic laminate into the TZ. With TZ3, the outer steel layers are short so that in this area, there is less deformation of the test specimen and this drop-off is subjected to less peel stress than with TZ2. The second outermost steel layers are subjected to a much higher load in accordance with their length and the lower stiffness in the adjacent area. Due to their position further inwards, however, the loading is lower as is the case for the outer steel layers in TZ2 and the delaminations spread less rapidly.
Failure index of interfaces in TZ3 model, at 4.7%, 63% and 100% of Fmax, from top to bottom.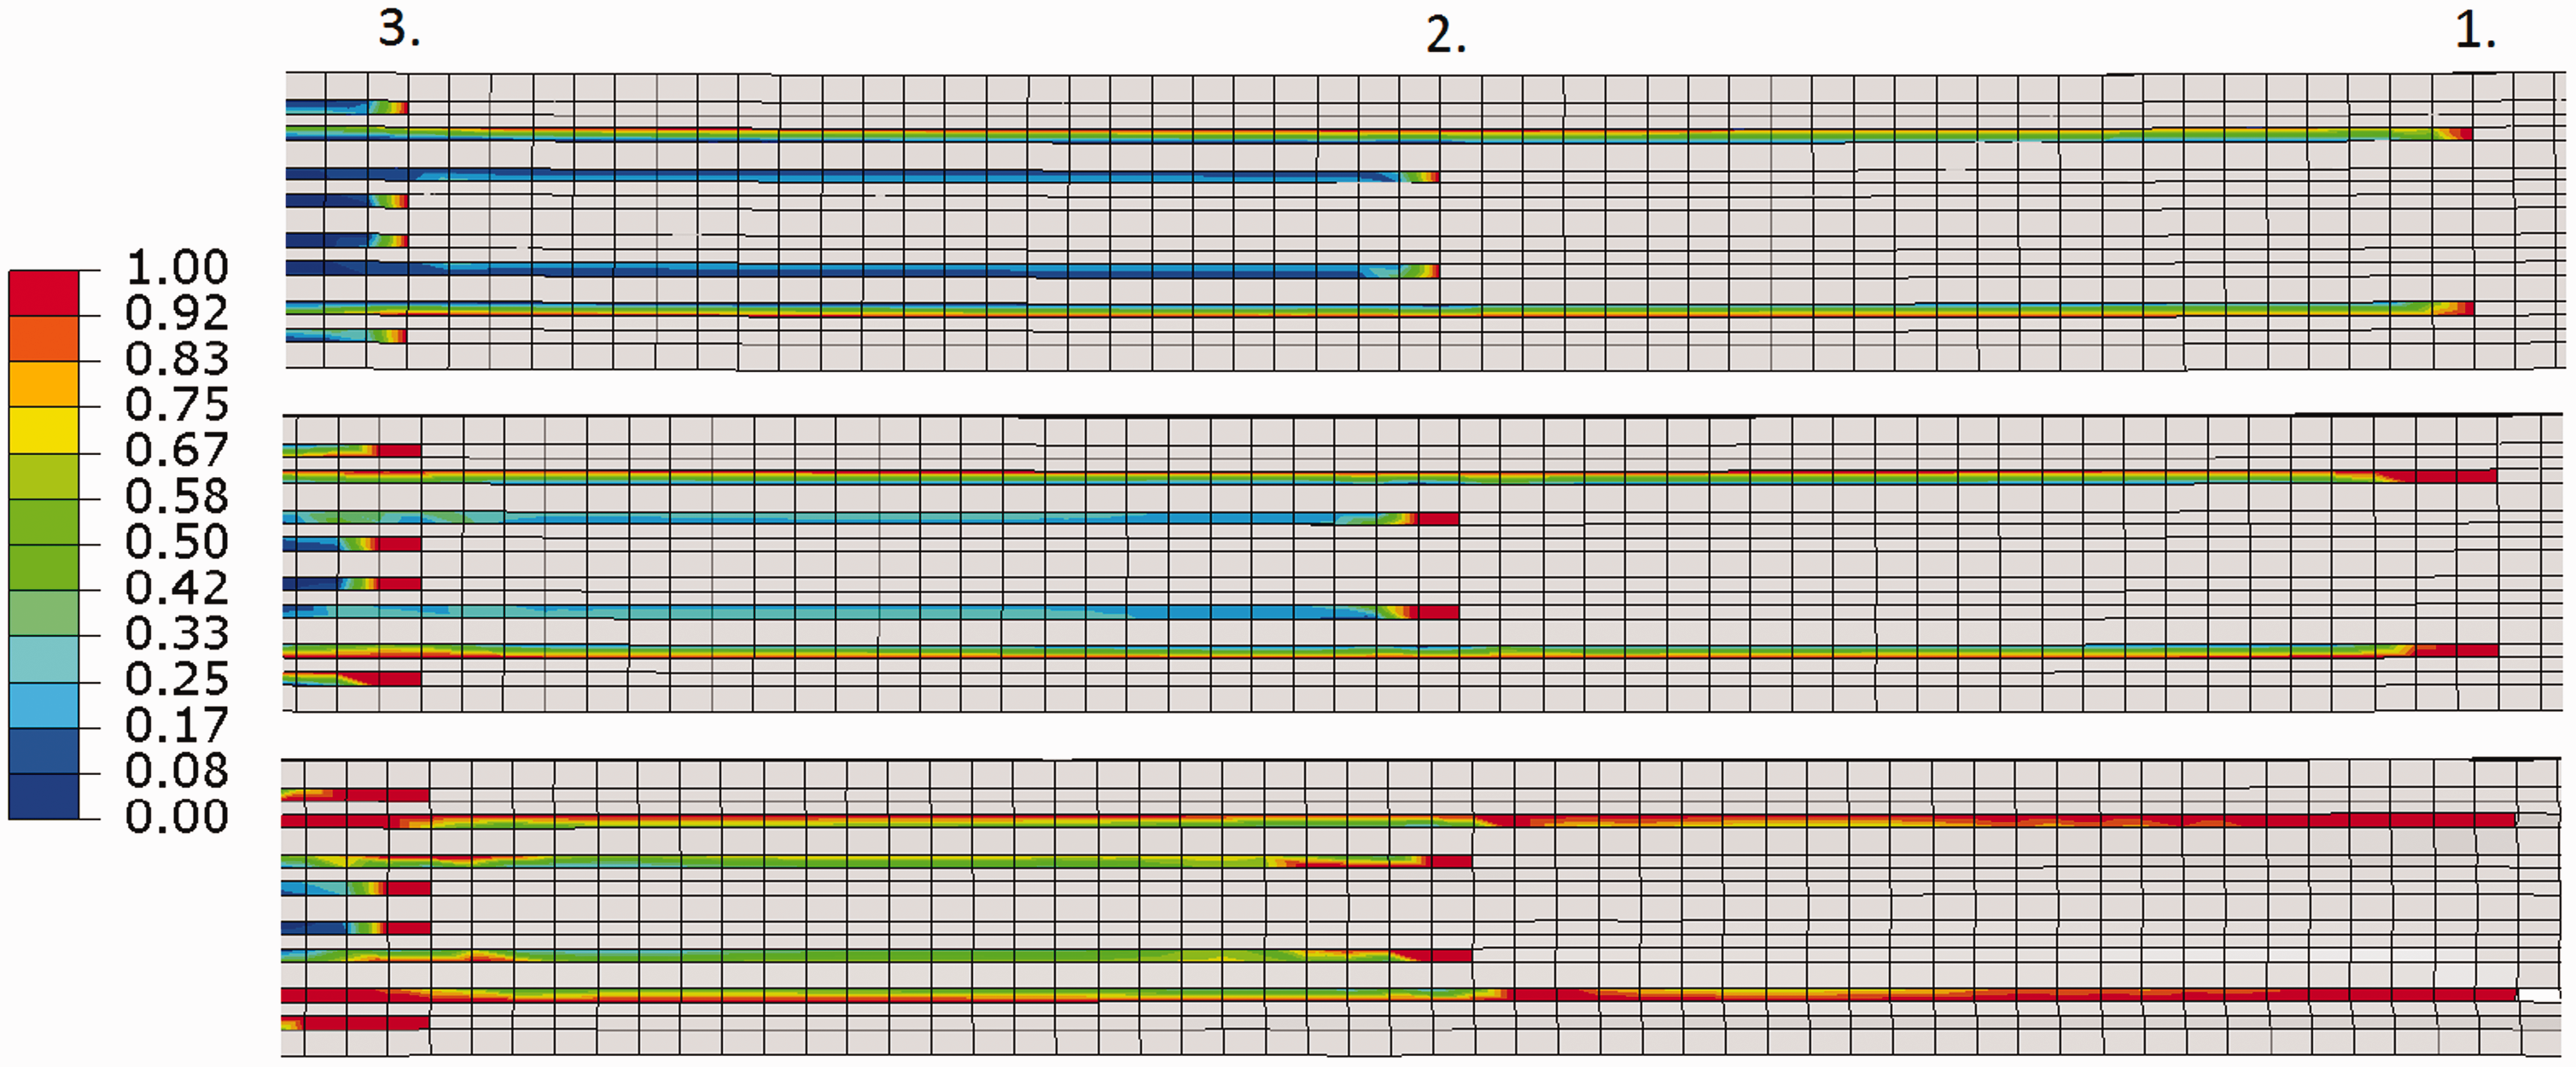
Configuration TZ4 was able to achieve the highest forces in testing and simulation. The only difference to TZ2 and TZ3 is the drop-off of the outer steel layers in the centre of the TZ. In this area, the moment of inertia and thus also the load on the interface of the second outer layers are higher than for TZ3 and lower than for TZ2.
The failure index of the interface in Figure 19 initially shows a similar behaviour as with TZ3 and the second outer metal layer drop-offs show incipient delaminations which spread inwards. In contrast to TZ3, however, the shortest outer layers are not subjected to the highest stresses in the following, as the load is distributed on four drop-offs at position 2.
Failure index of the interfaces in TZ4 model, at 10%, 40% and 63% of Fmax, from top to bottom.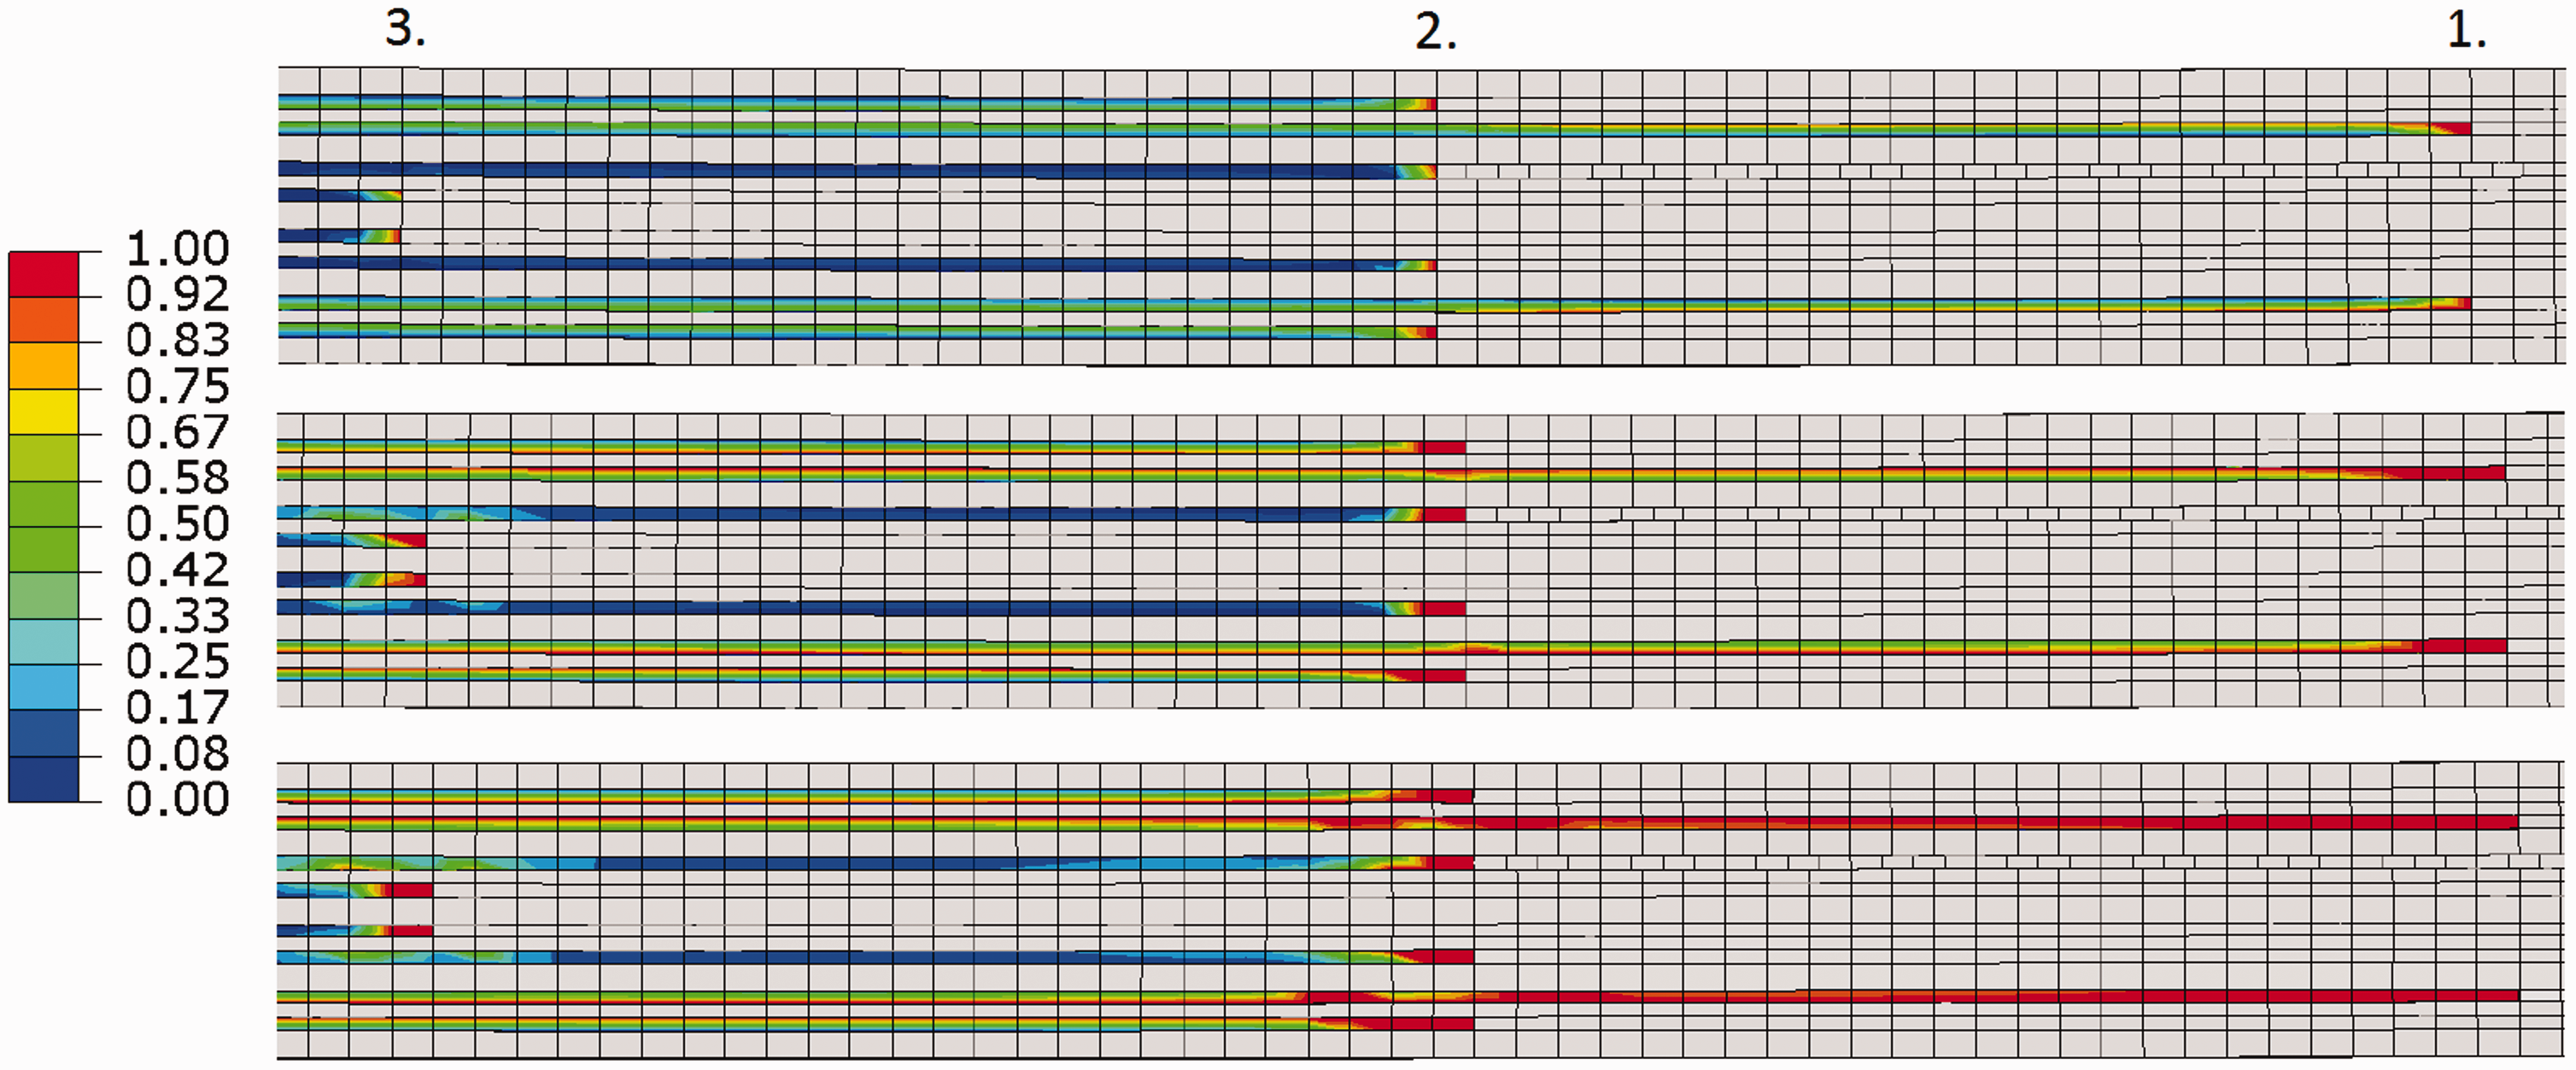
The crack propagation then slows down until a failure occurs in FF1, as shown in Figure 20. To stabilise the calculation up to this point, the damping of the cohesive zone model must be increased to FF1 failure of TZ4 at Fmax.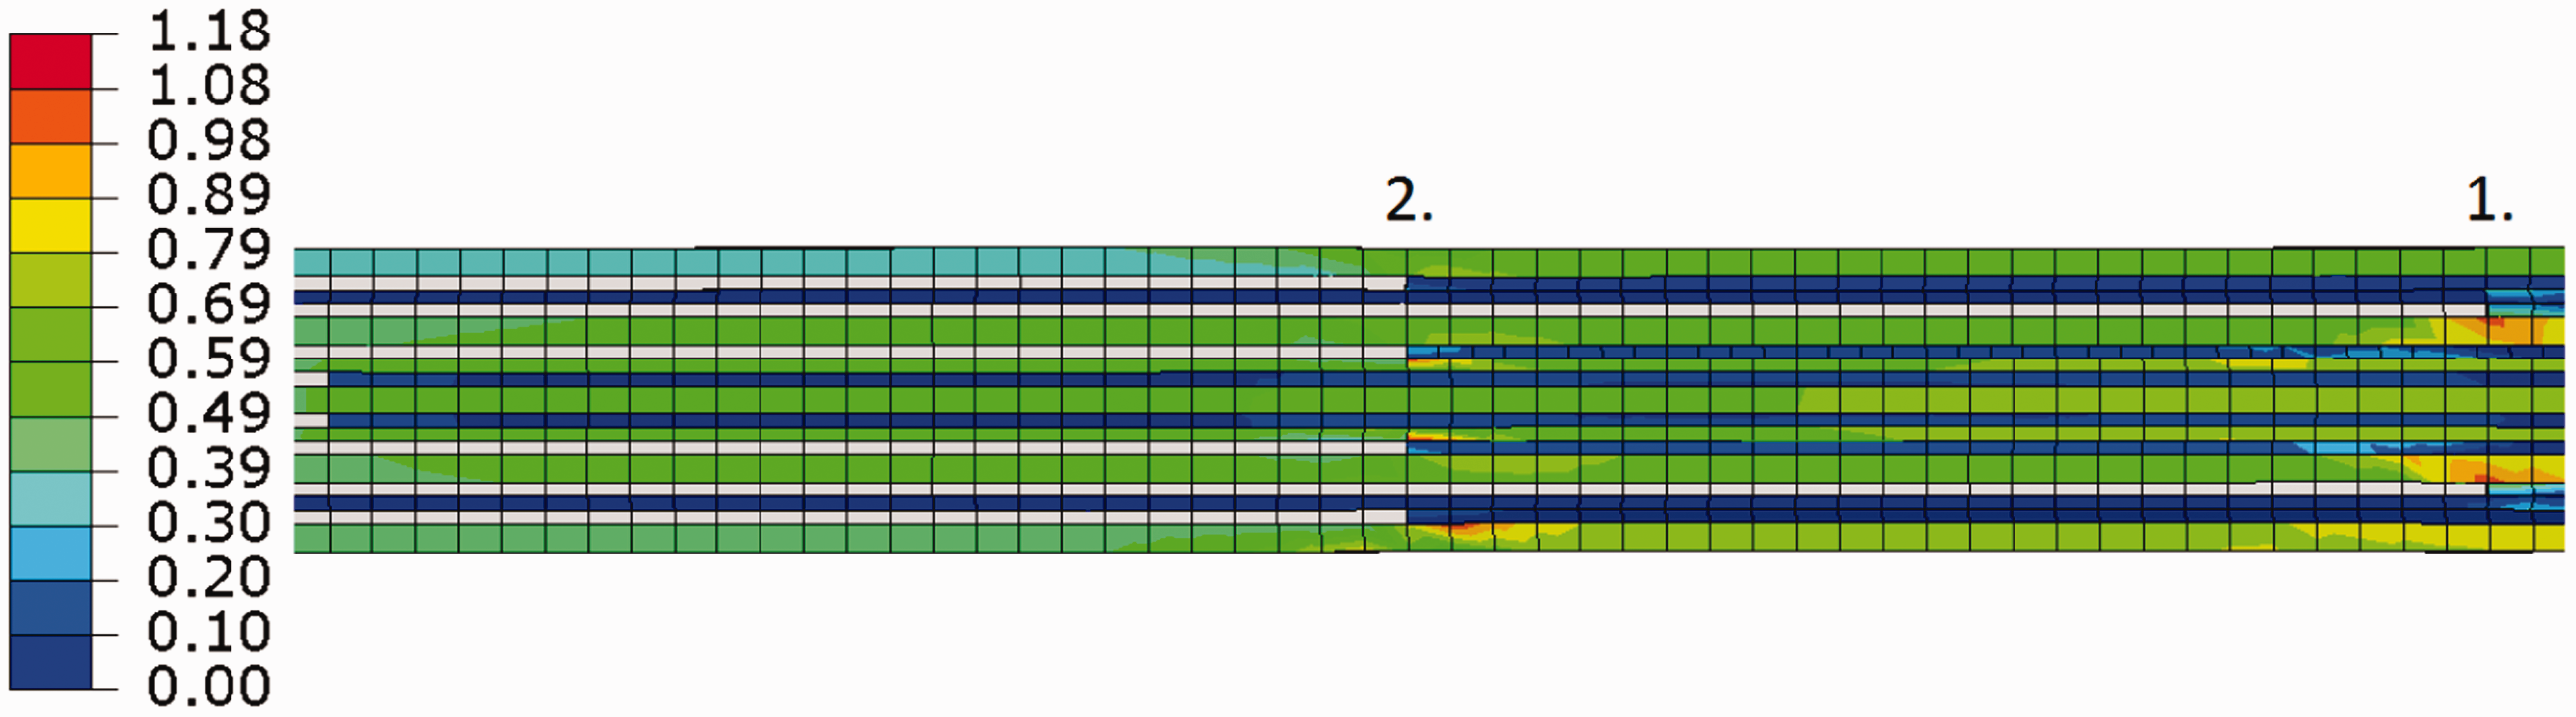
Due to the unhindered rotation and the missing deflection of the recessed areas, the bending ratio in the simulation is in principle higher than in the experiment. Taking the deviations into account, the maximum forces achieved show good agreement between experiment and simulation.
Conclusion
To size the TZ under combined tension and bending load cases, a special set-up was chosen, which enables the application of such a load combination. A load ratio was derived from the example of a centre wing box to guarantee a realistic loading scenario.
An exact definition of a desired bending ratio at the time of failure is difficult. The approach of determining the bending ratio by means of DIC during the tests was not possible until the end of the tests because of the unbound stochastic pattern used and the two-dimensional measurement set-up. A DIC system with a three-dimensional two-camera system could lead to an improvement, since movements out of the plane are detected and do not lead to falsification of the results. However, this only allows for a lower resolution and the use of strain gages is recommended for determining the bending ratio in the combined set-up.
The simulation is able to represent the phenomenological failure behaviour and therefore to predict the failure loads. Based on this validation, the simulation can be used to investigate arbitrary TZ configurations in full thickness laminates and to adjust parameters like the metal ply drop-off distance.
From the investigated TZ variants, it can be concluded that the load-carrying capacity can be strongly influenced by variation of outer steel layers alone. If these are too long, delaminations occur and limit the load-carrying capacity. A design with too short outer metal layers has not enough stiffening effect and as a result the load-carrying capacity is low. For the investigated bending–tension ratio, a beneficial TZ design was determined, which shows a balance between delamination risk and bending stiffness. This leads to the highest load-carrying capacity among the investigated variants.
The developed approach can also be applied on the similar field of embedded metallic sensors, 51 where the difference in stiffness between sensor and laminate leads to debonding and hence, a gradual and load case adapted stiffness transition would be beneficial.
Footnotes
Acknowledgements
The authors would like to gratefully thank K. Koran for his contribution as well as the static laboratory of the Faculty of Aerospace of the TU Delft, in the person of Gertjan Mulder.
Declaration of Conflicting Interests
The author(s) declared no potential conflicts of interest with respect to the research, authorship, and/or publication of this article.
Funding
The author(s) disclosed receipt of the following financial support for the research, authorship, and/or publication of this article: This work is supported by the German Research Foundation in the framework of the collaborative research centre 880 ‘Fundamentals of High-Lift for Future Commercial Aircraft’.