
Abstract
Continuous ultrasonic welding is a high-speed joining method for thermoplastic composites. Currently, a thin film energy director is used to focus the heat generation at the interface. However, areas of intact energy director remain in the welded seam, which significantly lowers the weld strength, and result in a non-uniformly welded seam. To improve the weld uniformity of continuous ultrasonically welded joints, we changed to a more compliant energy director. A woven polymer mesh energy director was found to give a significant improvement in weld quality. The mesh was flattened in between the composite adherends during the welding process. This flattening promoted a good contact between the energy director and the adherends, fully wetting the adherend surfaces, resulting in a more uniformly welded seam without areas of intact energy director.
Introduction
Thermoplastic composites are gaining interest in the aerospace industry, because low-cost manufacturing and welding techniques can be applied on them.1–4 They can be re-shaped, making the use of low-cost forming techniques possible. Locally re-melting the thermoplastic composites makes it possible to weld individual parts together. Already industrially applied welding techniques are resistance welding and induction welding. For example, the inboard leading edge of the A340-500/600 and two-third of the fixed leading edge of the A380 are assembled using resistance welding,3,4 and the rudder and elevators for the Gulfstream G650 are assembled using induction welding. 3
Another promising welding technique is ultrasonic welding, which is a fast and efficient welding technique that does not require foreign material at the interface.5–13 During the welding process, a sonotrode (metal horn) applies high-frequency (i.e. 20 kHz), low-amplitude (i.e. 50 to 100 µm peak-to-peak) vibrations to the weld interface, while simultaneously applying a constant static pressure. The interface generates heat through surface friction and viscoelastic heating. An energy director, i.e. a resin-rich layer, is placed at the interface to focus the heat generation. Higher cyclic strains in the energy director ensure higher viscoelastic heating of the energy director as compared to the fiber-reinforced adherends.14–16
Continuous ultrasonic welding (CUW) has been shown to be a fast and feasible welding technique.
17
Senders et al. demonstrated the feasibility of CUW by joining 100-mm-long carbon fiber-reinforced polyphenylene sulfide (CF/PPS) plates with a continuously welded seam. A thin (0.08 mm thick) PPS film energy director was used to minimize squeeze flow at the weld interface (“zero-flow” welding).
17
However, these state-of-the-art joints are non-uniformly welded and contain areas with intact energy director material. Our follow-up experiments on longer plates (220 mm) of the same material confirmed the previous observations, which can be observed from the fracture surfaces shown in Figure 1.
Representative fracture surfaces of 220 mm-long CF/PPS plates continuously welded with a thin film energy director and a single overlap of 12.7 mm. The welding speed was 40 mm/s, welding force 500 N, and vibrational amplitude 82.5 µm.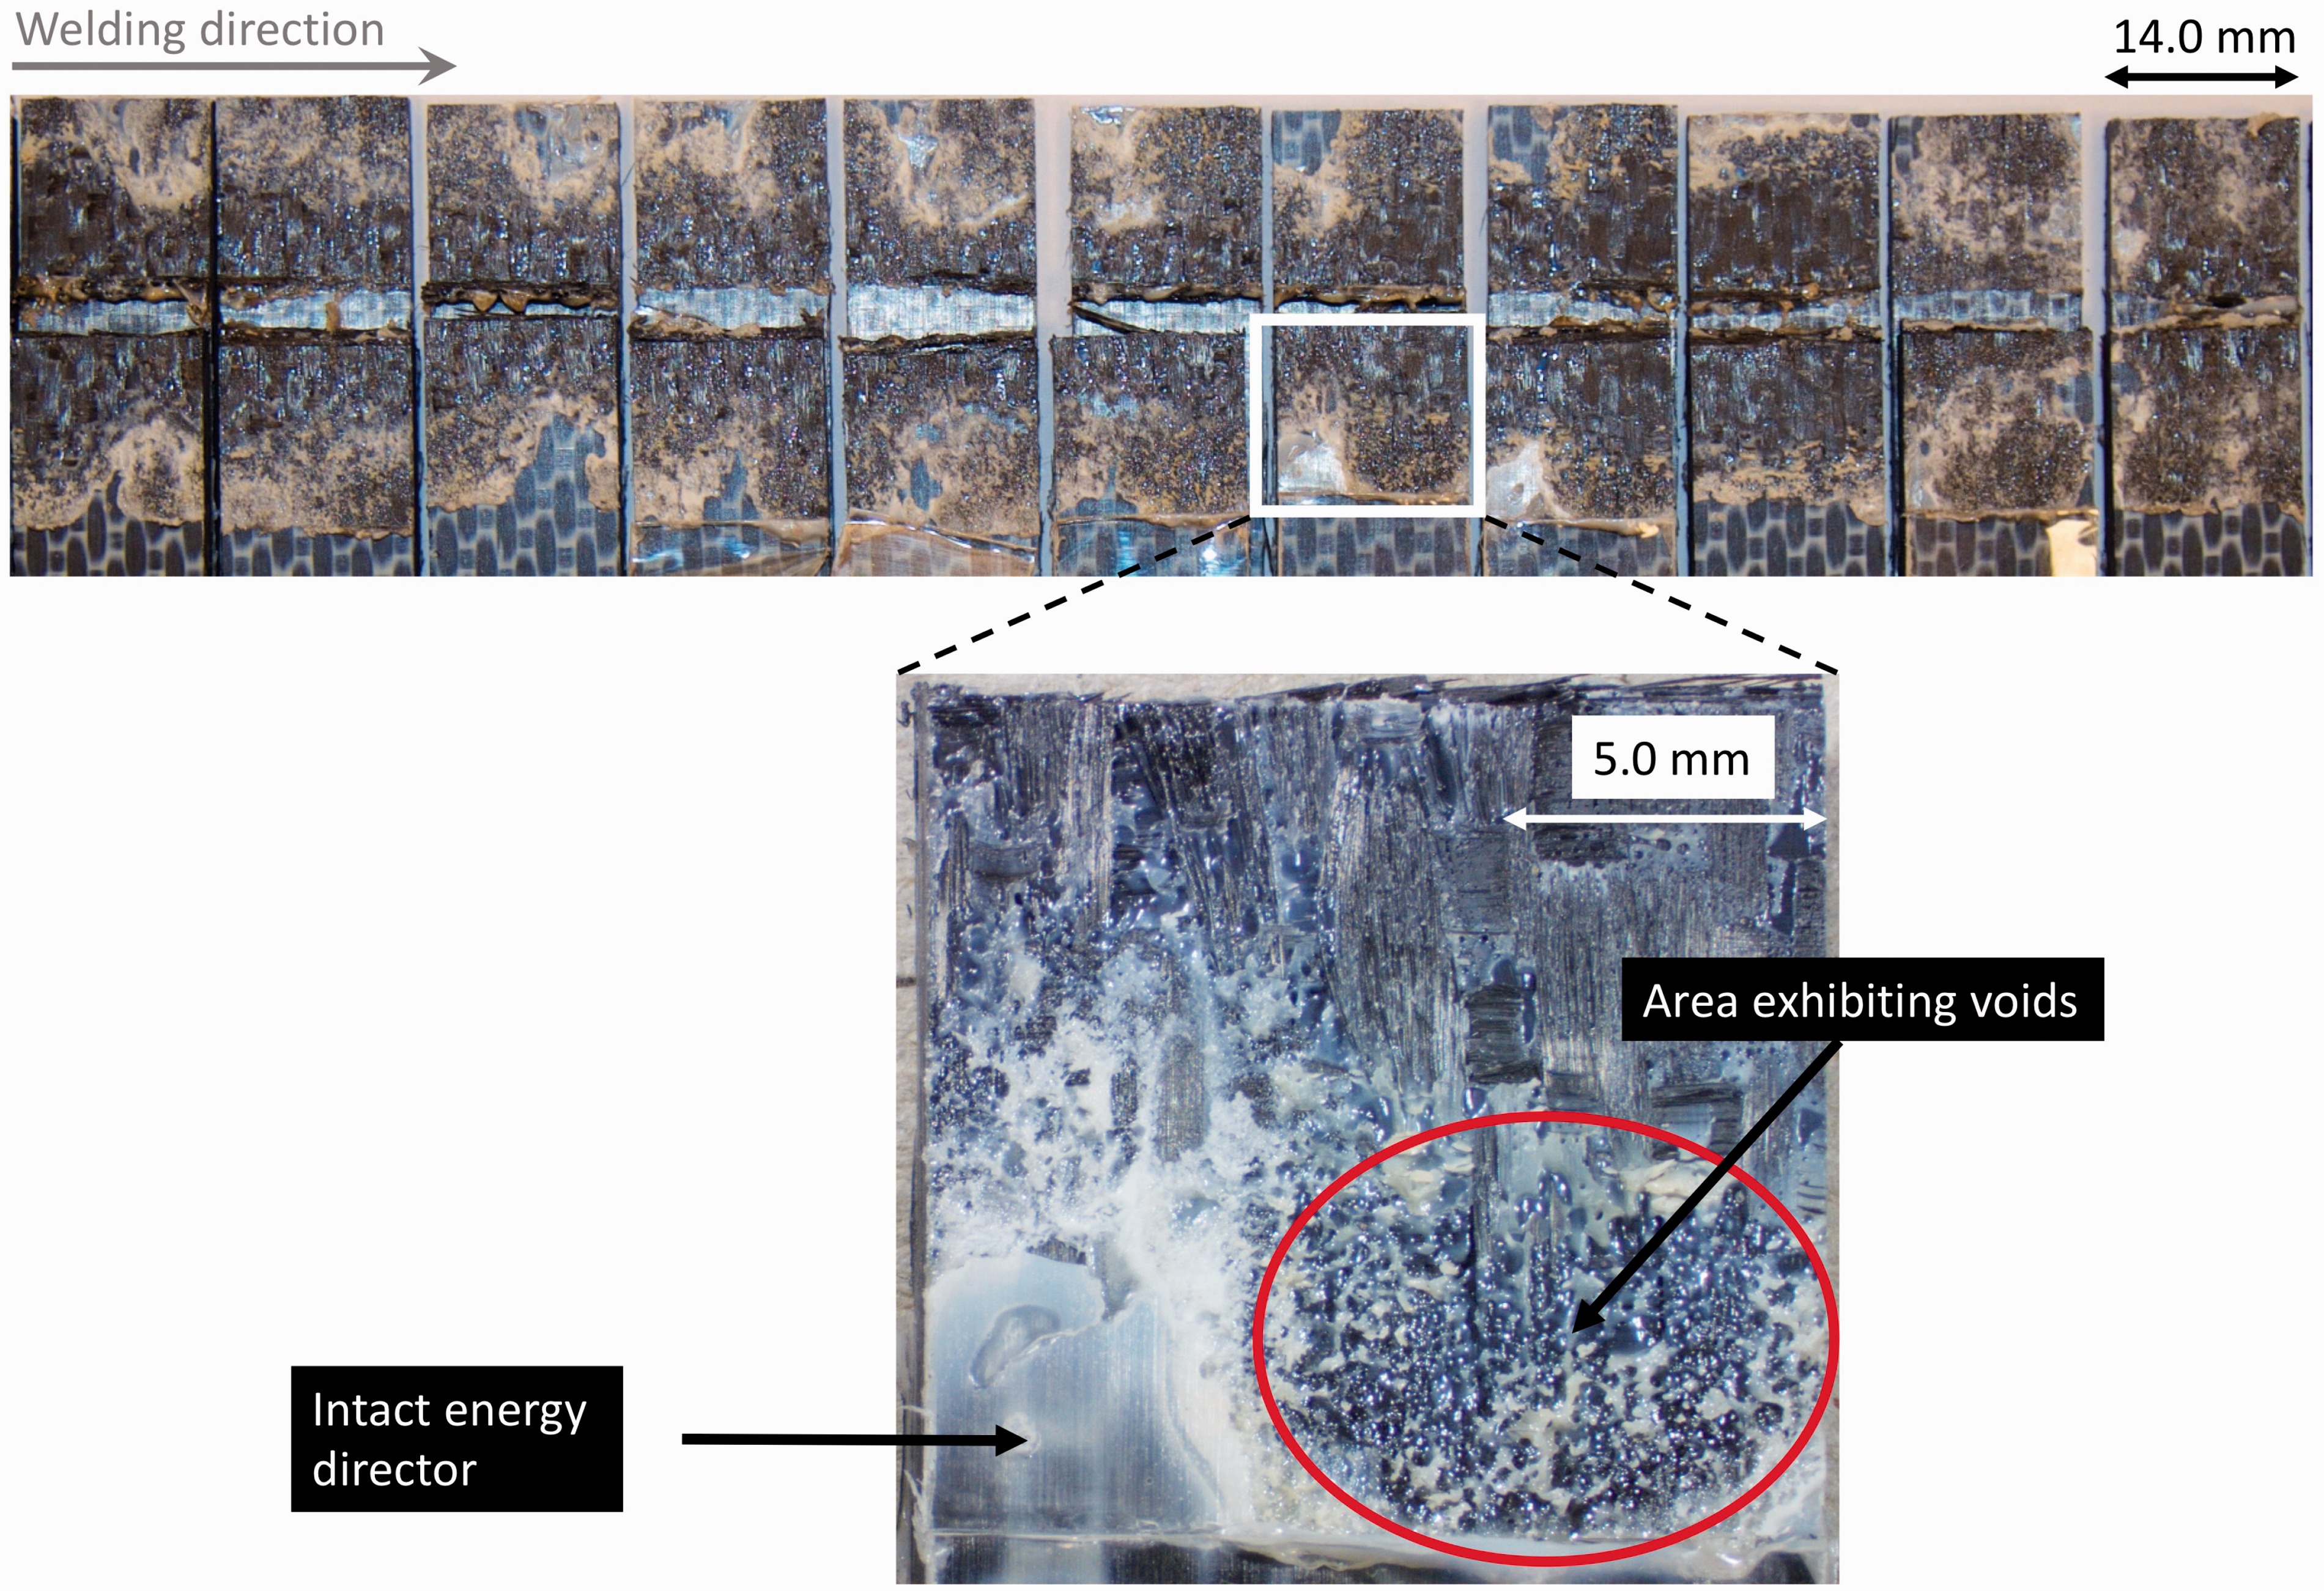
At the moment, it is not known how to improve the weld uniformity in CUW. We believe that the presence of areas with intact energy director in the weld originates from the fact that a thin energy director was used, given that a similar issue was also observed in the work done by Palardy and Villegas in static ultrasonic welding with thin energy directors. 8 The presence of areas with intact energy director could be an indication of either insufficient heat for the energy director to melt or poor contact between the energy director and the adherends at those locations. It should be noted that in any thermoplastic composite welding process, lack of intimate contact or wetting at the welding interface (between the energy director and the adherends in the case of ultrasonic welding) would preclude the formation of the welded joint. Given that the viscoelastic heat generation rate in ultrasonic welding is proportional to the square of the cyclic strain experienced by the energy director,14,18 a way to increase overall heat generation during the process would be to increase the compliance of the energy director. 16 A more compliant energy director would as well undergo a bigger deformation under the force applied by the sonotrode, which would promote a better contact with the adherends, and hence, improved wetting of the interface. 14 However, the increased local deformation of a more compliant energy director might interfere with the CUW process in a similar fashion as the squeeze flow. 17
Therefore, the objective of this study is to investigate whether increasing the compliance of the energy director would improve the weld uniformity in CUW of thermoplastic composite plates. In the first part of this study, we selected an energy director with a higher compliance than the thin film energy director used so far. In the second part, we investigated the changes that the use of such an energy director introduced in the ultrasonic welding process.
Materials and experimental procedures
The materials used in this paper are thermoplastic fiber-reinforced composite adherends and the energy directors that make it possible to focus the heat generation at the weld interface.
Adherends
Thermoplastic composite laminates were made out of CF/PPS fabric (five harness satin weave). The laminates were made from six powder-coated prepreg plies with product code: CF 0286 127 Tef4 43% (TenCate Advanced Composites, the Netherlands). The carbon fiber in the prepreg was of the type T300JB, and the prepreg had a nominal fiber volume content of 57%. The six CF/PPS prepreg plies were stacked in a [0/90]3s sequence and consolidated in a hydraulic hot plate Joos press between stainless steel plates for 20 min at 320 ℃ and 1 MPa pressure. The nominal laminate thickness was approximately 1.85 mm. The consolidated laminates were cut into plates with dimensions 220 mm by 101.6 mm to be used in the CUW process.
Energy directors
Overview of energy directors with their product names, thickness, corresponding material volume as a percentage of the material volume of the thin film energy director, the compliance, and the Tg and Tm.
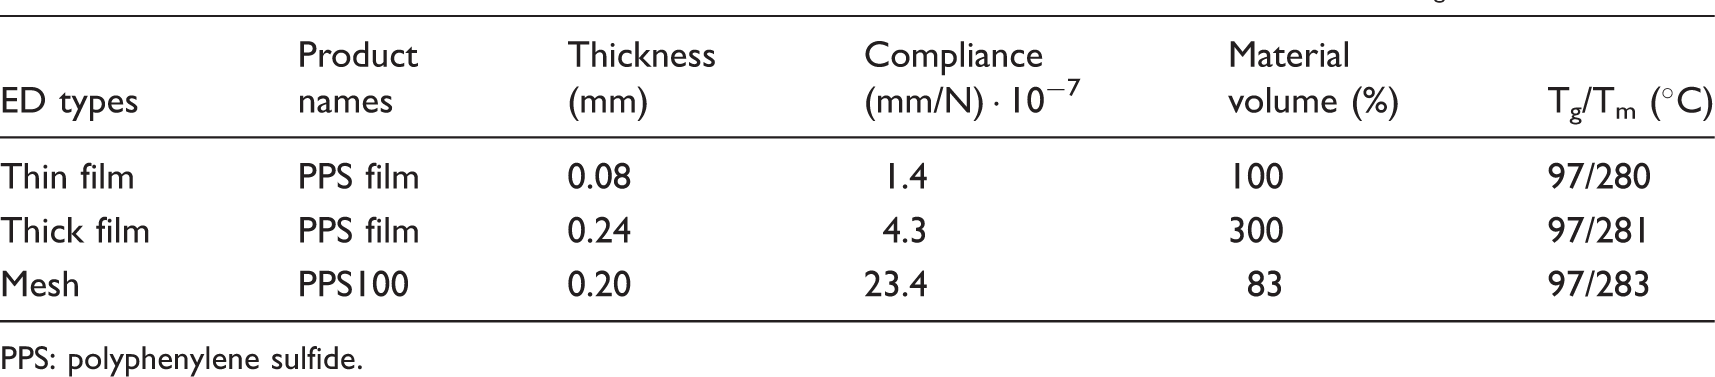
PPS: polyphenylene sulfide.
As explained in the introduction, increasing the energy director compliance increases the overall heat generation. 16 Additionally, a more compliant energy director would undergo a larger deformation under the force applied by the sonotrode promoting better contact with the adherends, and therefore, improving the wetting of the interface. 14
In order to find the energy director with the highest compliance and to quantify the compliance, it was assumed that, under the static welding force, the energy director behaves like a spring with stiffness, k. This simplified assumption is based on the work of Benatar and Gutowski.
14
The compliance, C, is proportional to the energy director thickness and inversely proportional to the contact area and modulus of the material through the following equation

To calculate the compliance of the mesh, equation (1) is used. However, in order to estimate the contact area, A, of the mesh, it can be noted that the mesh only has contact points with the adherends at the filament crossings as shown in Figure 2. Hence, it can be assumed that the contact area is equal to the sum of the contact areas of all filament crossings at the interface. The contact area of one filament crossing can be estimated by representing it as a square with sides equal to the diameter of the filaments. This estimation then results in approximately 15.2% of contact of the total area covered by the mesh. Table 1 shows that the mesh energy director has compliance that is approximately 17 times higher than the thin film energy director and approximately 5.5 times higher than the thick film.
Cross-sectional micrograph of mesh energy director. The definitions of mesh opening (MO = 154 µm), thread diameter (TD = 100 µm), and mesh thickness are indicated. The cross-section open area in this figure when this pristine mesh is placed in between two adherends is approximately 22%.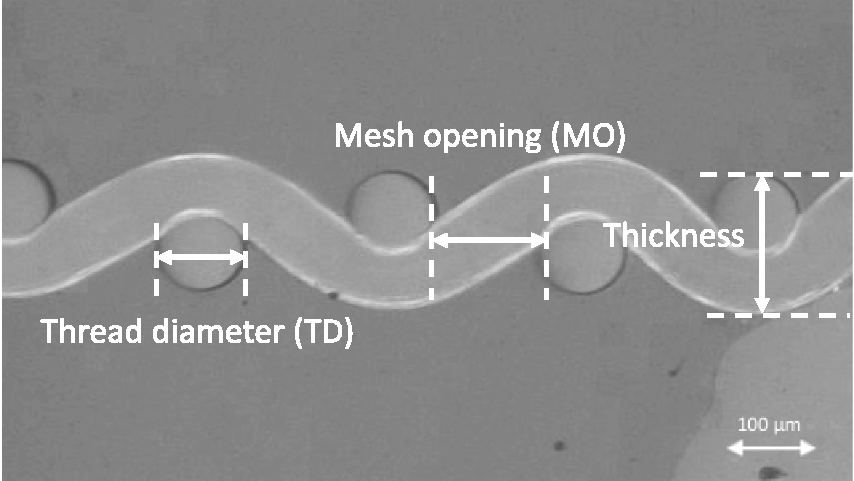
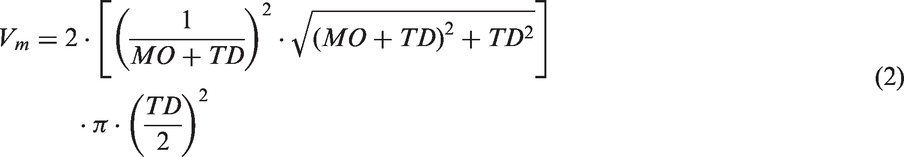
Another benefit of the mesh is that it has a similar material volume as the thin film energy director. This would eliminate the potential influence of the amount of energy directing material at the interface. The thick film energy director, on the other hand, has three times more material compared to the thin film energy director. The material volume (mm
3
) of the 0.20 mm-thick mesh for a unit area (top view) was estimated according to the following equation
We will study the 0.20-mm-thick mesh energy director and compare it with the thin film state-of-the-art energy director. The 0.20-mm-thick mesh energy director is a good choice for the experiments in this study since it has a much higher compliance than the thin film energy director, and it has a similar amount of energy directing material at the weld interface. The thick film energy director is discarded, since it not only has a slightly higher compliance than the thin film energy director, but it also has more material, which is expected to interfere with the welding process. 17
Continuous ultrasonic welding
The CUW machine, shown in Figure 3, was used for the CUW process. A ultrasonic welder from Rinco Ultrasonics (C20-10) was used that operated at 20 KHz. For each welded seam, two CF/PPS plates were welded together in a single lap shear configuration with a 12.7 mm overlap.
(a) Overview of setup used for continuous ultrasonic welding: (1) pneumatic press, (2) converter, (3) booster, (4) rails for moving the stack, (5) stepper motor; (b) (6) Sonotrode with indicated welding direction, and (7) bar clamps; and (c) close-up of weld seam (blue area) and sonotrode with indicated dimensions.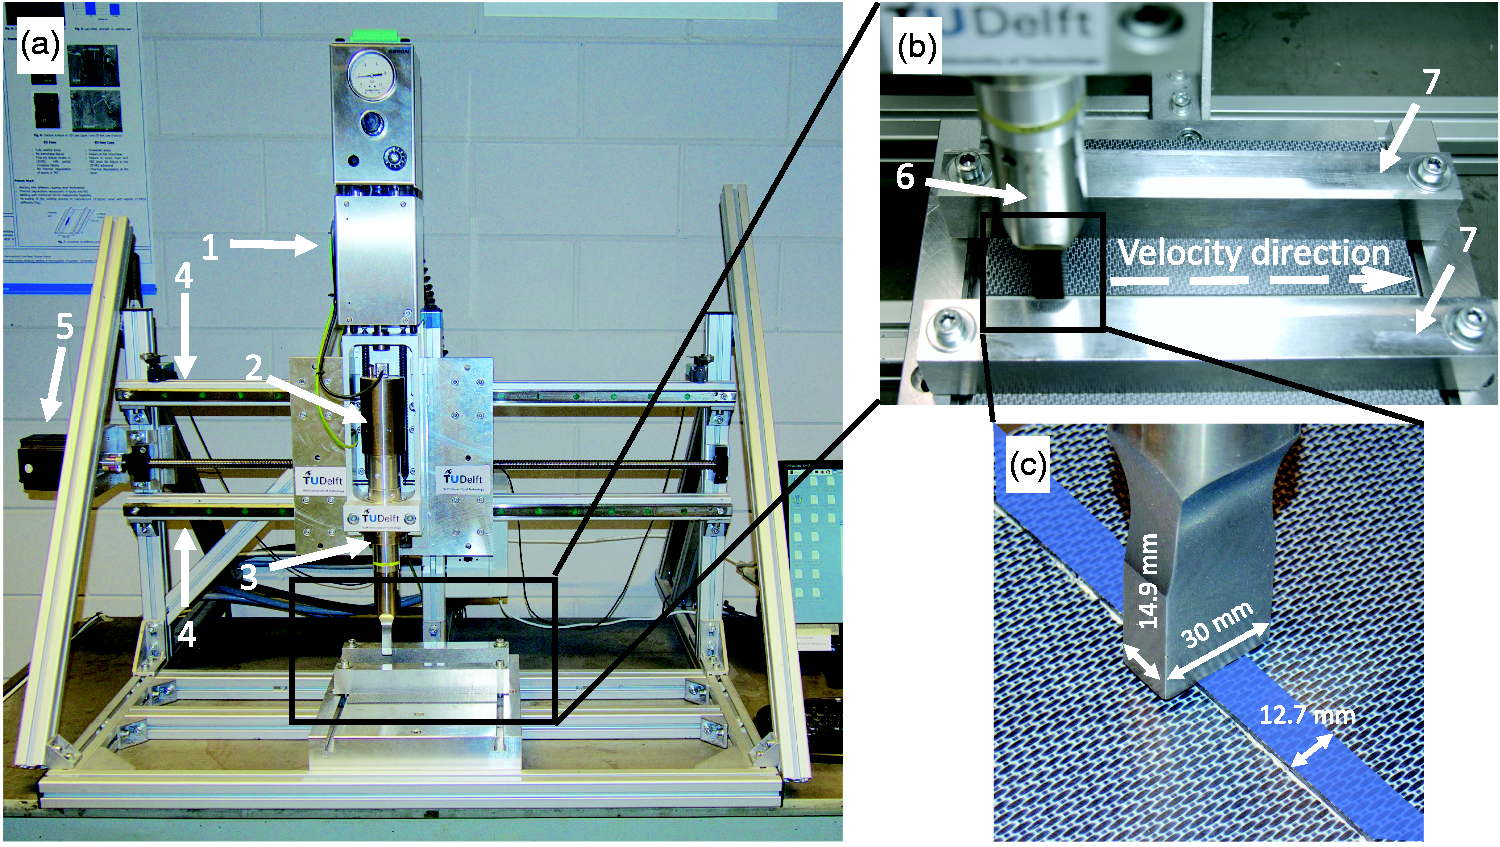
The CF/PPS plates were kept in place by the two aluminum bar clamps shown in Figure 3(b) with a spacing of 70 mm. During the welding process, the welding train (converter, booster, and sonotrode) was pneumatically pressed against the welding stack (stack of materials at the overlap directly underneath the sonotrode) and moved along the overlap area indicated in Figure 3(b) and (c). A rectangular sonotrode with a width of 14.9 mm and a length of 30 mm was used. The orientation of the sonotrode with respect to its translational movement can be seen in Figure 3(b) and (c). At the start and end of the continuous welding process, the welding train accelerated and decelerated at a rate of 0.6m/s2. Hence, the welding speed was not constant at the start and end of the welded seam, and therefore, one sample at the start and one sample at the end of the welded seam were discarded for mechanical testing. The surface finish of the top adherend, over which the sonotrode slided, remained pristine after the welding process, because the top surface does not melt, and the friction between the sonotrode and the composite surface is low due to the smooth sonotrode and composite surfaces. After the welding process, 14.0-mm-wide lap shear samples were cut from the welded plates, resulting in 11 samples per continuous weld (after discarding the samples at the two edges and the cut losses).
The process parameters for CUW were the welding force, the vibrational amplitude, and the welding speed. A constant welding force of 500 N, a vibrational peak-to-peak amplitude of 82.5 µm, and welding speeds of 40 mm/s (for the thin film energy director) and 45 mm/s (mesh energy director) were used during the process. The welding speed for the energy directors was based on the welding time at the optimum weld conditions6,7 of static welds. The optimum weld conditions are the conditions that give the highest lap shear strength (LSS) and thus result in an optimum weld. These static welds were produced with the same sonotrode, same CUW machine (shown in Figure 3(c)), and clamping as used for the CUW process. For these static welds, adherends with dimensions of 14.0 mm by 101.6 mm were used. A peak-to-peak vibrational amplitude of 82.5 µm and a weld force of 300 N were used. Note that the welding force in these experiments was lower than the welding force of the CUW process in order to keep the welding pressure consistent with the CUW process, because in the CUW process the force applied by the sonotrode extended over a width greater than the 14.9 mm sonotrode width (seen by the imprint of the top adherend on carbon paper under the welding force).
Static ultrasonic welding
To understand the welding behavior of the energy directors, static ultrasonic welding was used in the second part of this study. For this part of the study, a Rinco Dynamic 3000 static ultrasonic welding machine with a cylindrical (40 mm diameter) sonotrode was utilized. Adherends with dimensions of 25.4 mm width by 101.6 mm length were used. The custom-built welding jig (Figure 4(a)) kept the adherends (Figure 4(b)) in place assuring an overlap of 12.7 mm. The welding jig allowed the upper adherend to move vertically during the welding process to avoid potential bending caused by the downward displacement of the sonotrode due to the squeeze out of the polymer from the energy director at the weld overlap. A welding force of 500 N and a peak-to-peak vibrational amplitude of 86.2 µm were used. Additionally, a consolidation force of 1000 N was used for a period of 4000 ms directly after the ultrasonic vibrations stopped.
(a) Custom-built welding jig and ultrasonic welding machine: (1) sonotrode, (2) upper adherend clamp, (3) lower adherend clamp, and (4) spring-supported platform for the upper clamp. The white box shows the location and orientation of the single lap shear adherends, which is schematically shown in (b). (b) CF/PPS adherends (black) and ED (grey).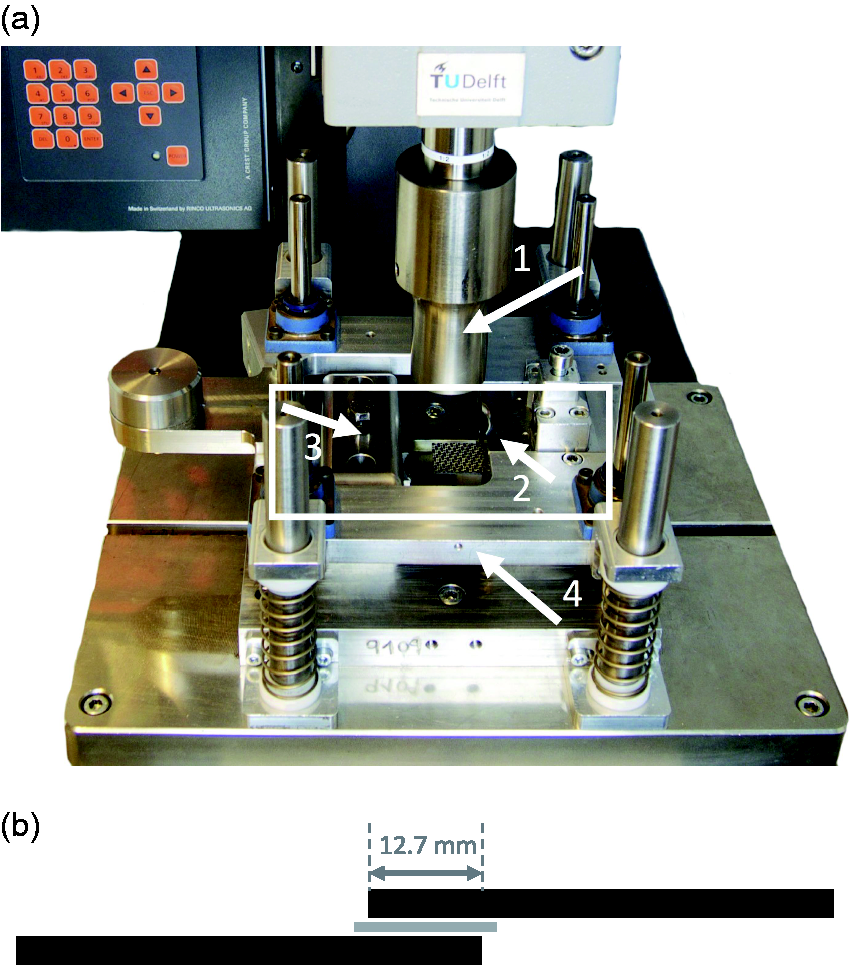
Samples were welded at four different moments of the welding process to understand the behavior of the energy director during the welding process. The ultrasonic welding machine provides feedback data during the welding process. In this study, the power and transverse sonotrode displacement data during the welding processes were collected and studied to understand the phenomena happening at the interface.
Mechanical testing and microscopy characterization
After the continuous welding process, the welded plates were cut into 14.0-mm-wide single lap shear samples, which were mechanically tested to obtain the LSS. For the cutting, a Proth water-cooled grinding machine with a diamond-coated blade was used.
The single lap shear samples were mechanically tested with a Zwick/Roell 250 kN universal testing machine with a cross-head speed of 1.3 mm/min. The grips were given the necessary offset to ensure parallelism between the load introduction and the overlap as an alternative to tabs. After testing, the fracture surfaces were analyzed using a ZEISS Discovery.V8 SteREO microscope.
Specimens were cut from the overlaps of the welded samples in such a way that a cross-sectional view from the adherends and the weld line could be obtained. The specimens were embedded in epoxy resin. The embedded specimens were ground and polished with a Struers Tegramin-20 polisher. A Keyence VH-Z100UR digital microscope was used to observe the polished cross-sections. The Keyence software was used to measure the weld line thickness. In order to measure the cross-sectional open areas, the software ImageJ version 1.52a was used.
Results
Part 1: a woven PPS mesh as an energy director in CUW
Figure 5 shows the fracture surfaces after single lap shear testing of the individual samples cut from the welded seam obtained with the mesh energy director. The entire welded seam is more uniformly welded as compared to the weld made with a thin film energy director (shown in Figure 1). No intact energy director can be found in the fracture surfaces, but at numerous locations, voids can be observed.
Representative fracture surfaces of 220 mm-long CF/PPS plates continuously welded with the mesh energy director and a single overlap of 12.7 mm. Welding speed was 45 mm/s, welding force 500 N, and vibrational amplitude 82.5 µm.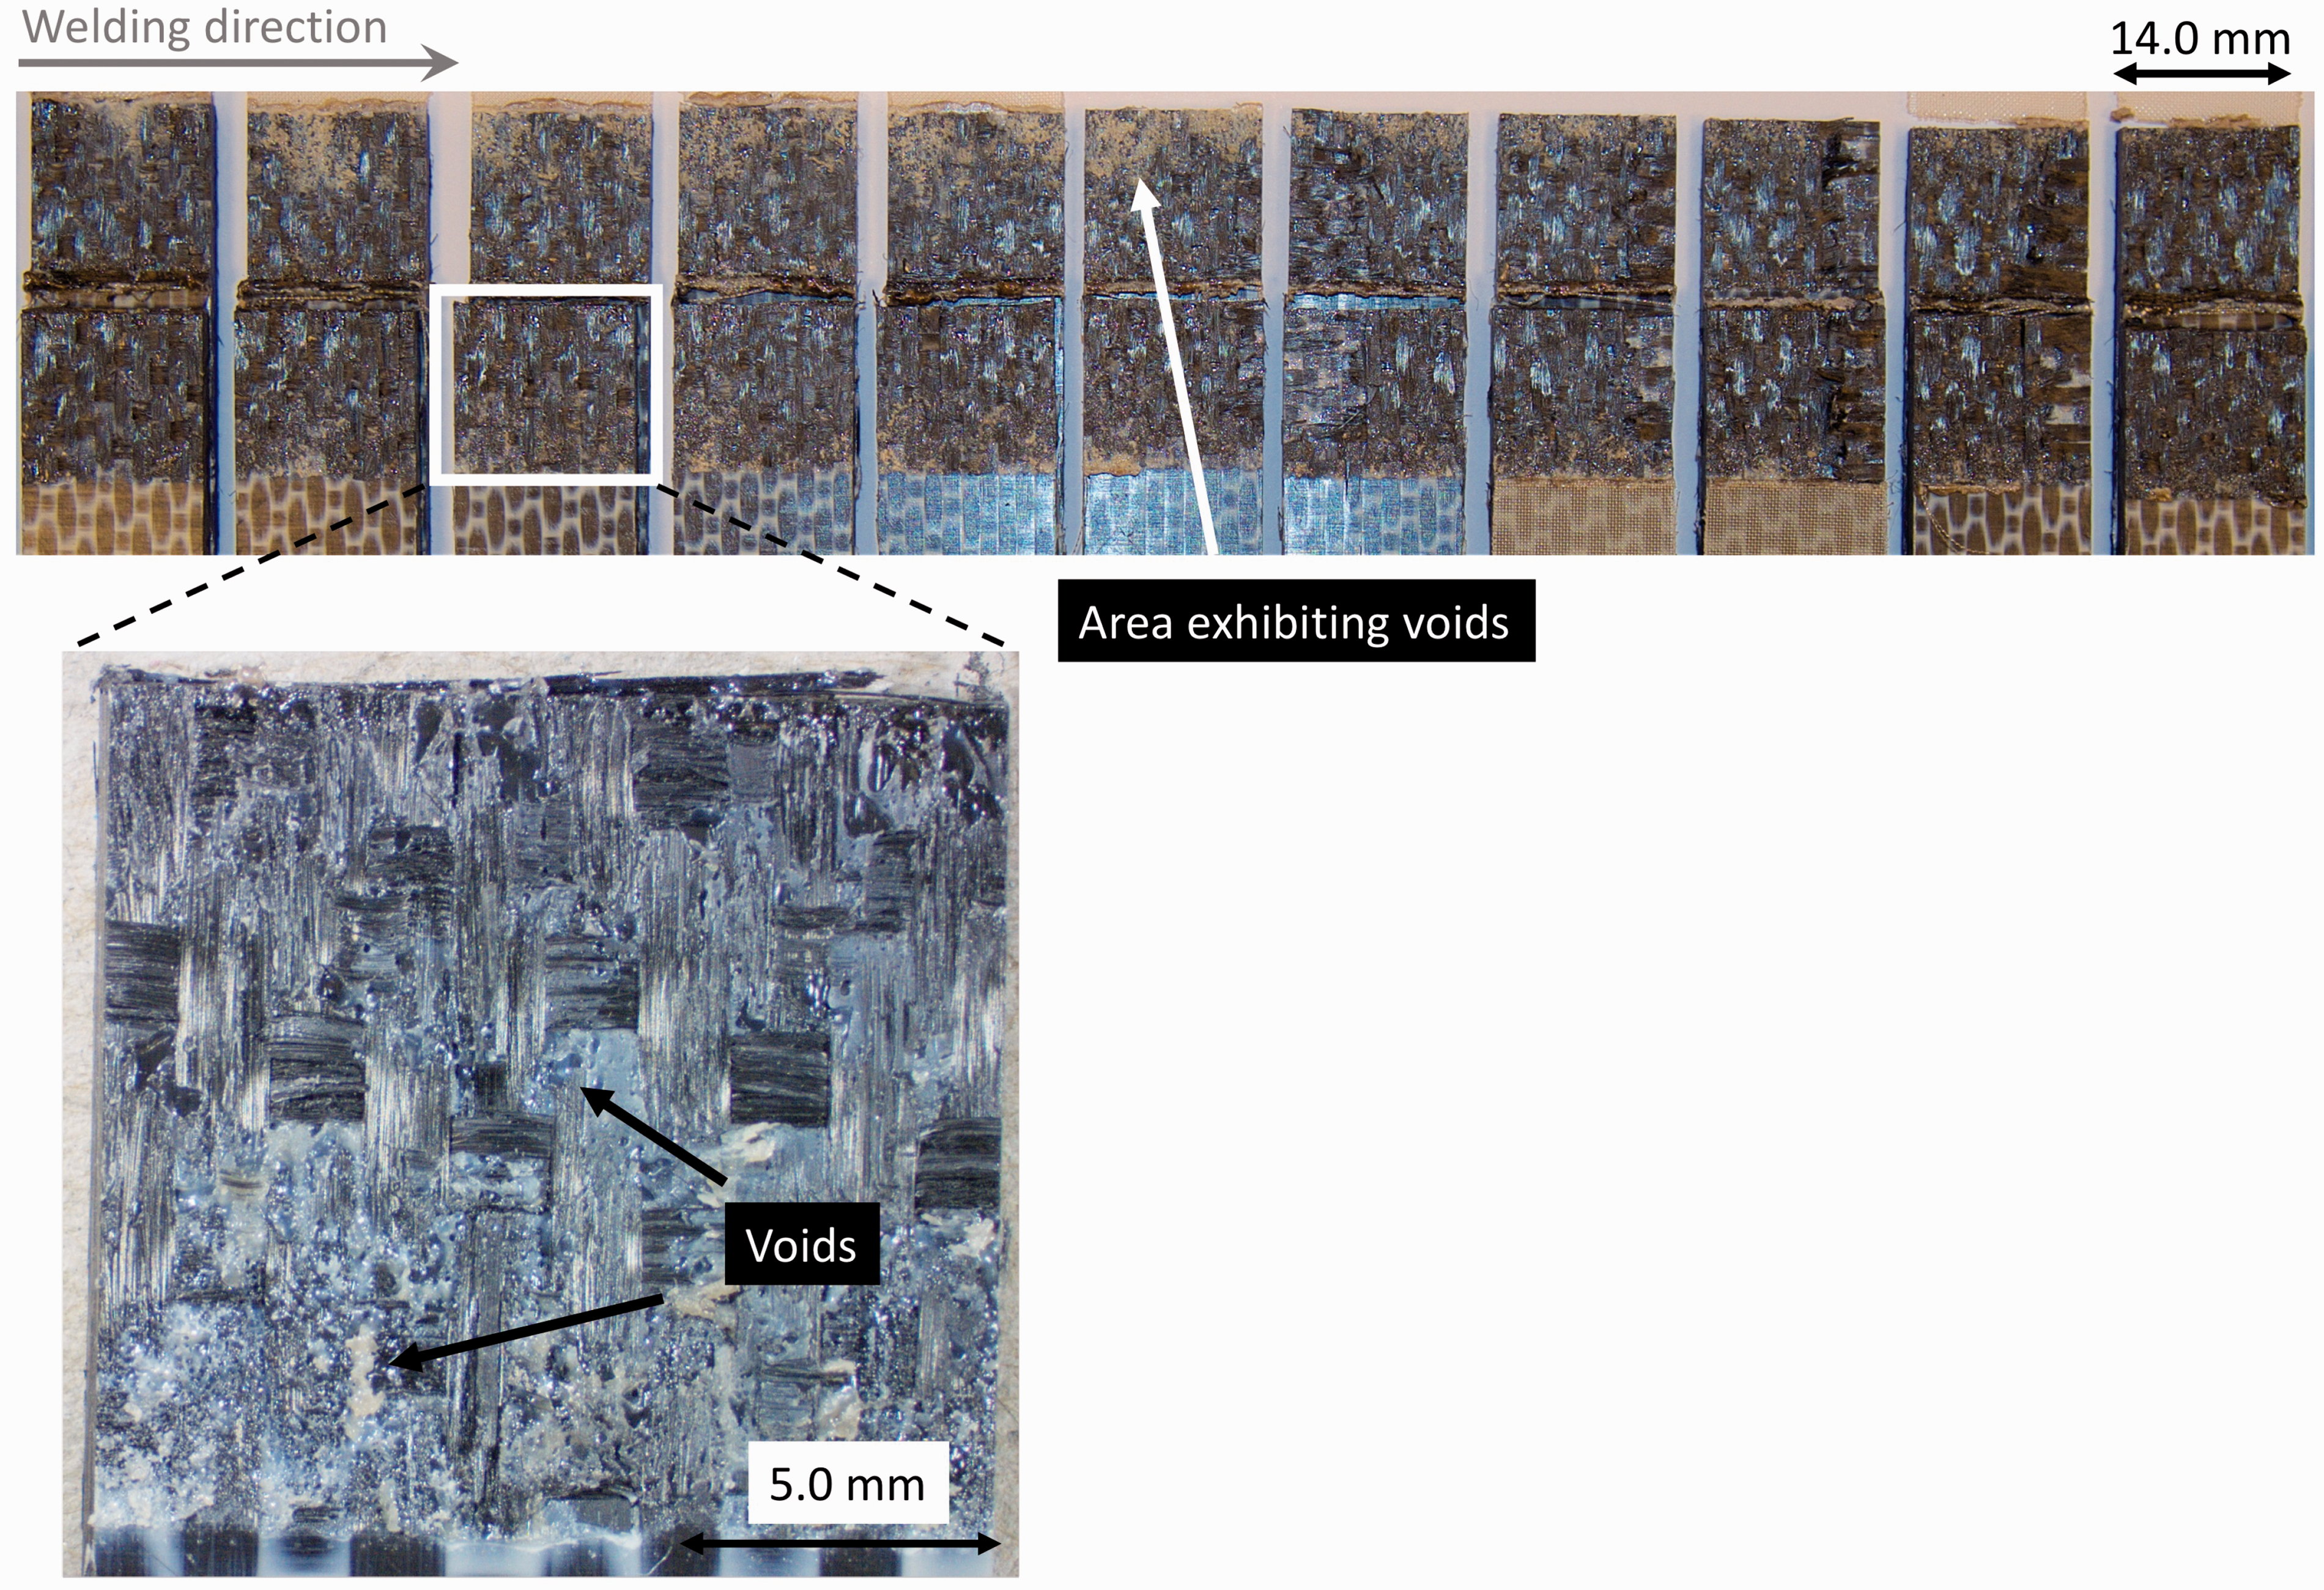
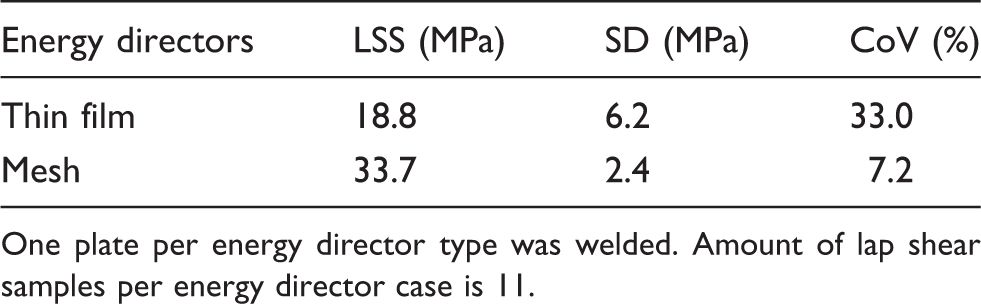
The LSS values over the length of the welded seam made with the mesh energy director and the thin film reference energy director are shown in Figure 6. For the seam made with the mesh, the strength is relatively constant with an average strength of 33.4 MPa and a coefficient of variation of 7.2%. In the case of the reference thin film energy director, the average strength is 18.8 MPa with a coefficient of variation of 33.0%. The obtained average LSS values for the two energy directors are consistent with the corresponding fracture surfaces. Table 2 shows an overview of the LSS values for the two investigated energy directors. Since the mesh energy director improved the weld uniformity and lab shear strength, the next section will focus on how the welding behavior of the mesh improved the weld uniformity compared to the thin film energy director.
Lap shear strength visualized over the length of the welded seam. Each dot represents one lap shear sample. Welding force of 500 N and peak-to-peak vibrational amplitude of 82.5 µm. Welding speeds: 40 mm/s (thin film energy director) and 45mm/s (mesh energy director). Lap shear strength (LSS) results, standard deviation (SD), and coefficient of variation (CoV) for continuously welded plates for the two energy directors. One plate per energy director type was welded. Amount of lap shear samples per energy director case is 11.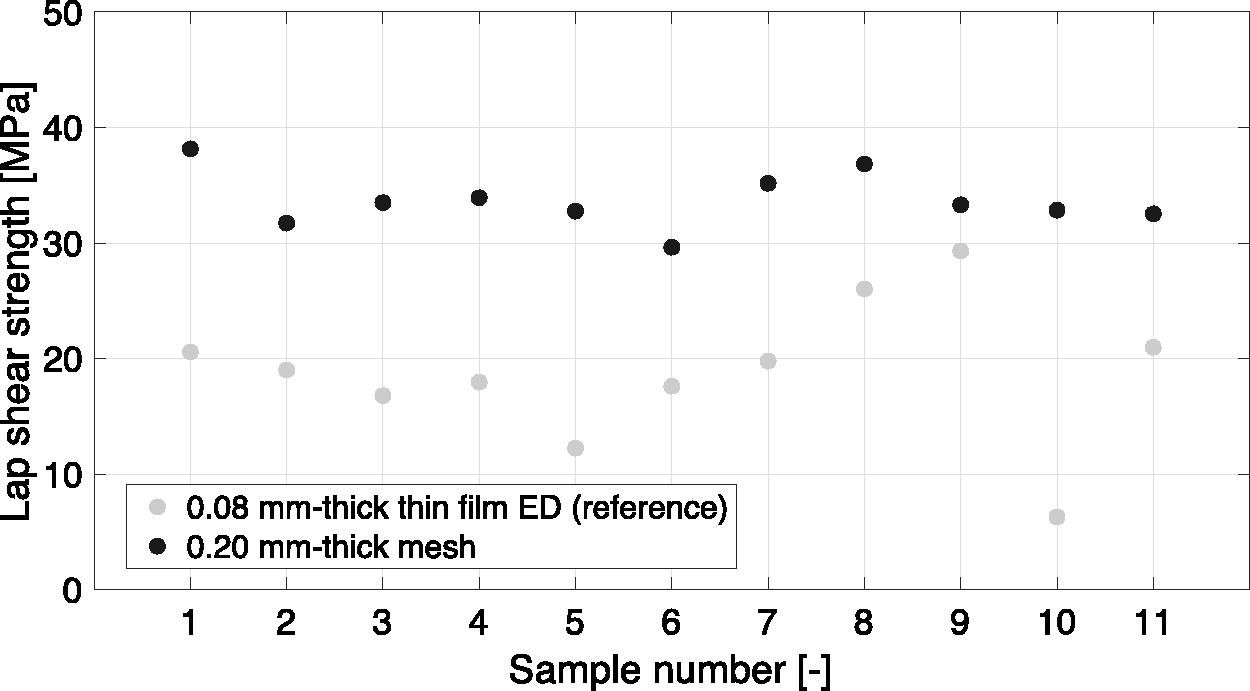
Part 2: melting, flow and strength generation of the mesh studied in static ultrasonic welding
To understand why the mesh improves the weld uniformity, the melting and flow behavior of the mesh energy director is analyzed using static welding and compared to the behavior of the thin film energy director. Figure 7 shows representative power and displacement curves for the mesh and the thin film energy director. For the mesh, the displacement curve (shown in Figure 7(a)) increases significantly at the beginning of the welding process from 0.00 mm to 0.06 mm, where it plateaus. The plateau is followed by another increase in displacement. The power increases significantly at the beginning of the welding process for 50 ms. Afterwards, the power continues to increase during the displacement plateau at a lower rate until a maximum is reached towards the end of the plateau.
Representative power and displacement curves for the ultrasonic welding with (a) the mesh energy director and (b) a thin film energy director. For the mesh, X
m
defines a moment before the displacement plateau. For both the mesh energy director (m) and the thin film energy director (f), A
x
(x is either m or f) defines the beginning of the displacement plateau, B
x
and C
x
are different moments within the displacement plateau, and D
x
defines the end of the displacement plateau.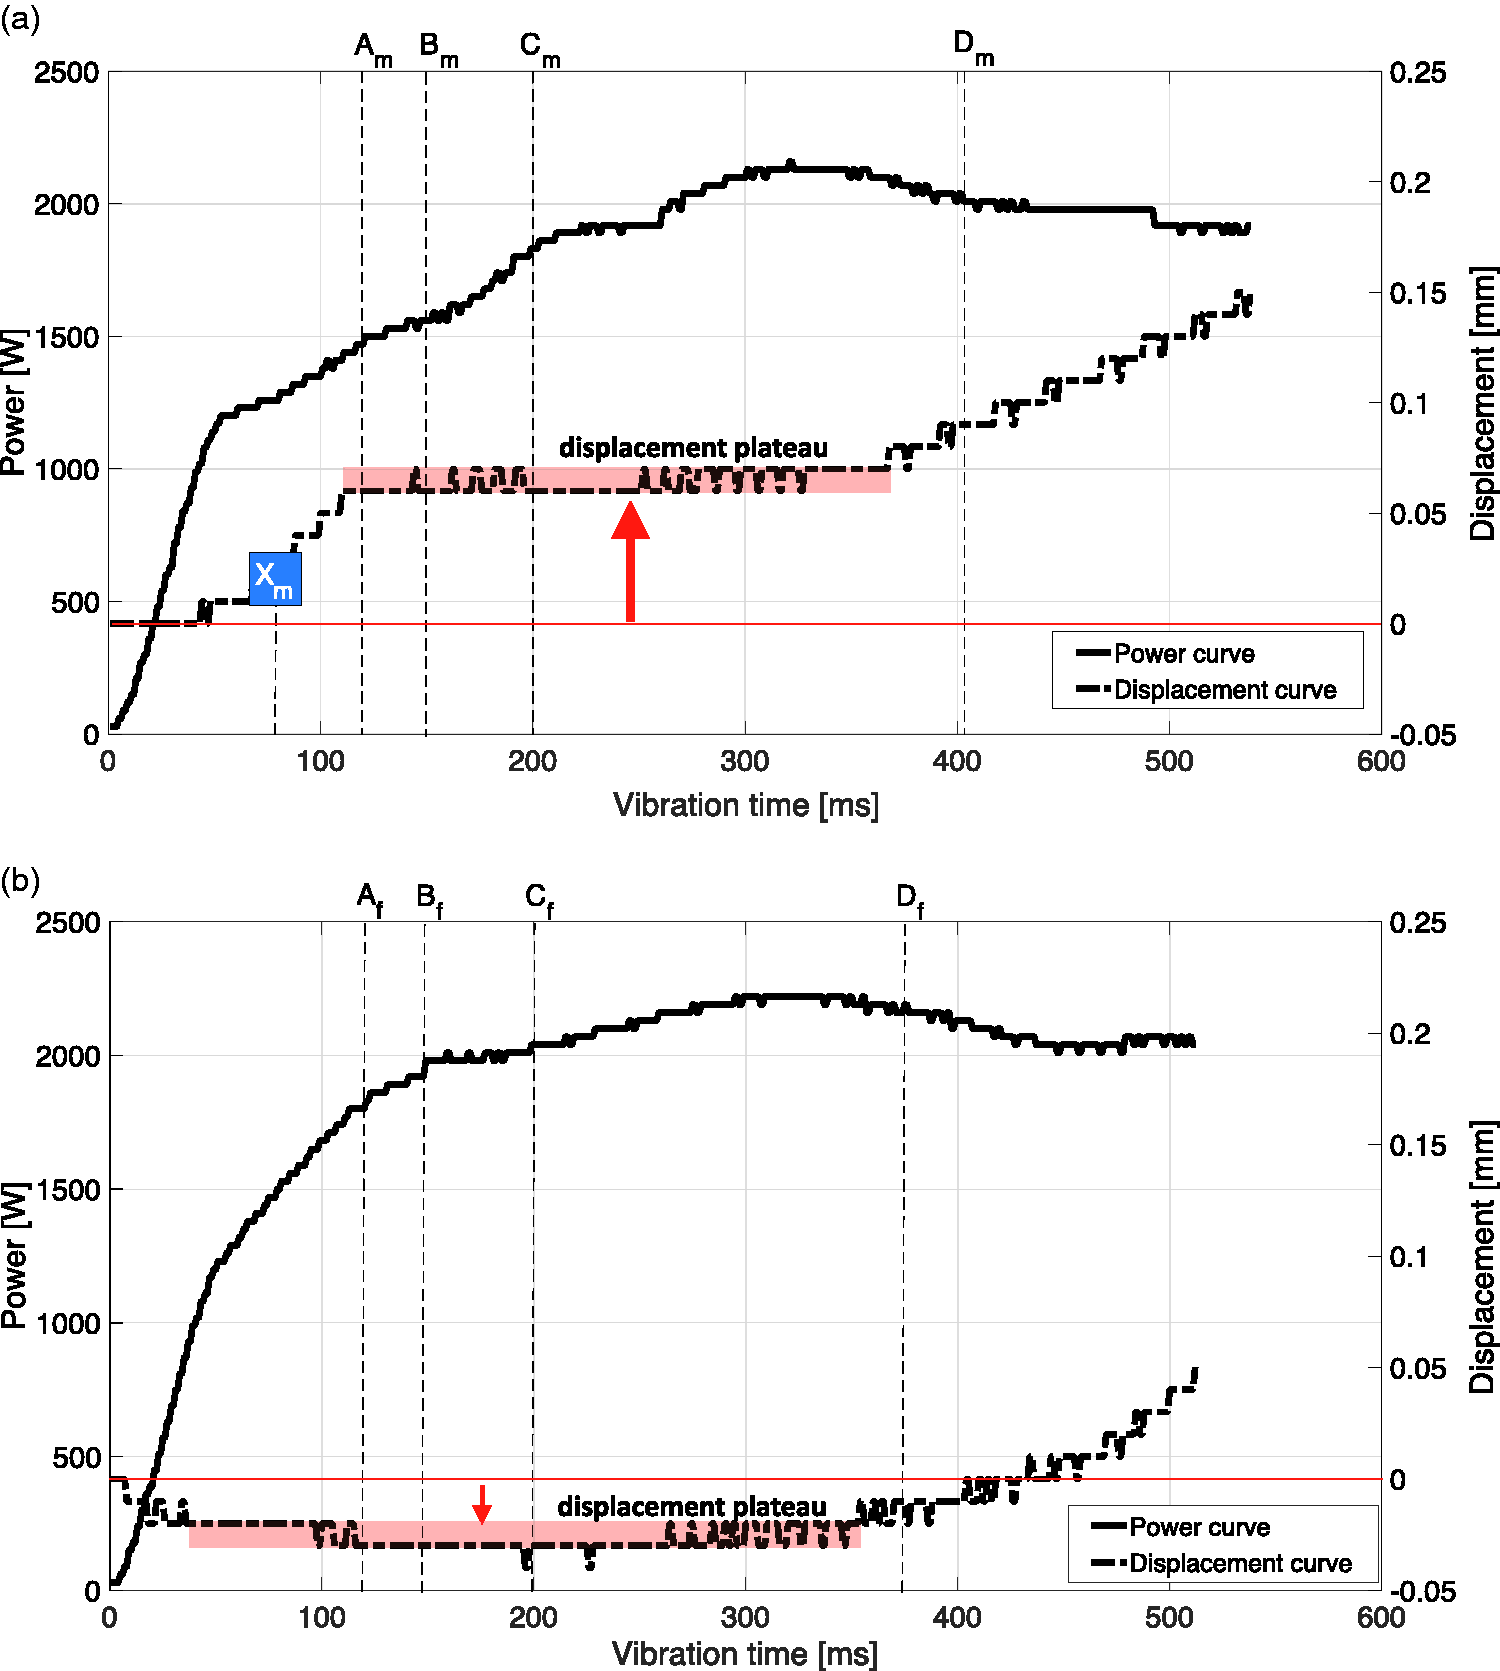
For the thin film energy director in Figure 7(b), the displacement starts with a small decrease of 0.02–0.03 mm (upward sonotrode displacement) after which it plateaus. The end of the plateau is followed by an increase in displacement. Similarly to the mesh energy director, the power for the thin film energy director increases significantly from the start of the welding process for 50 ms and keeps increasing at a lower rate until a maximum is reached. This maximum in power is found to coincide with the end of the displacement plateau. After the maximum power is reached, the power slowly decreases. When comparing the displacement curves for the mesh energy director in Figure 7(a) and the thin film energy director in Figure 7(b), the main difference can be found at the beginning of the welding process: the displacement of the mesh steeply increased whereas the displacement of the thin film energy director decreased. From the start of the displacement plateau of the mesh energy director, the displacement curves for both mesh energy director and thin film energy director exhibit a very similar behavior as seen in Figure 7.
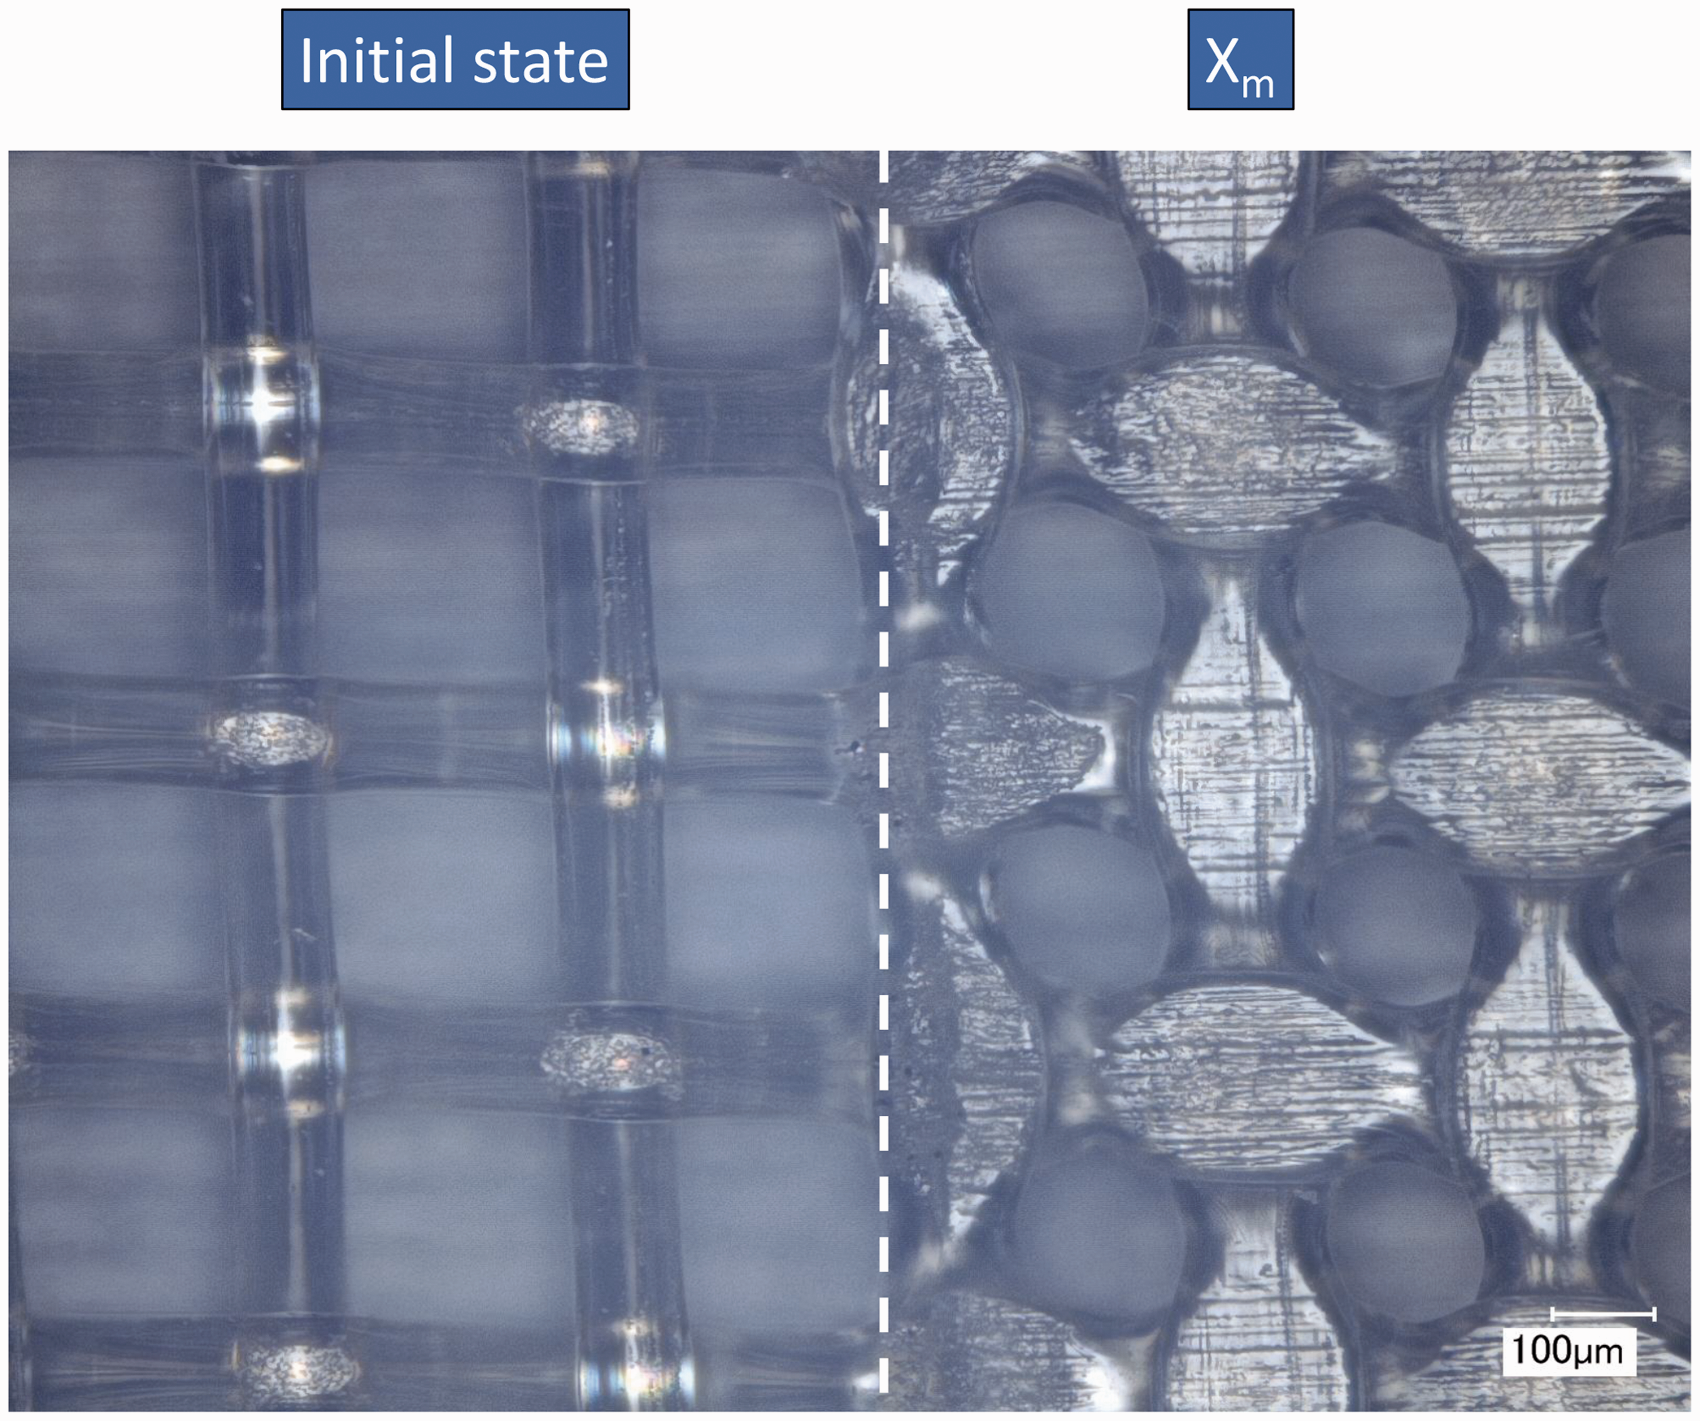
Figure 8 shows the top view of a mesh on top of the bottom adherend after the welding process is stopped at moment X
m
indicated in Figure 7(a). On the left, the initial state of the mesh is shown as a reference. It should be noted that at that moment (X
m
), the top adherend is removed with ease since it does not stick to the mesh. Mesh flattening is observed at the locations where the filament crossings come into contact with the adherends, forming oval-shaped contact areas uniformly distributed over the entire weld. Due to the flattening, the mesh filaments widen, decreasing the open areas within the mesh.
Top view of mesh and adherend demonstrating flattening of the mesh at the filament crossings. Pristine mesh outside of the joint (initial state) and partially welded mesh within the weld before reaching the plateau in displacement (X
m
).
Figures 9 and 10 show cross-sectional micrographs of adherends welded until moments A
x
, B
x
, C
x
, and D
x
of the welding process for the mesh energy director and the thin film energy director respectively, as indicated in Figure 7(a) and (b). Moment A
x
(x being either m for mesh or f for thin film energy director) defines the beginning of the displacement plateau at 120 ms. Moment B
x
at 150 ms and moment C
x
at 200 ms are moments within the first half of the displacement plateau, and moment D
x
approximately defines the end of the displacement plateau.
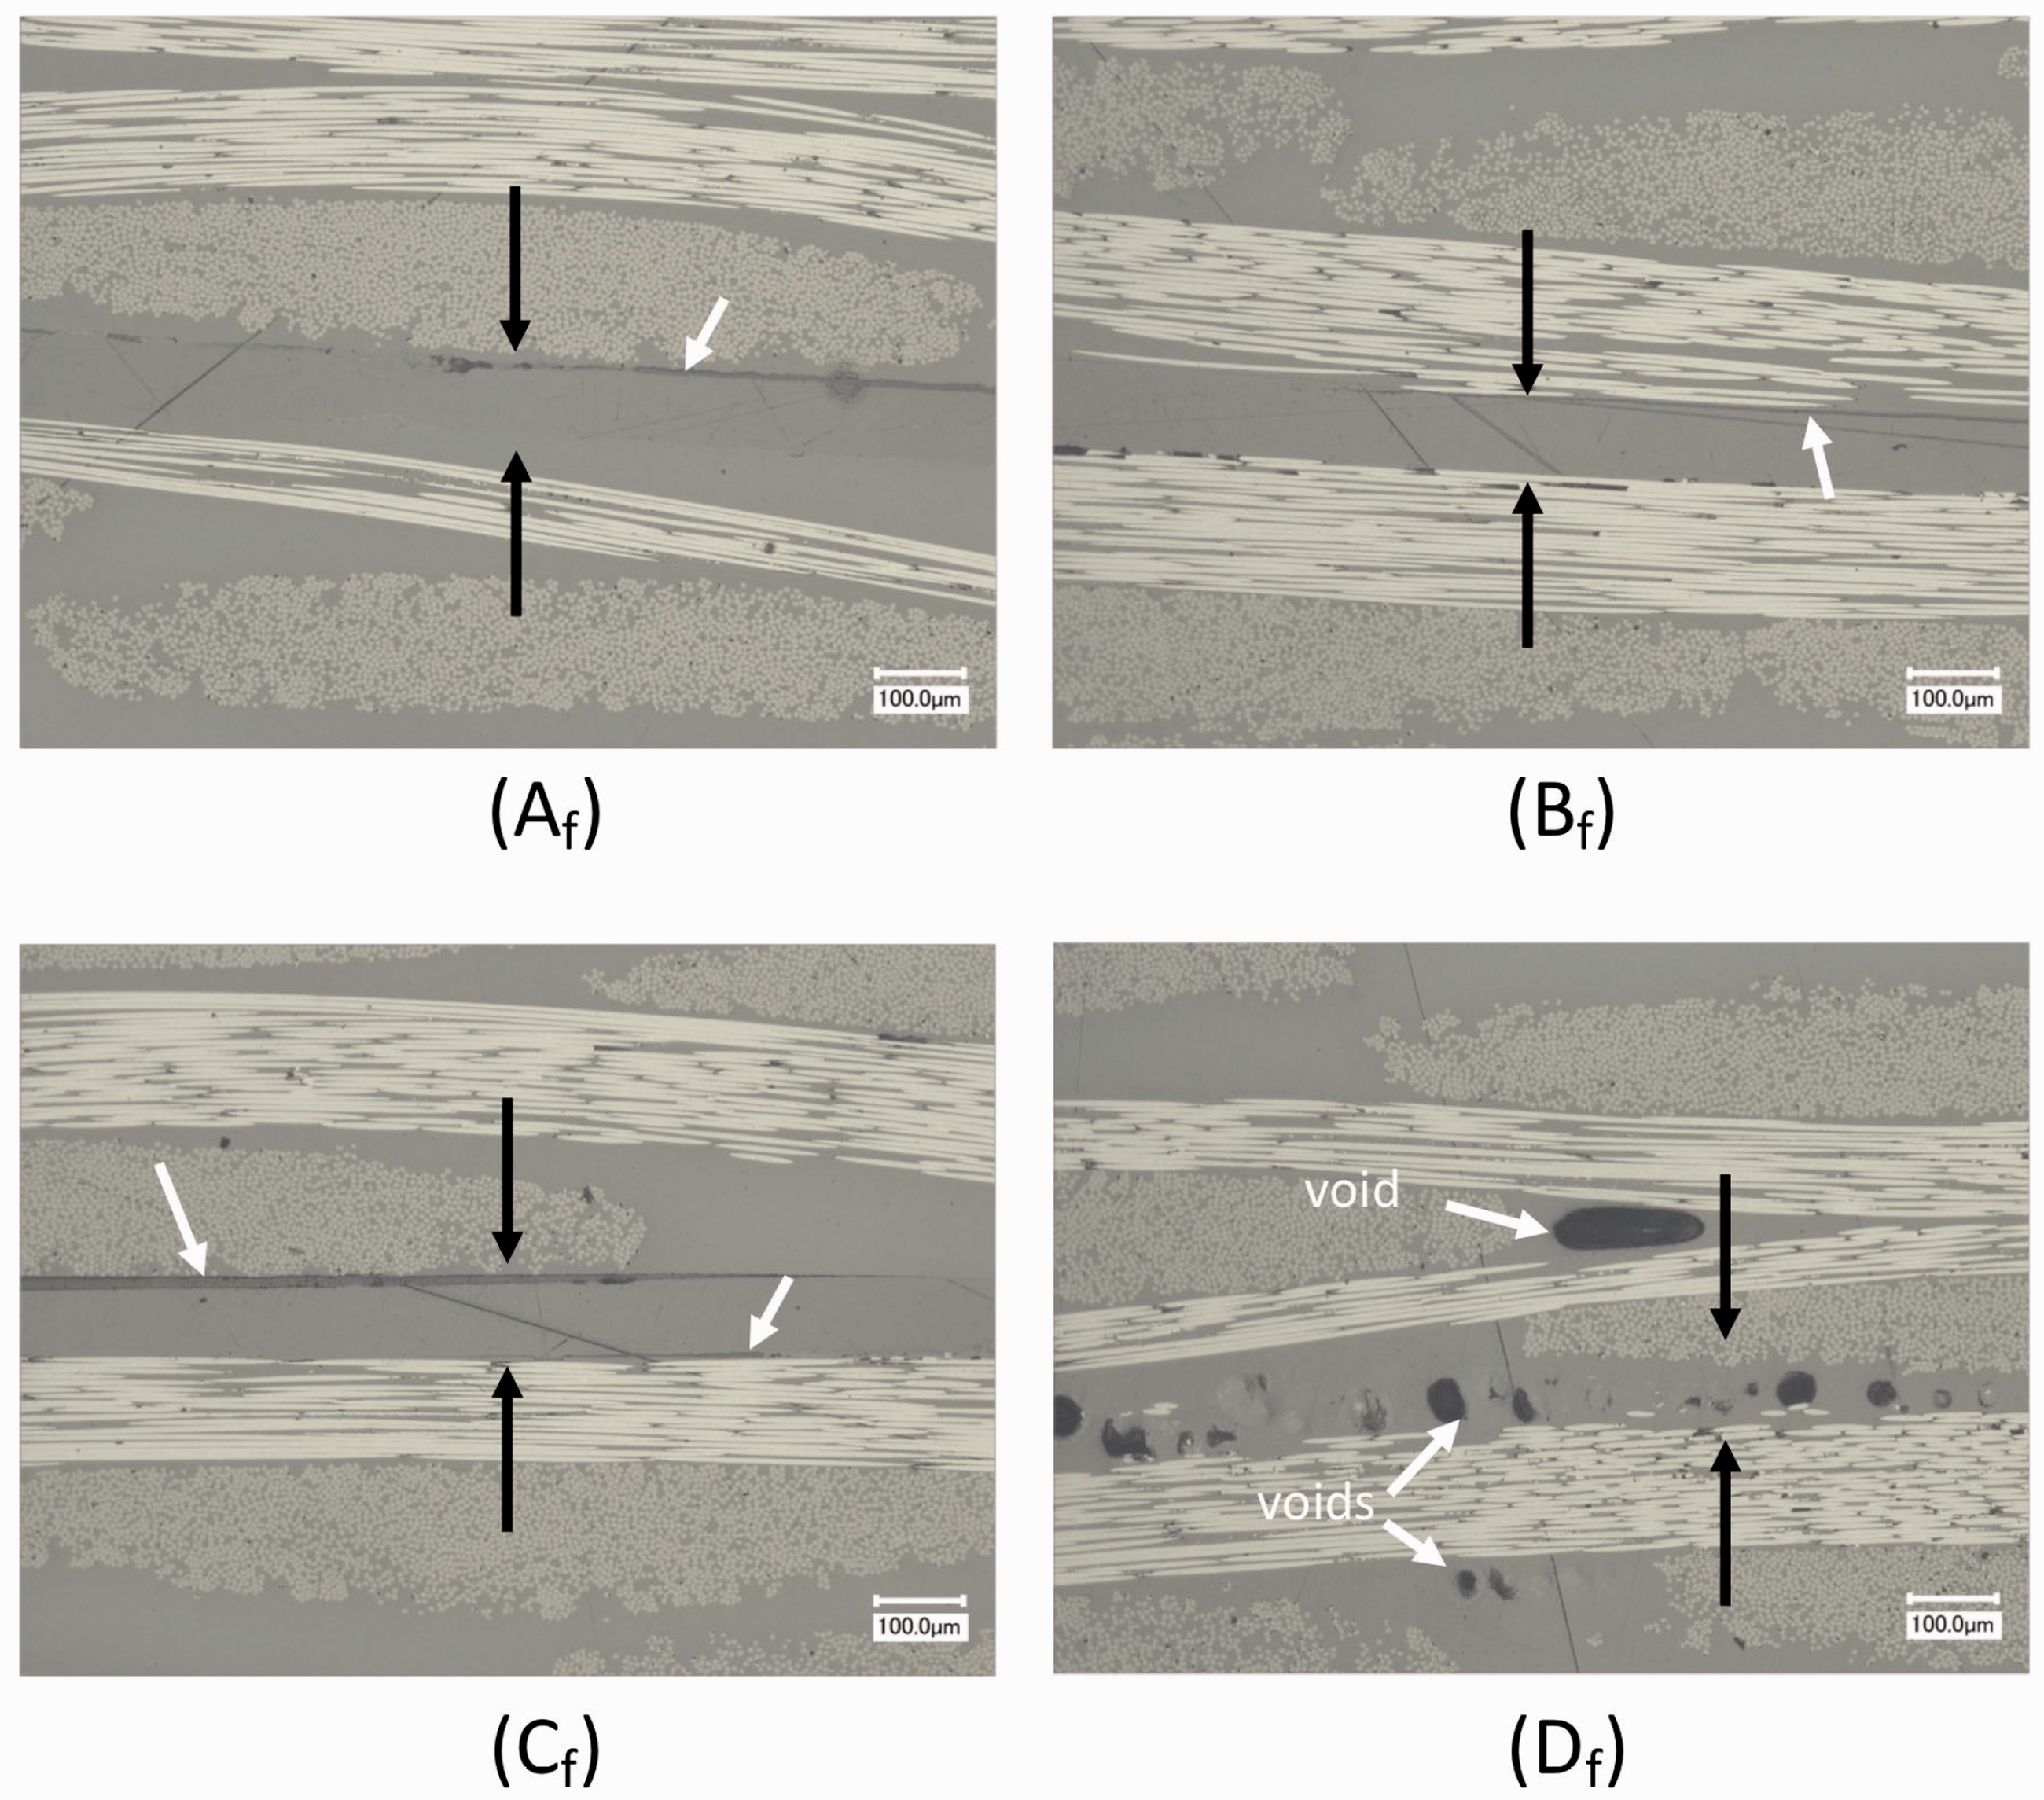
Representative micrographs of weld line made with the mesh. The micrographs have been taken during the welding process at moments A
m
, B
m
, C
m
, and D
m
, indicated in Figure 7(a). The black arrows indicate the location of the weld line. Representative micrographs of weld line made with a thin film energy director. The micrographs have been taken during the welding process at moments A
f
, B
f
, C
f
, and D
f
, indicated in Figure 7(b). The black arrows indicate the location of the weld line. The white arrows in C
f
highlight separations between the energy director and the adherends. The two white arrows in D
f
indicate voids.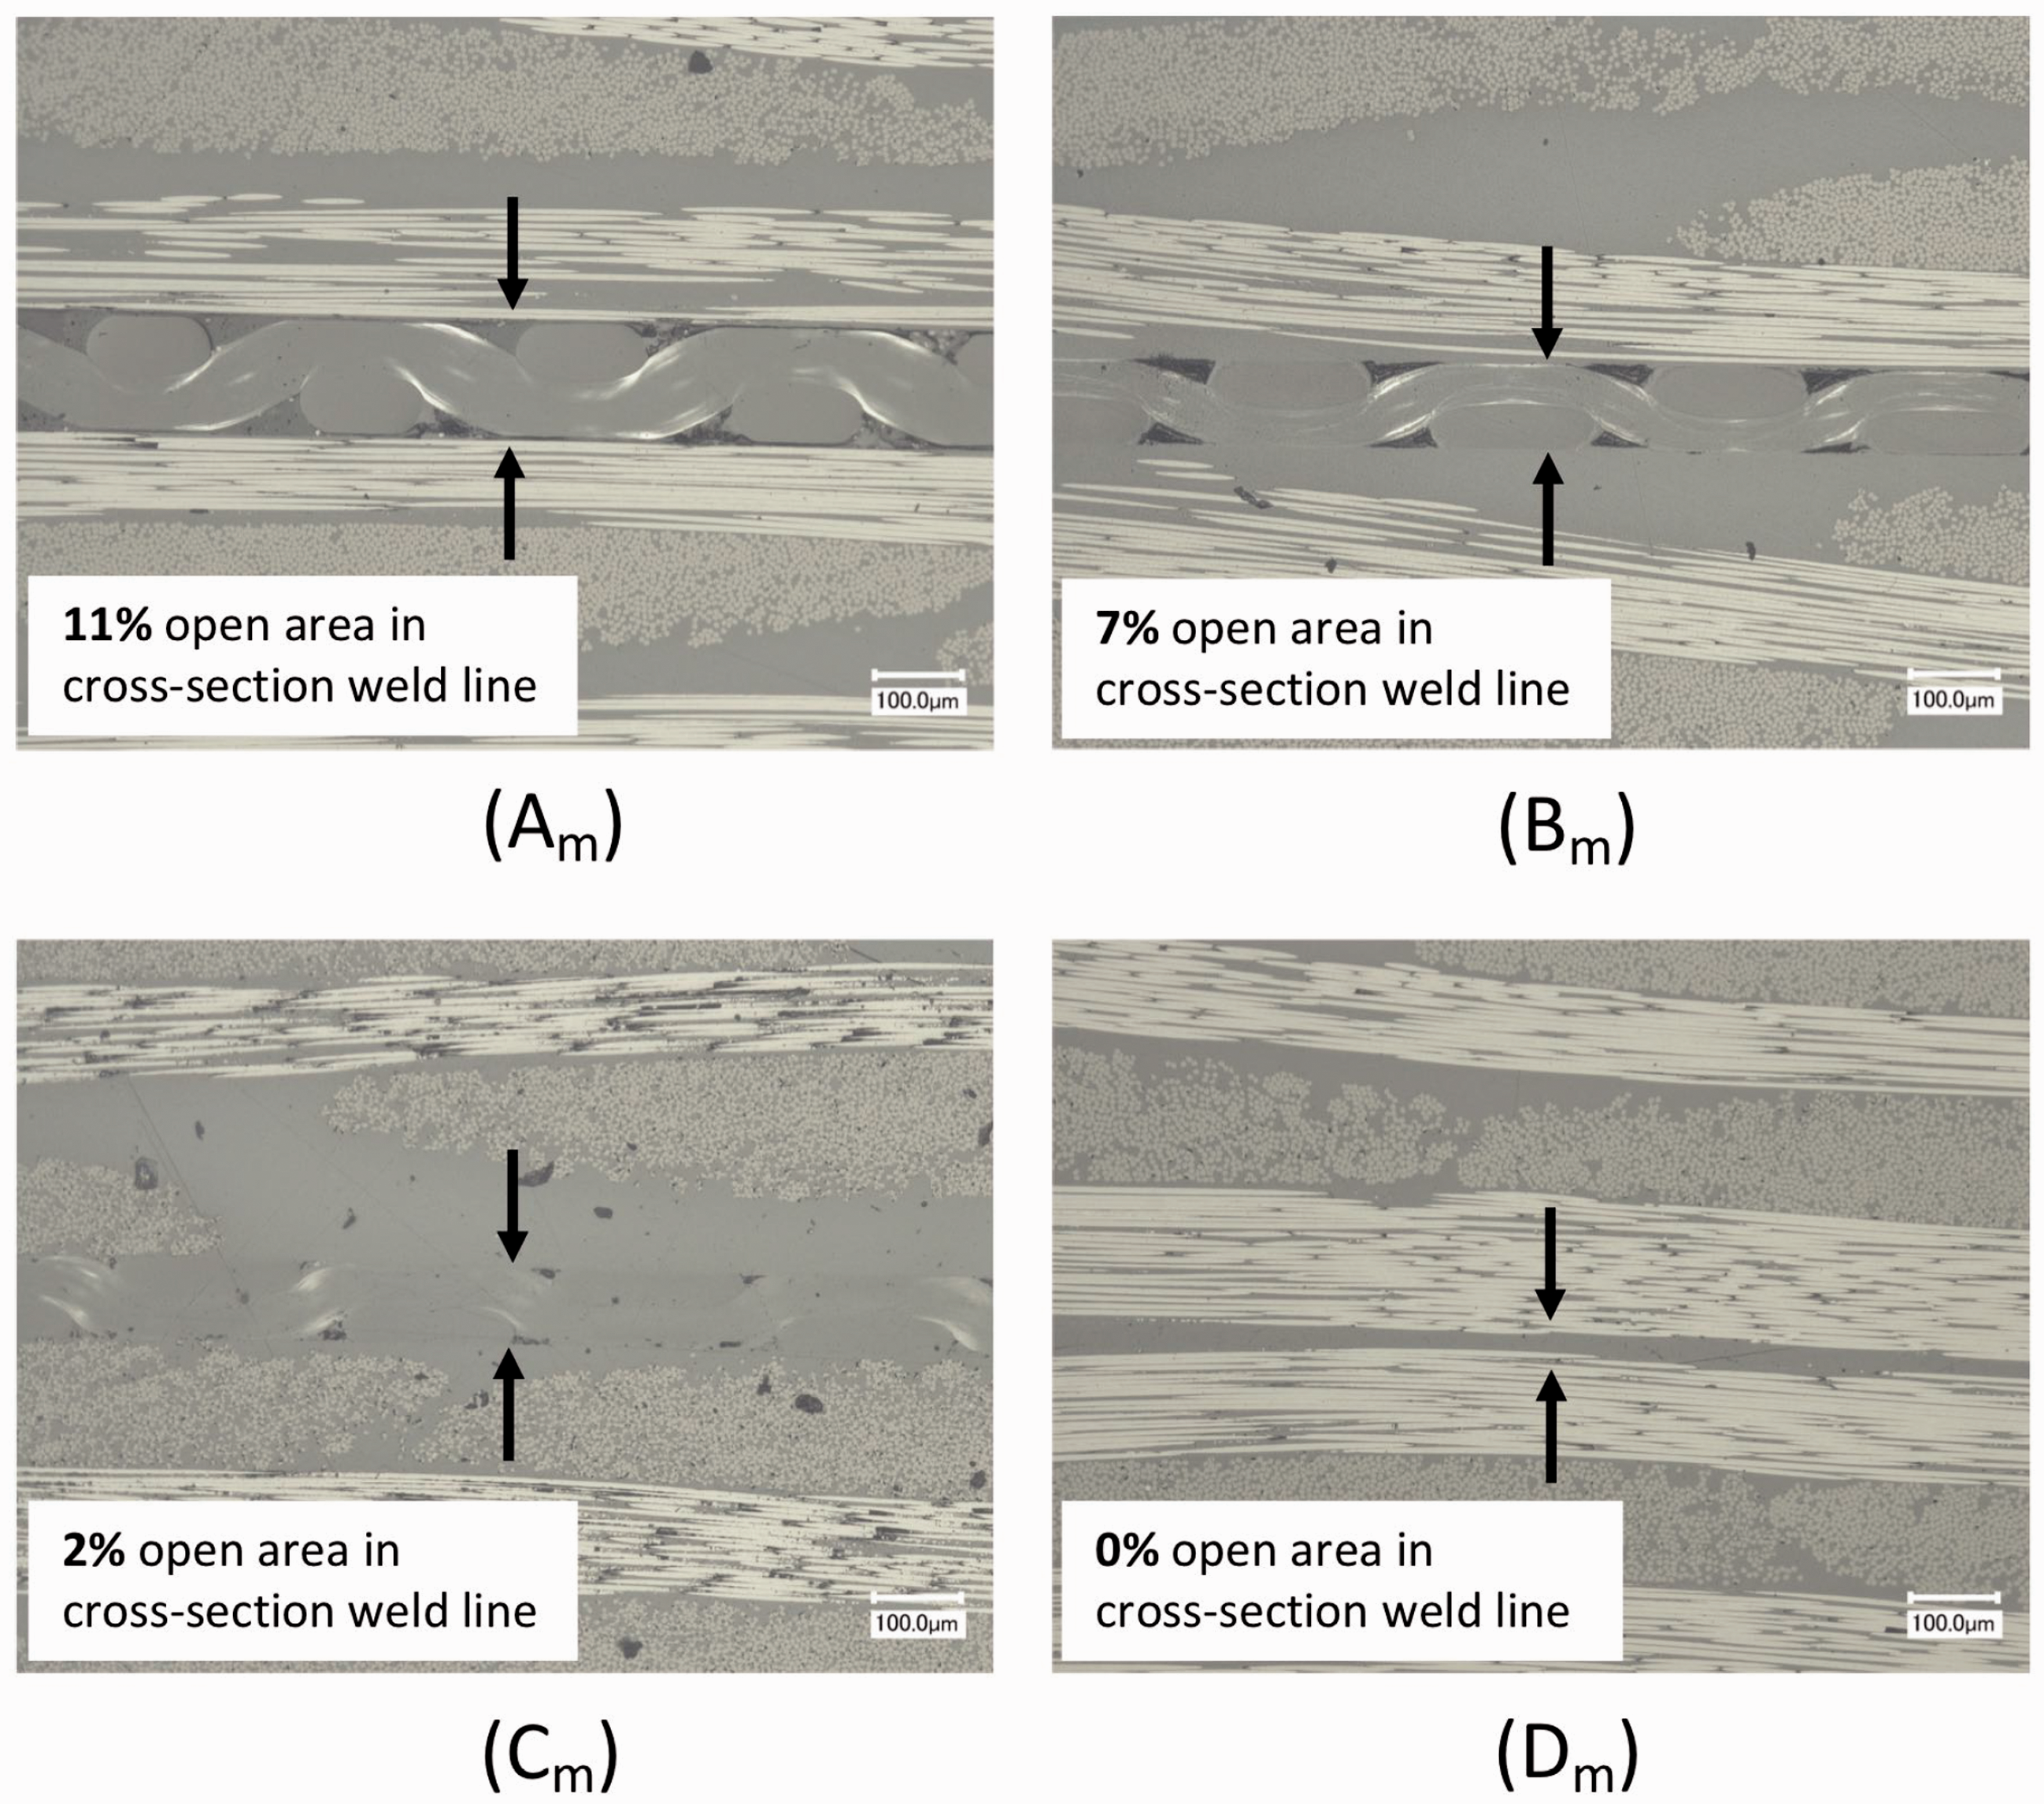
In Figure 9, it can be seen that at moment A m , the mesh filaments are partially filling up the open areas within the mesh. A small separation between the compressed mesh and the surfaces of the adherends is visible. At moment B m , the separation between the mesh and the adherends is less obvious compared to moment A m , and the open areas filled up further. At moment C m , the open areas in the mesh have almost completely been filled up by the filaments. The separation between the mesh and adherends surfaces is almost indistinguishable. The cross-sectional micrograph at moment D m shows that all open areas within the mesh have been filled with the polymer from the filaments, and the weld line thickness is close to zero.
From the micrographs at moments A f , B f , and C f as shown in Figure 10, it becomes clear that areas of contact and areas with separations between the thin film energy director and the adherends are present next to each other. The weld line thickness at moments A f , B f , and C f also remains approximately constant at 85 µm, which is approximately the same thickness as the pristine energy director. In the micrograph obtained at moment D f , no clear separations are observed between the energy director and the adherends. However, voids can be observed in the weld line and in between the first and second composite layers.
Figure 11 shows the LSS of samples welded at the different moments defined in Figure 7 of the welding process for the mesh and thin film energy director. Samples welded with the mesh energy director at moment A
m
have a strength of 1.0 MPa. The strength increases to 5.9 MPa for samples welded at moment B
m
and to 16.2 MPa at moment C
m
until the strength of 35.4 MPa is reached at moment D
m
.
Lap shear strength at moments A
x
, B
x
, and C
x
as defined in Figures 7(a) and 7(b) and at the end of the displacement plateau at an energy control value of 600 J, (D
m
and D
f
) for the mesh and thin film energy director. Each bar gives the average LSS and standard deviation of three samples.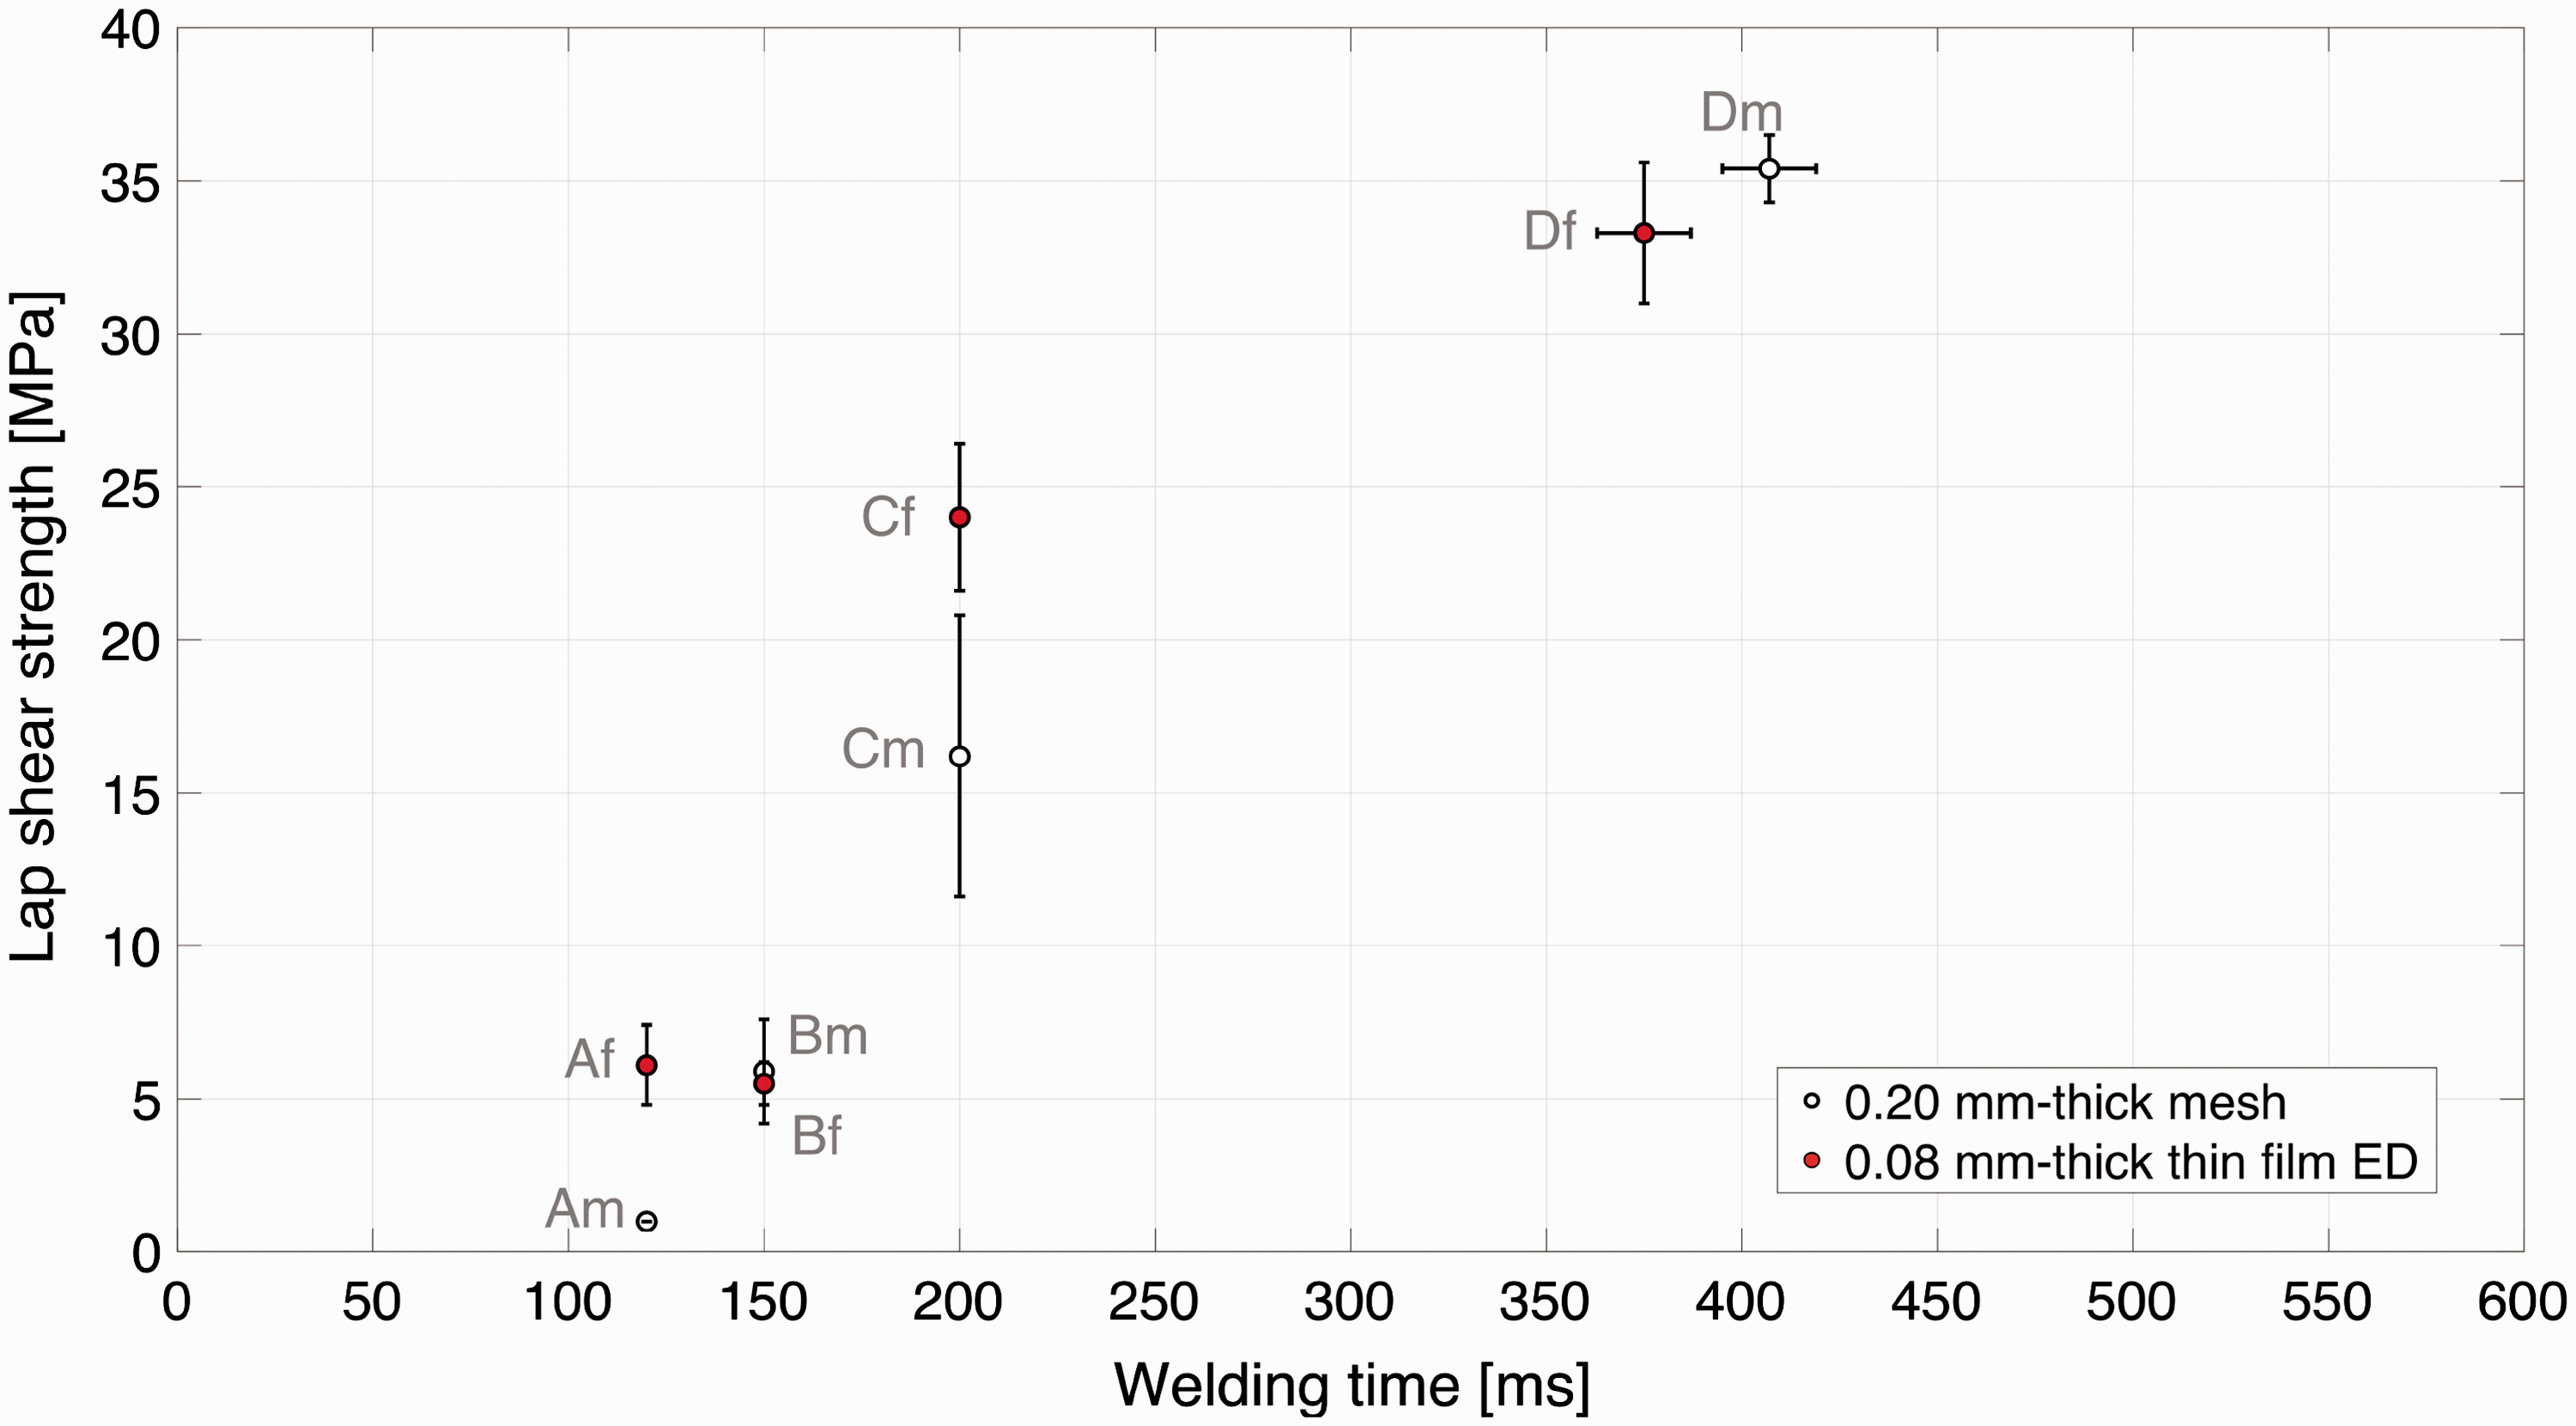
For the thin film energy director, a strength of 6.1 MPa is obtained for samples welded at moment A f . The strength stays approximately the same at moment B f . At moment C f , the strength increases again to 24 MPa, until a strength of 33.3 MPa is reached at moment D f at the end of the displacement plateau.
In Figure 12, two representative fracture surfaces are shown after single lap shear testing of samples welded with the mesh energy director (Figure 12(a)) and the thin film energy director (Figure 12(b)). They are welded at the end of the displacement plateau (at D
x
). The fracture surface obtained with the mesh energy director is very uniform in quality without any intact energy director. The fracture surface obtained with the thin film energy director contains an area with intact energy director.
Representative fracture surfaces of CF/PPS samples welded at the conditions for the highest strength with 600 J for the mesh energy director (a) and for the thin film energy director (b). The white arrow in (b) indicates a part of intact energy director.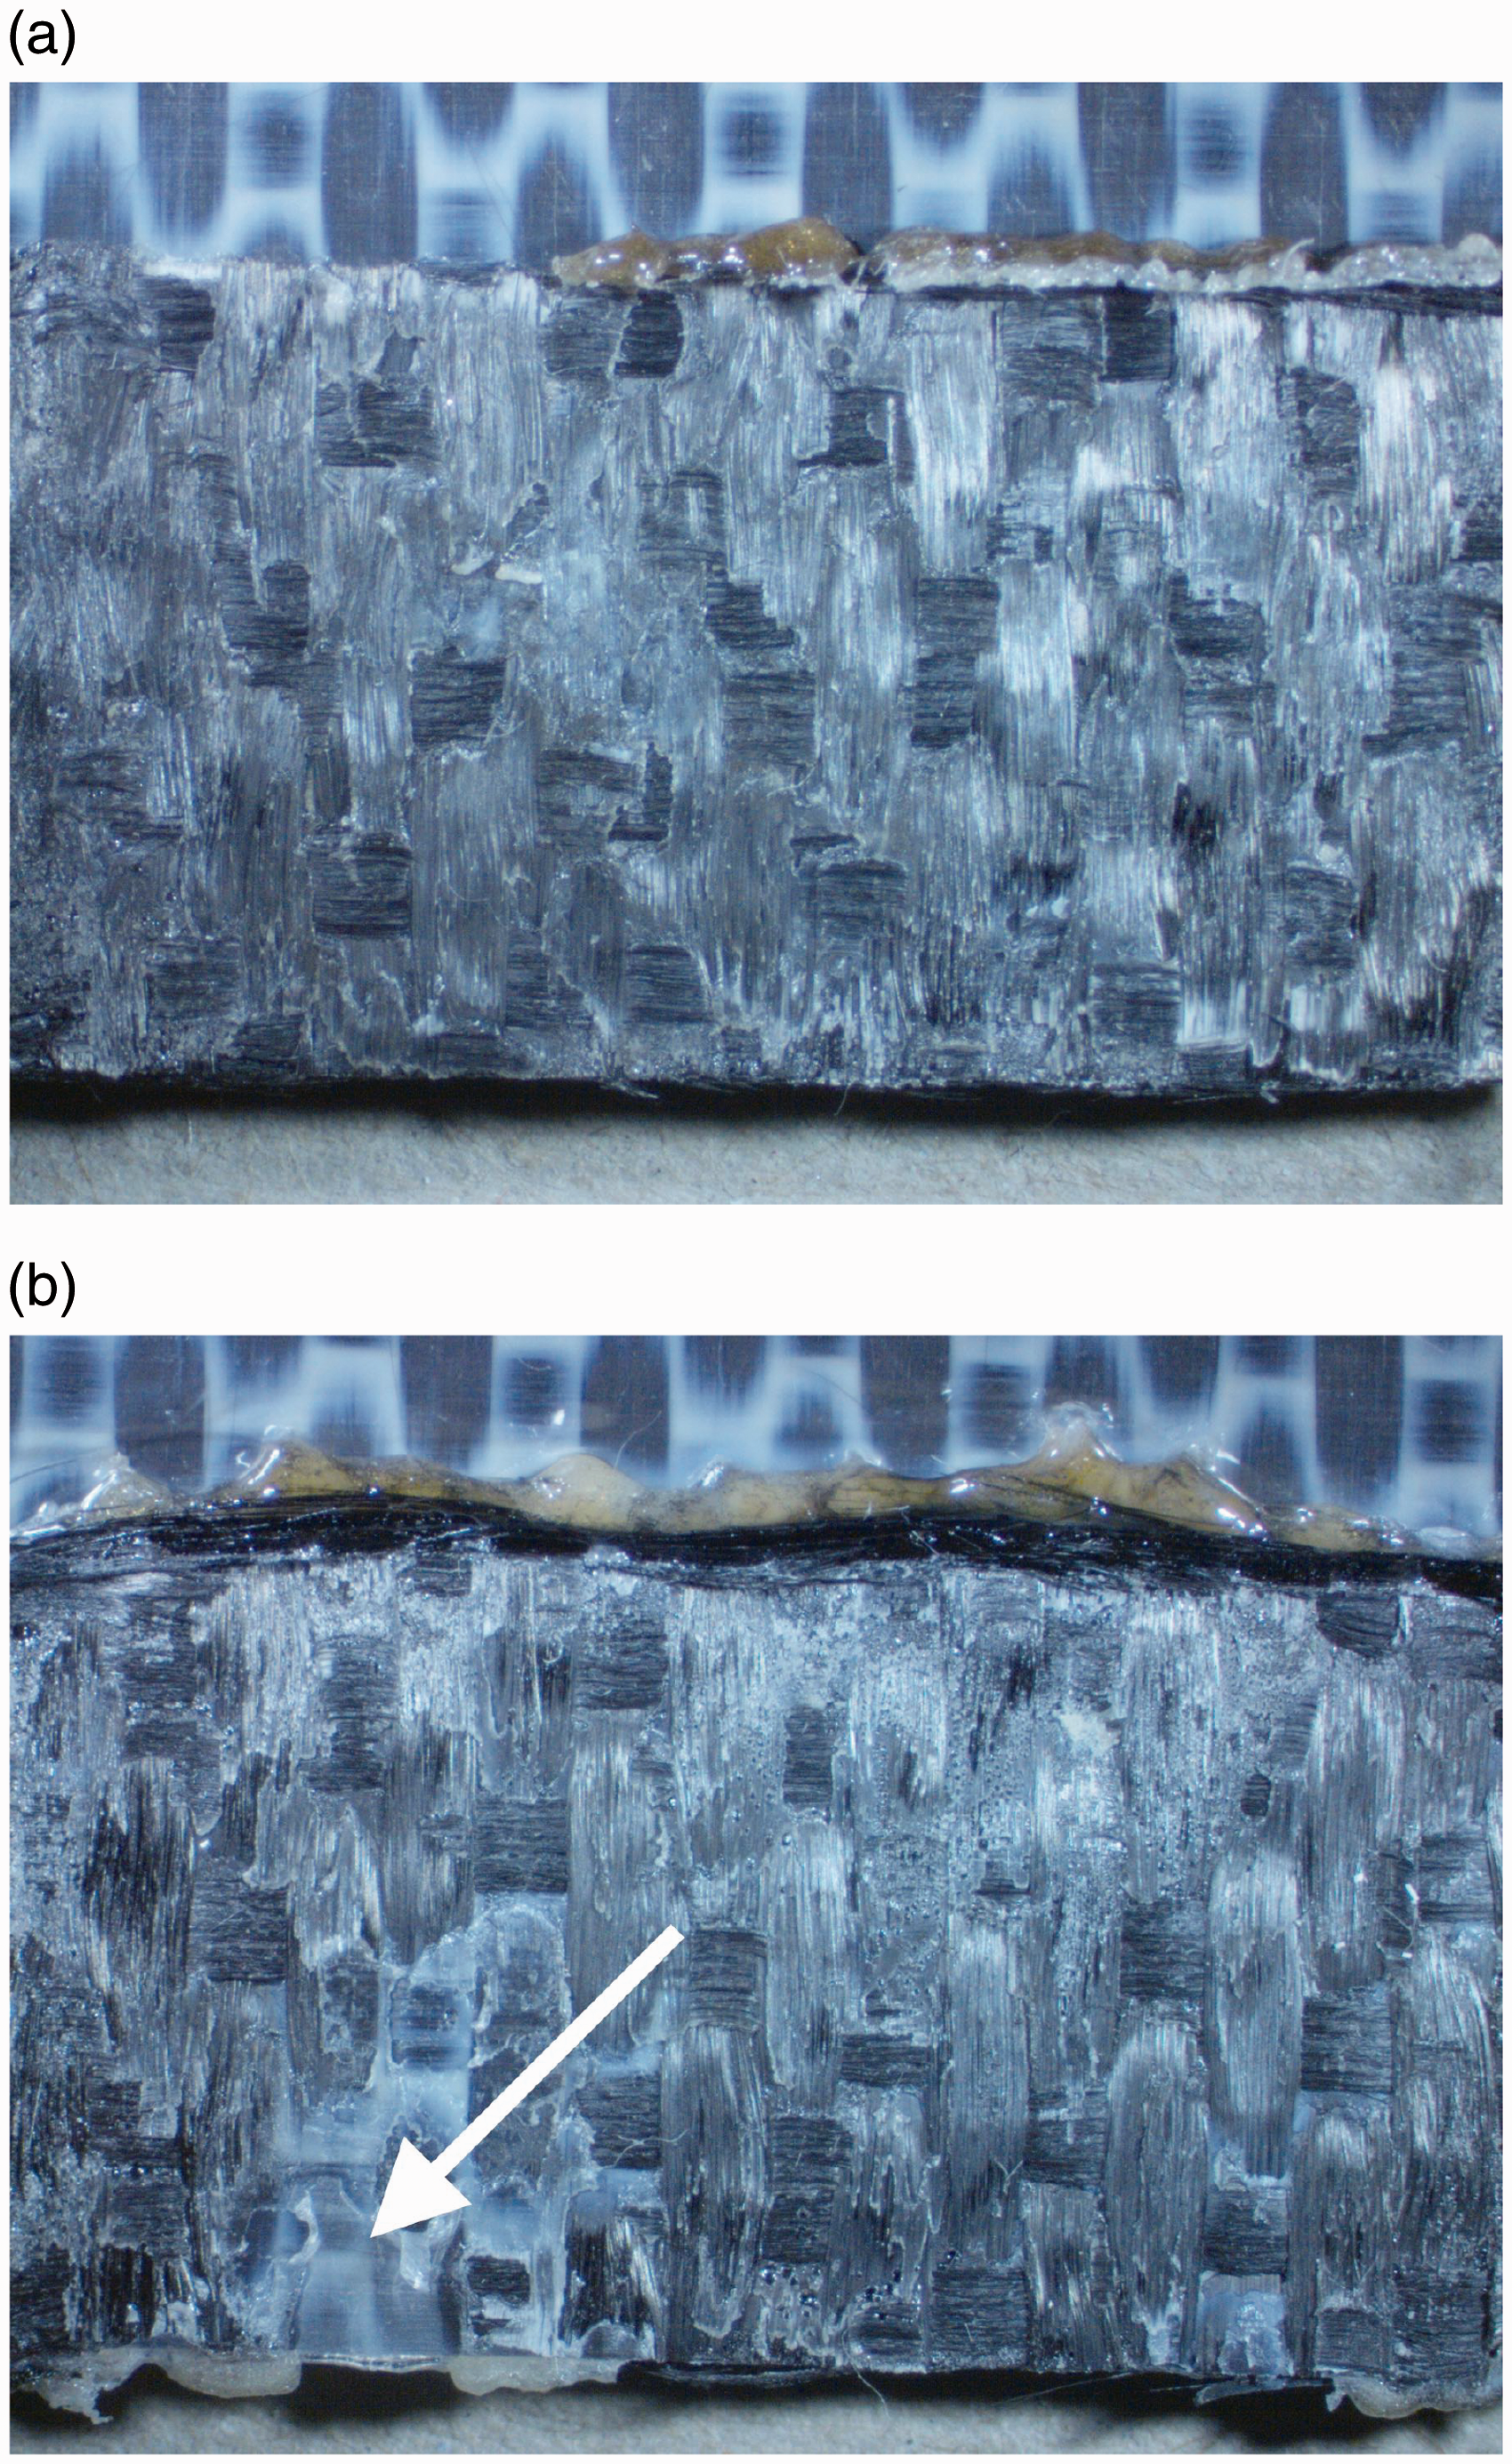
Discussion
To understand how the more compliant mesh energy director improves the weld uniformity compared to the thin film energy director, the evolution of contact between the energy directors and the adherends and the strength development is studied. Understanding the evolution of contact between the energy director and adherends is important, because it is not possible to establish a weld at the locations where the energy director and the adherends do not come in contact with each other. As mentioned in the introduction, a more compliant energy director would undergo a bigger deformation under the force applied by the sonotrode, which would promote a better contact with the adherends, and hence, improved wetting of the interface. 14 For the mesh energy director, it is found that first the filament crossings of the mesh come in contact with the adherends, establishing multiple small areas of contact that are uniformly distributed across the entire overlap. These small areas of contact experience a relatively high static and dynamic pressure. The deformation of the mesh is therefore initially targeted at the areas of contact as shown in Figure 8, flattening the mesh filaments, which can be seen in Figure 7(a) as the initial increase in displacement before the displacement plateau. The mesh filaments then expand within the open areas, as shown in Figure 9, further increasing the contact area between the energy director and the adherends, wetting the entire interface. It is also believed that due to the uniform deformation of the mesh, the air present in the mesh can pass through the mesh openings, and hence, would not contribute to the void content in the interface.
Contrarily, for the thin film energy director, the contact between the energy director and the adherends does not seem to improve during the welding process. The absence of a downward sonotrode displacement during the welding process until moment D f indicates that no flattening of the thin film energy director occurs, which prevents a good contact between the energy director and the adherends or prevents full wetting of the adherend surfaces. In Figure 10, the contact between the energy director and the adherends seems random and does not seem to improve over time.
The strength development of the lap shear samples statically welded with the mesh and the thin film energy director is also found to be different. At the start of the displacement plateau (moment A m ), only a strength of 1.0 MPa is found for the samples welded with the mesh energy director, while at the same moment (A f ), the samples welded with the thin film energy director already exhibit a strength of 6.1 MPa. The absence of strength at the start of the displacement plateau for the mesh energy director indicates that not sufficient heat has been generated in the adherends and transferred to the adherends to melt them, which most likely means that the heat generation is mainly focused at the energy director itself. This is supported by the fact that the filaments of the mesh prior to the displacement are clearly deformed.
The explanation why some strength is already generated early in the welding process for the thin film energy director has been explained by Palardy and Villegas. 8 They discussed that for thin energy directors, the energy director and the adherends generate heat faster and simultaneously. The hotter adherends reduce the heat transfer from the interface to the adherends, which in our case most likely causes the generation of voids observed between the 1st and 2nd layers of the adherends in Figure 10 at moment D f .
The LSS values of the samples welded with both energy directors increase during the welding process towards moment D. The 6% higher strength obtained with the mesh energy director as compared to the thin film energy director can be explained by the fact that no unwelded areas were present for the mesh energy director as shown in Figure 12(a), while in the case where the thin film energy director is used, still unwelded areas with intact energy director are present as shown in Figure 12(b). The cross-sectional micrograph of the weld made with the thin film energy director in Figure 10 also displayed porosity at moment D f , which most likely indicates overheating of the adherends and the interface. The unwelded areas and the porosity are also most likely responsible for the increase in scatter at the maximum obtained LSS (D f ) as can be seen in Figure 11.
Conclusions
The goal of this study was to improve the weld uniformity in continuous ultrasonically welded joints of thermoplastic composites by using a more compliant energy director. A woven polymer mesh energy director was introduced and compared to the current state-of-the-art thin film energy director. It was found that the mesh energy director significantly improved the weld uniformity and LSS. An average LSS of 33.7 ± 2.4 MPa was obtained for the mesh energy director, compared to 18.8 ± 6.2 MPa for the thin film energy director. To understand the behavior of the mesh during the welding process, static welding was used. The main observations on the welding process with the mesh energy director compared to the thin film energy director are the following:
The filament crossings of the mesh energy director, uniformly present all over the joint, directly come in contact with the adherends. While for the thin low-compliant film energy director, the contact with the adherends seems to be more random. The filaments flatten early in the process, and the contact between the mesh and the adherends gradually improves during the welding process by deforming the filaments and filling up the open areas within the mesh. This resulted in a good contact between the energy director and the adherends and a good wetting of the interface. For the thin film energy director, on the other hand, no flattening takes place during the welding process, and the absence of downward sonotrode displacement prevents improvement in contact and wetting.
In conclusion, the flattening of the mesh filaments initiated at the uniformly distributed filament crossings early in the welding process, and the gradual increase in contact between the mesh energy director and the adherends during the displacement plateau ensures a good contact between the energy director and the adherends over the entire interface. This good contact leads to a fully wetted and uniformly welded area. We believe that the behavior of the mesh with the high compliance, as explained above, improved the quality of continuous ultrasonically welded joints significantly. Therefore, it can be expected that energy directors in the form of woven polymer meshes will play an important role in the development of CUW. We believe that this study is a first step towards new studies to optimize the geometry of energy directors to improve the wetting of the surface and to further understand the heat transfer from the ED to the adherends.
Footnotes
Declaration of Conflicting Interests
The author(s) declared no potential conflicts of interest with respect to the research, authorship, and/or publication of this article.
Funding
The author(s) disclosed receipt of the following financial support for the research, authorship, and/or publication of this article: This study was funded by the European research program Clean Sky. The ecoTECH project has received funding from the European Unions Horizon 2020 Clean Sky 2 Joint Undertaking under the AIRFRAME ITD grant agreement 807083.